Extreme Trend Reversal Points [HeWhoMustNotBeNamed]Using moving average crossover for identifying the change in trend is very common. However, this method can give lots of false signals during the ranging markets. In this algorithm, we try to find the extreme trend by looking at fully aligned multi-level moving averages and only look at moving average crossover when market is in the extreme trend - either bullish or bearish. These points can mean long term downtrend or can also cause a small pullback before trend continuation. In this discussion, we will also check how to handle different scenarios.
🎲 Components
🎯 Recursive Multi Level Moving Averages
Multi level moving average here refers to applying moving average on top of base moving average on multiple levels. For example,
Level 1 SMA = SMA(source, length)
Level 2 SMA = SMA(Level 1 SMA, length)
Level 3 SMA = SMA(Level 2 SMA, length)
..
..
..
Level n SMA = SMA(Level (n-1) SMA, length)
In this script, user can select how many levels of moving averages need to be calculated. This is achieved through " recursive moving average " algorithm. Requirement for building such algorithm was initially raised by @loxx
While I was able to develop them in minimal code with the help of some of the existing libraries built on arrays and matrix , I also thought why not extend this to find something interesting.
Note that since we are using variable levels - we will not be able to plot all the levels of moving average. (This is because plotting cannot be done in the loop). Hence, we are using lines to display the latest moving average levels in front of the last candle. Lines are color coded in such a way that least numbered levels are greener and higher levels are redder.
🎯 Finding the trend and range
Strength of fully aligned moving average is calculated based on position of each level with respect to other levels.
For example, in a complete uptrend, we can find
source > L(1)MA > L(2)MA > L(3)MA ...... > L(n-1)MA > L(n)MA
Similarly in a complete downtrend, we can find
source < L(1)MA < L(2)MA < L(3)MA ...... < L(n-1)MA < L(n)MA
Hence, the strength of trend here is calculated based on relative positions of each levels. Due to this, value of strength can range from 0 to Level*(Level-1)/2
0 represents the complete downtrend
Level*(Level-1)/2 represents the complete uptrend.
Range and Extreme Range are calculated based on the percentile from median. The brackets are defined as per input parameters - Range Percentile and Extreme Range Percentile by using Percentile History as reference length.
Moving average plot is color coded to display the trend strength.
Green - Extreme Bullish
Lime - Bullish
Silver - range
Orange - Bearish
Red - Extreme Bearish
🎯 Finding the trend reversal
Possible trend reversals are when price crosses the moving average while in complete trend with all the moving averages fully aligned. Triangle marks are placed in such locations which can help observe the probable trend reversal points. But, there are possibilities of trend overriding these levels. An example of such thing, we can see here:
In order to overcome this problem, we can employ few techniques.
1. After the signal, wait for trend reversal (moving average plot color to turn silver) before placing your order.
2. Place stop orders on immediate pivot levels or support resistance points instead of opening market order. This way, we can also place an order in the direction of trend. Whichever side the price breaks out, will be the direction to trade.
3. Look for other confirmations such as extremely bullish and bearish candles before placing the orders.
🎯 An example of using stop orders
Let us take this scenario where there is a signal on possible reversal from complete uptrend.
Create a box joining high and low pivots at reasonable distance. You can also chose to add 1 ATR additional distance from pivots.
Use the top of the box as stop-entry for long and bottom as stop-entry for short. The other ends of the box can become stop-losses for each side.
After few bars, we can see that few more signals are plotted but, the price is still within the box. There are some candles which touched the top of the box. But, the candlestick patterns did not represent bullishness on those instances. If you have placed stop orders, these orders would have already filled in. In that case, just wait for position to hit either stop or target.
For bullish side, targets can be placed at certain risk reward levels. In this case, we just use 1:1 for bullish (trend side) and 1:1.5 for bearish side (reversal side)
In this case, price hit the target without any issue:
Wait for next reversal signal to appear before placing another order :)
Hewhomustnotbenamed

Micro ZigzagMicro zigzag is created based on similar concepts as that of zigzag but by using lower timeframe intra-bar data. The lines join candle's high/low points but also depict how the price movement within the candle happened. That is, if the high of the candle is reached first, pivot from previous candle join the high first and then low and vice versa.
The output can also be viewed as advanced line chart.
🎲 Process
🎯 For every bar identify whether high came first or low by using lower timeframe data.
🎯 If high came before low, add high as high pivot first and then low as low pivot. If otherwise, add low as lower pivot first and then high as higher pivot.
🎯 When adding pivot, check if the last pivot is in the same direction as the new one. If yes, replace existing pivot if the new one goes beyond it. Ignore otherwise.
🎯 If the last pivot is of different direction as that one new one, then simple add the new pivot.

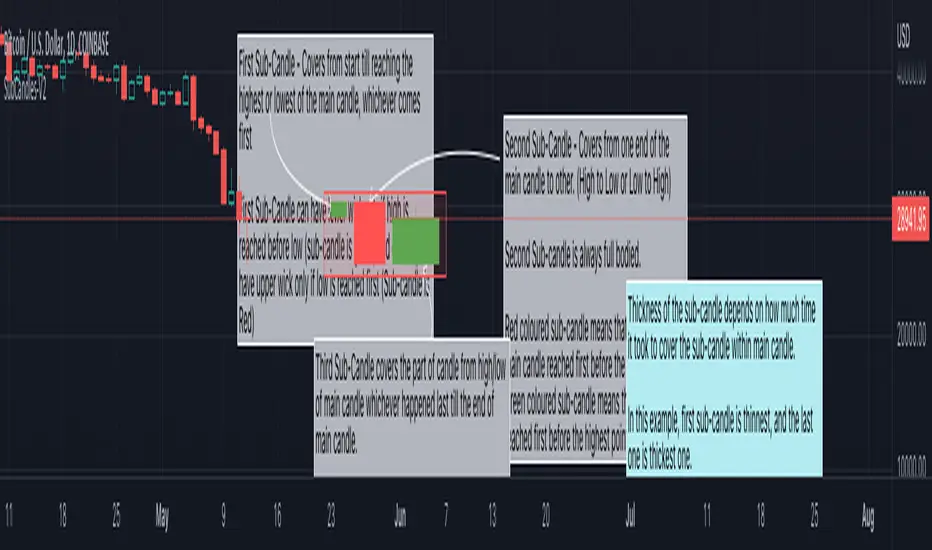
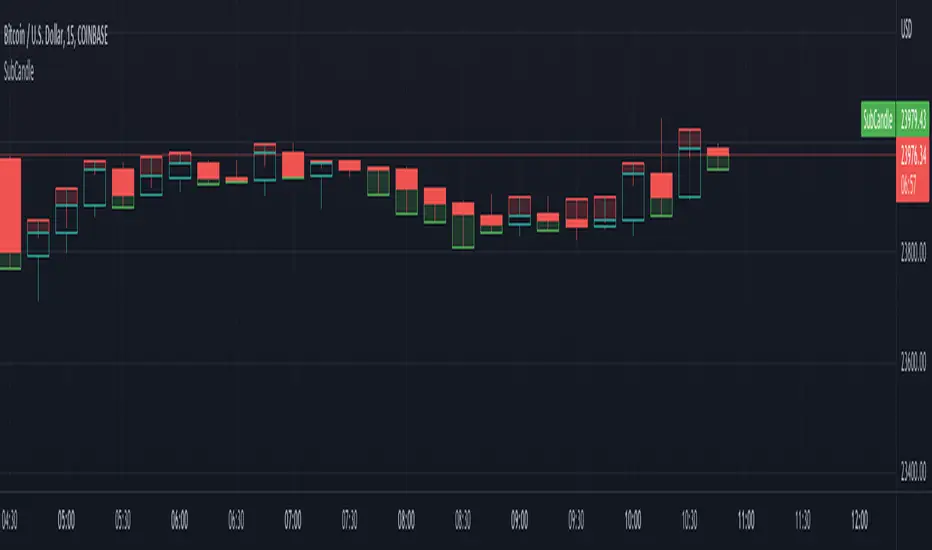
SubCandles-V2Further development on the sub-candle concept defined in the earlier script. SubCandle
This time instead of concentrating only on the last part, we are dividing the main candle into three parts.
First Sub-Candle - Covers the candle movement from open to first of highest/lowest point. First sub-candle tells how fast/slow the initial movement took place and which direction it went.
Second Sub-Candle - Is always a full bodied candle. Most important think here is the thickness of the sub-candle which tells how quickly or slowly the price went from one side of the peak to other.
Third Sub-Candle - Similar to first sub-candle but covers the last part. This part is similar to what we are depicting in the earlier version of Sub-Candle script.
Thickness of the sub-candle is based on relatively how much time each sub-candle took to complete within the main candle. Few interpretation can be:
If the first or third sub-candle are the thicker ones and if the thicker sub-candle has long wick, then it may mean strong rejection.
If the first or third sub-candle are thicker ones and if the thicker sub-candle has full body, it may mean higher volatility within the sub-candle.
If the second sub-candle is thicker than the rest - it can mean strong bias towards the direction of second sub-candle
Thinner second sub-candle may mean a dump/pump. May need to check third sub-candle to see if the dump/pump are followed by pump/dump
Also adding the screen shot reference below.
Note: This can repaint within bar. Use it as part of bar replay. Will try to add more option to select a particular candle without bar reply soon
Let me know what you think?
SubCandleI created this script as POC to handle specific cases where not having tick data on historical bars create repainting. Happy to share if this serves purpose for other coders.
What is the function of this script?
Script plots a sub-candle which is remainder of candle after forming the latest peak.
Higher body of Sub-candle refers to strong retracement of price from its latest peak. Color of the sub-candle defines the direction of retracement.
Higher wick of Sub-candle refers to higher push in the direction of original candle. Meaning, after price reaching its peak, price retraced but could not hold.
Here is a screenshot with explanation to visualise the concept:
Settings
There is only one setting which is number of backtest bars. Lower timeframe resolution which is used for calculating the Sub-candle uses this number to automatically calculate maximum possible lower timeframe so that all the required backtest windows are covered without having any issue.
We need to keep in mind that max available lower timeframe bars is 100,000. Hence, with 5000 backtest bars, lower timeframe resolution can be about 20 (100000/5000) times lesser than that of regular chart timeframe. We need to also keep in mind that minimum resolution available as part of security_lower_tf is 1 minute. Hence, it is not advisable to use this script for chart timeframes less than 15 mins.
Application
I have been facing this issue in pattern recognition scripts where patterns are formed using high/low prices but entry and targets are calculated based on the opposite side (low/high). It becomes tricky during extreme bars to identify entry conditions based on just the opposite peak because, the candle might have originated from it before identifying the pattern and might have never reached same peak after forming the pattern. Due to lack of tick data on historical bars, we cannot use close price to measure such conditions. This leads to repaint and few unexpected results. I am intending to use this method to overcome the issue up-to some extent.
Relative Bandwidth FilterThis is a very simple script which can be used as measure to define your trading zones based on volatility.
Concept
This script tries to identify the area of low and high volatility based on comparison between Bandwidth of higher length and ATR of lower length.
Relative Bandwidth = Bandwidth / ATR
Bandwidth can be based on either Bollinger Band, Keltner Channel or Donchian Channel. Length of the bandwidth need to be ideally higher.
ATR is calculated using built in ATR method and ATR length need to be ideally lower than that used for calculating Bandwidth.
Once we got Relative Bandwidth, the next step is to apply Bollinger Band on this to measure how relatively high/low this value is.
Overall - If relative bandwidth is higher, then volatility is comparatively low. If relative bandwidth is lower, then volatility is comparatively high.
Usage
This can be used with your own strategy to filter out your non-trading zones based on volatility. Script plots a variable called "Signal" - which is not shown on chart pane. But, it is available in the data window. This can be used in another script as external input and apply logic.
Signal values can be
1 : Allow only Long
-1 : Allow only short
0 : Do not allow any trades
2 : Allow both Long and Short

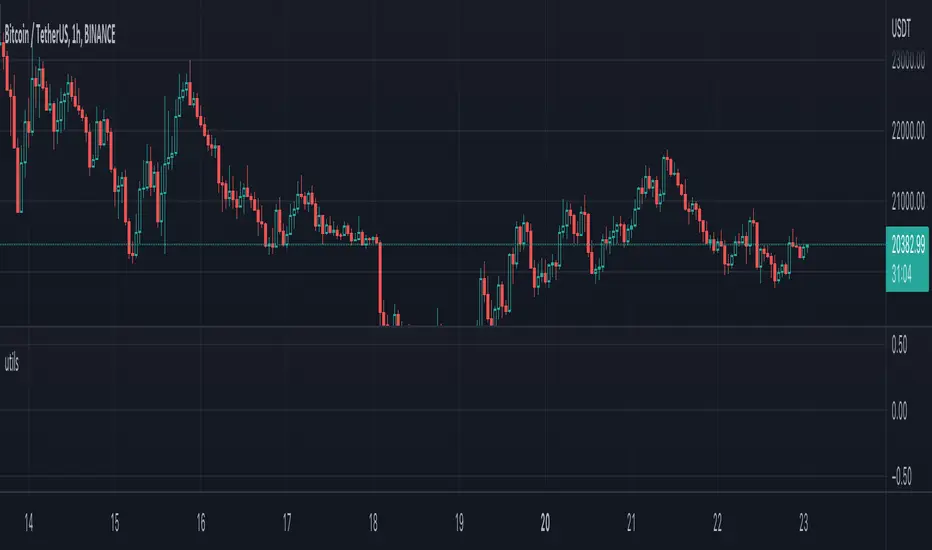
utilsLibrary "utils"
Few essentials captured together (subset of arrayutils)
timer(timeStart, endTime)
finds difference between two timestamps
Parameters:
timeStart : start timestamp
endTime : end timestamp
Returns:
check_overflow(pivots, barArray, dir)
finds difference between two timestamps
Parameters:
pivots : pivots array
barArray : pivot bar array
dir : direction for which overflow need to be checked
Returns: bool overflow
get_trend_series(pivots, length, highLow, trend)
finds series of pivots in particular trend
Parameters:
pivots : pivots array
length : length for which trend series need to be checked
highLow : filter pivot high or low
trend : Uptrend or Downtrend
Returns: int trendIndexes
get_trend_series(pivots, firstIndex, lastIndex)
finds series of pivots in particular trend
Parameters:
pivots : pivots array
firstIndex : First index of the series
lastIndex : Last index of the series
Returns: int trendIndexes
getConsolidatedLabel(include, labels, separator)
Consolidates labels into single string by concatenating it with given separator
Parameters:
include : array of conditions to include label or not
labels : string array of labels
separator : Separator for concatenating labels
Returns: string labelText
getColors(theme)
gets array of colors based on theme
Parameters:
theme : dark or light theme
Returns: color themeColors
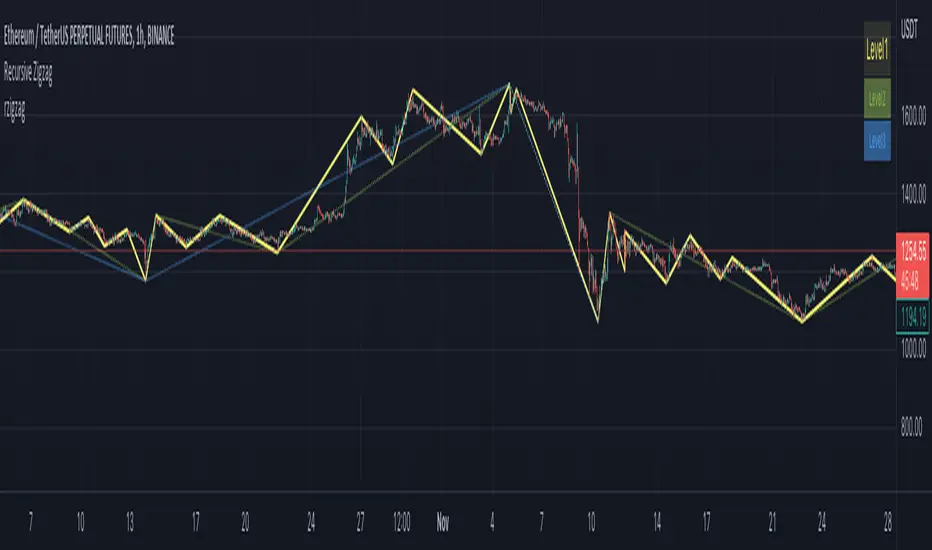
rzigzagLibrary "rzigzag"
Recursive Zigzag Using Matrix allows to create zigzags recursively on multiple levels. After bit of consideration, decided to make this public.
zigzag(length, ohlc, numberOfPivots, offset)
calculates plain zigzag based on input
Parameters:
length : Zigzag Length
ohlc : Array containing ohlc values. Can also contain custom series
numberOfPivots : Number of max pivots to be returned
offset : Offset from current bar. Can be used for calculations based on confirmed bars
Returns:
nextlevel(zigzagmatrix, numberOfPivots)
calculates next level zigzag based on present zigzag coordinates
Parameters:
zigzagmatrix : Matrix containing zigzag pivots, bars, bar time, direction and level
numberOfPivots : Number of max pivots to be returned
Returns: matrix zigzagmatrix
draw(zigzagmatrix, newPivot, doublePivot, lineColor, lineWidth, lineStyle, showLabel, xloc)
draws zigzag based on the zigzagmatrix input
Parameters:
zigzagmatrix : Matrix containing zigzag pivots, bars, bar time, direction and level
newPivot : Flag indicating there is update in the pivots
doublePivot : Flag containing there is double pivot update on same bar
lineColor : Zigzag line color
lineWidth : Zigzag line width
lineStyle : Zigzag line style
showLabel : Flag to indicate display pivot labels
xloc : xloc preference for drawing lines/labels
Returns:
draw(length, ohlc, numberOfPivots, offset, lineColor, lineWidth, lineStyle, showLabel, xloc)
calculates and draws zigzag based on zigzag length and source input
Parameters:
length : Zigzag Length
ohlc : Array containing ohlc values. Can also contain custom series
numberOfPivots : Number of max pivots to be returned
offset : Offset from current bar. Can be used for calculations based on confirmed bars
lineColor : Zigzag line color
lineWidth : Zigzag line width
lineStyle : Zigzag line style
showLabel : Flag to indicate display pivot labels
xloc : xloc preference for drawing lines/labels
Returns:
drawfresh(zigzagmatrix, zigzaglines, zigzaglabels, lineColor, lineWidth, lineStyle, showLabel, xloc)
draws fresh zigzag for all pivots in the input matrix.
Parameters:
zigzagmatrix : Matrix containing zigzag pivots, bars, bar time, direction and level
zigzaglines : array to which all newly created lines will be added
zigzaglabels : array to which all newly created lables will be added
lineColor : Zigzag line color
lineWidth : Zigzag line width
lineStyle : Zigzag line style
showLabel : Flag to indicate display pivot labels
xloc : xloc preference for drawing lines/labels
Returns:
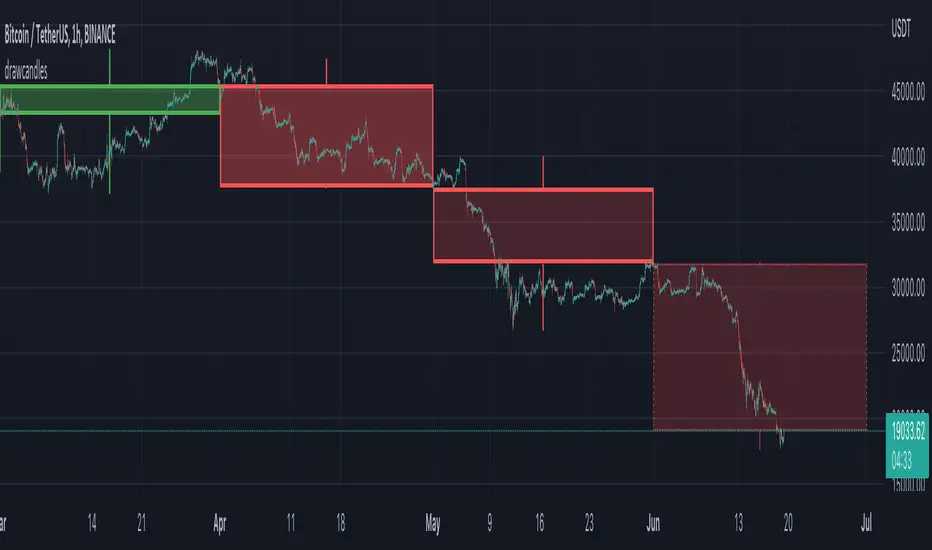
drawcandlesLibrary "drawcandles"
simple utility to draw different candles using box and lines. Quite useful for drawing candles such as zigzag candles or MTF candles
draw(o, h, l, c, oBar, cBar)
draws candles based on ohlc values
Parameters:
o : Open Price
h : High Price
l : Low Price
c : Close Price
oBar : Open Time
cBar : Close Time
Returns: void
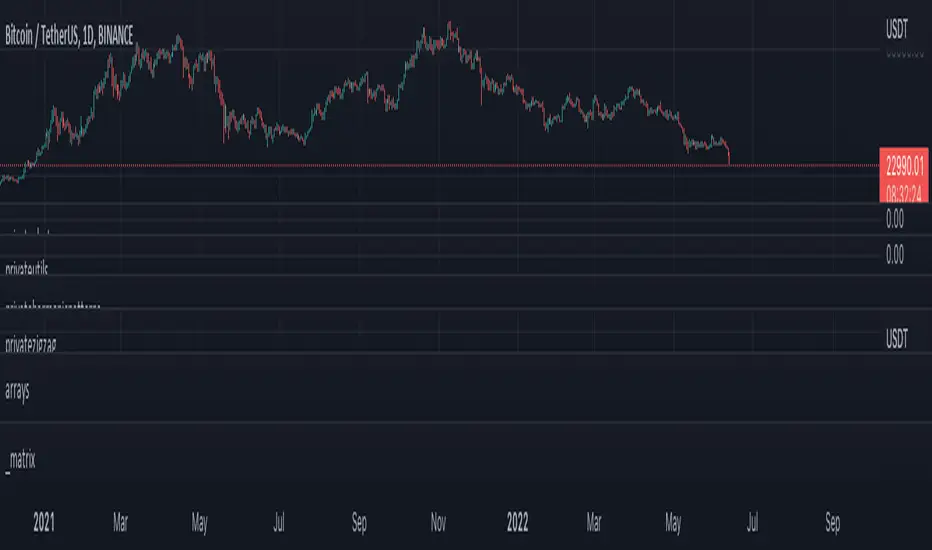
arraysLibrary "arrays"
Library contains utility functions using arrays.
delete( arr , index)
remove an item from array at specific index. Also deletes the item
Parameters:
arr: - array from which the item needs to be deleted
index: - index of item to be deleted
Returns: void
pop( arr )
remove the last item from array. Also deletes the item
Parameters:
arr: - array from which the last item needs to be removed and deleted
Returns: void
shift( arr )
remove an item from array at index 0. Also deletes the item
Parameters:
arr: - array from which the first item needs to be removed and deleted
Returns: void
unshift( arr , val, maxItems)
add an item to the beginning of an array with max items cap
Parameters:
arr: - array to which the item needs to be added at the beginning
val: - value of item which needs to be added
maxItems: - max items array can hold. After that, items are removed from the other end
Returns: resulting array
clear( arr )
remove and delete all items in an array
Parameters:
arr: - array which needs to be cleared
Returns: void
push( arr , val, maxItems)
add an item to the end of an array with max items cap
Parameters:
arr: - array to which the item needs to be added at the beginning
val: - value of item which needs to be added
maxItems: - max items array can hold. After that, items are removed from the starting index
Returns: resulting array

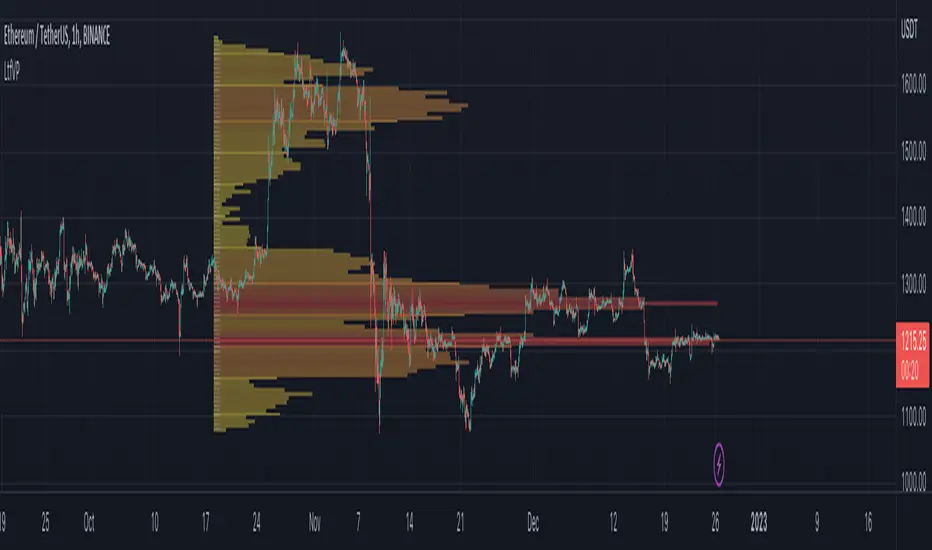
Interactive Volume Profile - Based on LTF volumeHere is my first attempt on defining volume profile. In this script, I am using new feature of pine security_lower_tf
Upon loading the script, it will ask users to select Time range to show the volume profile. Once you select the time range, confirmation input will popup. Upon confirming the inputs, you will be able to view the volume profile
Settings are pretty simple. Some of them appear as part of confirmation.
Limitation due to availability of LTF bars
security_lower_tf can only fetch upto 100k bars, Hence, if we move the starting point beyond that, we will only see volume profile from the bar where LTF volume data is available. Increasing lower timeframe resolution will also increase the available range of volume profile. Option also available to use max range instead of time based range. If max bar range is selected, then volume profile is drawn based on all the bars for which LTF volume is available.
An example of all combinations are show below.
Selecting the granularity of volume profile
Number of levels can be set from settings which impacts the granularity of volume profile. Below is the example of how different values for number of levels behave.
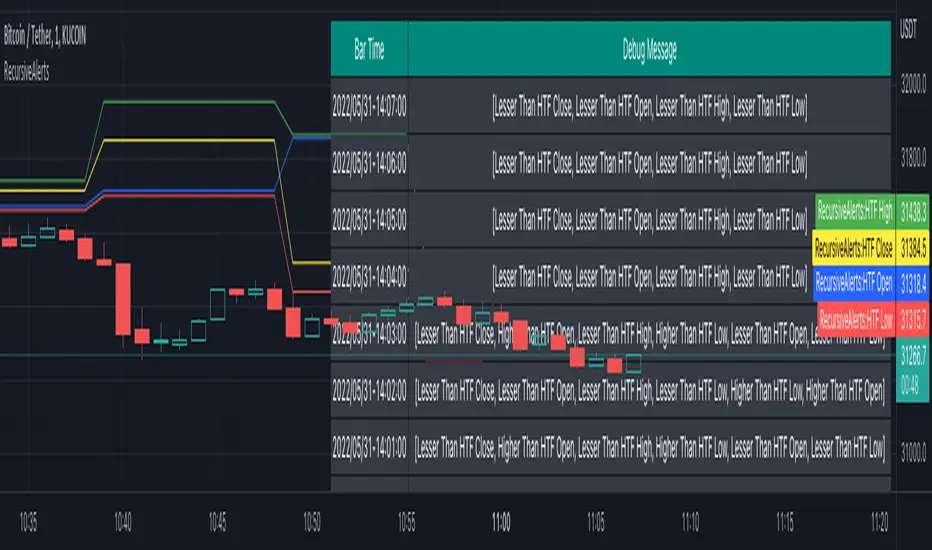
RecursiveAlertsLibrary "RecursiveAlerts"
The library provides options to run alert() calls in loop without worrying about limitations of frequency options.
When an alert statement is called within a loop,
it will fire just once per bar irrespective of how many iterations allowed when fequency is set to alert.freq_once_per_bar or alert.freq_once_per_bar_close
it will fire continuously till it breaks when frequency is set to alert.freq_all
The function helps overcome this issue by using varip key array which resets on every bar
rAlert(message, key) Enhanced alert which can be used in loops
Parameters:
message : Alert message to be fired
key : Key to be checked to avoid repetitive alerts
Returns: array containing id of already fired alerts
Thanks to @theheirophant, @JohnBaron and @LucF for discussions and suggestion which eventually lead to this solution :)
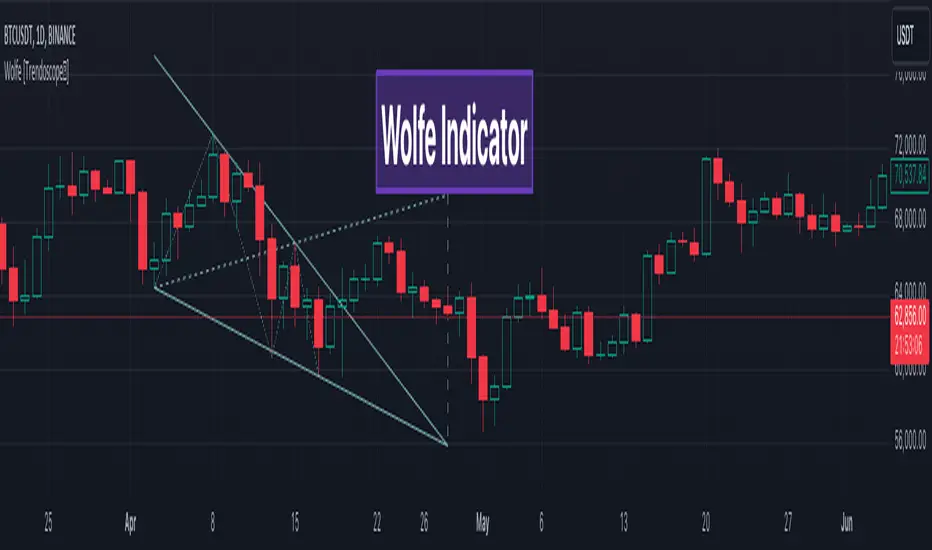
Wolfe Scanner (Multi - zigzag) [HeWhoMustNotBeNamed]Before getting into the script, I would like to explain bit of history around this project. Wolfe was in the back of my mind for some time and I had several attempts so far.
🎯Initial Attempt
When I first developed harmonic patterns, I got many requests from users to develop script to automatically detect Wolfe formation. I thought it would be easy and started boasting everywhere that I am going to attempt this next. However I miserably failed that time and started realising it is not as simple as I thought it would be. I started with Wolfe in mind. But, ran into issues with loops. Soon figured out that finding and drawing wedge is more trickier. I decided will explore trendline first so that it can help find wedge better. Soon, the project turned into something else and resulted in Auto-TrendLines-HeWhoMustNotBeNamed and Wolfe left forgotten.
🎯Using predefined ratios
Wolfe also has predefined fib ratios which we can use to calculate the formation. But, upon initial development, it did not convince me that it matches visual inspection of Wolfe all the time. Hence, I decided to fall back on finding wedge first.
🎯 Further exploration in finding wedge
This attempt was not too bad. I did not try to jump into Wolfe and nor I bragged anywhere about attempting anything of this sort. My target this time was to find how to derive wedge. I knew then that if I manage to calculate wedge in efficient way, it can help further in finding Wolfe. While doing that, ended up deriving Wedge-and-Flag-Finder-Multi-zigzag - which is not a bad outcome. I got few reminders on Wolfe after this both in comments and in PM.
🎯You never fail until you stop trying!!
After 2 back to back hectic 50hr work weeks + other commitments, I thought I will spend some time on this. Took less than half weekend and here we are. I was surprised how much little time it took in this attempt. But, the plan was running in my subconscious for several weeks or even months. Last two days were just putting these plans into an action.
Now, let's discuss about the script.
🎲 Wolfe Concept
Wolfe concept is simple. Whenever a wedge is formed, draw a line joining pivot 1 and 4 as shown in the chart below:
Converging trendline forms the stop loss whereas line joining pivots 1 and 4 form the profit taking points.
🎲 Settings
Settings are pretty straightforward. Explained in the chart below.
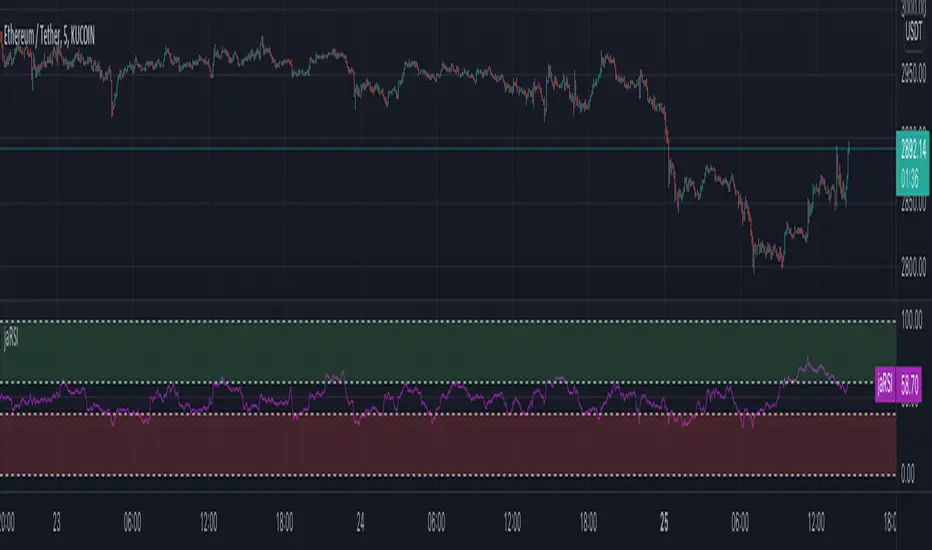
Just Another RSIThis is slightly different implementation of RSI using arrays. But, it also comes with a twist.
Formula for standard RSI can be found here: www.investopedia.com
If there is green candle, gain for the candle is equal to price movement from previous bar and loss for that candle is 0. Similarly in case of red candle, loss is considered to be movement from previous candle whereas gain is 0. Also, as mentioned in step2, on each bar, average of previous bar gains/losses are merged with present candle gain/loss.
New Process
Gain is considered only on green candles. Hence, there is no zero gain candles
Loss is considered only on red candles. Hence, there is no zero loss candles
Average or median of last N gains and losses are considered. Hence, the movement mainly tell us the strength between bullish and bearish candles.
Let us forget about seeing it as overbought and oversold area and look at it as bullish and bearish region.
How it is different
Since, gain and loss are only considered if there are gain and loss, this index represents the strength between bullish and bearish candles without looking at price movement. Hence, the index has capability to go in opposite direction of the price representing price movement is not supported by strength.
Another advantage of this implementation is it allows using variable length for the method. In case of RSI, length has to be constant. It cannot be variable which can change every bar. But, we do not have that constraint in this implementation due to use of arrays.
At present, this is purely experimental. I will look forward to study this more with respect to divergence and for use in trend following methods.
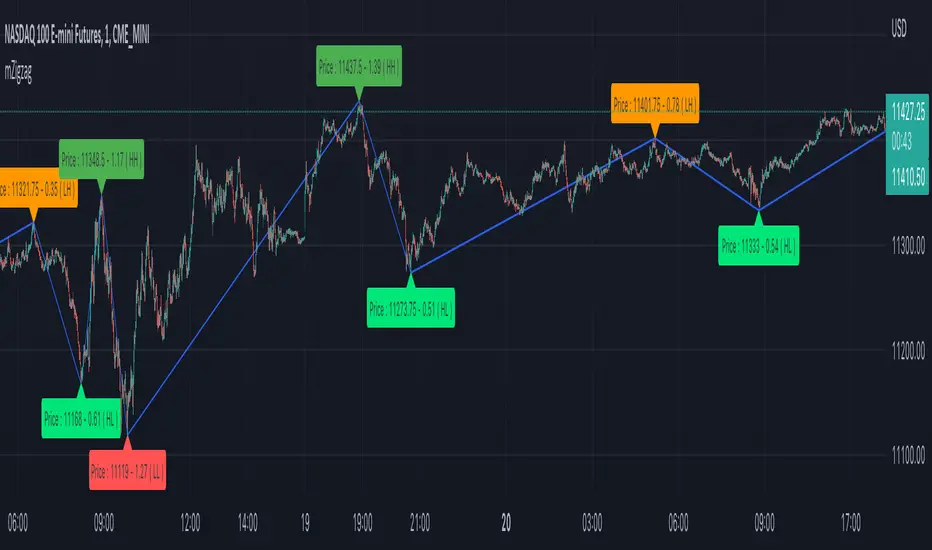
Zigzag MatrixNothing fancy. Just converted the new matrix library of zigzags ( mZigzag ) into indicator as I sensed it can be useful as indicator.
On top of the standard zigzag, the indicator also tracks given oscillators, moving average and volume indicators on each pivots. More indicators can be added programmatically - but it will take up space in chart. Hence, so far I have only added option to add one per each type (moving average, oscillator and volume)
Settings are as below

mZigzagLibrary "mZigzag"
Matrix implementation of zigzag to allow further possibilities.
Main advantage of this library over previous zigzag methods is that you can attach any number of indicator/oscillator information to zigzag
calculate(length, ohlc, indicatorHigh, indicatorLow, numberOfPivots) calculates zigzag and related information
Parameters:
length : is zigzag length
ohlc : array of OHLC values to be used for zigzag calculation
indicatorHigh : Array of indicator values calculated based on high price of OHLC
indicatorLow : Array of indicators values calculated based on low price of OHLC
numberOfPivots : Number of pivots to be returned
Returns: pivotMatrix Matrix containing zigzag pivots, pivot bars, direction, ratio, and indicators added via indicatorHigh/indicatorLow
newZG is true if a new pivot is added to array
doubleZG is true if last calculation returned two new pivots (Happens on extreme price change)
draw(length, ohlc, indicatorLabels, indicatorHigh, indicatorLow, numberOfPivots, lineColor, lineWidth, lineStyle, showHighLow, showRatios, showIndicators) draws zigzag and related information
Parameters:
length : is zigzag length
ohlc : array of OHLC values to be used for zigzag calculation
indicatorLabels : Array of name of indicators passed
indicatorHigh : Array of indicator values calculated based on high price of OHLC
indicatorLow : Array of indicators values calculated based on low price of OHLC
numberOfPivots : Number of pivots to be returned
lineColor : zigzag line color. set to blue by default
lineWidth : zigzag line width. set to 1 by default
lineStyle : zigzag line style. set to line.style_solid by default
showHighLow : show HH, HL, LH, LL labels
showRatios : show pivot retracement ratios from previous zigzag
showIndicators : show indicator values
Returns: pivotMatrix Matrix containing zigzag pivots, pivot bars, direction, ratio, and indicators added via indicatorHigh/indicatorLow
zigzaglines array of zigzag lines
zigzaglabels array of zigzag labels
_matrixLibrary "_matrix"
Library helps visualize matrix as array of arrays and enables users to use array methods such as push, pop, shift, unshift etc along with cleanup activities on drawing objects wherever required
unshift(mtx, row) unshift array of lines to first row of the matrix
Parameters:
mtx : matrix of lines
row : array of lines to be inserted in row
Returns: resulting matrix of lines
unshift(mtx, row) unshift array of labels to first row of the matrix
Parameters:
mtx : matrix of labels
row : array of labels to be inserted in row
Returns: resulting matrix labels
unshift(mtx, row) unshift array of boxes to first row of the matrix
Parameters:
mtx : matrix of boxes
row : array of boxes to be inserted in row
Returns: resulting matrix of boxes
unshift(mtx, row) unshift array of linefill to first row of the matrix
Parameters:
mtx : matrix of linefill
row : array of linefill to be inserted in row
Returns: resulting matrix of linefill
unshift(mtx, row) unshift array of tables to first row of the matrix
Parameters:
mtx : matrix of tables
row : array of tables to be inserted in row
Returns: resulting matrix of tables
unshift(mtx, row) unshift array of int to first row of the matrix
Parameters:
mtx : matrix of int
row : array of int to be inserted in row
Returns: resulting matrix of int
unshift(mtx, row) unshift array of float to first row of the matrix
Parameters:
mtx : matrix of float
row : array of float to be inserted in row
Returns: resulting matrix of float
unshift(mtx, row) unshift array of bool to first row of the matrix
Parameters:
mtx : matrix of bool
row : array of bool to be inserted in row
Returns: resulting matrix of bool
unshift(mtx, row) unshift array of string to first row of the matrix
Parameters:
mtx : matrix of string
row : array of string to be inserted in row
Returns: resulting matrix of string
unshift(mtx, row) unshift array of color to first row of the matrix
Parameters:
mtx : matrix of colors
row : array of colors to be inserted in row
Returns: resulting matrix of colors
push(mtx, row) push array of lines to end of the matrix row
Parameters:
mtx : matrix of lines
row : array of lines to be inserted in row
Returns: resulting matrix of lines
push(mtx, row) push array of labels to end of the matrix row
Parameters:
mtx : matrix of labels
row : array of labels to be inserted in row
Returns: resulting matrix of labels
push(mtx, row) push array of boxes to end of the matrix row
Parameters:
mtx : matrix of boxes
row : array of boxes to be inserted in row
Returns: resulting matrix of boxes
push(mtx, row) push array of linefill to end of the matrix row
Parameters:
mtx : matrix of linefill
row : array of linefill to be inserted in row
Returns: resulting matrix of linefill
push(mtx, row) push array of tables to end of the matrix row
Parameters:
mtx : matrix of tables
row : array of tables to be inserted in row
Returns: resulting matrix of tables
push(mtx, row) push array of int to end of the matrix row
Parameters:
mtx : matrix of int
row : array of int to be inserted in row
Returns: resulting matrix of int
push(mtx, row) push array of float to end of the matrix row
Parameters:
mtx : matrix of float
row : array of float to be inserted in row
Returns: resulting matrix of float
push(mtx, row) push array of bool to end of the matrix row
Parameters:
mtx : matrix of bool
row : array of bool to be inserted in row
Returns: resulting matrix of bool
push(mtx, row) push array of string to end of the matrix row
Parameters:
mtx : matrix of string
row : array of string to be inserted in row
Returns: resulting matrix of string
push(mtx, row) push array of colors to end of the matrix row
Parameters:
mtx : matrix of colors
row : array of colors to be inserted in row
Returns: resulting matrix of colors
shift(mtx) shift removes first row from matrix of lines
Parameters:
mtx : matrix of lines from which the shift operation need to be performed
Returns: void
shift(mtx) shift removes first row from matrix of labels
Parameters:
mtx : matrix of labels from which the shift operation need to be performed
Returns: void
shift(mtx) shift removes first row from matrix of boxes
Parameters:
mtx : matrix of boxes from which the shift operation need to be performed
Returns: void
shift(mtx) shift removes first row from matrix of linefill
Parameters:
mtx : matrix of linefill from which the shift operation need to be performed
Returns: void
shift(mtx) shift removes first row from matrix of tables
Parameters:
mtx : matrix of tables from which the shift operation need to be performed
Returns: void
shift(mtx) shift removes first row from matrix of int
Parameters:
mtx : matrix of int from which the shift operation need to be performed
Returns: void
shift(mtx) shift removes first row from matrix of float
Parameters:
mtx : matrix of float from which the shift operation need to be performed
Returns: void
shift(mtx) shift removes first row from matrix of bool
Parameters:
mtx : matrix of bool from which the shift operation need to be performed
Returns: void
shift(mtx) shift removes first row from matrix of string
Parameters:
mtx : matrix of string from which the shift operation need to be performed
Returns: void
shift(mtx) shift removes first row from matrix of colors
Parameters:
mtx : matrix of colors from which the shift operation need to be performed
Returns: void
pop(mtx) pop removes last row from matrix of lines
Parameters:
mtx : matrix of lines from which the pop operation need to be performed
Returns: void
pop(mtx) pop removes last row from matrix of labels
Parameters:
mtx : matrix of labels from which the pop operation need to be performed
Returns: void
pop(mtx) pop removes last row from matrix of boxes
Parameters:
mtx : matrix of boxes from which the pop operation need to be performed
Returns: void
pop(mtx) pop removes last row from matrix of linefill
Parameters:
mtx : matrix of linefill from which the pop operation need to be performed
Returns: void
pop(mtx) pop removes last row from matrix of tables
Parameters:
mtx : matrix of tables from which the pop operation need to be performed
Returns: void
pop(mtx) pop removes last row from matrix of int
Parameters:
mtx : matrix of int from which the pop operation need to be performed
Returns: void
pop(mtx) pop removes last row from matrix of float
Parameters:
mtx : matrix of float from which the pop operation need to be performed
Returns: void
pop(mtx) pop removes last row from matrix of bool
Parameters:
mtx : matrix of bool from which the pop operation need to be performed
Returns: void
pop(mtx) pop removes last row from matrix of string
Parameters:
mtx : matrix of string from which the pop operation need to be performed
Returns: void
pop(mtx) pop removes last row from matrix of colors
Parameters:
mtx : matrix of colors from which the pop operation need to be performed
Returns: void
clear(mtx) clear clears the matrix of lines
Parameters:
mtx : matrix of lines which needs to be cleared
Returns: void
clear(mtx) clear clears the matrix of labels
Parameters:
mtx : matrix of labels which needs to be cleared
Returns: void
clear(mtx) clear clears the matrix of boxes
Parameters:
mtx : matrix of boxes which needs to be cleared
Returns: void
clear(mtx) clear clears the matrix of linefill
Parameters:
mtx : matrix of linefill which needs to be cleared
Returns: void
clear(mtx) clear clears the matrix of tables
Parameters:
mtx : matrix of tables which needs to be cleared
Returns: void
clear(mtx) clear clears the matrix of int
Parameters:
mtx : matrix of int which needs to be cleared
Returns: void
clear(mtx) clear clears the matrix of float
Parameters:
mtx : matrix of float which needs to be cleared
Returns: void
clear(mtx) clear clears the matrix of bool
Parameters:
mtx : matrix of bool which needs to be cleared
Returns: void
clear(mtx) clear clears the matrix of string
Parameters:
mtx : matrix of string which needs to be cleared
Returns: void
clear(mtx) clear clears the matrix of colors
Parameters:
mtx : matrix of colors which needs to be cleared
Returns: void
Wedge and Flag Finder (Multi - zigzag)Here is a small attempt to automatically identify wedges and flags.
Tradingview standard wedge checks for only 4 pivots. In this version, I have considered 5 pivots instead - which can help reduce noise as 4 pivots forming wedge can be quite common. In future, will also try to add more pivots in pattern recognition to make the signal more accurate.
If wedge comes with a tail, then it is marked as flag :)
Settings are quite simple and they are as shown below

drawingutilsLibrary "drawingutils"
Private methods used in my scripts for some basic and customized drawings. No documentation provided as these are meant for private use only.
draw_line()
draw_label()
draw_linefill()
draw_labelled_line()
draw_labelled_box()
runTimer()
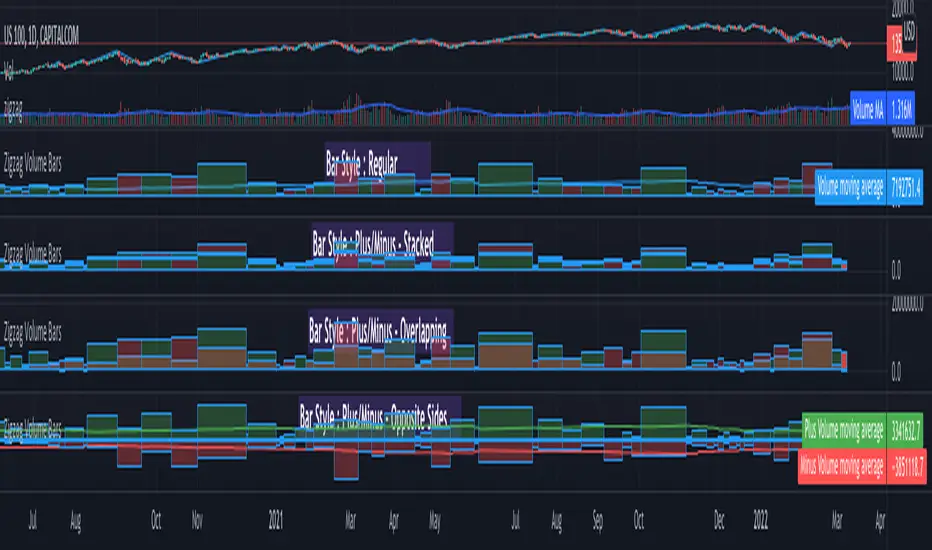
Zigzag Volume BarsBack to my favourite topic - Zigzags.
Here is an indicator which can help you visualise volume data on Zigzag swing highs and lows.
Settings are pretty simple and provides variety of display options
Display options are as demonstrated in the chart has following main types.
Regular
Plus/Minus - Stacked
Plus/Minus - Overlapping
Plus/Minus - Opposite Sides
Apart from the main display types, stacked display has several sub-types which determine whether to place green bar below red or the other way around.
Snapshot below shows example of each type.
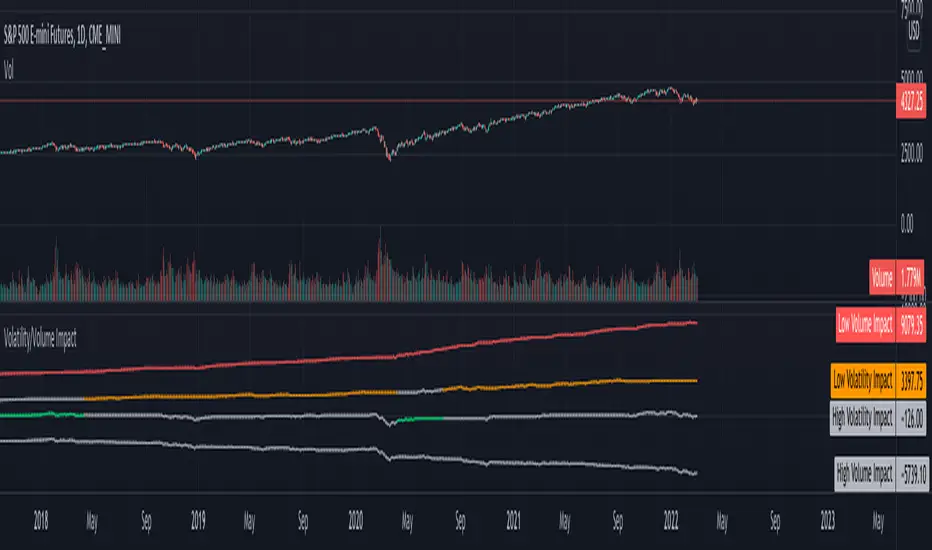
Volatility/Volume ImpactWe often hear statements such as follow the big volume to project possible price movements. Or low volatility is good for trend. How much of it is statistically right for different markets. I wrote this small script to study the impact of Volatility and Volume on price movements.
Concept is as below:
Compare volume with a reference median value. You can also use moving average or other types for this comparison.
If volume is higher than median, increment positive value impact with change in close price. If volume is less than median, then increment negative value impact with change in close price.
With this we derive pvd and nvd which are measure of price change when volume is higher and lower respectively. pvd measures the price change when volume is higher than median whereas nvd measures price change when volume is lower than median.
Calculate correlation of pvd and nvd with close price to see what is impacting the price by higher extent.
Colors are applied to plots which have higher correlation to price movement. For example, if pvd has higher correlation to price movement, then pvd is coloured green whereas nvd is coloured silver. Similarly if nvd has higher correlation to price then nvd is coloured in red whereas pvd is coloured in silver.
Similar calculation also applied for volatility.
With this, you can observe how price change is correlated to high/low volume and volatility.
Let us see some examples on different markets.
Example 1: AMEX:SPY
From the chart snapshot below, it looks evident that SPY always thrive when there is low volatility and LOW VOLUME!!
Example 2: NASDAQ:TSLA
The picture will be different if you look at individual stocks. For Tesla, the price movement is more correlated to high volume (unlike SPY where low volume days define the trend)
Example 3: KUCOIN:BTCUSDT
Unlike stocks and indices, high volatility defined the trend for BTC for long time. It thrived when volatility is more. We can see that high volume is still major influencer in BTC price movements.
Settings are very simple and self explanatory.
Hint: You can also move the indicator to chart overlay for better visualisation of comparison with close price.
WVF - OscillatorAnother attempt on making use of CM-Williams-Vix-Fix-Finds-Market-Bottoms from Chris Moody - which is arguably one of the best indicator available on pine and tradingview platform. Every time I revisit this, I get new ideas on applying this method.
I have slightly altered formula to
highest(source)-source/highest(source)
from the original formula
highest(close)-low/highest(close)
Process is simple:
Calculate WVF for OHLC values separately
Calculate momentum on each of the WVF values based on distance from moving average
Plot the candles based on OHLC momentum.
Candle color depends on whether close, open and previous close. If close is higher than open and previous close, we get green coloured candles. If close is lower than previous close and open then we get red coloured candles. In all other cases, we will have silver candles.
High/Low bands are calculated based on median of highest and lowest values of VixFix. We also plot median of close which can be used in some cases.
How to use this to find market bottom. Look for one of the below conditions:
First red candle above high band - which signals momentum of vix fix is about to fall.
First red candle above median line - can be used only if upward momentum of wvf candles are trending well.
Crossunder of wvf candles under high band.
Possible exit scenarios
Green WVF candle formed above WVF high line
Entry is taken on first red candle above median line - but, candles turned green before WVF crossing under median line - may signal our thesis is wrong and price may drop further.
Some examples.

Intrabar OBV/PVTI got this idea from @fikira's script Intrabar-Price-Volume-Change-experimental
The indicator calculates OBV and PVT based on ticks. Since, the indicator relies on live ticks, it only starts execution after it is put on the charts. The script can be useful in analysing intraday buy and sell pressure. Details are color coded based on the values.
Data is presented in simple tabular format.
Formula for OBV and PVT can be found here:
www.investopedia.com
www.investopedia.com

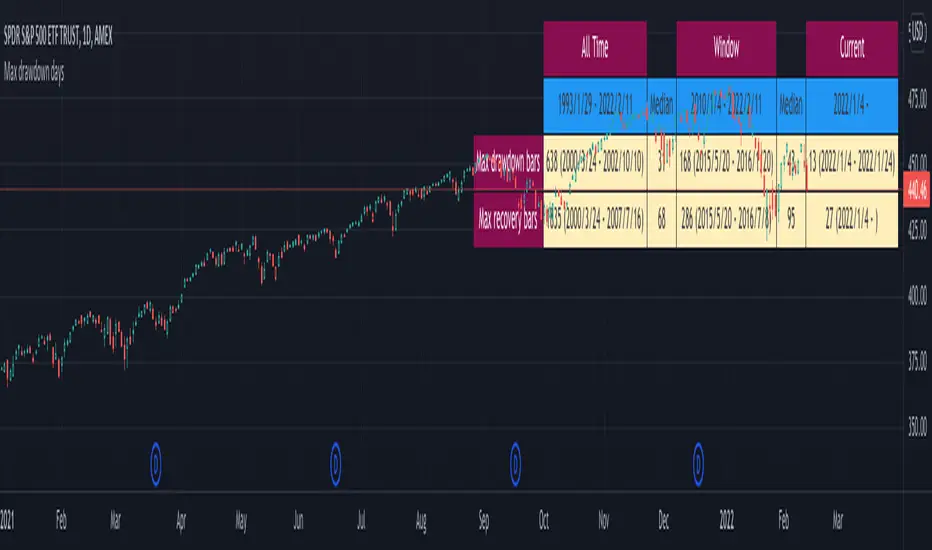
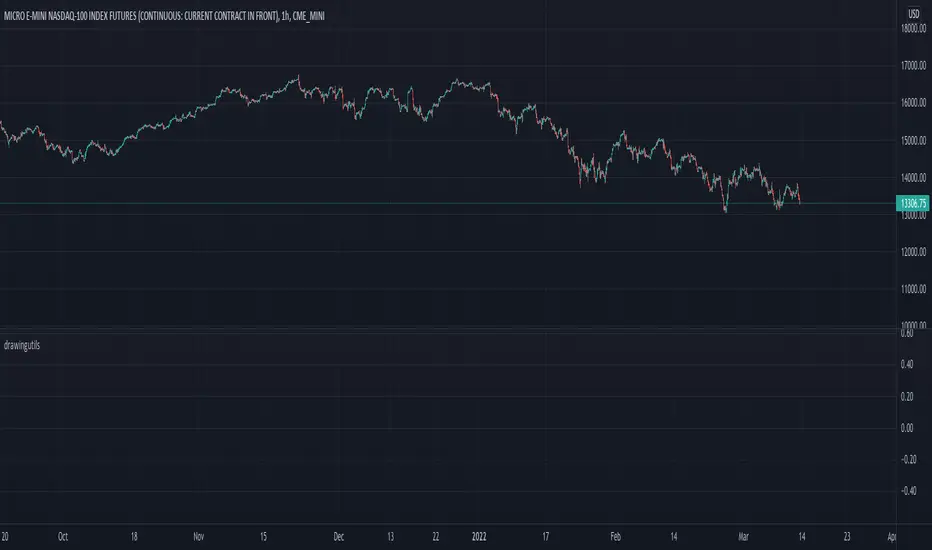
Max drawdown daysA friendly reminder to myself and rest of the traders that market can stay low for prolonged time!!
Details are pretty simple.
Here is small comparison of the stats for major US indices.
Can also be applied to stocks. Cells are highlighted in red background ii
Drawdown/Recovery is still in progress for historical stats
Current drawdown bars/recovery bars are higher than that of median of All time stats.