Các chỉ số, chiến lược và thư viện
OHLC Tool allows you to display Current or Historical OHLC Values as horizontal lines that extend to the right on your chart. Features Variable Lookback to display a specific historical bar's values. Default = 1 (Previous Candle) Customizable Timeframe to view HTF Candle values. Custom Line Colors, Styles, and Thicknesses. Price Scale Value Display...
Adjust the time as per your purpose.Turn off second line option if you don't need it.
Indicator plots a dynamic horizontal line for tracking the highest high and/or lowest low in your desired time-period. You can select both the period, and whether an alert is produced when the price crosses the last highest high or lowest low. When used when other Williams indicators, this can help you set your trailing stop for profit-taking.
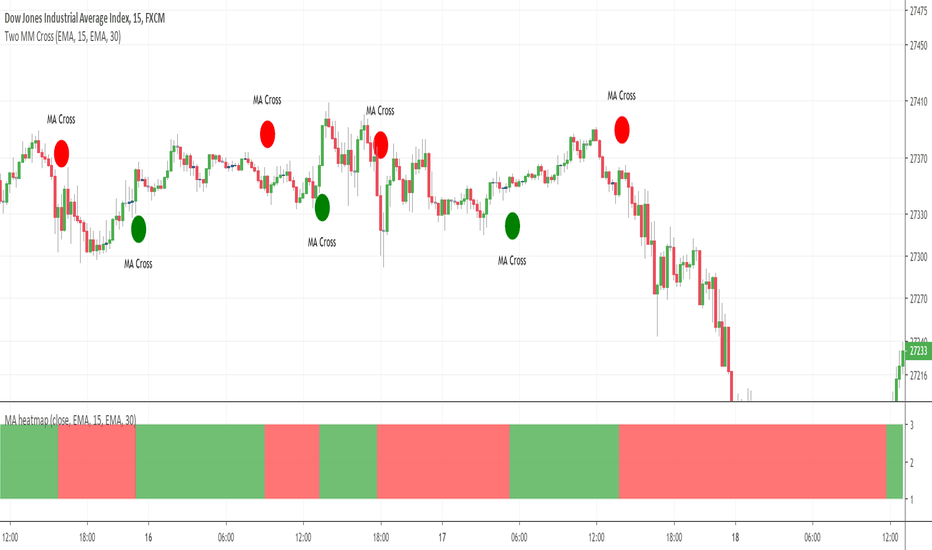
Hello my friends Sorry yesterday I couldn't post an indicator because I was travelling. So here's the today indicator inspired from that one Moving-Average-Heatmap-Visualization/ This will gives an interesting representation of a Double Moving Average cross That's all for me Let's resume the free indicators publishing next Monday with the MA heatmap (Triple...
Horizontal lines help you to put Quarter Theory lines on your chart. It's defaults are meant for EURUSD , but you can change it for other charts. There are 16 lines in this indicator. For EURUSD recommended settings right now are: Starting Price (Bottom):1.12 and Gap: 0.0025 USDCAD: Starting Price (Bottom):1.315 and Gap: 0.005 EURAUD: Starting Price...


