Adaptive Quadratic Kernel EnvelopeThis study draws a fair-value curve from a quadratic-weighted (Nadaraya-Watson) regression. Alpha sets how sharply weights decay inside the look-back window, so you trade lag against smoothness with one slider. Band half-width is ATRslow times a bounded fast/slow ATR ratio, giving an instant response to regime shifts without overshooting on spikes. Work in log space when an instrument grows exponentially, equal percentage moves then map to equal vertical steps. NearBase and FarBase define a progression of adaptive thresholds, useful for sizing exits or calibrating mean-reversion logic. Non-repaint mode keeps one-bar delay for clean back-tests, predictive mode shows the zero-lag curve for live decisions.
Key points
- Quadratic weights cut phase error versus Gaussian or SMA-based envelopes.
- Dual-ATR scaling updates width on the next bar, no residual lag.
- Log option preserves envelope symmetry across multi-decade data.
- Alpha provides direct control of curvature versus noise.
- Built-in alerts trigger on the first adaptive threshold, ready for automation.
Typical uses
Trend bias from the slope of the curve.
Entry timing when price pierces an inner threshold and momentum stalls.
Breakout confirmation when closes hold beyond outer thresholds while volatility expands.
Stops and targets anchored to chosen thresholds, automatically matching current noise.
Julien_eche

SMEMA Trend CoreSMEMA Trend Core is a multi-timeframe trend analysis tool designed to provide a clean, adaptive and structured view of the market’s directional bias. It can be used in short term, swing or long term contexts. The internal calculation adjusts automatically based on the selected trading style, while always combining data from six timeframes.
At its core, the indicator uses a SMEMA, which is a Simple Moving Average applied to an EMA. This combination improves smoothness without losing reactivity. The SMEMA is calculated separately on 1H, 4H, 1D, 3D, 1W and 1M timeframes. These six values are then combined using dynamic weights that depend on the trading mode:
Short Term mode gives more influence to 1H and 4H
Swing Trading mode gives more influence to 1D, 3D and 1W
Long Term mode gives more influence to 1W and 1M
However, all six timeframes are always included in the final result. This avoids the tunnel vision of relying on a single resolution and ensures that the indicator captures both local and structural movements.
The result is a synthetic trend line, called Global SMEMA, that adapts to market conditions and offers a realistic view of the ongoing trend. To enhance the reading, the indicator calculates a Trend Score. This score reflects the position of price relative to the Global SMEMA, scaled by a long-term ATR, and adjusted by the slope of the trend line. A hyperbolic tangent function is used to normalize values and reduce distortion from outliers.
The final score is capped between -10 and +10, and used to define the trend state:
Green when the trend is bullish (score > +1.5)
Red when the trend is bearish (score < -1.5)
Brown when the trend is neutral (score between -1.5 and +1.5)
Optional Deviation Bands can be displayed at ±1, ±2 and ±3 ATR distances around the central line. These dynamic zones help identify extended price movements or potential support and resistance areas, depending on the current trend bias.
Main features:
A single, stable trend line based on six timeframes
Automatic rebalancing depending on trading mode
Quantified score integrating distance and slope
No overreaction to short-term noise
Deviation zones for advanced market context
No repainting, no lookahead, 100% real-time
SMEMA Trend Core is not a signal tool. It is a directional framework that helps you stay aligned with the real structure of the market. Use it to confirm setups, filter trades or simply understand where the market stands in its trend cycle.

Directional Strength IndexThis indicator is designed to detect the dominant market direction and quantify its strength by aggregating signals across six key timeframes: 1H, 4H, 1D, 3D, 1W, and 1M.
At its core, it uses a SMEMA 'the Simple Moving Average of an EMA' as the main trend reference. This hybrid smoothing method was chosen for its balance: the EMA ensures responsiveness to recent price moves, while the SMA dampens short-term volatility. This makes the SMEMA more stable than a raw EMA and more reactive than a simple SMA, especially in noisy or volatile environments.
For each timeframe, a score between -10 and +10 is calculated. This score reflects:
- the distance of the price from the SMEMA, using ATR as a dynamic threshold
- the number of price deviations above or below the SMEMA
- the slope of the SMEMA, which adjusts the score based on momentum
These six timeframe scores are then combined into a single Global Score, using weighted averages. Three weighting profiles are available depending on your trading horizon:
- Long Term: emphasizes weekly and monthly data
- Swing Trading: gives balanced importance to all timeframes
- Short Term: prioritizes 1H and 4H action
This multi-timeframe aggregation makes the indicator adaptable to different styles while maintaining a consistent logic.
The result is displayed in a table on the chart, showing:
- the trend direction per timeframe (up, down or neutral)
- the strength score per timeframe
- the overall trend direction and strength based on the selected profile
Optional deviation bands based on ATR multiples are also plotted to provide visual context for overextensions relative to the SMEMA.
This indicator is non-repainting and built for objective, trend-based decision making.

Trend Scanner ProTrend Scanner Pro, Robust Trend Direction and Strength Estimator
Trend Scanner Pro is designed to evaluate the current market trend with maximum robustness, providing both direction and strength based on statistically reliable data.
This indicator builds upon the core logic of a previous script I developed, called Best SMA Finder. While the original script focused on identifying the most profitable SMA length based on backtested trade performance, Trend Scanner Pro takes that foundation further to serve a different purpose: analyzing and quantifying the actual trend state in real time.
It begins by testing hundreds of SMA lengths, from 10 to 1000 periods. Each one is scored using a custom robustness formula that combines profit factor, number of trades, and win rate. Only SMAs with a sufficient number of trades are retained, ensuring statistical validity and avoiding curve fitting.
The SMA with the highest robustness score is selected as the dynamic reference point. The script then calculates how far the price deviates from it using rolling standard deviation, assigning a trend strength score from -5 (strong bearish) to +5 (strong bullish), with 0 as neutral.
Two detection modes are available:
Slope mode, based on SMA slope reversals
Bias mode, based on directional shifts relative to deviation zones
Optional features:
Deviation bands for visual structure
Candle coloring to reflect trend strength
Compact table showing real-time trend status
This tool is intended for traders who want an adaptive, objective, and statistically grounded assessment of market trend conditions.

TrueTrend MaxRThe TrueTrend MaxR indicator is designed to identify the most consistent exponential price trend over extended periods. It uses statistical analysis on log-transformed prices to find the trendline that best fits historical price action, and highlights the most frequently tested or traded level within that trend channel.
For optimal results, especially on high timeframes such as weekly or monthly, it is recommended to use this indicator on charts set to logarithmic scale. This ensures proper visual alignment with the exponential nature of long-term price movements.
How it works
The indicator tests 50 different lookback periods, ranging from 300 to 1280 bars. For each period, it:
- Applies a linear regression on the natural logarithm of the price
- Computes the slope and intercept of the trendline
- Calculates the unbiased standard deviation from the regression line
- Measures the correlation strength using Pearson's R coefficient
The period with the highest Pearson R value is selected, meaning the trendline drawn corresponds to the log-scale trend with the best statistical fit.
Trendline and deviation bands
Once the optimal period is identified, the indicator plots:
- A main log-scale trendline
- Upper and lower bands, based on a user-defined multiple of the standard deviation
These bands help visualize how far price deviates from its core trend, and define the range of typical fluctuations.
Point of Control (POC)
Inside the trend channel, the space between upper and lower bands is divided into 15 logarithmic levels. The script evaluates how often price has interacted with each level, using one of two selectable methods:
- Touches: Counts the number of candles crossing each level
- Volume: Weighs each touch by the traded volume at that candle
The level with the highest cumulative interaction is considered the dynamic Point of Control (POC), and is plotted as a line.
Annualized performance and confidence display
When used on daily or weekly timeframes, the script also calculates the annualized return (CAGR) based on the detected trend, and displays:
- A performance estimate in percentage terms
- A textual label describing the confidence level based on the Pearson R value
Why this indicator is useful
- Automatically detects the most statistically consistent exponential trendline
- Designed for log-scale analysis, suited to long-term investment charts
- Highlights key price levels frequently visited or traded within the trend
- Provides objective, data-based trend and volatility insights
- Displays annualized growth rate and correlation strength for quick evaluation
Notes
- All calculations are performed only on the last bar
- No future data is used, and the script does not repaint
- Works on any instrument or timeframe, with optimal use on higher timeframes and logarithmic scaling

Kalman Filter Oscillator v4The Kalman Filter Oscillator v4 is an advanced tool designed to help traders and investors identify trends more effectively while reducing the impact of market noise. As the latest iteration in its development, this version integrates improvements that make it more adaptive and precise, catering to the challenges of today’s financial markets.
This indicator operates on the principle of the Kalman filter, a well-regarded mathematical approach used for estimating the state of a dynamic system. By filtering out random fluctuations, it smooths price data to provide clearer insights into underlying trends. Unlike traditional methods such as moving averages, which often lag and can miss rapid shifts, the Kalman Filter Oscillator is reactive in real time, making it particularly suited for dynamic markets.
Version v4 builds on earlier versions by offering a refined combination of short-term and long-term trend analysis. Through adjustable parameters, traders can balance sensitivity to immediate price changes with a broader perspective of the market direction. Additionally, the oscillator incorporates a unique feature that tracks a price’s position relative to its recent highs and lows, which enhances its ability to pinpoint potential turning points or key market conditions.
The indicator’s value lies in its adaptability and practicality. Traders can use it to confirm trends, identify overbought or oversold conditions, or smooth out erratic price movements, reducing the likelihood of false signals. By presenting information in a clear and actionable format, it allows users to make better-informed decisions with greater confidence.
As of late 2024, the Kalman Filter Oscillator v4 represents a sophisticated yet user-friendly advancement in trend analysis. While not a one-size-fits-all solution, it serves as a valuable component in a trader’s toolkit, complementing other strategies and enhancing overall market understanding.

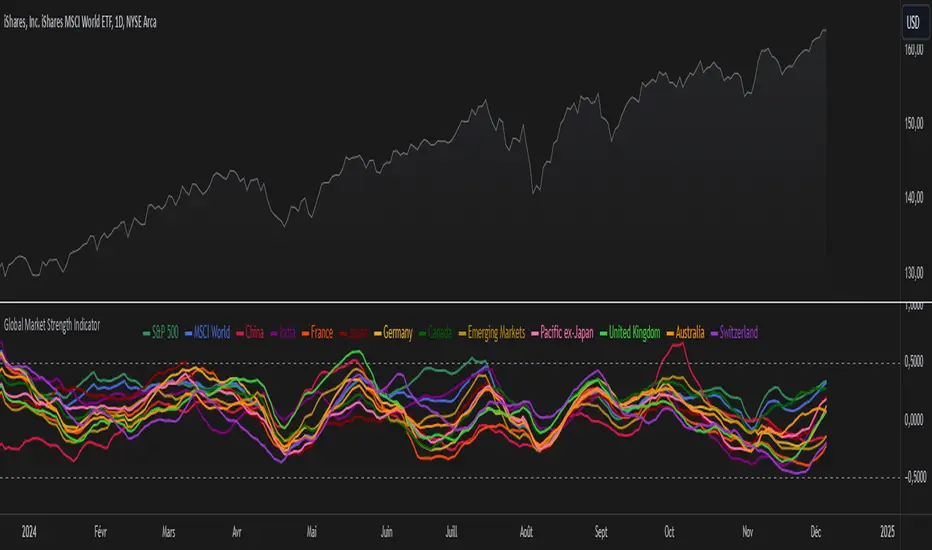
Global Market Strength IndicatorThe Global Market Strength Indicator is a powerful tool for traders and investors. It helps compare the strength of various global markets and indices. This indicator uses the True Strength Index (TSI) to measure market strength.
The indicator retrieves price data for different markets and calculates their TSI values. These values are then plotted on a chart. Each market is represented by a different colored line, making it easy to distinguish between them.
One of the main benefits of this indicator is its comprehensive global view. It covers major indices and country-specific ETFs, giving users a broad perspective on global market trends. This wide coverage allows for easy comparison between different markets and regions.
The indicator is highly customizable. Users can adjust the TSI smoothing period to suit their preferences. They can also toggle the visibility of individual markets. This feature helps reduce chart clutter and allows for more focused analysis.
To use the indicator, apply it to your chart in TradingView. Adjust the settings as needed, and observe the relative positions and movements of the TSI lines. Lines moving higher indicate increasing strength in that market, while lines moving lower suggest weakening markets.
The chart includes reference lines at 0.5 and -0.5. These help identify potential overbought and oversold conditions. Markets with TSI values above 0.5 may be considered strong or potentially overbought. Those below -0.5 may be weak or potentially oversold.
By comparing the movements of different markets, users can identify which markets are leading or lagging. They can also spot potential divergences between related markets. This information can be valuable for identifying sector rotations or shifts in global market sentiment.
A dynamic legend automatically updates to show only the visible markets. This feature improves chart readability and makes it easier to interpret the data.
The Global Market Strength Indicator is a versatile tool that provides valuable insights into global market performance. It helps traders and investors identify trends, compare market performances, and make more informed decisions. Whether you're looking to spot emerging global trends or identify potential trading opportunities, this indicator offers a comprehensive solution for global market analysis.
S&P 500 Sector StrengthsThe "S&P 500 Sector Strengths" indicator is a sophisticated tool designed to provide traders and investors with a comprehensive view of the relative performance of various sectors within the S&P 500 index. This indicator utilizes the True Strength Index (TSI) to measure and compare the strength of different sectors, offering valuable insights into market trends and sector rotations.
At its core, the indicator calculates the TSI for each sector using price data obtained through the request.security() function. The TSI, a momentum oscillator, is computed using a user-defined smoothing period, allowing for customization based on individual preferences and trading styles. The resulting TSI values for each sector are then plotted on the chart, creating a visual representation of sector strengths.
To use this indicator effectively, traders should focus on comparing the movements of different sector lines. Sectors with lines moving higher are showing increasing strength, while those with descending lines are exhibiting weakness. This comparative analysis can help identify potential investment opportunities and sector rotations. Additionally, when multiple sector lines move in tandem, it may signal a broader market trend.
The indicator includes dashed lines at 0.5 and -0.5, serving as reference points for overbought and oversold conditions. Sectors with TSI values above 0.5 might be considered overbought, suggesting caution, while those below -0.5 could be viewed as oversold, potentially indicating buying opportunities.
One of the key advantages of this indicator is its flexibility. Users can toggle the visibility of individual sectors and customize their colors, allowing for a tailored analysis experience. This feature is particularly useful when focusing on specific sectors or reducing chart clutter for clearer visualization.
The indicator's ability to provide a comprehensive overview of all major S&P 500 sectors in a single chart is a significant benefit. This consolidated view enables quick comparisons and helps in identifying relative strengths and weaknesses across sectors. Such insights can be invaluable for portfolio allocation decisions and in spotting emerging market trends.
Moreover, the dynamic legend feature enhances the indicator's usability. It automatically updates to display only the visible sectors, improving chart readability and interpretation.
By leveraging this indicator, market participants can gain a deeper understanding of sector dynamics within the S&P 500. This enhanced perspective can lead to more informed decision-making in sector allocation strategies and individual stock selection. The indicator's ability to potentially detect early trends by comparing sector strengths adds another layer of value, allowing users to position themselves ahead of broader market movements.
In conclusion, the "S&P 500 Sector Strengths" indicator is a powerful tool that combines technical analysis with sector comparison. Its user-friendly interface, customizable features, and comprehensive sector coverage make it an valuable asset for traders and investors seeking to navigate the complexities of the S&P 500 market with greater confidence and insight.

CAGR ProjectionThe CAGR Projection Indicator is a tool designed to visualize the potential growth of an asset over time based on a specified annual growth rate. This indicator overlays a projection line on the price chart, allowing traders and investors to compare actual price movements with a hypothetical growth trajectory.
One of the key features of this indicator is the ability for users to input their expected annual growth rate as a percentage. This flexibility allows for various scenarios to be modeled, from conservative estimates to more optimistic projections. Additionally, the indicator allows users to set a specific start date for the projection, enabling analysis from any chosen point in time.
The projection calculation is dynamic, adjusting for different timeframes and updating with each new bar on the chart. The indicator initializes either at the specified start date or when the first valid price is encountered. Using the initial price as a base, the indicator calculates the projected price for each subsequent bar using the compound growth formula. The calculation accounts for the specific timeframe of the chart, ensuring accurate projections regardless of whether the chart displays daily, weekly, or other intervals.
The projected growth is plotted as a blue line on the chart, providing a clear visual comparison between the actual price movement and the hypothetical growth trajectory. This visual representation makes it easy for users to quickly assess how an asset is performing relative to the expected growth rate.
This tool has several practical applications. Investors can use it to set realistic growth targets for their investments. By comparing actual price movements to the projection line, users can quickly assess if an asset is outperforming or underperforming relative to the expected growth rate. Furthermore, multiple instances of the indicator can be used with different growth rates to visualize various potential outcomes, facilitating scenario analysis.
The indicator also offers customization options, such as displaying a label showing the annual growth rate used for the projection, and the ability to adjust the color of the projection line to suit individual preferences or chart setups.
In summary, this CAGR Projection indicator serves as a valuable tool for both long-term investors and traders, offering a simple yet effective way to visualize potential growth scenarios and assess investment performance over time. It combines ease of use with powerful analytical capabilities, making it a useful addition to any trader's or investor's toolkit.

Price Action UltimateThe Price Action Ultimate indicator is an innovative tool designed to provide traders with a comprehensive view of price action based on either volume or touches. By default, the indicator displays touches, offering a unique perspective on price levels that have been frequently interacted with by the market.
At its core, the indicator divides the price range of a specified lookback period into a number of rows (default 25). For each row, it calculates either the volume traded or the number of times the price touched that level. This data is then visualized in two ways: as a histogram and as horizontal lines on the chart.
The histogram, displayed on the right side of the chart, represents the distribution of touches (or volume) across different price levels. Each bar in the histogram shows the number of touches and the percentage of total touches for that price level. The color of the bars ranges from a user-defined low activity color to a high activity color, providing a quick visual reference for the most active price levels.
The horizontal lines drawn across the chart represent the most significant levels based on touches (or volume). By default, the indicator displays the top 3 levels, but this can be adjusted. The thickness of these lines corresponds to the relative importance of each level - thicker lines indicate more touches or higher volume. This feature allows traders to quickly identify key support and resistance levels based on historical price action.
One of the most innovative aspects of this indicator is the option to fade older levels over time. When enabled, this feature gradually increases the transparency of lines as they age, with newer levels appearing more prominently. This helps traders focus on the most recent and relevant price action while still maintaining awareness of older, potentially significant levels.
The indicator offers flexibility in its display options. Users can choose to show levels based on volume, touches, or both. This allows traders to compare and contrast different perspectives on price action. Additionally, the indicator includes options to display a volume profile and a background fill for the analysis range, further enhancing its visual appeal and informational content.
What makes this indicator particularly valuable is its ability to provide a clear, uncluttered view of key price levels without relying on complex calculations or multiple indicators. It distills price action down to its essence - where price has spent the most time or where the most trading activity has occurred. This can be incredibly useful for identifying potential support and resistance levels, areas of consolidation, or possible breakout points.
For traders focused on price action strategies, this indicator offers a powerful tool to enhance their analysis. It provides a data-driven approach to identifying significant price levels, which can be used to inform entry and exit decisions, set stop losses, or anticipate potential market reactions.
This indicator is a tool to aid in market analysis and should not be used as the sole basis for trading decisions. Always combine multiple forms of analysis and practice proper risk management when trading. Past performance does not guarantee future results.

Dynamic ConfluenceThe Dynamic MA Confluence Indicator is a powerful tool designed to simplify your trading experience by automatically identifying the most influential moving average (MA) lengths on your chart. Whether you're using Simple Moving Averages (SMA) or Exponential Moving Averages (EMA), this indicator helps you pinpoint the MA length that holds the greatest confluence, allowing you to make informed trading decisions with ease.
How It Works:
This indicator analyzes a wide range of moving averages, from short-term to long-term, to determine which ones are closest to each other. By setting a "Proximity Percentage," you can control how close these MAs need to be to be considered as having confluence. The indicator then calculates the average of these close MAs to establish a dynamic support or resistance level on your chart.
Why Use This Indicator?
Automatic Optimization: Unsure of which MA length to apply? The indicator automatically highlights the MA length with the most confluence, giving you a clear edge in identifying significant market levels.
Adaptability: Choose between SMA and EMA to suit your trading strategy and market conditions.
Enhanced Decision-Making: By focusing on the MA length with the greatest influence, you can better anticipate market movements and adjust your strategies accordingly.
Customizable Sensitivity: Adjust the Proximity Percentage to fine-tune the indicator's sensitivity, ensuring it aligns with your trading preferences.
Key Feature:
Current Key Confluence MA Length: Displayed in an optional table, this feature shows the MA length that currently has the most impact on the confluence level, providing you with actionable insights at a glance.
Whether you're a seasoned trader or just starting, the Dynamic MA Confluence Indicator offers a streamlined approach to understanding market dynamics, helping you trade smarter and with more confidence. This presentation text is designed to clearly communicate the purpose, functionality, and benefits of the indicator, making it easy for users to understand its value and how it can enhance their trading strategies.
The Dynamic MA Confluence Indicator is a tool designed to assist traders in analyzing market trends. It should not be considered as financial advice or a guarantee of future performance. Trading involves significant risk, and it is possible to lose more than your initial investment. Users should conduct their own research and consider their financial situation before making trading decisions. Always consult with a financial advisor if you are unsure about any trading strategies or decisions. This disclaimer is intended to remind users of the inherent risks in trading and the importance of conducting their own due diligence.

Support Resistance UltimateThe "Support Resistance ULTIMATE" indicator is a comprehensive tool for traders on the TradingView platform, designed to identify key support and resistance levels using two primary techniques: pivot points and volume data. This indicator provides flexibility and customization, allowing traders to adapt it to their specific trading strategies.
KEY FEATURES
Pivot-Based Levels:
This feature calculates support and resistance levels using pivot points, which are derived from the high, low, and close prices of previous trading periods. Pivot points are crucial for forecasting potential market turning points.
Users can customize the pivot calculation by selecting the source type (either 'Close' or 'High/Low') and adjusting the lookback periods for both the left and right sides of the pivot calculation. This flexibility allows traders to adapt the indicator to different market conditions and timeframes.
Volume-Based Levels:
This option focuses on identifying support and resistance levels based on volume data, specifically the Point of Control (POC). The POC represents the price level with the highest traded volume during a specific time period, reflecting a consensus value among market participants.
The indicator includes a rolling POC calculation, allowing traders to dynamically assess areas of significant trading interest that may serve as support or resistance zones.
ADVANTAGES
Customization and Flexibility:
Traders can choose between pivot-based and volume-based levels or use both simultaneously, depending on their analysis needs. This dual approach provides a comprehensive view of market dynamics, accommodating various trading styles.
The indicator offers customizable color settings for support and resistance lines, enhancing chart readability and allowing traders to personalize their visual analysis.
Enhanced Market Insights:
By utilizing pivot points, traders can identify potential reversal or consolidation points, aiding in the prediction of market trends and the establishment of strategic entry and exit points.
Volume-based levels provide insights into market sentiment and participation, highlighting areas of strong support or resistance based on trading volume. This can improve risk management and trade execution by identifying high-probability trading zones.
Importance Scoring:
The indicator calculates the importance of each level based on the number of touches and the duration it holds. This scoring system helps traders assess the strength of support and resistance levels, with thicker lines indicating more significant levels.
This indicator is intended for educational and informational purposes only and should not be considered financial advice. Trading involves significant risk, and you should consult with a financial advisor before making any trading decisions. The performance of this indicator is not guaranteed, and past results do not predict future performance. Use at your own risk.

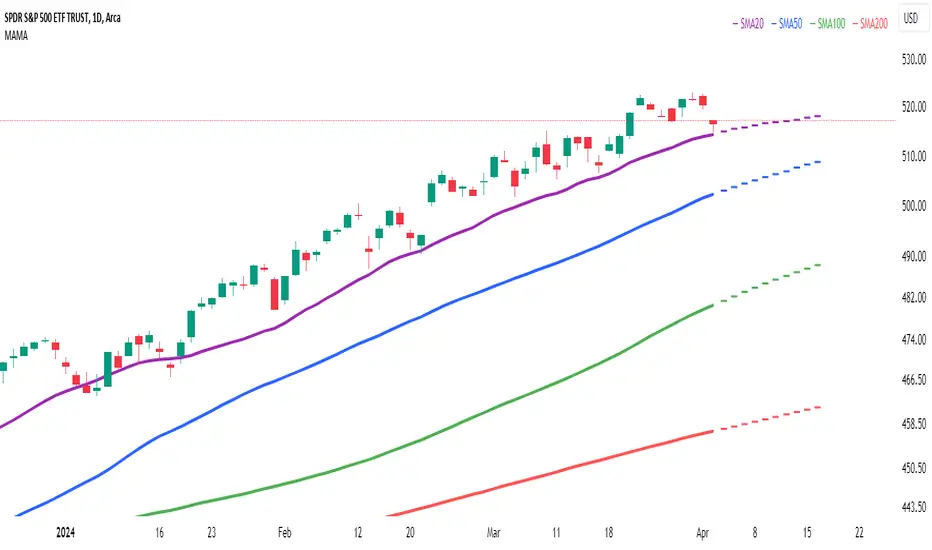
Multi Adaptive Moving Average (MAMA)The Multi Adaptive Moving Average (MAMA) indicator is an advanced tool for technical analysis, designed to provide traders with a detailed understanding of market trends and potential future price movements. This indicator utilizes multiple Simple Moving Averages (SMAs) and forecasting techniques to enhance decision-making processes.
Simple Moving Averages (SMAs):
Short MA (20-period): This moving average is highly responsive to price changes, making it ideal for capturing short-term trends. It helps traders identify quick market shifts and potential entry or exit points.
Mid MA (50-period): This average strikes a balance between short- and long-term trends, offering insights into the market's intermediate direction. It aids in confirming the sustainability of short-term trends.
Long MA (100-period): By smoothing out price data over a longer period, this moving average is useful for identifying long-term trends and filtering out short-term volatility.
Very Long MA (200-period): Often considered a critical indicator for determining the overall market trend, this average helps confirm the direction and strength of long-term movements.
Forecasting:
Flat Forecast: This approach assumes that prices will remain constant in the near future, which is particularly useful in markets trading sideways without a clear trend direction.
Linear Regression Forecast: This method uses historical data to project future price movements, offering a dynamic forecast based on existing trends. It helps traders anticipate potential price changes and plan their strategies accordingly.
Advantages:
Comprehensive Trend Analysis: By incorporating four different SMAs, the indicator provides a layered view of market trends across various timeframes. This enables traders to identify potential trend reversals and continuations with greater accuracy.
Predictive Insights: The forecasting feature offers traders a forward-looking perspective, enabling them to anticipate market movements and adjust their trading strategies proactively. This can be especially advantageous in volatile markets.
Customization: The MAMA indicator is highly customizable, allowing traders to adjust parameters such as the source of price data and the inclusion of the current unclosed candle. This flexibility ensures that the indicator can be tailored to fit different trading styles and market conditions.
Visual Clarity: The use of distinct colors for each SMA and their forecasts enhances visual interpretation, making it easier for traders to quickly assess market conditions and make informed decisions. The inclusion of a legend further aids in distinguishing between the different moving averages and their respective forecasts.
How to Use:
Trend Confirmation: Use the alignment of the SMAs to confirm market trends. For example, when the Short MA crosses above the Mid and Long MAs, it may indicate a bullish trend, while the opposite could suggest a bearish trend.
Entry and Exit Points: Look for crossovers between the SMAs as potential signals for entering or exiting trades. The forecasts can help in timing these decisions by providing an expectation of future price movements.
Risk Management: Utilize the Very Long MA to set stop-loss and take-profit levels, as it reflects the long-term trend and can help in avoiding trades against the prevailing market direction.
The MAMA indicator is intended to support technical analysis and should not be used as the sole basis for making trading decisions. Financial markets are inherently uncertain, and past performance does not guarantee future results. Traders should use this tool in conjunction with other analytical methods and consider their risk tolerance and investment objectives. It is advisable to conduct thorough research and consult with a financial advisor before making significant trading decisions. Always be aware of the risks involved in trading and invest only what you can afford to lose.
Linear Regression ChannelLinear Regression Channel with Logarithmic Scale Option
This advanced Linear Regression Channel indicator offers traders a powerful tool for technical analysis, with unique features that set it apart from standard implementations.
Key Features:
Logarithmic Scale Option: One of the most distinctive aspects of this indicator is the ability to switch between classic and logarithmic scales. This feature is particularly valuable for long-term analysis, as it ensures that equal percentage changes are represented equally, regardless of the price level.
Flexible Start Date: Unlike many indicators that rely on a fixed number of periods, this tool allows users to set a specific start date and time. This feature provides precise control over the regression analysis timeframe, enhancing its adaptability to various trading strategies.
Customizable Channel Settings: Users can adjust the upper and lower deviation multipliers, allowing for fine-tuning of the channel width to suit different market conditions and trading styles.
Trend Strength Indicator: An optional feature that displays the strength of the trend based on the Pearson correlation coefficient, offering additional insight into the reliability of the current trend.
Comprehensive Visual Customization: The indicator offers extensive color and style options for the regression line, upper and lower channel lines, and fill areas, allowing traders to create a visually appealing and easy-to-read chart setup.
Extended Line Options: Users can choose to extend the regression lines to the left, right, or both, facilitating projection and analysis of future price movements.
Multiple Alert Conditions: The indicator includes four alert conditions for crossing the upper deviation, lower deviation, and the main regression line in both directions, enhancing its utility for active traders.
Why Choose This Indicator:
The combination of logarithmic scale option and flexible start date setting makes this Linear Regression Channel uniquely suited for both short-term and long-term analysis. The logarithmic scale is particularly beneficial for analyzing assets with significant price changes over time, as it normalizes percentage moves across different price levels. This feature, coupled with the ability to set a precise start date, allows traders to perform more accurate and relevant regression analyses, especially when studying specific market cycles or events.
Moreover, the trend strength indicator and customizable visual elements provide traders with a comprehensive tool that not only identifies potential support and resistance levels but also offers insight into the reliability and strength of the current trend.
In summary, this Linear Regression Channel indicator combines flexibility, precision, and insightful analytics, making it an invaluable tool for traders seeking to enhance their technical analysis capabilities on TradingView.

TrendMaster ProTrendMaster Pro: A Comprehensive Trend Analysis Tool for Long-Term Investors
TrendMaster Pro is an advanced technical indicator designed to provide long-term investors with a robust and comprehensive analysis of market trends. This sophisticated tool operates exclusively on daily timeframes, making it ideal for those focused on long-term investment strategies. By combining multiple analytical approaches, TrendMaster Pro offers investors a powerful means to assess trend quality and make informed decisions.
Automatic Trend Detection
At the heart of TrendMaster Pro lies its ability to automatically identify the most statistically significant trend. The indicator analyzes various timeframes ranging from 1000 to 5000 days, selecting the one that exhibits the highest correlation. This feature ensures that investors are always working with the most relevant trend data, eliminating the subjectivity often associated with manual trend identification.
The trend detection algorithm employs a regression analysis approach, evaluating approximately 80,000 different trend alternatives each day. Each potential trend is assigned a score based on criteria such as trend density, deviation from regression, and the number of price points near the trend's floor and ceiling. The trend with the highest score is then selected and displayed on the chart.
Comprehensive Scoring System
TrendMaster Pro employs a multi-faceted scoring system that evaluates four key aspects of a trend, providing a holistic view of its quality and potential. Each aspect is scored on a scale of 0 to 10, with the overall trend quality score being a weighted average of these individual scores.
1. Length Score
The Length Score measures the duration of the detected trend. Longer trends receive higher scores, reflecting increased reliability and significance. This score is calculated by normalizing the auto-selected period (which ranges from 1000 to 5000 days) to a scale of 5 to 10.
For example, if the auto-selected period is 3000 days, it would receive a score of around 7.5. This emphasizes the importance of long-term trends in investment decision-making, as they tend to be more stable and indicative of underlying market forces.
2. Strength Score
The Strength Score utilizes Pearson's Correlation Coefficient to assess trend strength. This statistical measure gauges the linear relationship between price and trend projection. A value closer to 1 indicates a strong positive correlation, reinforcing confidence in the trend direction based on historical price movements.
The indicator translates the Pearson's Correlation Coefficient into a score from 0 to 10. For instance, a correlation coefficient of 0.95 might translate to a Strength Score of 8, indicating a strong and reliable trend.
3. Performance Score
The Performance Score compares the asset's Compound Annual Growth Rate (CAGR) to a chosen benchmark, typically a major index like the S&P 500. This score provides insight into how well the asset is performing relative to the broader market.
The CAGR is calculated using the formula: CAGR = (Ending Value / Beginning Value)^(1/n) - 1, where n is the number of years. The Performance Score is then determined by comparing this CAGR to the benchmark's CAGR over the same period. A higher score indicates outperformance relative to the benchmark.
4. Level Score
The Level Score evaluates the current price position within the trend channel. Lower prices within the channel receive higher scores, suggesting potential value or buying opportunities. This score helps identify possible entry points based on historical trend behavior.
For example, if the current price is near the lower boundary of the trend channel, it might receive a Level Score of 9, indicating a potentially attractive entry point.
Visual Representation
TrendMaster Pro provides a clear visual representation of the detected trend by displaying a regression channel on the chart. This channel consists of three lines: a middle line representing the main trend, and upper and lower lines representing standard deviations from the main trend.
The channel offers a quick visual reference for support and resistance levels, helping investors identify potential entry and exit points. The color and style of these lines can be customized to suit individual preferences.
Detailed Information Table
A comprehensive table presents all scores and relevant data, allowing for quick and easy interpretation of the trend analysis. This table includes:
The auto-selected trend length
The Pearson's Correlation Coefficient
The asset's CAGR and the benchmark's CAGR
Individual scores for Length, Strength, Performance, and Level
The overall Trend Quality Score
This table provides investors with a clear, at-a-glance summary of the trend's key characteristics and quality.
Practical Application
To use TrendMaster Pro effectively, investors should consider the following:
Focus on the overall Trend Quality Score as a primary indicator of trend strength and reliability.
Use the Length Score to gauge the trend's longevity and potential stability.
Pay attention to the Strength Score to assess how well the price action aligns with the identified trend.
Utilize the Performance Score to compare the asset's performance against the broader market.
Consider the Level Score when timing entries, looking for opportunities when prices are relatively low within the trend channel.
Use the visual trend channel as a guide for potential support and resistance levels.
Limitations and Considerations
While TrendMaster Pro offers powerful insights, it's important to remember that no indicator can predict future market movements with certainty. The tool should be used in conjunction with fundamental analysis and other market information.
Additionally, as the indicator is designed for daily charts and long-term analysis, it may not be suitable for short-term trading strategies. Users should also be aware that past performance does not guarantee future results, even with strong trend indications.
Conclusion
TrendMaster Pro represents a significant advancement in trend analysis for long-term investors. By combining automatic trend detection, comprehensive scoring, and benchmark comparison, it offers a powerful tool for those seeking to make informed, data-driven investment decisions. Its ability to objectively assess trend quality across multiple dimensions provides investors with a valuable edge in navigating complex market conditions.
For investors looking to deepen their understanding of market trends and enhance their long-term investment strategies, TrendMaster Pro offers a sophisticated yet accessible solution. As with any investment tool, users are encouraged to thoroughly familiarize themselves with its features and interpret its outputs in the context of their overall investment approach.

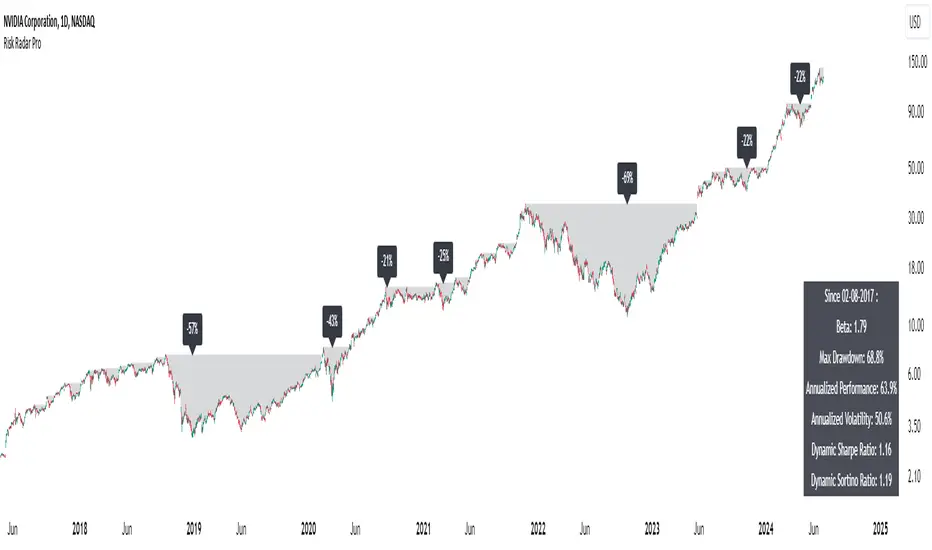
Risk Radar ProThe "Risk Radar Pro" indicator is a sophisticated tool designed to help investors and traders assess the risk and performance of their investments over a specified period. This presentation will explain each component of the indicator, how to interpret the results, and the advantages compared to traditional metrics.
The "Risk Radar Pro" indicator includes several key metrics:
● Beta
● Maximum Drawdown
● Compound Annual Growth Rate (CAGR)
● Annualized Volatility
● Dynamic Sharpe Ratio
● Dynamic Sortino Ratio
Each of these metrics is dynamically calculated using data from the entire selected period, providing a more adaptive and accurate measure of performance and risk.
1. Start Date
● Description: The date from which the calculations begin.
● Interpretation: This allows the user to set a specific period for analysis, ensuring that all metrics reflect the performance from this point onward.
2. Beta
● Description: Beta measures the volatility or systematic risk of the instrument relative to a reference index (e.g., SPY).
● Interpretation: A beta of 1 indicates that the instrument moves with the market. A beta greater than 1 indicates more volatility than the market, while a beta less than 1 indicates less volatility.
● Advantages: Unlike classic beta, which typically uses fixed historical intervals, this dynamic beta adjusts to market changes over the entire selected period, providing a more responsive measure.
3. Maximum Drawdown
● Description: The maximum observed loss from a peak to a trough before a new peak is achieved.
● Interpretation: This shows the largest single drop in value during the specified period. It is a critical measure of downside risk.
● Advantages: By tracking the maximum drawdown dynamically, the indicator can provide timely alerts when significant losses occur, allowing for better risk management.
4. Annualized Performance
● Description: The mean annual growth rate of the investment over the specified period.
● Interpretation: The Annualized Performance represents the smoothed annual rate at which the investment would have grown if it had grown at a steady rate.
● Advantages: This dynamic calculation reflects the actual long-term growth trend of the investment rather than relying on a fixed time frame.
5. Annualized Volatility
● Description: Measures the degree of variation in the instrument's returns over time, expressed as a percentage.
● Interpretation: Higher volatility indicates greater risk, as the investment's returns fluctuate more.
● Advantages: Annualized volatility calculated over the entire selected period provides a more accurate measure of risk, as it includes all market conditions encountered during that time.
6. Dynamic Sharpe Ratio
● Description: Measures the risk-adjusted return of an investment relative to its volatility.
● Choice of Risk-Free Rate Ticker: Users can select a ticker symbol to represent the risk-free rate in Sharpe ratio calculations. The default option is US03M, representing the 3-month US Treasury bill.
● Interpretation: A higher Sharpe ratio indicates better risk-adjusted returns. This ratio accounts for the risk-free rate to provide a comparison with risk-free investments.
● Advantages: By using returns and volatility over the entire period, the dynamic Sharpe ratio adjusts to changes in market conditions, offering a more accurate measure than traditional static calculations.
7. Dynamic Sortino Ratio
● Description: Similar to the Sharpe ratio, but focuses only on downside risk.
Interpretation: A higher Sortino ratio indicates better risk-adjusted returns, focusing solely on negative returns, which are more relevant to risk-averse investors.
● Choice of Risk-Free Rate Ticker: Similarly, users can choose a ticker symbol for the risk-free rate in Sortino ratio calculations. By default, this is also set to US03M.
● Advantages: This ratio's dynamic calculation considering the downside deviation over the entire period provides a more accurate measure of risk-adjusted returns in volatile markets.
Comparison with Basic Metrics
● Static vs. Dynamic Calculations: Traditional metrics often use fixed historical intervals, which may not reflect current market conditions. The dynamic calculations in "Risk Radar Pro" adjust to market changes, providing more relevant and timely information.
● Comprehensive Risk Assessment: By including metrics like maximum drawdown, Sharpe ratio, and Sortino ratio, the indicator provides a holistic view of both upside potential and downside risk.
● User Customization: Users can customize the start date, reference index, risk-free rate, and table position, tailoring the indicator to their specific needs and preferences.
Conclusion
The "Risk Radar Pro" indicator is a powerful tool for investors and traders looking to assess and manage risk more effectively. By providing dynamic, comprehensive metrics, it offers a significant advantage over traditional static calculations, ensuring that users have the most accurate and relevant information to make informed decisions.
The "Risk Radar Pro" indicator provides analytical tools and metrics for informational purposes only. It is not intended as financial advice. Users should conduct their own research and consider their individual risk tolerance and investment objectives before making any investment decisions based on the indicator's outputs. Trading and investing involve risks, including the risk of loss. Past performance is not indicative of future results.
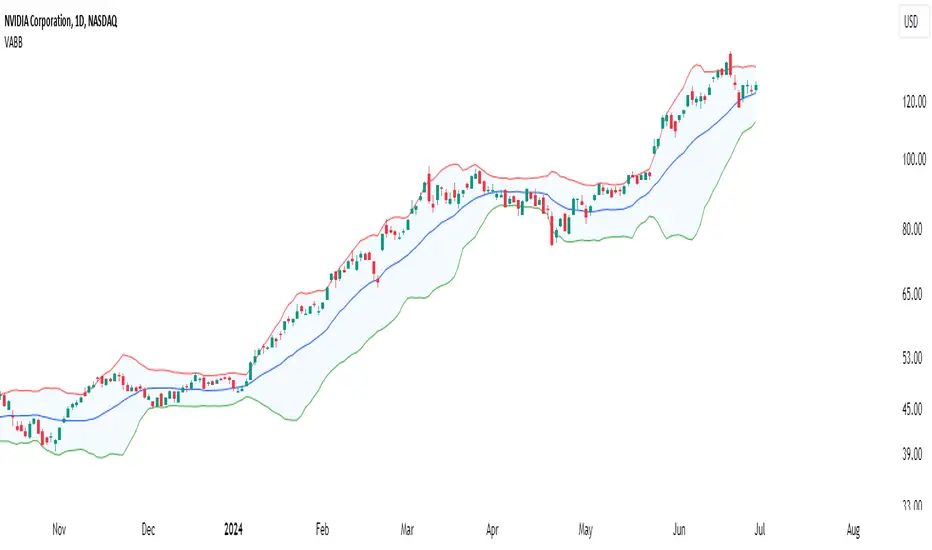
Volume-Adjusted Bollinger BandsThe Volume-Adjusted Bollinger Bands (VABB) indicator is an advanced technical analysis tool that enhances the traditional Bollinger Bands by incorporating volume data. This integration allows the bands to dynamically adjust based on market volume, providing a more nuanced view of price movements and volatility. The key qualities of the VABB indicator include:
1. Dynamic Adjustment with Volume: Traditional Bollinger Bands are based solely on price data and standard deviations. The VABB indicator adjusts the width of the bands based on the volume ratio, making them more responsive to changes in market activity. This means that during periods of high volume, the bands will expand, and during periods of low volume, they will contract. This adjustment helps to reinforce the significance of price movements relative to the central line (VWMA).
2. Volume-Weighted Moving Average (VWMA): Instead of using a simple moving average (SMA) as the central line, the VABB uses the VWMA, which weights prices by volume. This provides a more accurate representation of the average price level, considering the trading volume.
3. Enhanced Signal Reliability: By incorporating volume, the VABB can filter out false signals that might occur in low-volume conditions. This makes the indicator particularly useful for identifying significant price movements that are supported by strong trading activity.
How to Use and Interpret the VABB Indicator
To use the VABB indicator, you need to set it up on your trading platform with the following parameters:
1. BB Length: The number of periods for calculating the Bollinger Bands (default is 20).
2. BB Multiplier: The multiplier for the standard deviation to set the width of the Bollinger Bands (default is 2.0).
3. Volume MA Length: The number of periods for calculating the moving average of the volume (default is 14).
Volume Ratio Smoothing Length: The number of periods for smoothing the volume ratio (default is 5).
Interpretation
1.Trend Identification: The VWMA serves as the central line. When the price is above the VWMA, it indicates an uptrend, and when it is below, it indicates a downtrend. The direction of the VWMA itself can also signal the trend's strength.
2. Volatility and Volume Analysis: The width of the VABB bands reflects both volatility and volume. Wider bands indicate high volatility and/or high volume, suggesting significant price movements. Narrower bands indicate low volatility and/or low volume, suggesting consolidation.
3. Trading Signals:
Breakouts: A price move outside the adjusted upper or lower bands can signal a potential breakout. High volume during such moves reinforces the breakout's validity.
Reversals: When the price touches or crosses the adjusted upper band, it may indicate overbought conditions, while touching or crossing the adjusted lower band may indicate oversold conditions. These conditions can signal potential reversals, especially if confirmed by other indicators or volume patterns.
Volume Confirmation: The volume ratio component helps confirm the strength of price movements. For instance, a breakout accompanied by a high volume ratio is more likely to be sustained than one with a low volume ratio.
Practical Example
Bullish Scenario: If the price crosses above the adjusted upper band with a high volume ratio, it suggests a strong bullish breakout. Traders might consider entering a long position, setting a stop-loss just below the VWMA or the lower band.
Bearish Scenario: Conversely, if the price crosses below the adjusted lower band with a high volume ratio, it suggests a strong bearish breakout. Traders might consider entering a short position, setting a stop-loss just above the VWMA or the upper band.
Conclusion
The Volume-Adjusted Bollinger Bands (VABB) indicator is a powerful tool that enhances traditional Bollinger Bands by incorporating volume data. This dynamic adjustment helps traders better understand market conditions and make more informed trading decisions. By using the VABB indicator, traders can identify significant price movements supported by volume, improving the reliability of their trading signals.
The Volume-Adjusted Bollinger Bands (VABB) indicator is provided for educational and informational purposes only. It is not financial advice and should not be construed as a recommendation to buy, sell, or hold any financial instrument. Trading involves significant risk of loss and is not suitable for all investors. Past performance is not indicative of future results.
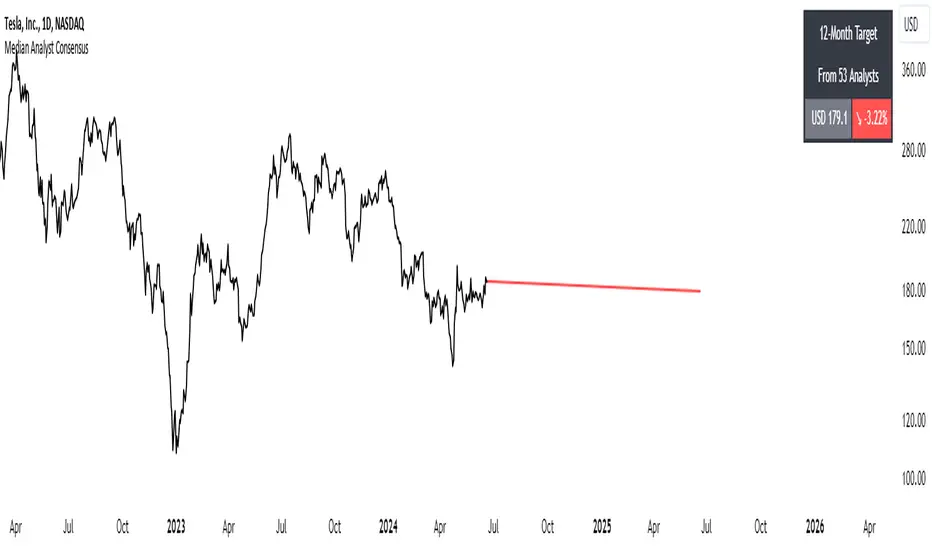
Median Analyst ConsensusThe Median Analyst Consensus Indicator provides an unbiased, easy-to-interpret view of market sentiment by leveraging TradingView's comprehensive financial data library. This tool displays the median 12-month price target and the percentage difference from the current price directly on your charts.
Key Features
1. Accurate Market Sentiment: By consolidating analyst ratings and price targets from multiple reputable sources like Bloomberg, Refinitiv (formerly Thomson Reuters), S&P Capital IQ, and Morningstar, this indicator displays the median analyst consensus. Using the median ensures outlier ratings don't skew the overall sentiment, providing a more robust representation.
2. Simplicity at a Glance: View the median 12-month price target and percentage difference from the current price directly on your chart. No need to juggle multiple reports - key insights are surfaced within your normal trading workflow.
3. Data-Driven Transparency: If no analyst data is available for a particular asset, the indicator will not display, ensuring you only see reliable information. The number of contributing analysts is also shown for context.
Why the Median?
The median is favored over the mean to minimize the impact of outlier ratings that could distort the consensus view. By taking the middle value across all analyst projections, the median provides a more stable, outlier-resistant measure of market sentiment.
Powered by TradingView Data
This indicator taps into TradingView's financial data library, which aggregates analyst ratings, estimates, and recommendations from leading institutional data providers. TradingView sources this data from firms like FactSet, Bloomberg, Refinitiv, S&P Capital IQ, and Morningstar, ensuring a comprehensive and trusted view of analyst sentiment.
The library provides variables like:
syminfo.recommendations_buy
syminfo.recommendations_sell
syminfo.target_price_median
syminfo.recommendations_buy_strong
syminfo.recommendations_sell_strong
The indicator calculates and displays the median of these analyst inputs.
Usage
The indicator displays:
The median 12-month price target across analysts
The percentage difference between the price target and current price
The number of contributing analyst estimates
If no analyst data is available, the indicator does not display, ensuring full transparency.
The Median Analyst Consensus Indicator provides an unbiased, easy-to-interpret view of market sentiment by leveraging TradingView's comprehensive financial data library. This tool offers a new perspective on potential trade opportunities directly on your charts.
Disclaimer
While the data is sourced from reputable providers, analyst forecasts should not be construed as investment recommendations. This indicator aims to synthesize market opinions, but investment decisions are solely your responsibility. As with any analytical tool, you should conduct your own research and risk assessments before executing any trades.
Global Financial IndexIntroducing the "Global Financial Index" indicator on TradingView, a meticulously crafted tool derived from extensive research aimed at providing the most comprehensive assessment of a company's financial health, profitability, and valuation. Developed with the discerning trader and investor in mind, this indicator amalgamates a diverse array of financial metrics, meticulously weighted and balanced to yield optimal results.
Financial Strength:
Financial strength is a cornerstone of a company's stability and resilience in the face of economic challenges. It encompasses various metrics that gauge the company's ability to meet its financial obligations, manage its debt, and generate sustainable profits. In our Global Financial Index indicator, the evaluation of financial strength is meticulously crafted to provide investors with a comprehensive understanding of a company's fiscal robustness. Let's delve into the key components and the rationale behind their inclusion:
1. Current Ratio:
The Current Ratio serves as a vital indicator of a company's liquidity position by comparing its current assets to its current liabilities.
A ratio greater than 1 indicates that the company possesses more short-term assets than liabilities, suggesting a healthy liquidity position and the ability to meet short-term obligations promptly.
By including the Current Ratio in our evaluation, we emphasize the importance of liquidity management in sustaining business operations and weathering financial storms.
2. Debt to Equity Ratio:
The Debt to Equity Ratio measures the proportion of a company's debt relative to its equity, reflecting its reliance on debt financing versus equity financing.
A higher ratio signifies higher financial risk due to increased debt burden, potentially leading to liquidity constraints and solvency issues.
Incorporating the Debt to Equity Ratio underscores the significance of balancing debt levels to maintain financial stability and mitigate risk exposure.
3. Interest Coverage Ratio:
The Interest Coverage Ratio assesses a company's ability to service its interest payments with its operating income.
A higher ratio indicates a healthier financial position, as it implies that the company generates sufficient earnings to cover its interest expenses comfortably.
By evaluating the Interest Coverage Ratio, we gauge the company's capacity to manage its debt obligations without compromising its profitability or sustainability.
4. Altman Z-Score:
The Altman Z-Score, developed by Edward Altman, is a composite metric that predicts the likelihood of a company facing financial distress or bankruptcy within a specific timeframe.
It considers multiple financial ratios, including liquidity, profitability, leverage, and solvency, to provide a comprehensive assessment of a company's financial health.
The Altman Z-Score categorizes companies into distinct risk groups, allowing investors to identify potential warning signs and make informed decisions regarding investment or credit exposure.
By integrating the Altman Z-Score, we offer a nuanced perspective on a company's financial viability and resilience in turbulent market conditions.
Profitability Rank:
Profitability rank is a crucial aspect of investment analysis that evaluates a company's ability to generate profits relative to its peers and industry benchmarks. It involves assessing various profitability metrics to gauge the efficiency and effectiveness of a company's operations and management. In our Global Financial Index indicator, the profitability rank segment is meticulously designed to provide investors with a comprehensive understanding of a company's profitability dynamics. Let's delve into the key components and rationale behind their inclusion:
1. Return on Equity (ROE):
Return on Equity measures a company's net income generated relative to its shareholders' equity.
A higher ROE indicates that a company is generating more profits with its shareholders' investment, reflecting efficient capital utilization and strong profitability.
By incorporating ROE, we assess management's ability to generate returns for shareholders and evaluate the overall profitability of the company's operations.
2. Gross Profit Margin:
Gross Profit Margin represents the percentage of revenue retained by a company after accounting for the cost of goods sold (COGS).
A higher gross profit margin indicates that a company is effectively managing its production costs and pricing strategies, leading to greater profitability.
By analyzing gross profit margin, we evaluate a company's pricing power, cost efficiency, and competitive positioning within its industry.
3. Operating Profit Margin:
Operating Profit Margin measures the percentage of revenue that remains after deducting operating expenses, such as salaries, rent, and utilities.
A higher operating profit margin signifies that a company is efficiently managing its operating costs and generating more profit from its core business activities.
By considering operating profit margin, we assess the underlying profitability of a company's operations and its ability to generate sustainable earnings.
4. Net Profit Margin:
Net Profit Margin measures the percentage of revenue that remains as net income after deducting all expenses, including taxes and interest.
A higher net profit margin indicates that a company is effectively managing its expenses and generating greater bottom-line profitability.
By analyzing net profit margin, we evaluate the overall profitability and financial health of a company, taking into account all expenses and income streams.
Valuation Rank:
Valuation rank is a fundamental aspect of investment analysis that assesses the attractiveness of a company's stock price relative to its intrinsic value. It involves evaluating various valuation metrics to determine whether a stock is undervalued, overvalued, or fairly valued compared to its peers and the broader market. In our Global Financial Index indicator, the valuation rank segment is meticulously designed to provide investors with a comprehensive perspective on a company's valuation dynamics. Let's explore the key components and rationale behind their inclusion:
1. Price-to-Earnings (P/E) Ratio:
The Price-to-Earnings ratio is a widely used valuation metric that compares a company's current stock price to its earnings per share (EPS).
A lower P/E ratio may indicate that the stock is undervalued relative to its earnings potential, while a higher ratio may suggest overvaluation.
By incorporating the P/E ratio, we offer insight into market sentiment and investor expectations regarding a company's future earnings growth prospects.
2. Price-to-Book (P/B) Ratio:
The Price-to-Book ratio evaluates a company's market value relative to its book value, which represents its net asset value per share.
A P/B ratio below 1 may indicate that the stock is trading at a discount to its book value, potentially signaling an undervalued opportunity.
Conversely, a P/B ratio above 1 may suggest overvaluation, as investors are paying a premium for the company's assets.
By considering the P/B ratio, we assess the market's perception of a company's tangible asset value and its implications for investment attractiveness.
3. Dividend Yield:
Dividend Yield measures the annual dividend income received from owning a stock relative to its current market price.
A higher dividend yield may indicate that the stock is undervalued or that the company is returning a significant portion of its profits to shareholders.
Conversely, a lower dividend yield may signal overvaluation or a company's focus on reinvesting profits for growth rather than distributing them as dividends.
By analyzing dividend yield, we offer insights into a company's capital allocation strategy and its implications for shareholder returns and valuation.
4. Discounted Cash Flow (DCF) Analysis:
Discounted Cash Flow analysis estimates the present value of a company's future cash flows, taking into account the time value of money.
By discounting projected cash flows back to their present value using an appropriate discount rate, DCF analysis provides a fair value estimate for the company's stock.
Comparing the calculated fair value to the current market price allows investors to assess whether the stock is undervalued, overvalued, or fairly valued.
By integrating DCF analysis, we offer a rigorous framework for valuing stocks based on their underlying cash flow generation potential.
Earnings Transparency:
Mitigating the risk of fraudulent financial reporting is crucial for investors. The indicator incorporates the Beneish M-Score, a robust model designed to detect earnings manipulation or financial irregularities. By evaluating various financial ratios and metrics, this component provides valuable insights into the integrity and transparency of a company's financial statements, aiding investors in mitigating potential risks.
Overall Score:
The pinnacle of the "Global Financial Index" is the Overall Score, a comprehensive amalgamation of financial strength, profitability, valuation, and manipulation risk, further enhanced by the inclusion of the Piotroski F-Score. This holistic score offers investors a succinct assessment of a company's overall health and investment potential, facilitating informed decision-making.
The weighting and balancing of each metric within the indicator have been meticulously calibrated to ensure accuracy and reliability. By amalgamating these diverse metrics, the "Global Financial Index" empowers traders and investors with a powerful tool for evaluating investment opportunities with confidence and precision.
This indicator is provided for informational purposes only and does not constitute financial advice, investment advice, or any other type of advice. The information provided by this indicator should not be relied upon for making investment decisions. Trading and investing in financial markets involves risk, and you should carefully consider your financial situation and consult with a qualified financial advisor before making any investment decisions. Past performance is not necessarily indicative of future results. The creator of this indicator makes no representations or warranties of any kind, express or implied, about the completeness, accuracy, reliability, suitability, or availability with respect to the indicator or the information contained herein. Any reliance you place on such information is therefore strictly at your own risk. By using this indicator, you agree to assume full responsibility for any and all gains and losses, financial, emotional, or otherwise, experienced, suffered, or incurred by you.

Buffett Quality Score [Energy]The Buffett Quality Score for the Energy sector is designed to meticulously evaluate the financial health and quality of companies operating within this dynamic industry. Each selected financial ratio is specifically chosen based on its relevance and significance within the Energy sector context.
Selected Financial Ratios and Criteria:
1. Return on Assets (ROA) > 5%
Relevance: In the Energy sector, where asset-intensive operations are common (e.g., oil exploration and infrastructure), a robust ROA above 5% indicates efficient asset utilization, crucial for profitability.
2. Debt to Equity Ratio < 1.0
Relevance: Energy companies often require substantial capital for projects and operations. A low Debt to Equity Ratio (<1.0) suggests prudent financial management with less reliance on debt financing, vital in a capital-intensive industry vulnerable to economic cycles.
3.Interest Coverage Ratio > 3.0
Relevance: Given the capital-intensive nature of Energy projects, maintaining a healthy Interest Coverage Ratio (>3.0) ensures the company's ability to service debt obligations, particularly important during periods of economic volatility affecting commodity prices.
4. Gross Margin % > 25%
Relevance: Energy companies face varying production costs and pricing pressures. A Gross Margin exceeding 25% reflects efficient cost management and pricing power, critical in mitigating volatility in commodity prices.
5. Current Ratio > 1.5
Relevance: Energy projects often require substantial working capital. A Current Ratio > 1.5 indicates sufficient liquidity to cover short-term obligations, essential for operational continuity in an industry susceptible to market fluctuations.
6. EBITDA Margin % > 15%
Relevance: Energy companies must manage operating costs effectively. An EBITDA Margin > 15% signifies strong operational efficiency and profitability, crucial for sustaining growth amidst market uncertainties.
7. Altman Z-Score > 2.0
Relevance: The Energy sector experiences cyclical downturns and price volatility. An Altman Z-Score > 2.0 indicates financial stability and resilience, vital for weathering industry-specific challenges.
8. EPS Basic One-Year Growth % > 5%
Relevance: Energy companies' earnings growth is closely tied to commodity prices and market demand. EPS growth > 5% indicates positive momentum and adaptability to industry shifts.
9. Revenue One-Year Growth % > 5%
Relevance: Energy companies operate in a dynamic market influenced by geopolitical factors and global demand. Revenue growth > 5% reflects market adaptability and expansion potential.
10. Piotroski F-Score > 6
Relevance: Fundamental strength is paramount in the Energy sector, characterized by capital-intensive projects. A Piotroski F-Score > 6 highlights solid operational and financial performance, critical for long-term sustainability.
Score Interpretation:
0-4 Points: Indicates potential weaknesses across critical financial areas, necessitating closer scrutiny.
5 Points: Suggests average performance based on industry-specific criteria.
6-10 Points: Signifies strong overall financial health and quality, aligning with the demanding requirements of the Energy sector.
Development and Context:
The selection and weighting of these specific financial metrics underwent rigorous industry-specific research to ensure their applicability and reliability within the unique operational environment of the Energy sector. This scoring framework aims to provide actionable insights for stakeholders navigating the complexities of Energy industry investments and operations.
Disclaimer: This information serves as an educational resource on financial evaluation methodology tailored for the Energy sector. It does not constitute financial advice or a guarantee of future performance. Consult qualified professionals for personalized financial guidance based on your specific circumstances and investment objectives.

US Net LiquidityAnalysis of US Net Liquidity: A Comprehensive Overview
Introduction:
The "US Net Liquidity" indicator offers a detailed analysis of liquidity conditions within the United States, drawing insights from critical financial metrics related to the Federal Reserve (FED) and other government accounts. This tool enables economists to assess liquidity dynamics, identify trends, and inform economic decision-making.
Key Metrics and Interpretation:
1. Smoothing Period: This parameter adjusts the level of detail in the analysis by applying a moving average to the liquidity data. A longer smoothing period results in a smoother trend line, useful for identifying broader liquidity patterns over time.
2. Data Source (Timeframe): Specifies the timeframe of the data used for analysis, typically daily (D). Different timeframes can provide varying perspectives on liquidity trends.
3. Data Categories:
- FED Balance Sheet: Represents the assets and liabilities of the Federal Reserve, offering insights into monetary policy and market interventions.
- US Treasury General Account (TGA): Tracks the balance of the US Treasury's general account, reflecting government cash management and financial stability.
- Overnight Reverse Repurchase Agreements (RRP): Highlights short-term borrowing and lending operations between financial institutions and the Federal Reserve, influencing liquidity conditions.
- Earnings Remittances to the Treasury: Indicates revenues transferred to the US Treasury from various sources, impacting government cash flow and liquidity.
4. Moving Average Length: Determines the duration of the moving average applied to the data. A longer moving average length smoothens out short-term fluctuations, emphasizing longer-term liquidity trends.
Variation Lookback Length: Specifies the historical period used to assess changes and variations in liquidity. A longer lookback length captures more extended trends and fluctuations.
Interpretation:
1. Data Retrieval: Real-time data from specified financial instruments (assets) is retrieved to calculate balances for each category (FED, TGA, RRP, Earnings Remittances).
2. Global Balance Calculation: The global liquidity balance is computed by aggregating the balances of individual categories (FED Balance - TGA Balance - RRP Balance - Earnings Remittances Balance). This metric provides a comprehensive view of net liquidity.
3. Smoothed Global Balance (SMA): The Simple Moving Average (SMA) is applied to the global liquidity balance to enhance clarity and identify underlying trends. A rising SMA suggests improving liquidity conditions, while a declining SMA may indicate tightening liquidity.
Insight Generation and Decision-Making:
1. Trend Analysis: By analyzing smoothed liquidity trends over time, economists can identify periods of liquidity surplus or deficit, which can inform monetary policy decisions and market interventions.
2. Forecasting: Understanding liquidity dynamics aids in economic forecasting, particularly in predicting market liquidity, interest rate movements, and financial stability.
3. Policy Implications: Insights derived from this analysis tool can guide policymakers in formulating effective monetary policies, managing government cash flow, and ensuring financial stability.
Conclusion:
The "US Net Liquidity" analysis tool serves as a valuable resource for economists, offering a data-driven approach to understanding liquidity dynamics within the US economy. By interpreting key metrics and trends, economists can make informed decisions and contribute to macroeconomic stability and growth.
Disclaimer: This analysis is based on real-time financial data and should be used for informational purposes only. It is not intended as financial advice or a substitute for professional expertise.

Moving Average Crossover MonitorMoving Average Crossover Monitor: Gain Insight into Market Trends
The Moving Average Crossover Monitor is a specialized tool crafted for traders seeking to understand and predict market trends more effectively. This indicator's primary focus lies in analyzing consecutive candle movements above or below specified moving averages and providing predictive estimates based on historical data.
Key Features:
1. Consecutive Candle Tracking: The indicator meticulously counts and tracks the number of consecutive candles that close above or below a selected moving average (MA1). This tracking offers a tangible measure of trend persistence over time.
2. Historical Analysis for Future Prediction: By analyzing past trends, the indicator provides insights into potential future movements. It estimates the likelihood of upcoming candles continuing above or below the moving average based on historical patterns.
3. Dynamic Visualization: Moving averages (SMA, WMA, EMA) are dynamically plotted on the chart, clearly displaying crossover points and trend transitions.
How It Works:
1. Moving Average Calculation: Select your preferred moving average type (SMA, WMA, EMA) and define short and long periods. The indicator computes two moving averages (MA1 and MA2) based on these parameters.
2. Consecutive Candle Analysis:
- Above MA1: Tracks and counts consecutive candles closing above MA1, indicating potential bullish momentum.
- Below MA1: Tracks and counts consecutive candles closing below MA1, suggesting potential bearish sentiment.
3. Future Trend Prediction: Based on historical data of consecutive candle movements, the indicator estimates the likelihood of the next candle continuing in the same direction (above or below MA1).
Advantages for Traders:
1. Quantitative Insights: Use numerical data on consecutive candles to gauge trend strength and durability.
2. Predictive Analytics: Leverage historical patterns to anticipate future market movements and adjust trading strategies accordingly.
3. Decision Support Tool: Gain clarity on trend transitions, empowering timely and informed trading decisions.
Disclaimer:
This indicator is provided for educational purposes only and should not be considered as financial advice. Trading involves risks, and past performance is not indicative of future results. Traders should conduct their own analysis and exercise caution when making trading decisions based on any indicator or tool. Always consider risk management strategies and consult with a qualified financial advisor if needed.

VWAP DivergenceThe "VWAP Divergence" indicator leverages the VWAP Rolling indicator available in TradingView's library to analyze price and volume dynamics. This custom indicator calculates a rolling VWAP (Volume Weighted Average Price) and compares it with a Simple Moving Average (SMA) over a specified historical period.
Advantages:
1. Accurate VWAP Calculation: The VWAP Rolling indicator computes a VWAP that dynamically adjusts based on recent price and volume data. VWAP is a vital metric used by traders to understand the average price at which a security has traded, factoring in volume.
2. SMA Comparison: By contrasting the rolling VWAP from the VWAP Rolling indicator with an SMA of the same length, the indicator highlights potential divergences. This comparison can reveal shifts in market sentiment.
3. Divergence Identification: The primary purpose of this indicator is to detect divergences between the rolling VWAP from VWAP Rolling and the SMA. Divergence occurs when the rolling VWAP significantly differs from the SMA, indicating potential changes in market dynamics.
Interpretation:
1. Positive Oscillator Values: A positive oscillator (difference between rolling VWAP and SMA) suggests that the rolling VWAP, derived from the VWAP Rolling indicator, is above the SMA. This could indicate strong buying interest or accumulation.
2. Negative Oscillator Values: Conversely, a negative oscillator value indicates that the rolling VWAP is below the SMA. This might signal selling pressure or distribution.
3. Divergence Signals: Significant divergences between the rolling VWAP (from VWAP Rolling) and SMA can indicate shifts in market sentiment. For instance, a rising rolling VWAP diverging upwards from the SMA might suggest increasing bullish sentiment.
4. Confirmation with Price Movements: Traders often use these divergences alongside price action to confirm potential trend reversals or continuations.
Implementation:
1. Length Parameter: Adjust the Length input to modify the lookback period for computing both the rolling VWAP from VWAP Rolling and the SMA. A longer period provides a broader view of market sentiment, while a shorter period is more sensitive to recent price movements.
2. Visualization: The indicator plots the VWAP SMA Oscillator, which visually represents the difference (oscillator) between the rolling VWAP (from VWAP Rolling) and SMA over time.
3. Zero Line: The zero line (gray line) serves as a reference point. Oscillator values crossing above or below this line can be interpreted as bullish or bearish signals, respectively.
4. Contextual Analysis: Interpret signals from this indicator in conjunction with broader market conditions and other technical indicators to make informed trading decisions.
This indicator, utilizing the VWAP Rolling component, is valuable for traders seeking insights into the relationship between volume-weighted price levels and traditional moving averages, aiding in the identification of potential trading opportunities based on market dynamics.
