Ichimoku PourSamadi Signal [TradingFinder] KijunSen Magic Number🔵 Introduction
The Ichimoku Kinko Hyo system is one of the most comprehensive market analysis tools ever created. Developed by Goichi Hosoda, a Japanese journalist in the 1930s, its purpose was to allow traders to recognize the balance between price, time, and momentum at a single glance. (In Japanese, Ichimoku literally means “one look.”)
At the core of the system lie five key components: Tenkan-sen (Conversion Line), Kijun-sen (Baseline), Chikou Span (Lagging Line), and the two leading spans, Senkou Span A and Senkou Span B, which together form the well-known Kumo or cloud representing both temporal structure and equilibrium zones in the market.
Although Ichimoku is commonly used to identify trends and support/resistance levels, a deeper layer of time philosophy exists within it. Ichimoku was not designed solely for price analysis but equally for time analysis.
In the classical model, the numerical cycles 9, 26, 52 reflect the natural rhythm of the market originally based on the Tokyo Stock Exchange’s trading schedule in the 1930s.
These values repeat across the system’s calculations, forming the foundation of Ichimoku’s time symmetry where price and time ultimately seek equilibrium.
In recent years, modern analysts have explored new approaches to extract time-based turning points from Ichimoku’s structure. One such approach is the analysis of flat segments on the Kijun-sen and Senkou B lines.
Whenever one of these lines remains flat for a period, it signals temporary balance between buyers and sellers; when the flat breaks, the market exits equilibrium and a new cycle begins.
This indicator is built precisely upon that philosophy. Following the timing methodology introduced by M.A. Poursamadi, the focus shifts away from price signals and line crossovers toward identifying flat periods on Kijun-sen (period 52) as time anchors.
From the first candle that changes the line’s slope, the tool begins a temporal count using a fixed sequence of key numbers: 5, 9, 13, 17, 26, 35, 43, 52, 63, 72, 81, 90.
Derived from both classical Ichimoku cycles and empirical testing, these numbers mark potential timing nodes where a market wave may end, a correction may begin, or a new leg may form.
Thus, this method serves not merely as another Ichimoku tool but as a temporal metronome for market structure a way to visualize moments when the market is ready to change rhythm, often before candles reveal it.
🔵 How to Use
The Kijun Timing BoX is built entirely on Ichimoku’s concept of time analysis.
Its core idea is that within every flat segment of the Kijun-sen, the market enters a temporary balance between opposing forces.
When that flat breaks, a new time cycle begins. From that first breakout candle, the indicator starts counting forward through the predefined time sequence(5, 9, 13, 17, 26, 35, 43, 52, 63, 72, 81, 90).
This counting framework creates a temporal map of market behavior, where each number represents an area where meaningful price fluctuations often occur.
A “meaningful fluctuation” does not necessarily imply reversal or continuation; rather, it marks a moment when the market’s internal energy balance shifts, typically visible as noticeable reactions on lower timeframes.
🟣 Identifying the Anchor Point
The first step is recognizing a valid flat zone on the Kijun-sen.
When this line remains flat for several candles and then changes slope, the indicator marks that bar as the Anchor, initiating the time count.
From that point onward, vertical gray lines appear at each interval in the key-number sequence, visualizing the time nodes ahead.
🟣 Reading the Timing Lines
Each numbered line represents a timing node a temporal point where a change in price rhythm is statistically more likely to occur.
At these nodes, the market may :
Enter a consolidation or minor correction phase.
Develop range-bound movement.
Or simply alter the speed and intensity of its move.
These behaviors do not imply a specific direction; they only highlight zones where time-based activity tends to cluster, giving traders a clearer view of cyclical rhythm.
🟣 Applying Time Analysis
The indicator’s primary use is to observe temporal order, not to predict price direction.
By tracking the distance between Anchors and the reactions that appear near major timing lines, traders can empirically identify each market’s characteristic rhythm—its own time DNA.
For example, one asset may consistently show significant fluctuations around the 13- and 26-bar marks,while another might react closer to 9 or 52. Recognizing such patterns helps traders understand how long typical cycles last before new phases of volatility emerge.
🟣 Combining with Other Tools
The indicator does not generate buy/sell signals on its own.
Its best use is in combination with price- or structure-based methods, to see whether meaningful price reactions occur around the same timing nodes.
In practice, it helps distinguish structured time-based fluctuations from random, noise-driven moves an insight often overlooked in conventional market analysis.
🔵 Settings
🟣 Logical Settings
KijunSen Period : Defines the baseline period used for timing analysis. Default = 52. It is the main line for detecting flats and generating time anchors.
Flat Event Filter : Controls how flat segments are validated before triggering a new timing event.
All : Every flat triggers a new Timing Box.
Automatic : Only flats longer than the historical average are used (recommended).
Custom : User manually defines the minimum flat length via Custom Count.
Update Timing Analysis BoX Per Event : If enabled, a new Timing Box is drawn each time a new flat event occurs. If disabled, the box completes its 90-bar window before refreshing.
🟣 Ichimoku Settings
TenkanSen Period : Defines the period for the Conversion Line (Tenkan-sen). Default = 9.
KijunSen Period : Sets the standard Ichimoku baseline (not the timing line). Default = 26.
Span B Period : Defines the period for Senkou Span B, the slower cloud boundary. Default = 52.
Shift Lines : Offsets cloud projection into the future. Default = 26.
🟣 Display Settings
Users can show or hide all Ichimoku lines Tenkan-sen, Kijun-sen, Chikou Span, Span A, and Span B as well as the Ichimoku Cloud.
They can also customize the color of each element to match personal chart preferences and improve visibility.
🔵 Conclusion
This analytical approach transforms Ichimoku’s time philosophy into a visual and measurable framework. A flat Kijun-sen represents a moment of market equilibrium; when its slope shifts, a new temporal cycle begins.
The purpose is not to forecast price direction but to highlight periods when meaningful fluctuations are more likely to develop.
Through this perspective, traders can observe the hidden rhythm of market time and expand their analysis beyond price into a broader time-cycle dimension.
Ultimately, the method revives Ichimoku’s original principle: the market can only be truly understood through the simultaneous harmony of price, time, and balance.
Kijunsen

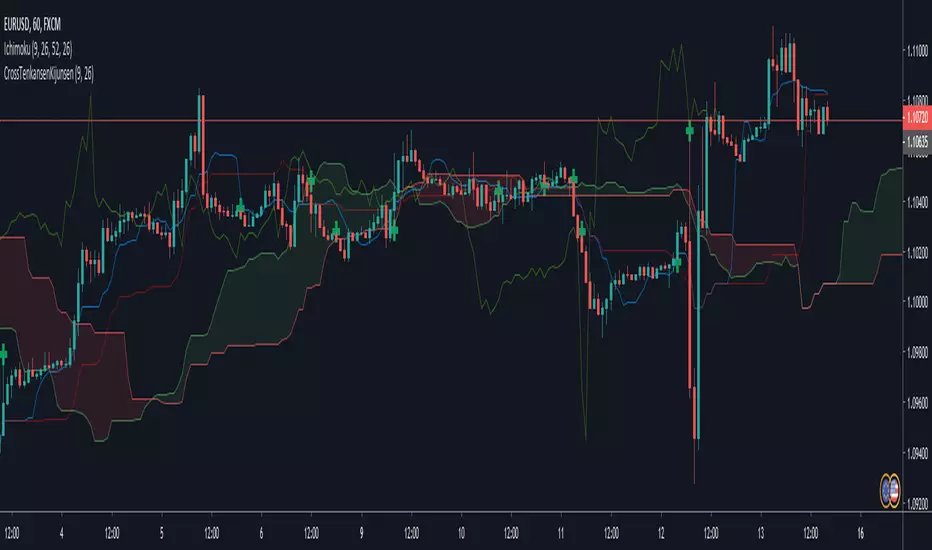
Ichimoku Cloud Indicator [TradingFinder] Kinko Hyo Cross Alerts🔵 Introduction
The Ichimoku Cloud (Ichimoku Kinko Hyo) is one of the most powerful and complete trading indicators in technical analysis. Originally developed by Japanese journalist Goichi Hosoda, the Ichimoku system combines multiple tools in one indicator, providing traders with instant insights into trend direction, support and resistance levels, and momentum. Unlike simple moving averages (SMA – Simple Moving Average), the Ichimoku Cloud (Kumo – Cloud) integrates dynamic elements that help traders forecast potential price action with greater clarity.
The Ichimoku Indicator (Ichimoku Signal System) is widely used across global markets, from Forex trading (FX – Foreign Exchange) to stocks, indices, and even cryptocurrencies. Its popularity comes from its ability to generate clear buy signals and sell signals based on the interaction of its components: Tenkan Sen (Conversion Line), Kijun Sen (Base Line), Senkou Span A, Senkou Span B, and Chikou Span (Lagging Line). When combined, these lines create the Ichimoku Cloud, which visually represents the balance between price action and market structure.
Ichimoku Cloud Lines Formulas :
Conversion Line (Tenkan Sen / Conversion Line) : Average of the highest high and lowest low over the past 9 periods => (9-PH + 9-PL) ÷ 2
Base Line (Kijun Sen / Base Line) : Average of the highest high and lowest low over the past 26 periods => (26-PH + 26-PL) ÷ 2
Leading Span A (Senkou Span A / Leading Span A) : Average of the Conversion Line and Base Line, plotted 26 periods ahead => (Tenkan Sen + Kijun Sen) ÷ 2
Leading Span B (Senkou Span B / Leading Span B) : Average of the highest high and lowest low over the past 52 periods, plotted 26 periods ahead => (52-PH + 52-PL) ÷ 2
Lagging Span (Chikou Span / Lagging Span) : Current closing price, plotted 26 periods behind.
One of the biggest advantages of the Ichimoku Trading Strategy (Ichimoku Cloud Trading System) is that it allows traders to identify the market condition at a glance. When the price is above the Kumo (Cloud), it indicates a bullish trend (uptrend). When the price is below the Kumo, the market is in a bearish trend (downtrend). And when the price is inside the cloud, the market is ranging (sideways trend). This simplicity and visual clarity make Ichimoku an essential indicator for both beginner traders and professional analysts.
The Ichimoku Cloud Indicator (Ichimoku Technical Analysis Tool) continues to be one of the most reliable charting methods. Traders often consider it superior to basic moving averages (MA – Moving Average) or exponential moving averages (EMA – Exponential Moving Average), because it not only shows trend direction but also highlights potential future support and resistance levels. With its unique combination of trend analysis, price forecasting, and trading signals, Ichimoku remains a core strategy in modern trading systems.
🔵 How to Use
The Ichimoku Cloud is more than just a set of lines; it’s a complete trading system that helps traders identify trends, momentum, and key support and resistance levels. By combining its five lines Conversion Line, Base Line, Leading Span A, Leading Span B, and Lagging Span traders can develop clear buy and sell strategies.
🟣 Identifying Trend Direction
Bullish Trend (Uptrend) : Price is above the cloud (Kumo), and the cloud is green. Leading Span A is above Leading Span B, signaling strong upward momentum.
Bearish Trend (Downtrend) : Price is below the cloud, and the cloud is red. Leading Span A is below Leading Span B, confirming a downward momentum.
Ranging / Sideways Market : Price is inside the cloud, indicating indecision and consolidation. Traders often avoid opening strong positions during these periods.
🟣 Buy Strategies
Conversion/Base Line Crossover : A buy signal occurs when the Conversion Line (Tenkan Sen) crosses above the Base Line (Kijun Sen). The signal is strongest when this crossover happens above the cloud.
Price Above Base Line : If the price moves above the Base Line while in an uptrend, it confirms bullish momentum and provides a favorable entry point.
Cloud Support Pullback : During a pullback in an uptrend, the price may touch or slightly enter the cloud. Traders can use the cloud as a dynamic support zone for buying opportunities.
Lagging Span Confirmation : Ensure the Lagging Span (Chikou Span) is above the price of 26 periods ago to confirm the strength of the bullish trend.
🟣 Sell Strategies
Conversion/Base Line Crossover : A sell signal is generated when the Conversion Line (Tenkan Sen) crosses below the Base Line (Kijun Sen). This signal is strongest when it occurs below the cloud.
Price Below Base Line : If the price falls below the Base Line in a downtrend, it confirms bearish momentum and strengthens the sell setup.
Cloud Resistance Pullback : During a bounce in a downtrend, the cloud acts as a resistance zone. Traders can enter sell positions when price approaches or touches the cloud from below.
Lagging Span Confirmation : The Lagging Span should be below the price of 26 periods ago, confirming downward momentum.
🟣 Cloud Breakout Signals
A strong buy occurs when the price breaks above the cloud from below, signaling a potential trend reversal.
A strong sell occurs when the price breaks below the cloud from above, indicating a shift toward a bearish trend.
🟣 Combining Signals for Stronger Entries
For higher probability trades, combine multiple signals : trend direction (cloud color and position), crossovers (Tenkan/Kijun), and Lagging Span position.
Avoid trading against the overall trend. For example, avoid buying when price is below a red cloud or selling when price is above a green cloud.
🔵 Setting
Tenkan Sen Period : Lookback period for Conversion Line (default: 9).
Kijun Sen Period : Lookback period for Base Line (default: 26).
Span B Period : Lookback period for Leading Span B, forms one Cloud boundary (default: 52).
Shift Lines : Periods forward for Cloud / backward for Lagging Span (default: 26).
Cross Tenkan/Kijun Alert : Alert on Conversion/Base Line crossover.
Cross Price/Tenkan Alert : Alert when price crosses Tenkan Sen.
Cross Price/Kijun Alert : Alert when price crosses Kijun Sen
🔵 Conclusion
The Ichimoku Cloud (Ichimoku Kinko Hyo) is much more than a simple indicator it is a complete trading system that combines trend detection, momentum analysis, and support/resistance identification in one view. By interpreting the position of price relative to the cloud, the interaction between Tenkan Sen (Conversion Line) and Kijun Sen (Base Line), the leading spans (Senkou Span A and B), and the Chikou Span (Lagging Line), traders can identify potential buy and sell opportunities with higher confidence.
The main advantage of the Ichimoku Cloud is its ability to provide a “one-look equilibrium” snapshot of the market. It highlights bullish trends when the price is above the cloud, bearish conditions when the price is below it, and indecision or transition when the price is inside the cloud. Crossovers, cloud breakouts, and confirmations by the Chikou Span strengthen the trading signals.
However, traders should keep in mind the limitations of the Ichimoku system. It is based on historical data and should not be used in isolation. Combining it with other tools such as RSI, volume analysis, or candlestick patterns can significantly improve accuracy and reduce false signals.

Ichimoku RONIN [Lite]This Ichimoku is a Lite Edition of Ichimoku RONIN
Features :
- Ichimoku Default Lines
- Settings for Shift all of Lines
- Two Custom Periods Lines
- 9/26/52 Cycle Counter
- Optimized for Pine Script 5
- No Shifted Senko Span A Line
- New Cloud Alert
- KijunSen & TenkanSen Lines Crossed Alert
Good Trading to All ...

Ichimoku Cloud MasterIchimoku Cloud Master aims to provide the ichimoku trader with easy alert functionality to not miss out on valuable trade setups. The key purpose of this script is to better visualise crucial moments in Ichimoku trading. These alerts should not be used for botting in my opinion as they always need a human to confirm the ichimoku market structure. For example, is the Kijun-Sen flat and too far away from price? A good ichimoku trader will not enter at such a point in time.
Explanation of script:
Chikou(lagging span): pink line, this is price plotted 26 bars ago. People ignore the power of this it is crucial to see how chikou behaves towards past price action as seen in the chart below where we got an entry at red arrow because chikou bounced from past fractal bottom.
Kijun-Sen(base line): Black line or color coded line. This is the equilibrium of last 26 candles. To me this is the most important line in the system as it attracts price.
Kijun = (Highest high of 26 periods + Lowest low of 26 periods) ÷ 2
Tenkan-Sen(conversion line): Blue line. This is the equilibrium of last 9 candles. In a strong uptrend price stays above this line.
Tenkan = (Highest high of 9 periods + Lowest low of 9 periods) ÷ 2
Senkou A (Leading span A)= Pink cloud line, this is the average of the 2 components projected 26 bars in the future.
Senkou A = (Tenkan + Kijun) ÷ 2
Senkou B (Leading span B) = Green cloud line, this is the 52 day equilibrium projected 26 bars in the future.
Senkou B = (Highest high of prior 52 periods + Lowest low of prior 52 periods) ÷ 2
Notice how the distance between Chikou and the cloud is also 52 bars. This is all part of Hosoda's numbers which I am not going to explain here.
Fractals: These are the black triangles you find at key turning point. If you want to know how they work reseach williams fractals. I've used fractals with a period of 9 as it is an ichimoku number. These fractals are useful when working with ichimoku wave theory. Again I will not explain that here but in further education
Fractal Support: Ability to extend lines from the fractals which can be used as an entry/exit mechanism in your trading. For example wait for tenkan to cross kijun and then enter on fractal breakout.
Signals:
Crossing of Chikou (lagging span) with past Kijun-Sen: this will color code the Bars / Kijun-Sen (you can turn this off in options)
The script also has a signal for this, this will be the green and purple diamonds. Where green is bullish and purple is bearish.
wy is this important?
When current price plotted 26 candles back (chikou) crosses over the past equilibrium (kijun-sen) this usualy means price has moved past resistance levels where sellers come in. This indicates a switch in market structure and price is bullish from this point, this is the same in the other direction.
Kumo Twist: when the kumo cloud (future) has a crossover from for example green to red (bull to bear). The script plots these using the colored cross symbols as seen in the picture above. A chikou cross + a Kumo twist at same bar of next to eachother below the cloud can be a great entry sign: this would be an entry after cross in the chart above.
Kijun Bounce: when in an uptrend the price retraces back to Kijun-Sen and starts to go back up. These are marked by the yellow circles as seen in chart below:
low below Kijun-Sen and close above it
Strong Trend: when Tenkan is above Kijun, price above cloud, future cloud green, chikou above close, chikou above Kijun we establish a strong bullish trend. For bearish the exact opposite. The script has a function to send an alert at the start of such trends and to plot them with small colored circles above the bars.
Customisation:
I've added options to disable specific aspects of the indicator for those traders who do not want to use all aspects of the indicator. In the customisation tab I've given each part a clear title so you can use your own colors/shapes.
The perfect entry?
Further info:
Look into my education pane, I will be adding education in the future. The chance of me making a more advanced version of the script including line forecasting etc is rather high so watch out for that.
For those who want to master this system I recommend reading the book:
How to make money with the ichimoku system by Balkrishna M. Sadekar
Or the originals books by Hosoda the inventor of Ichimoku if you can get your hands on them and can read Japanese.
Almost all info about the ichimoku system you find on the internet will lose you money because they reduce the system to simple signals that do not generate money.
I will be providing educational material on tradingview using this indicator.

Ichimoku CrossThis is a trend analysis indicator based on Ichimoku
this indicator splits the chart into :
"Buy Phase" where KijunSen > TenkanSen with "Green color"
"Sell Phase" where KijunSen < TenkanSen with "Red color"
"Cross Phase" where KijunSen = TenkanSen
Close of each candle above or below KijunSen and TenkanSen determine the strength of the trend
and is shown by 3 different green colors for Bullish Trends and 3 different red colors for Bearish Trends .

Ichimoku RONINA Full version of Ichimoku Kinko Hyo with many features ...
Features :
- Ichimoku Default Lines
- Settings for Shift all of Ichimoku Lines
- 52, 103, 108, 216 Periods Line
- Future TenkanSen, Kijunsen & Kumo Clouds
- 9/26/52 Cycle Counter
- Optimized for Pine Script 5

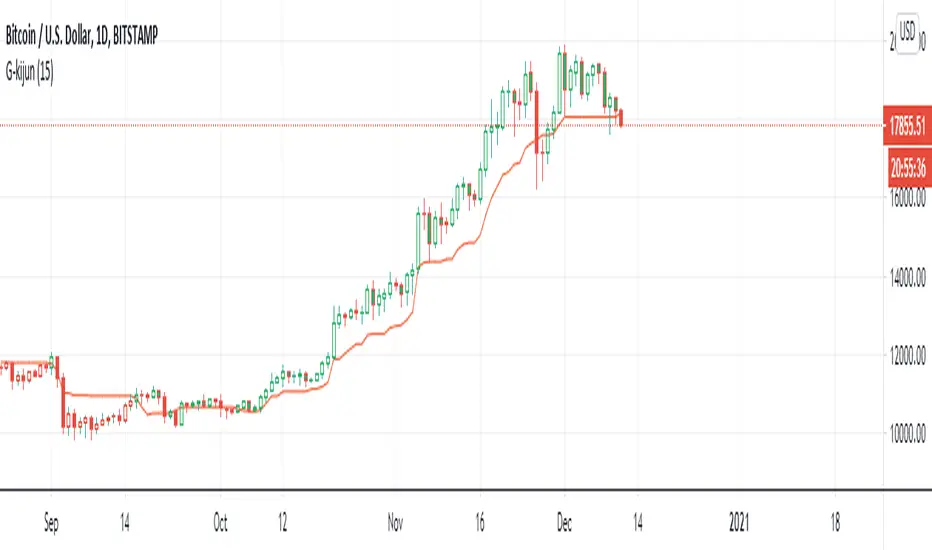
G-Kijun trailing stopThis indicator is the part of ichimoku kyo hyo.
I luv kijun-sen very much
kijun-sen is develop form (Highest - Lowest)/2
It's mean 50% of fibonacci
and I create color Green for price over the kijun-sen when the price cross down the kijun-sen it'sll be Red
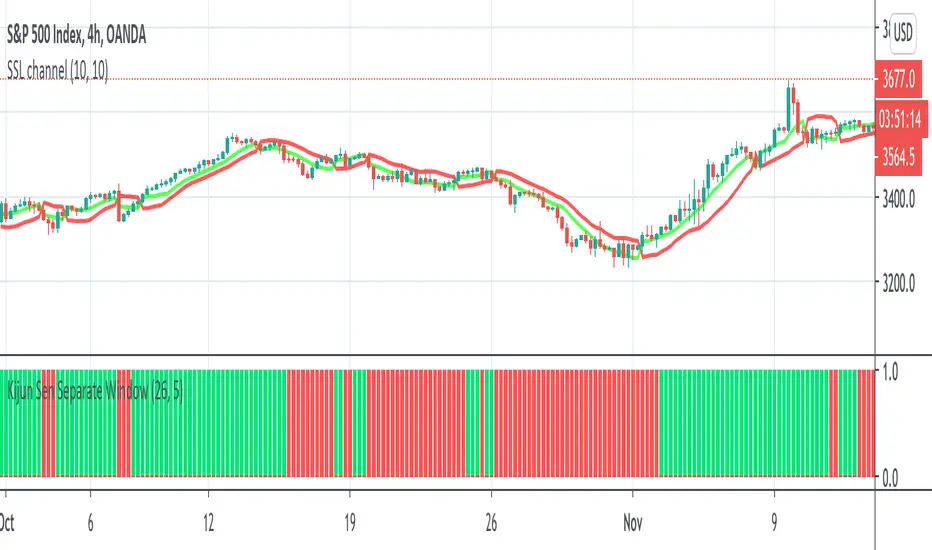
Kijun Sen Separate WindowThis indicator works the same as a regular Kijun Sen but it is on a separate window to allow for other on chart indicators.
I tend to use this as a filter for when to go long/short.
When it is green, I only take longs. When it is red, I only take shorts. Combine with other indicators of your choice.
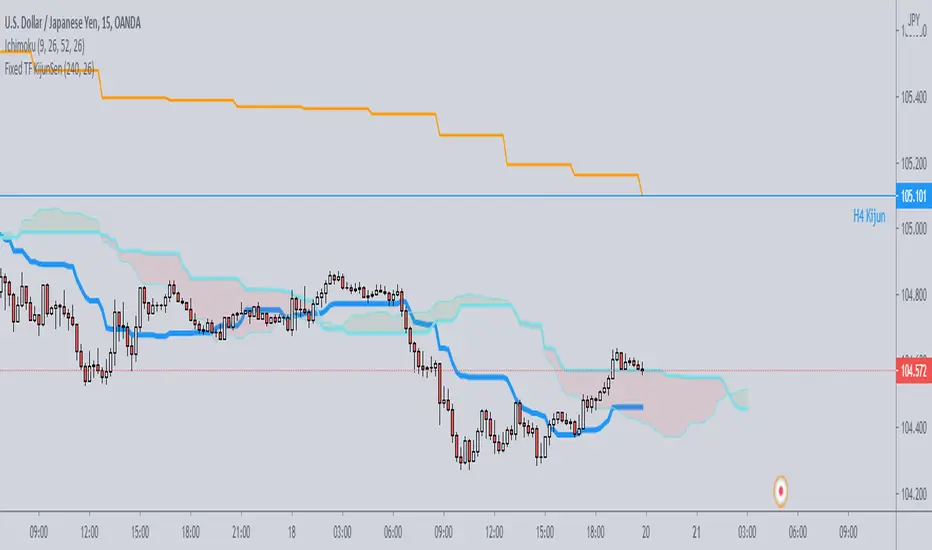
Fixed TF KijunSenJust a simple script which plots on any timeframe the kijunsen of a single specific timeframe, selectable by the user.
Useful for strategies which need to work on various timeframes, but need the kijun of that specific timeframe to be always visible for the analysis.
Ichimoku Kumo Switch Indicator [Mehdihz]This simple indicator just shows Ichimoku's Kumo cloud status.
Blue for increasing Kumo
Red for decreasing Kumo

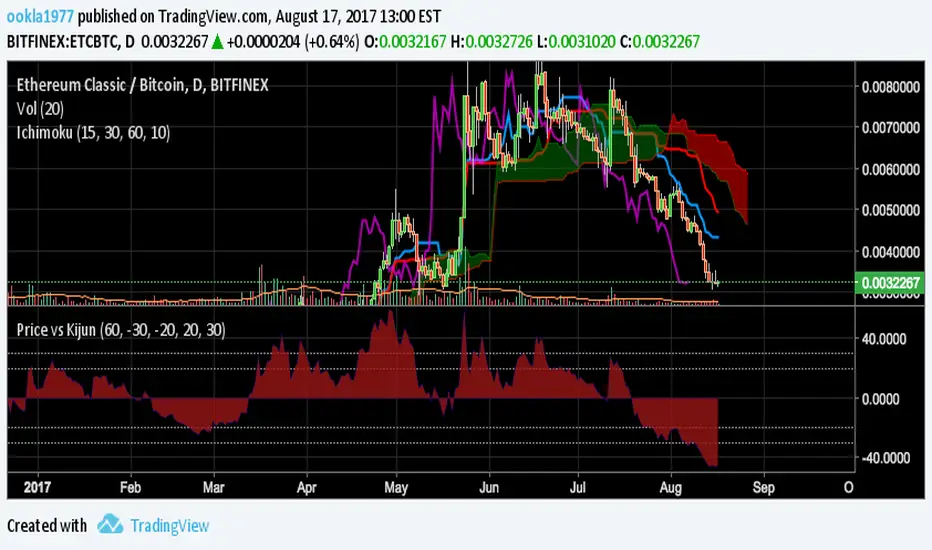
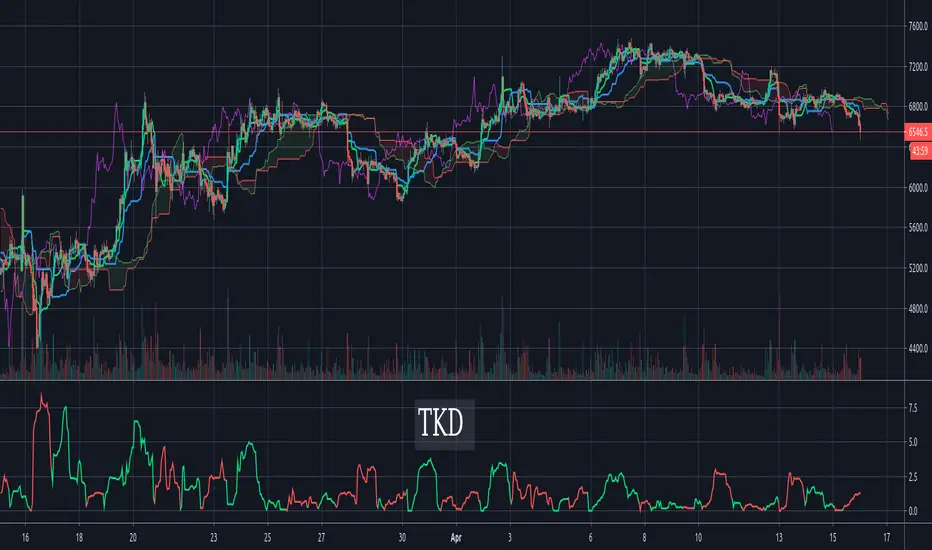
Tenkan-Sen Kijun-Sen Distance (TKD) Oscillator - IchimokuThe TKD is the distance between the Tenkan-Sen and the Kijun-Sen, expressed in percentage of current price. The further apart the tenken-sen and kijun-sen are, the more they want to snap back together. This makes for a decent oscillator. When the Tenkan-Sen is above the Kijun-Sen, the TKD is green. When it is below, the TKD is red. At the crossing points, it turns blue.
For those more familiar with Ichimoku Cloud techniques, one might also think of this indicator as a C-Clamp indicator. Bar coloring is supported and enabled by default. There's also an option to flip/invert the green/red colors in case you want to use it to judge pending cycles rather than current ones.
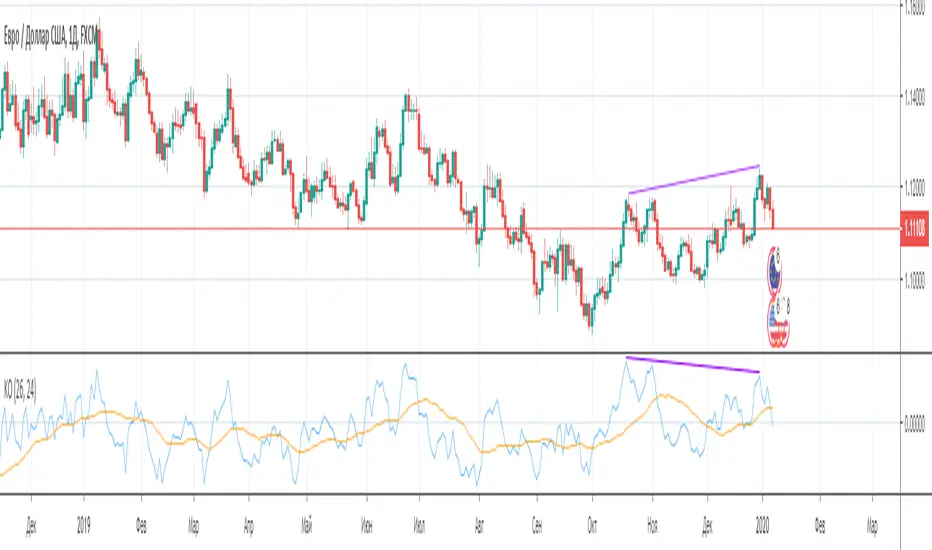
Kijun Oscillator [-W-]Eng.
Kijun is one of the lines of the Ichimoku indicator.
The indicator shows the relative deviation of the price from this line.
This indicator can be used to determine divergences, market phases, and all that other oscillators show. )
Rus .
Kijun - одна из линий индикатора Ишимоку.
Индикатор показывает относительное отклонение цены от этой линии.
По этому индикатору можно определять дивергенции, фазы рынка и всё то, что показывают другие осцилляторы. )
Kijun-sen Colored [aamonkey]I isolated the Kijun-sen from the Ichimoku Cloud and colored it.
You can do major damage by just entering when the price closes above the Kijun-sen and sell when it is the other way around.
Add some other confirmation indicators to filter some false breakouts and you are good to go.