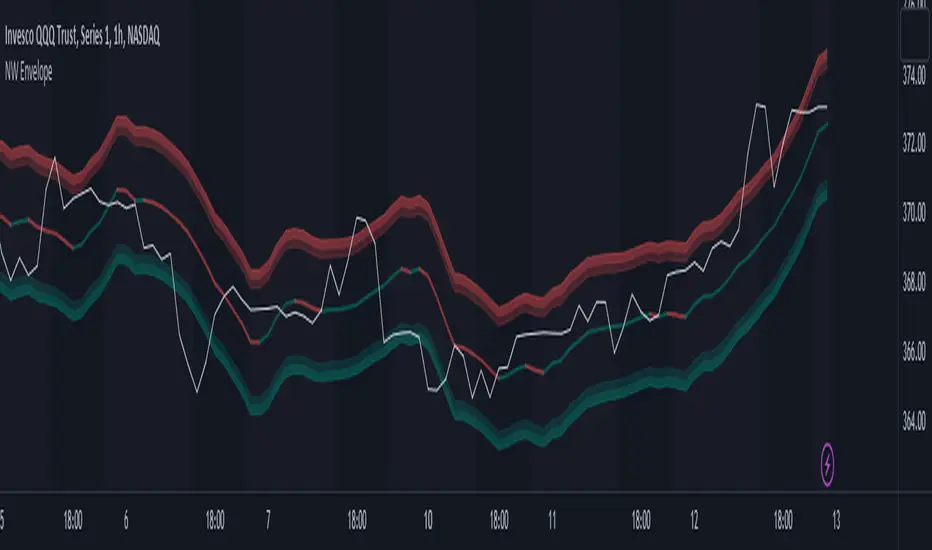
Adaptive Price Channel (log scale)The field of technical analysis is consistently expanding, with numerous indicators used for market forecasting. Amongst them, a novel indicator dubbed the Adaptive Price Channel (log scale), inspired by the renowned Nadaraya-Watson Envelope (LuxAlgo) from LuxAlgo, is gaining traction for its distinctive features and versatility. Unlike its predecessor, the Adaptive Price Channel (log scale) is applicable on a logarithmic scale, thereby allowing it to be utilized on both smaller and larger timeframes.
1. Key Features
The Adaptive Price Channel (log scale) is founded on the trading view Pinescript language, version 5, with its primary aim to maximize the versatility and scalability of trading indicators. It allows traders to adapt it according to their preferred timeframe, thereby making it applicable for a wide range of trading strategies.
Its bandwidth can be adjusted through the input parameters, offering traders the flexibility to manipulate the indicator according to their strategic requirements. Furthermore, it provides an option for repainting smoothing. This option enables users to control the repainting effect in which the historical output of the indicator may change over time. When disabled, the indicator provides the endpoints of the calculations, ensuring consistency in historical values.
Moreover, the Adaptive Price Channel (log scale) allows for color customization, thereby improving visibility and user-friendliness. The colors of the indicator's upward and downward directions can be changed according to the user's preference.
2. Working Mechanism
The Adaptive Price Channel (log scale) uses the logarithm of the source, which is typically the closing price of a trading instrument. It leverages a Gaussian function that exponentially decreases the further the price moves away from the mean, accounting for both positive and negative values. The bandwidth of the Gaussian function can be adjusted to adapt to different market conditions.
Additionally, the Adaptive Price Channel (log scale) features an array of 500 lines for each bar, which helps in defining the boundaries or envelope for price movements. The calculations are executed using the Nadaraya-Watson estimator, which uses kernel regression for non-parametric analysis.
The calculated values for the upper and lower bounds of the envelope are then converted back from the logarithmic scale using the exponential function. This calculation process continues for each bar until the last bar in the data set.
To ensure optimal performance, the Adaptive Price Channel (log scale) uses dynamic repainting. If the repainting mode is enabled, it adjusts the smoothing of the indicator for the entire historical data, making the results more accurate.
3. Visualization and Alerts
The Adaptive Price Channel (log scale) offers an array of visual aids, including labels and plots. The upper and lower bounds of the envelope are plotted, and the indicator triggers labels at points where the closing price crosses these boundaries. These labels serve as alerts for potential trading opportunities.
4. Conclusion
The Adaptive Price Channel (log scale) is an innovative and adaptable trading indicator, drawing inspiration from its predecessor but introducing unique features to increase its versatility. By providing a repainting option, it ensures consistent historical values, thereby enhancing the reliability of the indicator. Furthermore, the capability to operate on a logarithmic scale broadens its usability for different timeframes. The Adaptive Price Channel (log scale) is a powerful tool for any trader, facilitating a better understanding of market dynamics, and enabling more informed decision-making.
LOGARITHMIC
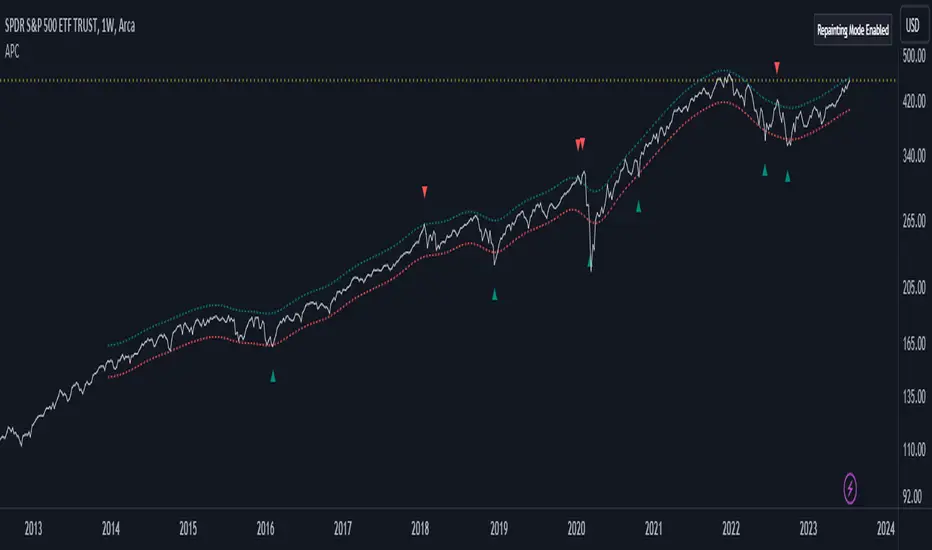
Nadaraya-Watson Envelope (Non-Repainting) Logarithmic ScaleIn the fast-paced world of trading, having a reliable and accurate indicator can make all the difference. Enter the Nadaraya-Watson Envelope Indicator, a cutting-edge tool designed to provide traders with valuable insights into market trends and potential price movements. In this article, we'll explore the advantages of this non-repainting indicator and how it can empower traders to make informed decisions with confidence.
Accurate Price Analysis:
The Nadaraya-Watson Envelope Indicator operates in a logarithmic scale, allowing for more accurate price analysis. By considering the logarithmic nature of price movements, this indicator captures the subtle nuances of market dynamics, providing a comprehensive view of price action. Traders can leverage this advantage to identify key support and resistance levels, spot potential breakouts, and anticipate trend reversals.
Non-Repainting Reliability:
One of the most significant advantages of the Nadaraya-Watson Envelope Indicator is its non-repainting nature. Repainting indicators can mislead traders by changing historical signals, making it difficult to evaluate past performance accurately. With the non-repainting characteristic of this indicator, traders can have confidence in the reliability and consistency of the signals generated, ensuring more accurate backtesting and decision-making.
Customizable Parameters:
Every trader has unique preferences and trading styles. The Nadaraya-Watson Envelope Indicator offers a range of customizable parameters, allowing traders to fine-tune the indicator to their specific needs. From adjusting the lookback window and relative weighting to defining the start of regression, traders have the flexibility to adapt the indicator to different timeframes and trading strategies, enhancing its effectiveness and versatility.
Envelope Bounds and Estimation:
The Nadaraya-Watson Envelope Indicator calculates upper and lower bounds based on the Average True Range (ATR) and specified factors. These envelope bounds act as dynamic support and resistance levels, providing traders with valuable reference points for potential price targets and stop-loss levels. Additionally, the indicator generates an estimation plot, visually representing the projected price movement, enabling traders to anticipate market trends and make well-informed trading decisions.
Visual Clarity with Plots and Fills:
Clear visualization is crucial for effective technical analysis. The Nadaraya-Watson Envelope Indicator offers plots and fills to enhance visual clarity and ease of interpretation. The upper and lower boundaries are plotted, along with the estimation line, allowing traders to quickly assess price trends and volatility. Fills between the boundaries provide a visual representation of different price regions, aiding in identifying potential trading opportunities and risk management.
Conclusion:
The Nadaraya-Watson Envelope Indicator is a powerful tool for traders seeking accurate and reliable insights into market trends and price movements. With its logarithmic scale, non-repainting nature, customizable parameters, and visual clarity, this indicator equips traders with a competitive edge in the financial markets. By harnessing the advantages offered by the Nadaraya-Watson Envelope Indicator, traders can navigate the complexities of trading with confidence and precision. Unlock the potential of this advanced indicator and elevate your trading strategy to new heights.
Linear Regression Channel (Log)The Linear Regression Channel (Log) indicator is a modified version of the Linear Regression channel available on TradingView. It is designed to be used on a logarithmic scale, providing a different perspective on price movements.
The indicator utilizes the concept of linear regression to visualize the overall price trend in a specific section of the chart. The central line represents the linear regression calculation, while the upper and lower lines indicate a certain number of standard deviations away from the central line. These bands serve as support and resistance levels, and when prices remain outside the channel for an extended period, a potential reversal may be anticipated.
I have replaced the Pearson values with trend strength levels to enhance understanding for individuals unfamiliar with Pearson correlation.

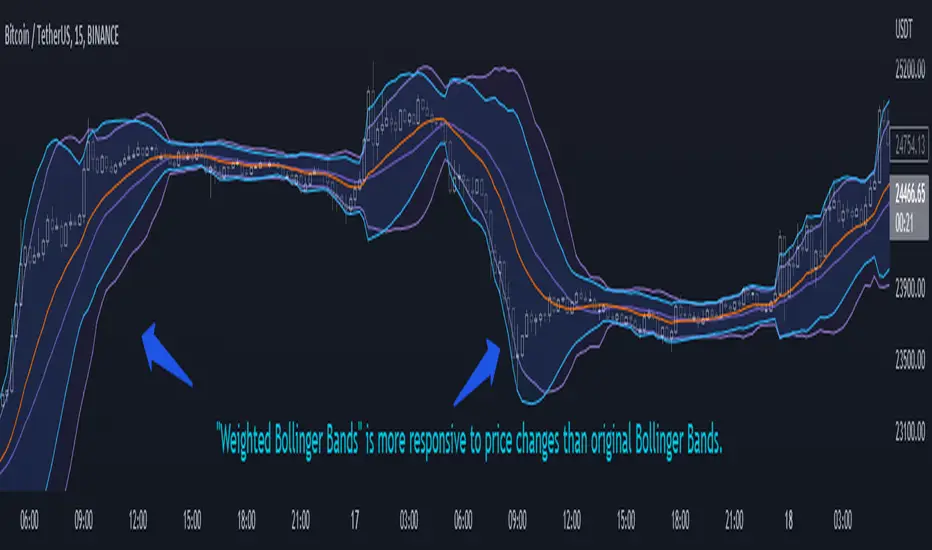
Weighted Bollinger Band (+ Logarithmic)ENG)
Weighted BB is more responsive to price changes than original Bollinger Bands.
the calculation formula uses a weighted method based on the current price.
Instead of using a standard deviation, I used a weighted standard deviation that weights the current price, and instead of a simple moving average, I used a weighted moving average.
Also included is a formula to log the Bollinger Bands for users who view charts on a logarithmic scale.
KOR)
원본 볼밴보다 가격변화에 대한 반응성이 높습니다.
계산식에는 현재가격에 가중을 주는 방식을 사용하였습니다.
표준편차를 사용하는 대신 저는 현재가격에 가중을 두는 가중표준편차를 사용하였고, 단순이동평균 대신 가중이동평균을 사용하였습니다.
또한 로그스케일로 차트를 보는 유저를 위해 볼린저밴드를 log화 하는 수식도 포함하였습니다.
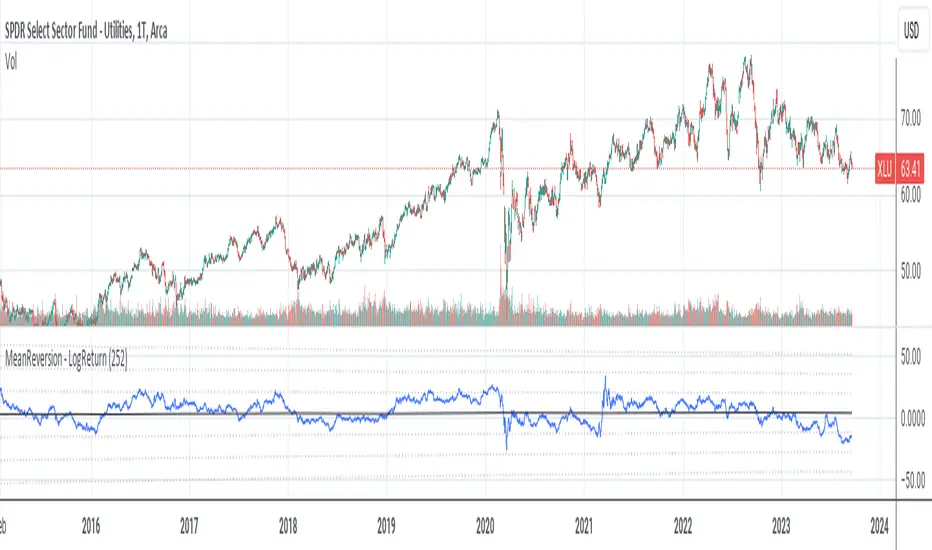
MeanReversion by Logarithmic ReturnsMean reversion is a financial term for the assumption that an asset will return to its mean value.
This indicator calculate the logarithmic returns (logReturn) of an asset over a period of time and show the values of logRerturn, mean and standart deviations.
The default time period for logReturn calculation is 252 bars at a "Daily" chart. At a "Daily" chart 252 bar means one trading-year.
See also:
MeanReversion by Volatility
Hussarya Volume cumulated. Buy Sell.
Volume frome curent chart or cumulated volume from Binance, Bybit Kraken, Ftx and Coinbase.
You can chose also. log scale on simple or cumulated volume.
Colors:
Grey. total volume
Red. sell Volume
Green. Buy volume
Red or green shows only bigger value

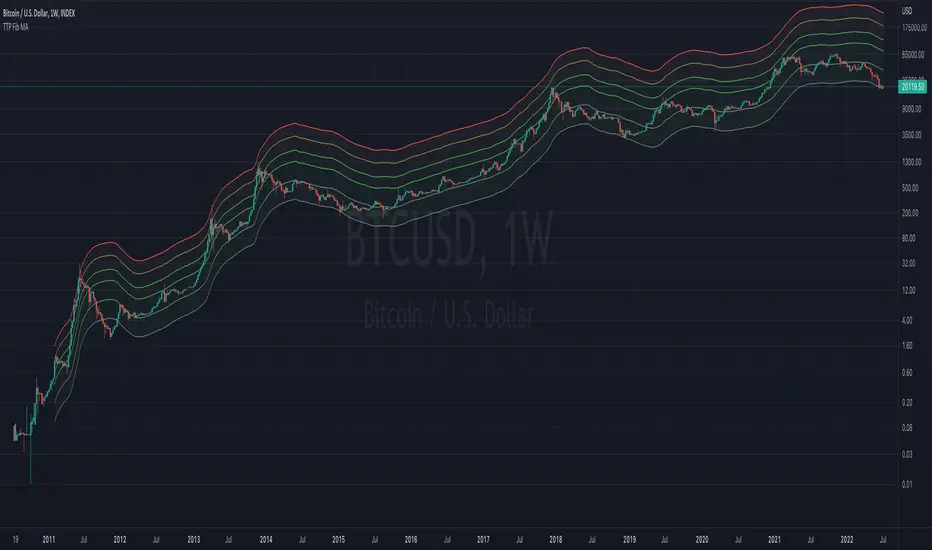
TTP Fibonacci MAThis indicator offers a fibonacci rainbow of moving averages.
Recommended instructions:
- timeframe: daily or weekly
- logarithmic scale
- default MA length for smoother curve
- fib levels used are 0.5,1,2,3,5 and 8, but you can also try with 1,2,3,5,8,13 or 0.33,05,1,2,3 depending on which range you want to cover
- you can render in weekly timeframe and still set the indicator settings timeframe to daily to get more reactive levels
L'MACD GUNHi all!
I would like to present you my universal MACD module.
In addition to the standard functions I have added several improvements:
Source Selection.
In addition to the standard calculation of the moving average "EMA", in the parameter "MA Type" I have added 52 more methods for calculating the MA! :
ADXMA, AHMA, ALF, ALMA, ARI, ARSI, BlackFilter, CTI, DoubleEma, DTA, DWMA, EEO, EHMA, ELA, EMARSI, EREA, HEMA, hma, HWMA, JAMA, KA, KAMA, LSMA, LWMA, McGinley_2, MNMA, PAW, REMA, rma, RMF, RMTA, RWMA, sma, SMMA, SuperSmooth, THMA, TilsonT3, TMA, TRAMA, TripleEma, TSF, VAMA, VAR, VHMA, VIDYA, VVMA, vwma, WCD, wma, WWMA, ZEMA, ZLMA !
Additional histogram and lines from the higher timeframe. With the parameter "Multiple of TF" you can specify on which timeframe the standard histogram should be zoomed.
The Zoom function allows increasing or decreasing the size of the histogram. (It does not affect the calculations in any way, it is only used for visualization purposes.)
How to use it?
I recommend using it as a standard MACD. You can test different types of moving averages thanks to my modules and choose the one you find most suitable.
Tips:
The script is slightly heavy and may take a little longer to load than usual.
All MA types are in alphabetical order and tied to numbers.
Next to the "MA Type" parameter there is a hint which method of calculating MA corresponds to the figure. The default is 15. In the hint 15 = EMA. This is the standard method of calculating the MAСD.
To select the MA more quickly. You can switch them with the mouse wheel or the arrows on the keyboard.
I use the standard parameters prescribed in the script.
The code is calibrated for any TF and displays as correctly as possible. Can be used on any type of chart.

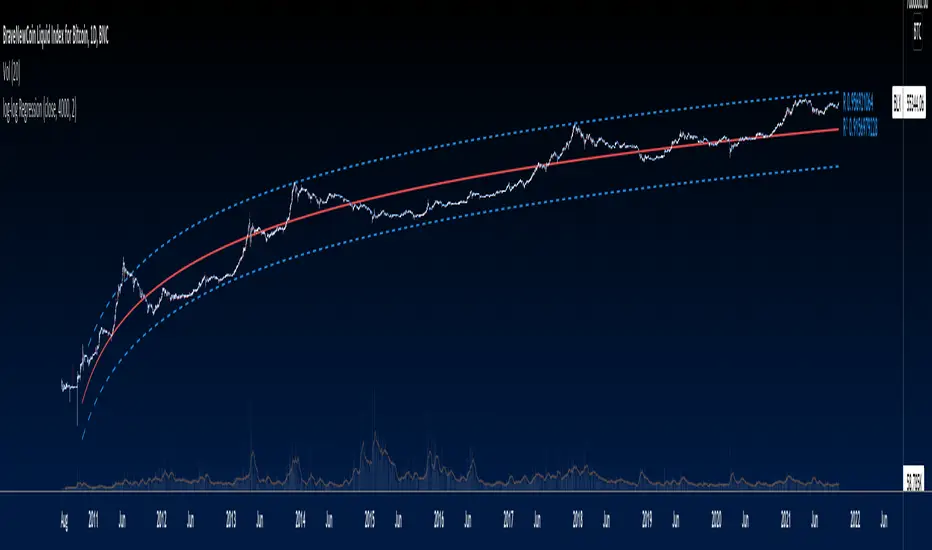
Bitcoin Best Value CorridorHere is my interpretation of the "Best Time To Buy" Bitcoin over its lifetime using a logarithmic regression trendline. The upper and lower lines are 10% deviations from the centre line. I calculated the trendline in excel and then coded my results into pine script.

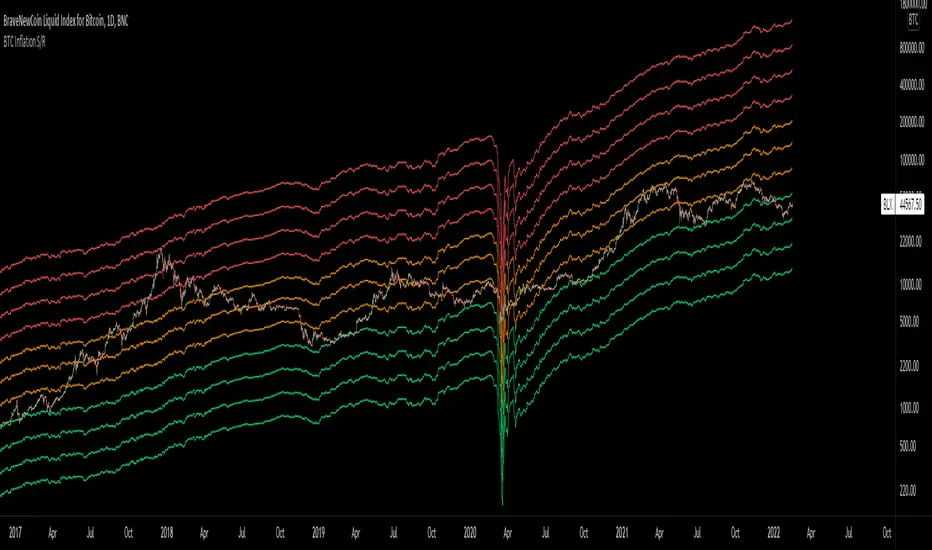
Bitcoin Inflation-Adjusted Support and Resistance5year breakeven inflation rate fitted for log BTC chart as Support and Resistance
Logarithmic Bollinger BandsLogarithmic Bollinger Bands
Published by Eric Thies on January 14, 2022
Summary
In this script I have taken the standard Bollinger band pinescript and made efforts to eliminate the behavior experienced in periods of high volatility in which we see the bands disappear completely off the chart by adding exponential plotting and logarithmic sourcing to the tool.
This tool will also show periods of Bearish and Bullish Expansion for users to see when volatility is running high in the market.
More On Bollinger Bands
Bollinger Bands consist of a center line representing the moving average of a security’s price over a certain period, and two additional parallel lines (called the upper and lower trading bands) one of which is just the moving average plus k-times the standard deviation over the selected time frame, and the other being the moving average minus k-times the standard deviation over that same timeframe. This technique has been developed in the 1980’s by John Bollinger, who lately registered the terms “Bollinger Bands” as a U.S. trademark in 2011. Technical analysts typically use 20 periods and k = 2 as default settings to build Bollinger Bands, while they can choose a simple or exponential moving average. Bollinger Bands provide a relative definition of high and low prices of a security. When the security is trading within the upper band, the price is considered high, while it is considered low when the security is trading within the lower band.
There is no general consensus on the use of Bollinger Bands among traders. Some traders see a buy signal when the price hits the lower Bollinger Band and close their position when the price hits the moving average. Some others buy when the price crosses over the upper band and sell when the price crosses below the lower band. We can see here two opposing interpretations based on different rationales, depending whether we are in a reversal or continuation pattern. Another interesting feature of the Bollinger Bands is that they give an indication of the volatility levels; a widening gap between the upper and lower bands indicates an increasing volatility, while a narrowing band indicates a decreasing volatility. Moreover, when the bands have an almost flat slope (parallel to the x-axis) the price will generally oscillate between the bands as if trading through a channel.
// © 2022 KINGTHIES THIS SOURCE CODE IS SUBJECT TO TERMS OF MOZILLA PUBLIC LICENSE 2.0 (MOZILLA.ORG/MPL/2.0)
//@version=5
//## !<---------------- © KINGTHIES --------------------->
indicator('Logarithmic Bollinger Bands (kingthies)',shorttitle='LogBands_KT',overlay=true)
// { BBANDS
src = math.log(input(close,title="Source"))
lenX = input(20,title='lenX')
highlights = input(false,title="Highlight Bear and Bull Expansions?")
mult = 2
bbandBasis = ta.sma(src,lenX)
dev = 2 * ta.stdev(src, 20)
upperBB = bbandBasis + dev
lowerBB = bbandBasis - dev
bbw = (upperBB-lowerBB)/bbandBasis
bbr = (src - lowerBB)/(upperBB - lowerBB)
// }
// { BBAND EXPANSIONS
bullExp= ta.rising(upperBB,1) and ta.falling(lowerBB,1) and ta.rising(bbandBasis,1) and ta.rising(bbw,1) and ta.rising(bbr,1)
bearExp= ta.rising(upperBB,1) and ta.falling(lowerBB,1) and ta.falling(bbandBasis,1) and ta.rising(bbw,1) and ta.falling(bbr,1)
// }
// { COLORS
greenBG = color.rgb(9,121,105,75), redBG = color.rgb(136,8,8,75)
bullCol = highlights and bullExp ? greenBG : na, bearCol = highlights and bearExp ? redBG : na
// }
// { INDICATOR PLOTTING
lowBB=plot(math.exp(lowerBB),title='Low Band',color=color.aqua),plot(math.exp(bbandBasis),title='BBand Basis',color=color.red),
highBB=plot(math.exp(upperBB),title='High Band',color=color.aqua),fill(lowBB,highBB,title='Band Fill Color',color=color.rgb(0,128,128,75))
bgcolor(bullCol,title='Bullish Expansion Highlights'),bgcolor(bearCol,title='Bearish Expansion Highlights')
// }

Universal logarithmic growth curves, with support and resistanceLogarithmic regression is used to model data where growth or decay accelerates rapidly at first and then slows over time. This model is for the long term series data (such as 10 years time span).
The user can consider entering the market when the price below 25% or 5% confidence and consider take profit when the price goes above 75% or 95% confidence line.
This script is:
- Designed to be usable in all tickers. (not only for bitcoin now!)
- Logarithmic regression and shows support-resistance level
- Shape of lines are all linear adjustable
- Height difference of levels and zones are customizable
- Support and resistance levels are highlighted
Input panel:
- Steps of drawing: Won't change it unless there are display problems.
- Resistance, support, other level color: self-explanatory.
- Stdev multipliers: A constant variable to adjust regression boundaries.
- Fib level N: Base on the relative position of top line and base line. If you don't want all fib levels, you might set all fib levels = 0.5.
- Linear lift up: vertically lift up the whole set of lines. By linear multiplication.
- Curvature constant: It is the base value of the exponential transform before converting it back to the chart and plotting it. A bigger base value will make a more upward curvy line.
FAQ:
Q: How to use it?
A: Click "Fx" in your chart then search this script to get it into your chart. Then right click the price axis, then select "Logarithmic" scale to show the curves probably.
Q: Why release this script?
A: - This script is intended to to fix the current issues of bitcoins growth curve script, and to provide a better version of the logarithmic curve, which is not only for bitcoin , but for all kinds of tickers.
- In the public library there is a hardcoded logarithmic growth curve by @quantadelic . But unfortunately that curve was hardcoded by his manual inputs, which makes the curve stop updating its value since 2019 the date he publish that code. Many users of that script love using it but they realize it was stop updating, many users out there based on @quantadelic version of "bitcoin logarithmic growth curves" and they tried their best to update the coordinates with their own hardcode input values. Eventually, a lot of redundant hardcoded "Bitcoin growth curve" scripts was born in the public library. Which is not a good thing.
Q: What about looking at the regression result with a log scale price axis?
A: You can use this script that I published in a year ago. This script display the result in a log scale price axis.

Logarithmic Trend ChannelThis indicator automatically draws a regression channel plotted on logarithmic scale from the first quotation.
This model is useful for the long term series data (such as 10 or 20 years time span).
The Pearson correlation measures the strength of the linear relationship between two variables. It has a value between to 1, with a value of 0 meaning no correlation, and + 1 meaning a total positive correlation.
Logarithmic price scales are a type of scale used on a chart, plotted such that two equivalent price changes are represented by the same vertical changes on the scale.
They differ from linear price scales because they display percentage points and not dollar price increases for a stock.
Technical issues
*The user have to pan over the chart from the beginning to the end of the study range (such as 10 years of bars) so the pine script could generate those lines on the chart.
*If on the chart the number of bar is less than the lookback period, it won't generate any lines as well.

KURD_TRADE Bitcoin Fibonacci Log Regressionthis indicatore show fibonacci logarithmic regression for BITCOIN and we can analyse the crypto market with it.
JC Log($/SMA)Simple script with user-definable:
• SMA denominator days.
• A handy and subtle smoothing function for the numerator, in EMA days. Set to 0 to just use the standard current price. (Defaults to 3 for barely noticeable lag and smoothing.)
• User-definable time resolution, independent of the chart. (Or you can set to use the same as the chart.)

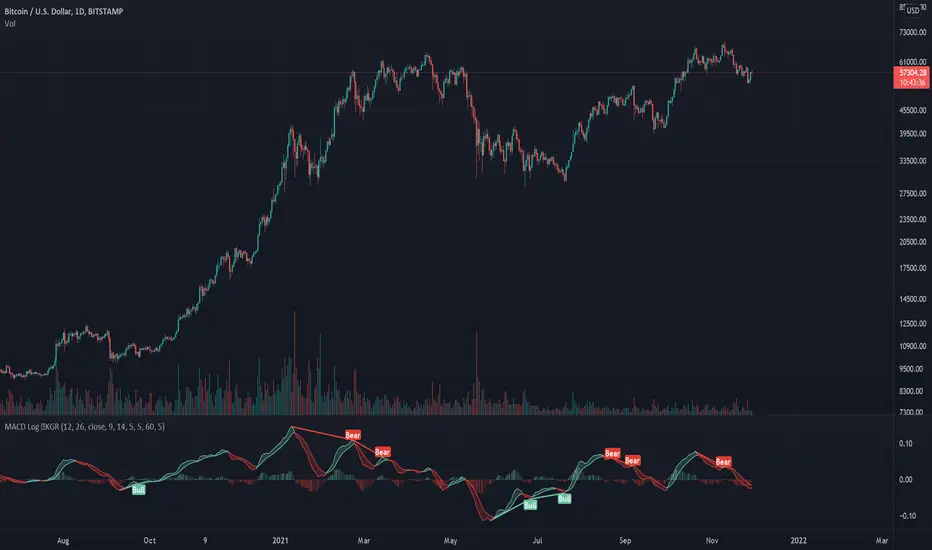
Logarithmic MACD ©KGRThis is a logarithmic MACD that comes with several advantages over the standard MACD.
Benefits: L MACD ©KGR vs Standard MACD
Normalized over longer time periods: LMACD: Yes - standard: No
Visual cues for tops: LMACD: Yes - standard: No
Visual cues for bottoms: LMACD: Yes - standard: No
Visual cues for crossing bull/bear LMACD: Yes - standard: No
Automatic divergence indicators LMACD: Yes - standard: No
Aligns with the total KGR suite highlighting confluence: LMACD: Yes - standard: No
KG Research focuses on developing crypto and general macro indicators.
Please like, follow and share to show your appreciation and support.
the KG Research team.
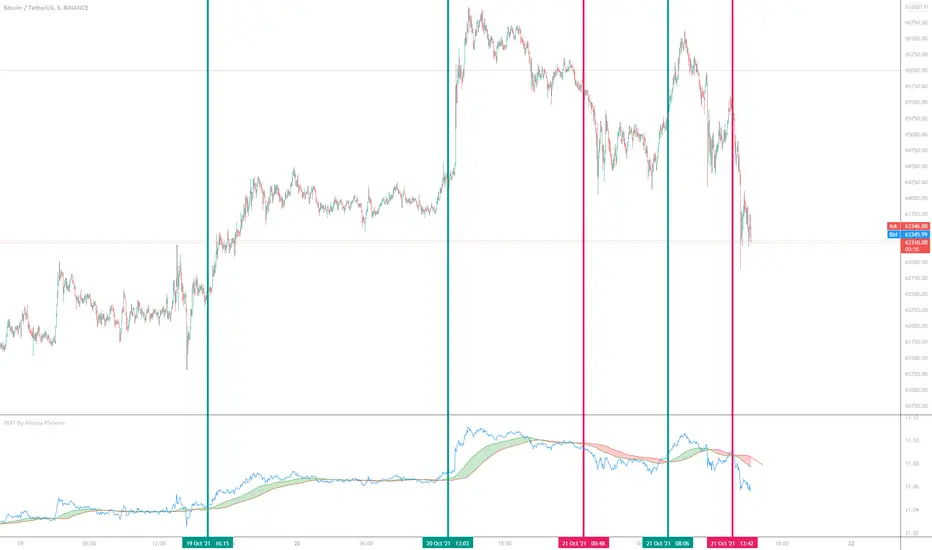
Price Movement Trend By Alireza Phoenix (Logarithmic)hi Traders
This logarithmic indicator shows the price movement trend, which is designed based on logarithmic functions and moving averages.
The Price Movement Trend Display Composed By :
A leading line consisting of the natural logarithm of Running Moving Average with length 60 and Offset 20 , and is displayed in red line.
A signal line consisting of a natural logarithm of an exponential moving average of length 90 , and is displayed in green line.
A price line consisting of the natural logarithm of a simple moving average along 1 whose source is price close , and is displayed in blue line.
A hidden price line consisting of the natural logarithm of a simple moving average along 1 and its source being the highest and lowest average prices , and is displayed in maroon line.
Learning how to get a signal from the price Movement trend indicator:
Moving the signal line and breaking the leading line upwards to form a green cloud is a buy signal.
Moving the signal line and breaking the leading line downwards that forms a red cloud is a sell signal.
Moving the price line and breaking the trend cloud upward , is a buy signal
Moving the price line and breaking the trend cloud downwards , is a sell signal
My instagram id : @pnxf6
ترجمه فارسی :
سلام تریدرها
این اندیکاتور لگاریتمی ، نمایش دهنده روند حرکتی قیمت است ، که بر اساس توابع لگاریتمی و میانگین های متحرک قیمت طراحی شده است
این اندیکاتور تشکیل شده از :
یک خط پیشرو متشکل از لگاریتم طبیعی متحرک وزنی نمایی مورد استفاده درآر اس آی به طول 60 و انحراف 20 است
یک خط سیگنال متشکل از لگاریتم طبیعی میانگین متحرک نمایی با طول 90
یک خط قیمت که متشکل از لگاریتم طبیعی میانگین متحرک ساده در طول 1 که منبع آن بسته شدن قیمت است.
یک خط قیمت مخفی که متشکل از لگاریتم طبیعی میانگین متحرک ساده در طول 1 و منبع آن میانگین بالاترین و پایین ترین قیمت است
یک فضای ابری مابین خط پیشرو و خط سیگنال که که با "نمایش روند حرکت قیمت" مشخص شده و در رنگ های سبز و قرمز قابل مشاهده میباشد.
آموزش گرفتن سیگنال ازاندیکاتور نمایش روند قیمت :
حرکت خط سیگنال و شکستن خط پیشرو رو به بالا که تشکیل ابر سبز رنگ میدهد یک سیگنال خرید میباشد .
حرکت خط سیگنال و شکستن خط پیشرو رو به پایین که تشکیل ابر قرمز رنگ میدهد یک سیگنال فروش میباشد .
حرکت خط قیمت و شکستن ابر روند حرکت قیمت رو به بالا سیگنال خرید میباشد
حرکت خط قیمت و شکستن ابر روند حرکت قیمت رو به پایین سیگنال فروش میباشد.
LineGetPriceOnLogScaleLibrary "LineGetPriceOnLogScale"
This library provides a way to calculate the y-coordinate of a line on a specified bar when the chart scale is Log.
The built-in `line.get_price()` function only works with linear scale and gives incorrect results when the chart is in Log scale.
The library only works with `bar_index` values and `xloc.bar_index`-based lines, `time`-based lines will cause errors to appear.
coordGetPriceLog(x1, y1, x2, y2, xi) Calculates the y-coordinate on the specified bar on the logarithmic scale.
Only coordinates based on bar index are applicable, bar time will throw an error.
Parameters:
x1 : First X coordinate of a line, index of the bar where the line starts.
y1 : First Y coordinate of a line, price on the price scale.
x2 : Second X coordinate of a line, index of the bar where the line ends.
y2 : Second Y coordinate of a line, price on the price scale.
xi : Index of the bar for which the price should be calculated.
Returns: Price of the line on the bar specified in `xi`, on the logarithmic scale.
lineGetPriceLog(_line, xi) Calculates the y-coordinate on the specified bar for the logarithmic scale. Takes a line.
Only lines drawn based on `xloc.bar_index` are applicable, `xloc.bar_time` will throw and error.
Parameters:
_line : The line for which the price is calculated.
xi : Index of the bar for which the bar should calculate the price.
Returns: Price of the line on the bar specified in `xi`, on the logarithmic scale.

log-log Regression From ArraysCalculates a log-log regression from arrays. Due to line limits, for sets greater than the limit, only every nth value is plotted in order to cover the entire set.
Bitcoin Logarithmic Price BandsBitcoin has been trending up with time. Generally, Bitcoin has been following an increasing logarithmic path, as seen on the chart. This indicator tries to plot areas of buying or selling opportunity. The green area contains data from times when Bitcoin was extremely undervalued. The red area is calculated from times where Bitcoin was extremely overvalued. The logarithmic bands will increase with time, so the values are not static.
Generally speaking, buy when the price is in the green area and sell when the price is in the red area.
The model doesn’t contain ANY data from after November 2020. Nevertheless, it correctly predicted the area where Bitcoin topped in April 2021.
In addition, the yellow logarithmic band manages to indicate strong areas of support or resistance. So did it correctly indicate the top of the mid-cycle peak in 2013, the bottom after the first sell-off in Feb 2018, the 2019 top and at last the mid-cycle bear-market from May-June 2021.
This study will be updated once or twice per year to add new data to the calculation. This means that the logarithmic bands will look slightly different in the future compared to now. Nevertheless, the bands add valuable information on buying or selling opportunities in the market.
The indicator is only useable on the Bitcoin/Dollar index by Tradingview, weekly timeframe.
For access, please take a look at the "Author's Instructions" below.

Auto Phivots S/R [DM]Greetings colleagues
Today I share the classic pivot points indicator
Added options:
Standard levels
Fibonacci levels "up to 261'8"
Logarithmic scale option
//Pivot Points Standard
//Pivot Points Standard — is a technical indicator that is used to determine the levels
//at which price may face support or resistance. The Pivot Points indicator consists of
//a pivot point (PP) level and several support (S) and resistance (R) levels.
//
//Calculation
//PP, resistance and support values are calculated in different ways, depending on
//the type of the indicator, specified by the Type field in indicator inputs. To
//calculate PP and support/resistance levels, the values OPENcurr, OPENprev, HIGHprev,
//LOWprev, CLOSEprev are used, which are the values of the current open and previous
//open, high, low and close, respectively, on the indicator resolution. The indicator
//resolution is set by the input of the Pivots Timeframe. If the Pivots Timeframe is set
//to AUTO (the default value), then the increased resolution is determined by the
//following algorithm:
//
//for intraday resolutions up to and including 15 min, DAY (1D) is used
//for intraday resolutions more than 15 min, WEEK (1W) is used
//for daily resolutions MONTH is used (1M)
//for weekly and monthly resolutions, 12-MONTH (12M) is used

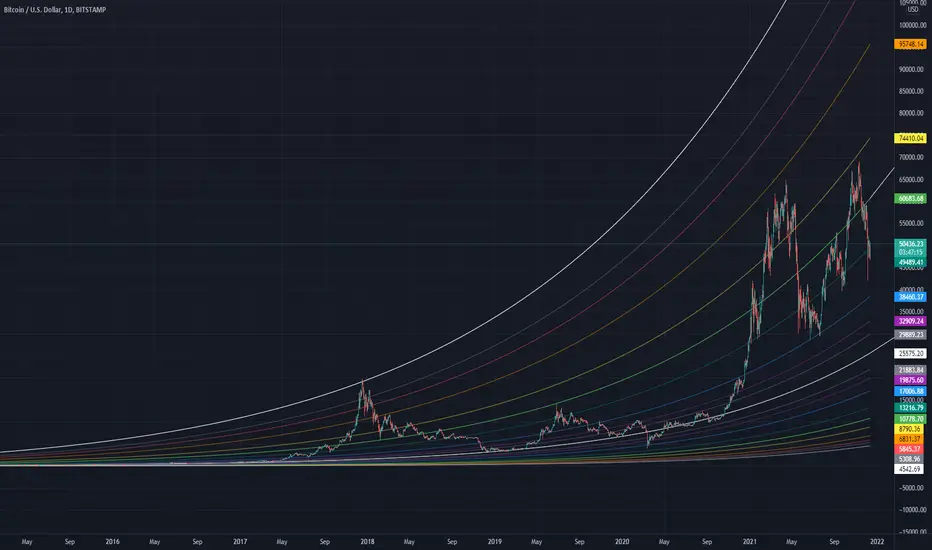
Bitcoin Logarithmic Fractal Growth Model By ARUDDThis model, which I'm calling the Logarithmic Fractal Growth Mode (L.F.G) , uses Bitcoin's mathematical monetary policy to evaluate the future possible price valuation.
It takes into account fractal (and logarithmic) growth as well as how those who hold bitcoins might react to certain events such as changes in supply and demand. It also shows that it is mathematically logical that someday it must become stable.
The information gained from knowing this helps people make more informed decisions when buying bitcoin and thinking of its future possibilities.
The model can serve as some type of general guideline for determining how much bitcoins should be worth in the future if it follows a certain path from its current price.
Modeling Bitcoin's money supply mathematically, and knowing that there is a finite number of them, makes this whole process much more rational than just thinking about the possibilities in pure subjective terms.
Before going any further I want to say that no one can know with absolute certainty what will happen to bitcoins price in the future, but using mathematics gives us an idea of where things are headed.
The results presented here are based on very reasonable assumptions for how bitcoin might continue to grow (and then level out) once there are over 21 million bitcoins in existence.
The model shows that bitcoin's price can never go down to zero (thus creating the "death spiral" phenomenon), and as such, bitcoin has an extremely high probability of becoming stable as it approaches infinity.
Conversely, this model also shows that at some point there is a high probability that bitcoin will not continue to grow exponentially forever.
Credit goes to Quantadelic for the awesome original script.
ARUDD

Auto Trendline & Breakout Alert(Linear / Log) Full-VersionContents
Overall Introduction
Does it repaint?
Features
Settings menu parameters
How to setup
Limits
Errors and Performance
Examples
Overall Introduction
This indicator is the best tool for breakout traders.
Drawing and evaluating the trend lines of multiple charts in different time frames is a very time-consuming and tedious task. In addition, being aware of breakouts in the shortest possible time requires constant monitoring.
With this tool, you can draw and classify trend lines in a fraction of a second and by placing an alert on any chart, you can receive notifications about breakouts, wherever you are.
The classification of trend lines is done based on the reaction of the price chart to the trend lines and the analysis of the trading volume.
This indicator is designed to reclassify trend lines with each reaction of the price chart. These lines are classified into 6 levels and these levels are distinguished by different colors. Thus, any touching or crossing of the price chart can make a difference.
Does it repaint?
Any tool that shows trend lines must repaint because trend lines are constantly changing. Some lines lose their strength and new ones are formed, so some lines should be removed and replaced with new lines and that means repainting.
The indicator should reflect the latest changes. So while repainting is a bad thing in a strategy, it is essential in this indicator.
This indicator is designed to reclassify trend lines with each reaction of the price chart. Thus, any touching or crossing of the price chart can make a difference.
Note that unlike alerts, breakout labels are not trading signals:
Breakout labels show the latest breakout for each level based on the lines that appear on the chart, so they may repaint or have delay.
But Alerts work differently, Alerts are triggered when one of the trend lines is broken and then the next candle is opened and has no any delay.
Features
This indicator is designed for use on both linear and logarithmic scales. It works linearly by default. If you are using a logarithmic chart, enter the settings menu and set the chart scale parameter to “Log”.
The indicator is equipped with the volume status tool to identify and avoid false breakouts. Note that you can't completely avoid false breakouts, but you can minimize risk and loss. I have already published volume status as a separate script.
Several filters are provided to customize alerts. You can limit alerts based on the level and strength of broken trend lines, volume status, and type of breakout (Cross-Over, Cross-Under, or both).
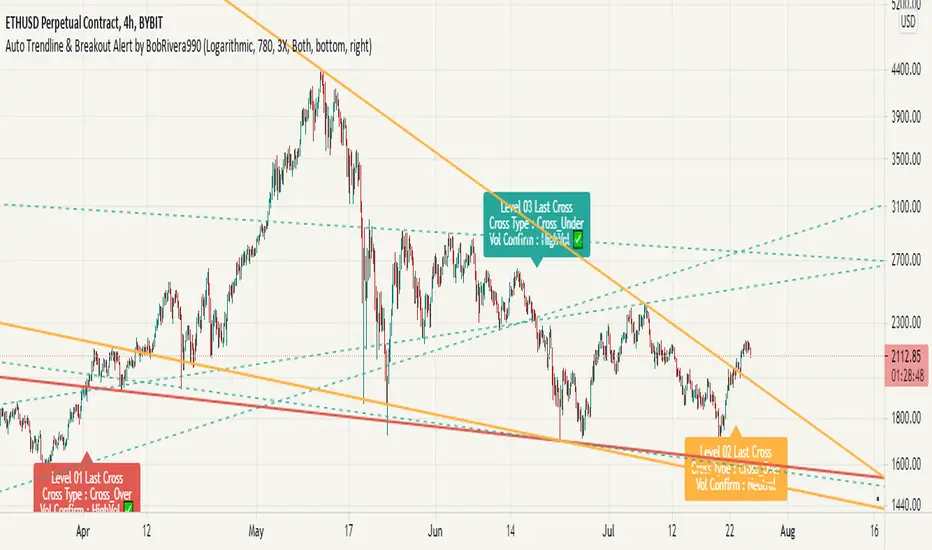
The last breakouts panel gives an overview of the current market situation. You can activate it in the settings menu. the figure below shows the panel:
Settings menu parameters
{Chart Scale …} =>
Set it according to the chart. If you are using a linear chart, select the "Linear" option or if you are using a logarithmic chart, select the "Log" option
{Max Operational Range Length ...} =>
This parameter specifies the number of candles processed by the indicator (By default, the last 1000 bars)
{Filter Out-Of-Range Lines} =>
The filter removes diverging or out-of-range lines and reduces the clutter of the chart
{Visible Trend Lines ...} =>
In this section you can specify which level of trend lines should be visible. Level 1 contains the strongest lines and level 6 contains the weakest.
{Alert Condition 01 _ Trendline Levels} =>
In this section, you can specify which level of trend lines will trigger an alert after the breakout. This section has been added to customize alerts.
{Alert Condition 02 _ Cross Type} =>
In this section, you can limit alerts based on the type of breakout (Cross-Over, Cross-Under or both). This section has been added to customize alerts.
{Alert Condition 03 _ Volume Status} =>
In this section, you can limit alerts by volume to avoid fake breakouts. This section has been added to customize alerts.
{Last Breakout Label} =>
In this section, you can enable or disable the last breakout labels.
{Panel} =>
In this section, you can enable or disable the last breakout panel or set its position on the chart.
How to setup
There are many parameters in the settings menu, but two are more important. One is “Chart Scale” and the other is the “Max Operational Range Length".
Set the “chart scale” parameter according to the chart, otherwise the trend lines drawn by the indicator do not match the price chart.
If you are using a linear chart, select the "Linear" option or if you are using a logarithmic chart, select the "Log" option.
Max Operational Range Length Limits the range of the price chart that is processed by the indicator.
By increasing this parameter:
The strength and durability of the trend lines increases.
The number of breakout signals decreases.
The importance of breakout signals increases.
The indicator processing load increases.
In the following figure, you can see the effects of increasing the “Max Operational Range Length" parameter:
Limits
Since this indicator makes extensive use of trading volume, it is necessary to use a chart with volume information.
But if the volume information is not provided by the vendor, indicator will continue to work based on the price chart only, and a warning message will be displayed below the chart to let you know.
Errors and Performance
The performance of this indicator depends on the “Max Operational Range Length” parameter in the settings menu because it performs calculations, within a range with the length of this parameter.
By increasing this parameter, the processing load increases. Sometimes you may encounter the following error: “Loop takes too long to execute (>200 ms)”
If you see this error, do one of the following:
Reduce the “Max Operational Range Length”.
Reset the indicator. To do this, double-click on the “Hide” button in front of the indicator name.
Examples
EURUSD (FX:EURUSD) – 1D // Scale: Logarithmic, Max Range Length = 1000, Filter: 2X
NASDAQ 100 (CME_MINI:NQ1!) - 1D // Scale: Logarithmic, Max Range Length = 700
GOLD (COMEX:GC1!) – 1D // Scale: Logarithmic, Max Range Length = 650, Filter: 2X
NATURAL GAS (NYMEX:NG1!) – 1D // Scale: Logarithmic, Max Range Length = 625, Filter: 4X
AMAZON (NASDAQ:AMZN) – 1D // Scale: Logarithmic, Max Range Length = 1750, Filter: 2X
APPLE INC (NASDAQ:AAPL) – 1D // Scale: Logarithmic, Max Range Length = 340, Filter: 4X
GBPUSD (FX:GBPUSD) – 1D // Scale: Logarithmic, Max Range Length = 1000, Filter: 3X
SILVER (COMEX:SI1!) – 1D // Scale: Logarithmic, Max Range Length = 550, Filter: 3X
BITCOIN (KUCOIN:BTCUSDT) – 4H // Scale: Logarithmic, Max Range Length = 1250, Filter: 3X
MICROSOFT (NASDAQ:MSFT) – 1D // Scale: Logarithmic, Max Range Length = 340, Filter: 4X
TOTAL (CRYPTOCAP:TOTAL) – 2H // Scale: Logarithmic, Max Range Length = 1075, Filter: 3X