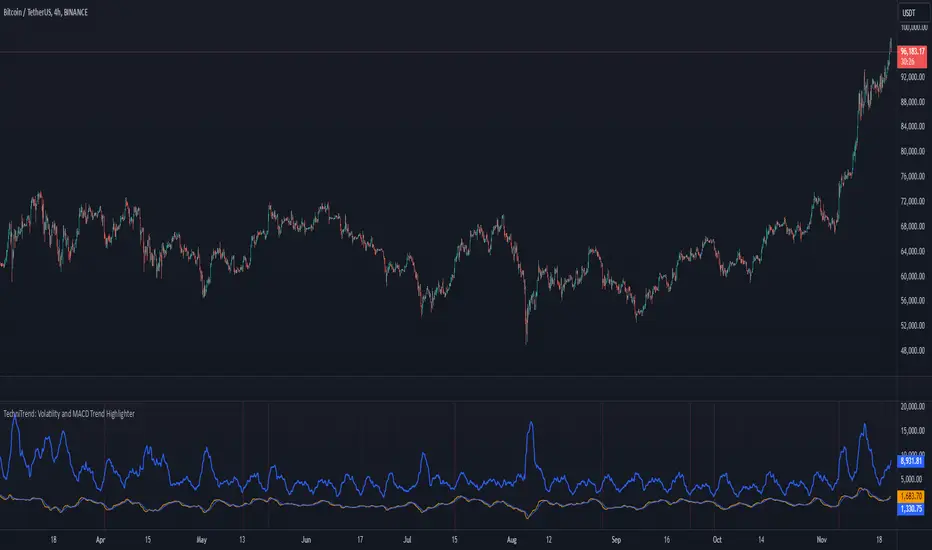
TechniTrend: Volatility and MACD Trend Highlighter🟦 Overview
The "Candle Volatility with Trend Prediction" indicator is a powerful tool designed to identify market volatility based on candle movement relative to average volume while also incorporating trend predictions using the MACD. This indicator is ideal for traders who want to detect volatile market conditions and anticipate potential price movements, leveraging both price changes and volume dynamics.
It not only highlights candles with significant price movements but also integrates a trend analysis based on the MACD (Moving Average Convergence Divergence), allowing traders to gauge whether the market momentum aligns with or diverges from the detected volatility.
🟦 Key Features
🔸Volatility Detection: Identifies candles that exceed normal price fluctuations based on average volume and recent price volatility.
🔸Trend Prediction: Uses the MACD indicator to overlay trend analysis, signaling potential market direction shifts.
🔸Volume-Based Analysis: Integrates customizable moving averages (SMA, EMA, WMA, etc.) of volume, providing a clear visualization of volume trends.
🔸Alert System: Automatically notifies traders of high-volatility situations, aiding in timely decision-making.
🔸Customizability: Includes multiple settings to tailor the indicator to different market conditions and timeframes.
🟦 How It Works
The indicator operates by evaluating the price volatility in relation to average volume and identifying when a candle's volatility surpasses a threshold defined by the user. The key calculations include:
🔸Average Volume Calculation: The user selects the type of moving average (SMA, EMA, etc.) to calculate the average volume over a set period.
🔸Volatility Measurement: The indicator measures the body change (difference between open and close) and the high-low range of each candle. It then calculates recent price volatility using a standard deviation over a user-defined length.
🔸Weighted Index: A unique index is created by dividing price change by average volume and recent volatility.
🔸Highlighting Volatility: If the weighted index exceeds a customizable threshold, the candle is highlighted, indicating potential trading opportunities.
🔸Trend Analysis with MACD: The MACD line and signal line are plotted and adjusted with a user-defined multiplier to visualize trends alongside the volatility signals.
🟦 Recommended Settings
🔸Volume MA Length: A default of 14 periods for the average volume calculation is recommended. Adjust to higher periods for long-term trends and shorter periods for quick trades.
🔸Volatility Threshold Multiplier: Set at 1.2 by default to capture moderately significant movements. Increase for fewer but stronger signals or decrease for more frequent signals.
🔸MACD Settings: Default MACD parameters (12, 26, 9) are suggested. Tweak based on your trading strategy and asset volatility.
🔸MACD Multiplier: Adjust based on how the MACD should visually compare to the average volume. A multiplier of 1 works well for most cases.
🟦 How to Use
🔸Volatile Market Detection:
Look for highlighted candles that suggest a deviation from typical price behavior. These candles often signify an entry point for short-term trades.
🔸Trend Confirmation:
Use the MACD trend analysis to verify if the highlighted volatile candles align with a bullish or bearish trend.
For example, a bullish MACD crossover combined with a highlighted candle suggests a potential uptrend, while a bearish crossover with volatility signals may indicate a downtrend.
🔸Volume-Driven Strategy:
Observe how volume changes impact candle volatility. When volume rises significantly and candles are highlighted, it can suggest strong market moves influenced by big players.
🟦 Best Use Cases
🔸Trend Reversals: Detect potential trend reversals early by spotting divergences between price and MACD within volatile conditions.
🔸Breakout Strategies: Use the indicator to confirm price breakouts with significant volume changes.
🔸Scalping or Day Trading: Customize the indicator for shorter timeframes to capture rapid market movements based on volatility spikes.
🔸Swing Trading: Combine volatility and trend insights to optimize entry and exit points over longer periods.
🟦 Customization Options
🔸Volume-Based Inputs: Choose from SMA, EMA, WMA, and more to define how average volume is calculated.
🔸Threshold Adjustments: Modify the volatility threshold multiplier to increase or decrease sensitivity based on your trading style.
🔸MACD Tuning: Adjust MACD settings and the multiplier for trend visualization tailored to different asset classes and market conditions.
🟦 Indicator Alerts
🔸High Volatility Alerts: Automatically triggered when candles exceed user-defined volatility levels.
🔸Bullish/Bearish Trend Alerts: Alerts are activated when highlighted volatile candles align with bullish or bearish MACD crossovers, making it easier to spot opportunities without constantly monitoring the chart.
🟦 Examples of Use
To better understand how this indicator works, consider the following scenarios:
🔸Example 1: In a strong uptrend, observe how volume surges and volatility highlight candles right before price consolidations, indicating optimal exit points.
🔸Example 2: During a downtrend, see how the MACD aligns with volume-driven volatility, signaling potential short-selling opportunities.
Đường Trung bình động Hội tụ/Phân kỳ (MACD)
MACD -- Normalized█ OVERVIEW
This indicator is a normalized and scaled version of the Moving Average Convergence Divergence ( MACD ) indicator, inspired by the work in "Statistically Sound Indicators" by Timothy Masters. It enhances the traditional MACD by applying statistical normalization and scaling techniques, providing more consistent and reliable signals across different markets and timeframes.
█ CONCEPTS
The traditional MACD measures the difference between two Exponential Moving Averages ( EMAs ) of different lengths to identify momentum changes. However, its raw values are unbounded, making it challenging to compare across different instruments or timeframes.
This normalized MACD addresses this limitation by:
• Normalization : Adjusting the MACD values using the Average True Range ( ATR ) to account for market volatility.
• Scaling : Applying the Cumulative Distribution Function ( CDF ) to constrain the output between -50 and +50.
• Smoothing : Providing a smoothed signal line and histogram to effectively visualize momentum shifts.
█ FEATURES
• Normalized MACD Line : Computes the difference between the short-term and long-term EMAs, normalized by market volatility.
• Signal Line : Applies EMA smoothing to the normalized MACD line over a user-defined period.
• Histogram : Visualizes the difference between the normalized MACD line and the signal line, highlighting momentum changes.
• Customization Options :
• Adjustable lengths for the short-term EMA, long-term EMA, and signal line smoothing.
• Ability to toggle the visibility of the MACD line, signal line, and histogram.
• Statistical Scaling : Utilizes statistical methods from Timothy Masters' work to provide consistent scaling across different instruments.
█ HOW TO USE
1 — Identify Momentum Shifts :
• A crossover of the MACD line above the signal line may indicate a bullish momentum shift.
• A crossover of the MACD line below the signal line may indicate a bearish momentum shift.
2 — Analyze the Histogram :
• A rising histogram suggests strengthening momentum in the current trend direction.
• A falling histogram may signal weakening momentum or a potential reversal.
3 — Customize Parameters :
• Adjust the EMA lengths and smoothing periods to fit the specific instrument or timeframe.
• Use the visibility toggles to focus on the components most relevant to your analysis.
4 — Combine with Other Tools :
• Use in conjunction with support/resistance levels, trend lines, or other indicators to confirm signals.
• Consider the overall market context to enhance decision-making.
█ LIMITATIONS
• The indicator is based on historical price data; it may not predict future market movements accurately.
• May produce false signals during low volatility or ranging market conditions.
• Initial periods may display na values due to insufficient data for calculations.
█ NOTES
• Ensure that the MathHelpers library by HuntGatherTrade is imported for the indicator to function correctly.
• The default parameters are commonly used settings but may require adjustments based on the trading instrument and timeframe.
• The normalization and scaling techniques are designed to make the indicator's outputs more comparable across different markets.

XAUUSD 10-Minute StrategyThis XAUUSD 10-Minute Strategy is designed for trading Gold vs. USD on a 10-minute timeframe. By combining multiple technical indicators (MACD, RSI, Bollinger Bands, and ATR), the strategy effectively captures both trend-following and reversal opportunities, with adaptive risk management for varying market volatility. This approach balances high-probability entries with robust volatility management, making it suitable for traders seeking to optimise entries during significant price movements and reversals.
Key Components and Logic:
MACD (12, 26, 9):
Generates buy signals on MACD Line crossovers above the Signal Line and sell signals on crossovers below the Signal Line, helping to capture momentum shifts.
RSI (14):
Utilizes oversold (below 35) and overbought (above 65) levels as a secondary filter to validate entries and avoid overextended price zones.
Bollinger Bands (20, 2):
Uses upper and lower Bollinger Bands to identify potential overbought and oversold conditions, aiming to enter long trades near the lower band and short trades near the upper band.
ATR-Based Stop Loss and Take Profit:
Stop Loss and Take Profit levels are dynamically set as multiples of ATR (3x for stop loss, 5x for take profit), ensuring flexibility with market volatility to optimise exit points.
Entry & Exit Conditions:
Buy Entry: T riggered when any of the following conditions are met:
MACD Line crosses above the Signal Line
RSI is oversold
Price drops below the lower Bollinger Band
Sell Entry: Triggered when any of the following conditions are met:
MACD Line crosses below the Signal Line
RSI is overbought
Price moves above the upper Bollinger Band
Exit Strategy: Trades are closed based on opposing entry signals, with adaptive spread adjustments for realistic exit points.
Backtesting Configuration & Results:
Backtesting Period: July 21, 2024, to October 30, 2024
Symbol Info: XAUUSD, 10-minute timeframe, OANDA data source
Backtesting Capital: Initial capital of $700, with each trade set to 10 contracts (equivalent to approximately 0.1 lots based on the broker’s contract size for gold).
Users should confirm their broker's contract size for gold, as this may differ. This script uses 10 contracts for backtesting purposes, aligned with 0.1 lots on brokers offering a 100-contract specification.
Key Backtesting Performance Metrics:
Net Profit: $4,733.90 USD (676.27% increase)
Total Closed Trades: 526
Win Rate: 53.99%
Profit Factor: 1.44 (1.96 for Long trades, 1.14 for Short trades)
Max Drawdown: $819.75 USD (56.33% of equity)
Sharpe Ratio: 1.726
Average Trade: $9.00 USD (0.04% of equity per trade)
This backtest reflects realistic conditions, with a spread adjustment of 38 points and no slippage or commission applied. The settings aim to simulate typical retail trading conditions. However, please adjust the initial capital, contract size, and other settings based on your account specifics for best results.
Usage:
This strategy is tuned specifically for XAUUSD on a 10-minute timeframe, ideal for both trend-following and reversal trades. The ATR-based stop loss and take profit levels adapt dynamically to market volatility, optimising entries and exits in varied conditions. To backtest this script accurately, ensure your broker’s contract specifications for gold align with the parameters used in this strategy.

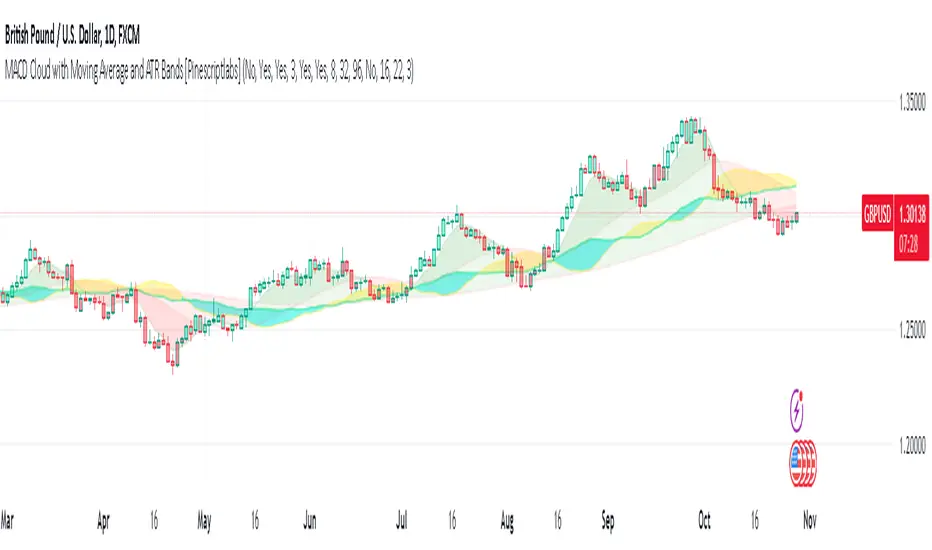
MACD Cloud with Moving Average and ATR BandsThe algorithm implements a technical analysis indicator that combines the MACD Cloud, Moving Averages (MA), and volatility bands (ATR) to provide signals on market trends and potential reversal points. It is divided into several sections:
🎨 Color Bars:
Activated based on user input.
Controls bar color display according to price relative to ATR levels and moving average (MA).
Logic:
⚫ Black: Potential bearish reversal (price above the upper ATR band).
🔵 Blue: Potential bullish reversal (price below the lower ATR band).
o
🟢 Green: Bullish trend (price between the MA and upper ATR band).
o
🔴 Red: Bearish trend (price between the lower ATR band and MA).
o
📊 MACD Bars:
Description:
The MACD Bars section is activated by default and can be modified based on user input.
🔴 Red: Indicates a bearish trend, shown when the MACD line is below the Signal line (Signal line is a moving average of MACD).
🔵 Blue: Indicates a bullish trend, shown when the MACD line is above the Signal line.
Matching colors between MACD Bars and MACD Cloud visually confirms trend direction.
MACD Cloud Logic: The MACD Cloud is based on Moving Average Convergence Divergence (MACD), a momentum indicator showing the relationship between two moving averages of price.
MACD and Signal Lines: The cloud visualizes the MACD line relative to the Signal line. If the MACD line is above the Signal line, it indicates a potential bullish trend, while below it suggests a potential bearish trend.
☁️ MA Cloud:
The MA Cloud uses three moving averages to analyze price direction:
Moving Average Relationship: Three MAs of different periods are plotted. The cloud turns green when the shorter MA is above the longer MA, indicating an uptrend, and red when below, suggesting a downtrend.
Trend Visualization: This graphical representation shows the trend direction.
📉 ATR Bands:
The ATR bands calculate overbought and oversold limits using a weighted moving average (WMA) and ATR.
Center (matr): Shows general trend; prices above suggest an uptrend, while below indicate a downtrend.
Up ATR 1: Marks the first overbought level, suggesting a potential bearish reversal if the price moves above this band.
Down ATR 1: Marks the first oversold level, suggesting a possible bullish reversal if the price moves below this band.
Up ATR 2: Extends the overbought range to an extreme, reinforcing the possibility of a bearish reversal at this level.
Down ATR 2: Extends the oversold range to an extreme, indicating a stronger bullish reversal possibility if price reaches here.
Español:
El algoritmo implementa un indicador de análisis técnico que combina la nube MACD, promedios móviles (MA) y bandas de volatilidad (ATR) para proporcionar señales sobre tendencias del mercado y posibles puntos de reversión. Se divide en varias secciones:
🎨 Barras de Color:
- Activado según la entrada del usuario.
- Controla la visualización del color de las barras según el precio en relación con los niveles de ATR y el promedio móvil (MA).
- **Lógica:**
- ⚫ **Negro**: Reversión bajista potencial (precio por encima de la banda superior ATR).
- 🔵 **Azul**: Reversión alcista potencial (precio por debajo de la banda inferior ATR).
- 🟢 **Verde**: Tendencia alcista (precio entre el MA y la banda superior ATR).
- 🔴 **Rojo**: Tendencia bajista (precio entre la banda inferior ATR y el MA).
### 📊 Barras MACD:
- **Descripción**:
- La sección de barras MACD se activa por defecto y puede modificarse según la entrada del usuario.
- 🔴 **Rojo**: Indica una tendencia bajista, cuando la línea MACD está por debajo de la línea de señal (la línea de señal es una media móvil de la MACD).
- 🔵 **Azul**: Indica una tendencia alcista, cuando la línea MACD está por encima de la línea de señal.
- La coincidencia de colores entre las barras MACD y la nube MACD confirma visualmente la dirección de la tendencia.
### 🌥️ Nube MACD:
- **Lógica de la Nube MACD**: Basada en el indicador de convergencia-divergencia de medias móviles (MACD), que muestra la relación entre dos medias móviles del precio.
- **Líneas MACD y de Señal**: La nube visualiza la relación entre la línea MACD y la línea de señal. Si la línea MACD está por encima de la de señal, indica una tendencia alcista potencial; si está por debajo, sugiere una tendencia bajista.
### ☁️ Nube MA:
- **Relación entre Medias Móviles**: Se trazan tres medias móviles de diferentes períodos. La nube se vuelve verde cuando la media más corta está por encima de la más larga, indicando una tendencia alcista, y roja cuando está por debajo, sugiriendo una tendencia bajista.
- **Visualización de Tendencias**: Proporciona una representación gráfica de la dirección de la tendencia.
### 📉 Bandas ATR:
- Las bandas ATR calculan límites de sobrecompra y sobreventa usando una media ponderada y el ATR.
- **Centro (matr)**: Muestra la tendencia general; precios por encima indican tendencia alcista y debajo, bajista.
- **Up ATR 1**: Marca el primer nivel de sobrecompra, sugiriendo una reversión bajista potencial si el precio sube por encima de esta banda.
- **Down ATR 1**: Marca el primer nivel de sobreventa, sugiriendo una reversión alcista potencial si el precio baja por debajo de esta banda.
- **Up ATR 2**: Amplía el rango de sobrecompra a un nivel extremo, reforzando la posibilidad de reversión bajista.
- **Down ATR 2**: Extiende el rango de sobreventa a un nivel extremo, sugiriendo una reversión alcista más fuerte si el precio alcanza esta banda.
Volume-Adjusted Schaff Trend Cycle (VASTC)Volume-Adjusted Schaff Trend Cycle (VASTC)
The VASTC is a fairly fast-moving oscillator designed to identify trends early and signal when trends may be nearing their end. While it can be used for both trend-following and mean-reversion strategies , it shines in trend-following setups. It’s particularly useful for catching the start of a trend and giving early warnings that a trend might end soon, making it a valuable addition to a multi-indicator system.
How It Works:
The VASTC adapts the traditional Schaff Trend Cycle by adjusting the MACD component with volume data. This volume-adjusted MACD is run through two stochastic processes , applying exponential smoothing to enhance responsiveness. Volume sensitivity allows the VASTC to adapt dynamically to periods of high or low trading activity, providing more reliable trend signals.
Recommended Use:
Use VASTC in confluence with other indicators to confirm trend entries and exits. It’s best for identifying early trend setups rather than sustaining prolonged trend trades. When used alongside other indicators, especially those with a longer-term outlook or momentum based trend indicators, you’ll gain a clearer signal for potential exits or entries. Always backtest the VASTC on your chosen assets to determine the most effective input parameters, as the defaults may not suit all markets or assets. Different assets behave differently, and adjustments in parameters can improve its ability to analyze the assets you're looking at.
Parameters:
Length : Sets the primary smoothing length.
Fast/Slow Length : Adjust the speed of the volume-adjusted MACD component.
Factor : Controls the final smoothing applied to the STC.
Overbought/Oversold Levels : Defines overbought/oversold levels.
Experiment with these settings to customize the VASTC to your trading strategy and asset.
Disclaimer : This indicator is a tool to complement your trading analysis and should not be used in isolation. Always backtest and use other confluence signals for best results. The assets I looked at when making this indicator are almost certainly different than what you're looking at.

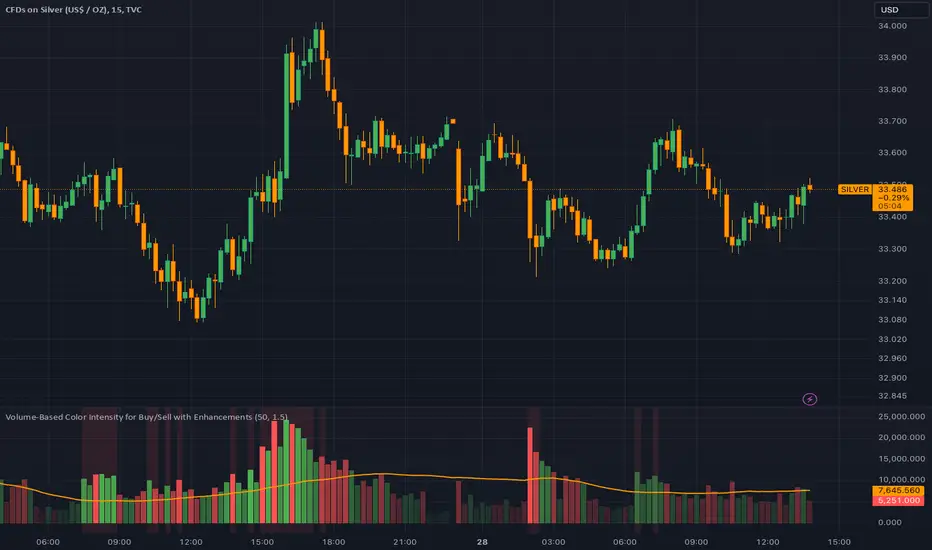
Dynamic Volume-Based Buy/Sell IndicatorThis script provides a powerful volume-based indicator that visualizes buy and sell volumes, issues alerts for volume spikes, and adjusts color intensity dynamically based on volume size. It includes customizable settings for volume averaging and thresholds, making it adaptable to various trading strategies.
MACD Trend Trading with Dynamic Position Sizing // AlgoFyreThe MACD Trend Trading with Dynamic Position Sizing strategy combines MACD and trend indicators for trend trading. It uses MACD crossovers to identify entry points and a trend source for directional bias. The strategy incorporates risk management through dynamic position sizing based on a fixed risk amount. It allows for both long and short positions with customizable stop-loss and take-profit levels. The script includes visualization options for entry, stop-loss, and take-profit levels, enhancing trade analysis.
TABLE OF CONTENTS
🔶 ORIGINALITY
🔸Dynamic Position Sizing
🔸Trend-MACD Combination
🔸Customizable Risk Management
🔶 FUNCTIONALITY
🔸Indicators
🞘 Trend Indicator
🞘 Moving Average Convergence Divergence (MACD)
🔸Conditions
🞘 Long Entry
🞘 Short Entry
🔶 INSTRUCTIONS
🔸Step-by-Step Guidelines
🞘 Setting Up the Strategy
🞘 Alerts
🔸Customize settings
🔶 CONCLUSION
▅▅▅▅▅▅▅▅▅▅▅▅▅▅▅▅▅▅▅▅▅▅▅▅▅▅▅▅▅▅▅▅▅▅▅▅▅▅▅▅▅▅▅▅▅
🔶 ORIGINALITY The MACD Trend Trading with Dynamic Position Sizing strategy uniquely combines MACD indicators with trend analysis to optimize entry and exit points. Unlike static trading strategies, it employs dynamic position sizing based on a fixed risk amount, ensuring consistent risk management. This approach allows traders to adapt to varying market conditions by adjusting position sizes according to predefined risk parameters, enhancing both flexibility and control in trading decisions. The strategy's integration of customizable stop-loss and take-profit levels further refines its risk management capabilities, making it a robust tool for both trending and volatile markets.
🔸Dynamic Position Sizing This strategy calculates position sizes dynamically, based on a fixed risk amount, allowing traders to maintain consistent risk exposure across trades.
🔸Trend-MACD Combination By combining trend direction with MACD crossovers, the strategy enhances the accuracy of entry signals, aligning trades with prevailing market trends.
🔸Customizable Risk Management Traders can set flexible risk-reward ratios and adjust stop-loss and take-profit levels, tailoring the strategy to their risk tolerance and market conditions.
🔶 FUNCTIONALITY The MACD Trend Trading with Dynamic Position Sizing strategy leverages a combination of trend indicators and the MACD to identify optimal trading opportunities. This strategy is designed to capitalize on short-term price movements by dynamically adjusting position sizes based on predefined risk parameters. It allows traders to manage risk effectively while taking advantage of both long and short positions.
🔸Indicators 🞘 Trend Indicator: Utilizes the trend source to determine market direction, ensuring trades align with prevailing trends.
Recommendation: We recommend using the Adaptive MAs (Hurst, CVaR, Fractal) indicator with the following settings for trend detection. However, you can use any trend indicator that suits your trading style.
🞘 Moving Average Convergence Divergence (MACD): Employs MACD crossovers to generate entry signals, enhancing the accuracy of trade execution. Use the "Moving Average Convergence Divergence" Indicator with the following settings:
🔸Conditions 🞘 Long Entry: Initiates a long position when the price is above the trend source, and a MACD crossover occurs with both MACD and signal lines below zero.
🞘 Short Entry: Initiates a short position when the price is below the trend source, and a MACD crossunder occurs with both MACD and signal lines above zero.
🔶 INSTRUCTIONS
The MACD Trend Trading with Dynamic Position Sizing strategy can be set up by adding it to your TradingView chart and configuring parameters such as the MACD source, trend source, and risk management settings. This strategy is designed to capitalize on short-term price movements by dynamically adjusting position sizes based on predefined risk parameters. Enhance the accuracy of signals by combining this strategy with additional indicators like trend-following or momentum-based tools. Adjust settings to better manage risk and optimize entry and exit points.
🔸Step-by-Step Guidelines
🞘 Setting Up the Strategy
Adding the Strategy to the Chart:
Go to your TradingView chart.
Click on the "Indicators" button at the top.
Search for "MACD Trend Trading with Dynamic Position Sizing" in the indicators list.
Click on the strategy to add it to your chart.
Configuring the Strategy:
Open the strategy settings by clicking on the gear icon next to its name on the chart.
MACD: Select the MACD from the MACD Indicator.
MACD Signal: Select the MACD Signal from the MACD Indicator.
Trend Source: Choose the trend source to determine market direction. If you use the Adaptive MAs (Hurst, CVaR, Fractal) with our settings shown above, choose the MA1 Smoothing Line.
Stop Loss Percentage: Set the stop loss distance from the trend source as a percentage.
Risk/Reward Ratio: Define the desired risk/reward ratio for trades.
Backtesting and Practice:
Backtest the strategy on historical data to understand how it performs in various market environments.
Practice using the strategy on a demo account before implementing it in live trading.
Market Awareness:
Keep an eye on market news and events that might cause extreme price movements. The strategy reacts to price data and might not account for news-driven events that can cause large deviations.
🔶 CONCLUSION
The MACD Trend Trading with Dynamic Position Sizing strategy provides a robust framework for capitalizing on short-term market trends by combining the MACD indicator with dynamic position sizing. This strategy leverages MACD crossovers to identify entry points and utilizes a trend source for directional bias, ensuring trades align with prevailing market conditions. By incorporating dynamic position sizing based on a fixed risk amount, traders can effectively manage risk and adapt to varying market conditions. The strategy's customizable stop-loss and take-profit levels further enhance its risk management capabilities, making it a versatile tool for both trending and volatile markets. With its strategic blend of technical indicators and risk management, the MACD Trend Trading strategy offers traders a comprehensive approach to optimizing trade execution and maximizing potential returns.

Divergence Indicator Multi [TradingFinder] MACD AO RSI DIV Chart🔵 Introduction
🟣 What is Divergence in Financial Markets?
Divergence in technical analysis happens when the price of a stock moves in a direction opposite to certain indicators. This is a crucial concept in financial markets as it can signal either a trend reversal or a continuation of the current correction in the trend. Understanding divergence helps traders and analysts make more informed decisions.
🟣 Positive Regular Divergence (RD+)
A positive regular divergence occurs at the end of a downtrend, where two price lows form. This divergence appears when the price chart shows a new low, but the indicator does not follow, signaling potential buying opportunities.
Positive divergence indicates increased buying pressure and reduced selling pressure, making it a useful signal for forecasting price increases.
🟣 Negative Regular Divergence (RD-)
A negative regular divergence is seen during an uptrend when two price highs form. The price chart records a new high, but the indicator does not reflect this change, suggesting that a market downturn is likely.
This type of divergence shows strong selling pressure and weaker buying activity, which can help identify selling opportunities.
Both positive and negative divergences are powerful tools for identifying potential trend reversals and key support and resistance levels. For example, when an indicator trends upward while the price moves downward, this creates divergence, warning traders to reconsider their investment strategy.
🟣 Different Types of Divergence in Trading
1. Regular Divergence :
o Positive Regular Divergence (RD+)
o Negative Regular Divergence (RD-)
2. Hidden Divergence :
o Positive Hidden Divergence (HD+)
o Negative Hidden Divergence (HD-)
3.Time Divergence.
Note : This guide focuses specifically on Regular Divergence.
🟣 What is Regular Divergence?
Regular Divergence, often referred to as convergence, occurs when price action and indicators show conflicting patterns, usually signaling the end of a trend. Detecting regular divergence helps traders anticipate potential trend reversals or the formation of reversal patterns.
🔵 How to Use
To optimize the detection of divergence, you can adjust the Fractal Period to specify the length of time for identifying divergence patterns.
Additionally, with the Divergence Detection Method, you can select oscillators like the MACD, RSI, or AO to base divergence detection on.
Divergence in MACD :
MACD divergence occurs when the price chart forms an opposite pattern compared to the MACD line, indicating a potential price reversal.
Divergence in RSI :
In a downtrend, if the price chart forms two consecutive lows with the second lower than the first, but the RSI shows two lows with the second higher, this indicates positive regular divergence, which is a buy signal.
On the other hand, during an uptrend, if the price forms two highs with the second higher than the first, but the RSI shows the second high lower, this points to negative regular divergence, indicating a sell signal.
Divergence in AO (Awesome Oscillator) :
The AO indicator calculates histograms using the difference between 5-period and 34-period simple moving averages. It compares peaks and troughs of these histograms with price movements, detecting divergence and plotting lines and arrows to signal divergence.
🔵 Table
The following table breaks down the main features of the oscillator. It covers four critical categories: Exist, Consecutive, Divergence Quality, and Change Phase Indicator.
Exist : If divergence is detected, a "+" will appear in this row.
Consecutive: Shows the number of consecutive divergences that have formed in a short period.
Divergence Quality : Evaluates the quality of the divergence based on the number of occurrences. One is labeled "Normal," two are "Good," and three or more are considered "Strong."
Change Phase Indicator : If a phase change is detected between two oscillation peaks, this is marked in the table.

Adaptive MA Scalping StrategyAdaptive MA Scalping Strategy
The Adaptive MA Scalping Strategy is an innovative trading approach that merges the strengths of the Kaufman's Adaptive Moving Average (KAMA) with the Moving Average Convergence Divergence (MACD) histogram. This combination results in a momentum-adaptive moving average that dynamically adjusts to market conditions, providing traders with timely and reliable signals.
How It Works
Kaufman's Adaptive Moving Average (KAMA): Unlike traditional moving averages, KAMA adjusts its sensitivity based on market volatility. It becomes more responsive during trending markets and less sensitive during periods of consolidation, effectively filtering out market noise.
MACD Histogram Integration: The strategy incorporates the MACD histogram, a momentum indicator that measures the difference between a fast and a slow exponential moving average (EMA). By adding the MACD histogram values to the KAMA, the strategy creates a new line—the momentum-adaptive moving average (MOMA)—which captures both trend direction and momentum.
Signal Generation:
Long Entry: The strategy enters a long position when the closing price crosses above the MOMA. This indicates a potential upward momentum shift.
Exit Position: The position is closed when the closing price crosses below the MOMA, signaling a potential decline in momentum.
Cloud Calculation Detail
The MOMA is calculated by adding the MACD histogram value to the KAMA of the price. This addition effectively adjusts the KAMA based on the momentum indicated by the MACD histogram. When momentum is strong, the MACD histogram will have higher values, causing the MOMA to adjust accordingly and provide earlier entry or exit signals.
Performance on Stocks
This strategy has demonstrated excellent performance on stocks when applied to the 1-hour timeframe. Its adaptive nature allows it to respond swiftly to market changes, capturing profitable trends while minimizing the impact of false signals caused by market noise. The combination of KAMA's adaptability and MACD's momentum detection makes it particularly effective in volatile market conditions commonly seen in stock trading.
Key Parameters
KAMA Length (malen): Determines the sensitivity of the KAMA. A length of 100 is used to balance responsiveness with noise reduction.
MACD Fast Length (fast): Sets the period for the fast EMA in the MACD calculation. A value of 24 helps in capturing short-term momentum changes.
MACD Slow Length (slow): Sets the period for the slow EMA in the MACD calculation. A value of 52 smooths out longer-term trends.
MACD Signal Length (signal): Determines the period for the signal line in the MACD calculation. An 18-period signal line is used for timely crossovers.
Advantages of the Strategy
Adaptive to Market Conditions: By adjusting to both volatility and momentum, the strategy remains effective across different market phases.
Enhanced Signal Accuracy: The fusion of KAMA and MACD reduces false signals, improving the accuracy of trade entries and exits.
Simplicity in Execution: With straightforward entry and exit rules based on price crossovers, the strategy is user-friendly for traders at all experience levels

BRT MACD CustomBRT MACD Custom — Adaptive and Flexible MACD for Multi-Timeframe Analysis
The BRT MACD Custom is an advanced version of the traditional MACD indicator, offering additional flexibility and adaptability for multi-timeframe trading. This custom script allows traders to adjust the calculation parameters for MACD to suit their specific trading strategy, timeframe, and market conditions.
Key Features
Multi-Timeframe Support
Unlike the standard MACD, this indicator lets you choose a specific timeframe (different from the chart timeframe) for calculating MACD values. This feature provides more flexibility in analyzing market trends on multiple timeframes without changing the main chart.
Example: You can analyze MACD on a 15-minute timeframe even when your chart is set to 1-minute, giving you broader market insights.
Customizable EMA and Signal Settings
Users can adjust the fast and slow EMA lengths as well as the signal smoothing to better align with their preferred trading strategies. The script allows switching between the two popular types of moving averages — SMA or EMA — for both the MACD and the signal line.
Volatility-Based Adaptive EMA
The script includes an adaptive mechanism for EMA calculation. When the selected timeframe closes, the indicator dynamically adjusts the calculation, ensuring the MACD values respond quickly to market volatility. This makes the indicator more reactive compared to static MACD implementations.
Shift Options for MACD, Signal, and Histogram
The indicator allows shifting the MACD, signal line, and histogram values by one or more bars. This can be useful for backtesting and simulating strategies where you anticipate future price movements.
Signal Alerts for Long and Short Trades
The script generates visual signals when certain conditions are met, indicating potential long or short trade opportunities. These signals are based on MACD and histogram crossovers:
Long Signal: Triggered when MACD is above the signal line and both are rising.
Short Signal: Triggered when MACD is below the signal line and both are falling.
Custom Plotting
The MACD line, signal line, and histogram are plotted on the chart for easy visualization. The histogram changes colors to reflect positive or negative momentum:
Green shades when MACD is above the signal line.
Red shades when MACD is below the signal line.
Applications in Trading
The BRT MACD Custom is ideal for traders who need flexibility in their technical analysis. Its multi-timeframe capabilities and customizable moving averages make it suitable for day trading, swing trading, and long-term investing across a variety of markets.
Scalping: Use the 1-minute or 5-minute timeframe to identify short-term trends while calculating MACD on a higher timeframe such as 15 or 30 minutes.
Swing Trading: Apply the indicator on 1-hour or 4-hour charts to detect mid-term trends.
Long-Term Investing: Analyze daily or weekly charts with longer EMA periods to confirm market direction before making large investments.

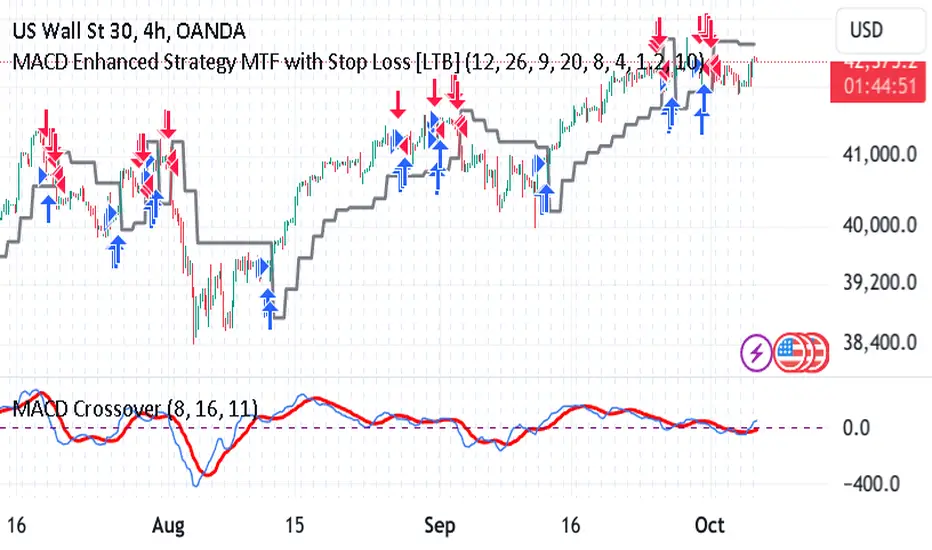
MACD Enhanced Strategy MTF with Stop Loss [LTB]Test strategy for MACD
This strategy, named "MACD Enhanced Strategy MTF with Stop Loss ," is a modified Moving Average Convergence Divergence (MACD) strategy with enhancements such as multi-timeframe (MTF) analysis, custom scoring, and a dynamic stop loss mechanism. Let’s break down how to effectively use it:
Key Elements of the Strategy
MACD Indicator with Modifications:
The strategy uses MACD, a well-known momentum indicator, with customizable parameters:
fastLength, slowLength, and signalLength represent the standard MACD settings.
Instead of relying solely on MACD crossovers, it introduces scoring parameters for histogram direction (histside), indicator direction (indiside), and signal cross (crossscore). This allows for a more nuanced decision-making process when determining buy and sell signals.
Multi-Timeframe Analysis (MTF):
The strategy compares the current timeframe's MACD score with that of a higher timeframe (HTF). It dynamically selects the higher timeframe based on the current timeframe. For example, if the current chart period is 1, it will select 5 as the higher timeframe.
This MTF approach aims to align trades with broader trends, filtering out false signals that could be present when analyzing only a single timeframe.
Scoring System:
A custom scoring system (count() function) is used to evaluate buy and sell signals. This includes calculations based on the direction and momentum of MACD (indi) and the histogram. The score is used to determine the strength of signals.
Positive scores indicate bullish sentiment, while negative scores indicate bearish sentiment.
This scoring mechanism aims to reduce the influence of noise and provide more reliable entries.
Entry Conditions:
Long Condition: When the Result value (a combination of MTF and current MACD analysis) changes and becomes positive, a long entry is triggered.
Short Condition: When the Result changes and becomes negative, a short entry is initiated.
Stop Loss Mechanism:
The countstop() function calculates dynamic stop loss values for both long and short trades. It is based on the Average True Range (ATR) multiplied by a factor (Mult), providing adaptive stop loss levels depending on market volatility.
The stop loss is plotted on the chart to show potential risk levels for open trades, with the line appearing only if shotsl is enabled.
How to Use the Strategy
To properly use the strategy, follow these steps:
Parameter Optimization:
Adjust the input parameters such as fastLength, slowLength, and signalLength to tune the MACD indicator to the specific asset you’re trading. The values provided are typical defaults, but optimizing these values based on backtesting can help improve performance.
Customize the scoring parameters (crossscore, indiside, histside) to balance how much weight you want to put on the direction, histogram, and cross events of the MACD indicator.
Select Appropriate Timeframes:
This strategy employs a multi-timeframe (MTF) approach, so it's important to understand how the higher timeframe (HTF) is selected based on the current timeframe. For instance, if you are trading on a 5-minute chart, the higher timeframe will be 15 minutes, which helps filter out lower timeframe noise.
Ensure you understand the relationship between the timeframe you’re using and the HTF it automatically selects. The strategy’s effectiveness can vary depending on how these timeframes align with the asset’s overall volatility.
Run Backtests:
Always backtest the strategy over historical data to determine its reliability for the asset and timeframes you’re interested in. Note that the MTF approach may require substantial data to capture how different timeframes interact.
Use the backtest results to adjust the scoring parameters or the Stop Loss Factor (Mult) for better risk management.
Stop Loss Usage:
The stop loss is calculated dynamically using ATR, which means that it adjusts with changing volatility. This can be useful to avoid being stopped out too often during periods of increased volatility.
The shotsl parameter can be set to true to visualize the stop loss line on the chart. This helps to monitor the protection level and make better decisions regarding holding or closing a trade manually.
Entry Signals and Trade Execution:
Look for changes in the Result value to determine entry points. For a long position, the Result needs to become positive, and for a short position, it must be negative.
Note that the strategy's entries are more conservative because it waits for the Result to confirm the direction using multiple factors, which helps filter out false breakouts.
Risk Management:
The adaptive stop loss mechanism reduces the risk by basing the stop level on market volatility. However, you must still consider additional risk management practices such as position sizing and profit targets.
Given the scoring mechanism, it might not enter trades frequently, which means using this strategy may result in fewer but potentially more accurate trades. It’s important to be patient and not force trades that don’t align with the calculated results.
Real-Time Monitoring:
Make sure to monitor trades actively. Since the strategy recalculates the score on each bar, real-time changes in the Result value could provide exit opportunities even if the stop loss isn't triggered.
Summary
The "MACD Enhanced Strategy MTF with Stop Loss " is a sophisticated version of the MACD strategy, enhanced with multi-timeframe analysis and adaptive stop loss. Properly using it involves optimizing MACD and scoring parameters, selecting suitable timeframes, and actively managing entries and exits based on a combination of scoring and volatility-based stop losses. Always conduct thorough backtesting before applying it in a live environment to ensure the strategy performs well on the asset you're trading.
Momentum-Based Buy/Sell SignalsBuy Signal:
Triggered when ROC > threshold and the MACD line crosses above the Signal line.
Sell Signal:
Triggered when ROC < threshold and the MACD line crosses below the Signal line.
Visual Elements:
Green labels with "Buy" are displayed below the bars for buy signals.
Red labels with "Sell" are displayed above the bars for sell signals.
The background turns green during a buy signal and red during a sell signal for better visual clarity.

MACD Diff SignalWhen the MACD Absolute Histogram is above a threshold (set by nth lowest absolute histogram value in the rolling window) the indicator produces the MACD Histogram level, otherwise it produces 0. This Indicator is good for identifying bullish or bearish momentum.

Custom MACD Oscillator with Bar ColoringCustom MACD Oscillator with Bar Coloring
This custom MACD indicator is a fusion of two powerful MACD implementations, combining the best features of both the MACD Crossover by HPotter and the Multiple Time Frame Custom MACD Indicator by ChrisMoody. The indicator enhances the traditional MACD with customizable options and dynamic bar coloring based on the relationship between the MACD and Signal lines, providing a clear visual representation of momentum shifts in the market.
Key Features:
MACD Oscillator: Built on the core MACD principle, showing the difference between two Exponential Moving Averages (EMA) for momentum tracking.
Signal Line: A Simple Moving Average (SMA) of the MACD, helping to identify potential entry/exit points through crossovers.
Multiple Time Frame Support: Allows users to view MACD and Signal data from different timeframes, giving a broader view of the market dynamics.
Bar Coloring: Bars are colored green when the MACD is above the Signal line (bullish), red when the MACD is below (bearish), and blue during neutral conditions.
Histogram with Custom Colors: A customizable histogram visualizes the difference between the MACD and Signal lines with color-coding to represent changes in momentum.
Cross Dots: Visual markers at points where the MACD crosses the Signal line for easy identification of potential trend shifts.
This indicator is a versatile tool for traders who want to visualize MACD-based momentum and crossover signals in multiple timeframes with clear visual cues on price bars.

Volume Wave Trend ConfirmationUtility of the Indicator
The core utility of this indicator lies in its ability to utilize volume, a less frequently exploited metric in MACD analysis, providing several strategic advantages:
Trend Confirmation: By focusing on volume, the indicator confirms whether movements in price are backed by significant trading activity. A rising MACD line above the signal line, paired with increasing volume, can confirm the strength of an uptrend. Conversely, if the histogram turns negative while the MACD line falls below the signal line during a price drop, it confirms a robust downtrend.
Early Warning Signals: Changes in the histogram and divergences between the MACD and Signal lines can serve as early warnings of potential reversals or slowdowns in market momentum. For instance, a shrinking histogram in an uptrend might suggest that the upward movement is losing steam.
Market Sentiment: The integration of volume into the MACD framework allows the indicator to provide insights into underlying market sentiment. Higher volumes during price movements indicate stronger conviction among traders, making the trend more reliable.
Indicator Functionality
The "Volume Wave Trend Confirmation" indicator is built on the Moving Average Convergence Divergence (MACD) framework, but with a unique twist: it uses the smoothed moving averages (SMA) of trading volumes instead of price. The indicator calculates two specific SMAs of the volume — a shorter 33-period SMA and a longer 100-period SMA — and computes their difference. This difference is then used as the input for the MACD calculation, with typical parameters set at 12, 26, and a signal line of 9.
MACD Line (Blue): Represents the main line, calculated as the difference between the 12-period and 26-period exponential moving averages (EMA) of the volume difference.
Signal Line (Orange): A 9-period EMA of the MACD line, acting as a trigger for buy or sell signals.
Histogram (Blue/Purple): Measures the distance between the MACD line and the Signal line, colored blue when positive (above the Signal line) and purple when negative (below the Signal line).

VWAP PressureKey Features and Utility:
Intrabar Focus: Unlike standard VWAP, which provides a cumulative average throughout the day, the Intrabar VWAP focuses on volume-weighted price calculations within shorter time frames. This allows traders to see how price and volume interact moment-to-moment, offering a granular view of market sentiment.
Market Pressure Analysis: The indicator examines the difference between a smoothed weighted average price of the close and intrabar price movements. This analysis helps in identifying the market pressure at high volume areas. When the market exhibits high volume at low prices within a bar, it suggests accumulation, whereas high volume at high prices indicates distribution.
Momentum and Pressure Shift Signals: By applying a modified MACD calculation to the smoothed difference, the indicator provides signals on shifts in market pressure. Positive values indicate upward price momentum (buying pressure), while negative values suggest downward momentum (selling pressure).

Market DirectionThe "Market Direction" indicator combines four advanced sub-indicators to provide a comprehensive and multi-dimensional analysis of market trends, momentum, and potential reversals. This innovative approach leverages different aspects of price action, volume, and market sentiment, offering traders an in-depth view of market conditions.
1. Fractal Indicator: Multi-Scale Price Action Analysis
The Fractal Indicator identifies significant highs and lows over six different pivot lengths, offering a nuanced view of price action across multiple timeframes. By comparing distances from current closing prices to these key fractal points, the indicator determines potential trend reversals and market direction. This approach enables traders to adapt their strategies to various market conditions, capturing both short-term fluctuations and long-term trends.
2. Volume MACD Indicator: Enhanced Market Momentum
The Volume MACD Indicator goes beyond traditional MACD analysis by incorporating volume-weighted movement and the structural attributes of candlesticks (such as body length and wicks). This hybrid model offers a more comprehensive understanding of market momentum by integrating both price action and trading volume. The use of Smoothed Moving Averages (SMMA) reduces noise and ensures more stable signals, helping traders focus on sustainable trends and longer-term investment opportunities.
3. Cumulative Volume Momentum Indicator: Volume Dynamics Insight
The Cumulative Volume Momentum Indicator evaluates the momentum of cumulative buying and selling volumes, offering a clear picture of market strength and potential reversals. By comparing the relationship between open, close, high, and low prices, and applying a MACD approach to these volume dynamics, this indicator helps traders identify momentum shifts that often precede price movements. The visualization through histograms adds clarity to bullish and bearish volume momentum, enhancing decision-making in volatile markets.
4. POC-Price Momentum Indicator: Market Depth and Sentiment
The POC-Price Momentum Indicator assesses the difference between the Point of Control (POC) and closing prices, providing insights into underlying market sentiment. Positive differences indicate a buildup of upward momentum, while negative differences suggest a bearish tilt. By calculating moving averages of these differences, the indicator highlights the strength and sustainability of ongoing trends, helping traders align their strategies with the broader market direction.
Unified Rating for Confirming Market Direction
The "Market Direction" indicator consolidates the outputs of these four sub-indicators into a single, aggregated sentiment score. This score helps traders confirm the prevailing market trend by weighing the combined insights from fractal analysis, volume momentum, price action, and POC dynamics. A positive score suggests a bullish market, while a negative score indicates bearish conditions.

RSI Trend Following StrategyOverview
The RSI Trend Following Strategy utilizes Relative Strength Index (RSI) to enter the trade for the potential trend continuation. It uses Stochastic indicator to check is the price is not in overbought territory and the MACD to measure the current price momentum. Moreover, it uses the 200-period EMA to filter the counter trend trades with the higher probability. The strategy opens only long trades.
Unique Features
Dynamic stop-loss system: Instead of fixed stop-loss level strategy utilizes average true range (ATR) multiplied by user given number subtracted from the position entry price as a dynamic stop loss level.
Configurable Trading Periods: Users can tailor the strategy to specific market windows, adapting to different market conditions.
Two layers trade filtering system: Strategy utilizes MACD and Stochastic indicators measure the current momentum and overbought condition and use 200-period EMA to filter trades against major trend.
Trailing take profit level: After reaching the trailing profit activation level script activates the trailing of long trade using EMA. More information in methodology.
Wide opportunities for strategy optimization: Flexible strategy settings allows users to optimize the strategy entries and exits for chosen trading pair and time frame.
Methodology
The strategy opens long trade when the following price met the conditions:
RSI is above 50 level.
MACD line shall be above the signal line
Both lines of Stochastic shall be not higher than 80 (overbought territory)
Candle’s low shall be above the 200 period EMA
When long trade is executed, strategy set the stop-loss level at the price ATR multiplied by user-given value below the entry price. This level is recalculated on every next candle close, adjusting to the current market volatility.
At the same time strategy set up the trailing stop validation level. When the price crosses the level equals entry price plus ATR multiplied by user-given value script starts to trail the price with trailing EMA(by default = 20 period). If price closes below EMA long trade is closed. When the trailing starts, script prints the label “Trailing Activated”.
Strategy settings
In the inputs window user can setup the following strategy settings:
ATR Stop Loss (by default = 1.75)
ATR Trailing Profit Activation Level (by default = 2.25)
MACD Fast Length (by default = 12, period of averaging fast MACD line)
MACD Fast Length (by default = 26, period of averaging slow MACD line)
MACD Signal Smoothing (by default = 9, period of smoothing MACD signal line)
Oscillator MA Type (by default = EMA, available options: SMA, EMA)
Signal Line MA Type (by default = EMA, available options: SMA, EMA)
RSI Length (by default = 14, period for RSI calculation)
Trailing EMA Length (by default = 20, period for EMA, which shall be broken close the trade after trailing profit activation)
Justification of Methodology
This trading strategy is designed to leverage a combination of technical indicators—Relative Strength Index (RSI), Moving Average Convergence Divergence (MACD), Stochastic Oscillator, and the 200-period Exponential Moving Average (EMA)—to determine optimal entry points for long trades. Additionally, the strategy uses the Average True Range (ATR) for dynamic risk management to adapt to varying market conditions. Let's look in details for which purpose each indicator is used for and why it is used in this combination.
Relative Strength Index (RSI) is a momentum indicator used in technical analysis to measure the speed and change of price movements in a financial market. It helps traders identify whether an asset is potentially overbought (overvalued) or oversold (undervalued), which can indicate a potential reversal or continuation of the current trend.
How RSI Works? RSI tracks the strength of recent price changes. It compares the average gains and losses over a specific period (usually 14 periods) to assess the momentum of an asset. Average gain is the average of all positive price changes over the chosen period. It reflects how much the price has typically increased during upward movements. Average loss is the average of all negative price changes over the same period. It reflects how much the price has typically decreased during downward movements.
RSI calculates these average gains and losses and compares them to create a value between 0 and 100. If the RSI value is above 70, the asset is generally considered overbought, meaning it might be due for a price correction or reversal downward. Conversely, if the RSI value is below 30, the asset is considered oversold, suggesting it could be poised for an upward reversal or recovery. RSI is a useful tool for traders to determine market conditions and make informed decisions about entering or exiting trades based on the perceived strength or weakness of an asset's price movements.
This strategy uses RSI as a short-term trend approximation. If RSI crosses over 50 it means that there is a high probability of short-term trend change from downtrend to uptrend. Therefore RSI above 50 is our first trend filter to look for a long position.
The MACD (Moving Average Convergence Divergence) is a popular momentum and trend-following indicator used in technical analysis. It helps traders identify changes in the strength, direction, momentum, and duration of a trend in an asset's price.
The MACD consists of three components:
MACD Line: This is the difference between a short-term Exponential Moving Average (EMA) and a long-term EMA, typically calculated as: MACD Line = 12 period EMA − 26 period EMA
Signal Line: This is a 9-period EMA of the MACD Line, which helps to identify buy or sell signals. When the MACD Line crosses above the Signal Line, it can be a bullish signal (suggesting a buy); when it crosses below, it can be a bearish signal (suggesting a sell).
Histogram: The histogram shows the difference between the MACD Line and the Signal Line, visually representing the momentum of the trend. Positive histogram values indicate increasing bullish momentum, while negative values indicate increasing bearish momentum.
This strategy uses MACD as a second short-term trend filter. When MACD line crossed over the signal line there is a high probability that uptrend has been started. Therefore MACD line above signal line is our additional short-term trend filter. In conjunction with RSI it decreases probability of following false trend change signals.
The Stochastic Indicator is a momentum oscillator that compares a security's closing price to its price range over a specific period. It's used to identify overbought and oversold conditions. The indicator ranges from 0 to 100, with readings above 80 indicating overbought conditions and readings below 20 indicating oversold conditions.
It consists of two lines:
%K: The main line, calculated using the formula (CurrentClose−LowestLow)/(HighestHigh−LowestLow)×100 . Highest and lowest price taken for 14 periods.
%D: A smoothed moving average of %K, often used as a signal line.
This strategy uses stochastic to define the overbought conditions. The logic here is the following: we want to avoid long trades in the overbought territory, because when indicator reaches it there is a high probability that the potential move is gonna be restricted.
The 200-period EMA is a widely recognized indicator for identifying the long-term trend direction. The strategy only trades in the direction of this primary trend to increase the probability of successful trades. For instance, when the price is above the 200 EMA, only long trades are considered, aligning with the overarching trend direction.
Therefore, strategy uses combination of RSI and MACD to increase the probability that price now is in short-term uptrend, Stochastic helps to avoid the trades in the overbought (>80) territory. To increase the probability of opening long trades in the direction of a main trend and avoid local bounces we use 200 period EMA.
ATR is used to adjust the strategy risk management to the current market volatility. If volatility is low, we don’t need the large stop loss to understand the there is a high probability that we made a mistake opening the trade. User can setup the settings ATR Stop Loss and ATR Trailing Profit Activation Level to realize his own risk to reward preferences, but the unique feature of a strategy is that after reaching trailing profit activation level strategy is trying to follow the trend until it is likely to be finished instead of using fixed risk management settings. It allows sometimes to be involved in the large movements.
Backtest Results
Operating window: Date range of backtests is 2023.01.01 - 2024.08.01. It is chosen to let the strategy to close all opened positions.
Commission and Slippage: Includes a standard Binance commission of 0.1% and accounts for possible slippage over 5 ticks.
Initial capital: 10000 USDT
Percent of capital used in every trade: 30%
Maximum Single Position Loss: -3.94%
Maximum Single Profit: +15.78%
Net Profit: +1359.21 USDT (+13.59%)
Total Trades: 111 (36.04% win rate)
Profit Factor: 1.413
Maximum Accumulated Loss: 625.02 USDT (-5.85%)
Average Profit per Trade: 12.25 USDT (+0.40%)
Average Trade Duration: 40 hours
These results are obtained with realistic parameters representing trading conditions observed at major exchanges such as Binance and with realistic trading portfolio usage parameters.
How to Use
Add the script to favorites for easy access.
Apply to the desired timeframe and chart (optimal performance observed on 2h BTC/USDT).
Configure settings using the dropdown choice list in the built-in menu.
Set up alerts to automate strategy positions through web hook with the text: {{strategy.order.alert_message}}
Disclaimer:
Educational and informational tool reflecting Skyrex commitment to informed trading. Past performance does not guarantee future results. Test strategies in a simulated environment before live implementation

Scalping with Williams %R, MACD, and SMA (1m)Overview:
This trading strategy is designed for scalping in the 1-minute timeframe. It uses a combination of the Williams %R, MACD, and SMA indicators to generate buy and sell signals. It also includes alert functionalities to notify users when trades are executed or closed.
Indicators Used:
Williams %R : A momentum indicator that measures overbought and oversold conditions. The Williams %R values range from -100 to 0.
Length: 140 bars (i.e., 140-period).
MACD (Moving Average Convergence Divergence) : A trend-following momentum indicator that shows the relationship between two moving averages of a security's price.
Fast Length: 24 bars
Slow Length: 52 bars
MACD Length: 9 bars (signal line)
SMA (Simple Moving Average) : A trend-following indicator that smooths out price data to create a trend-following indicator.
Length: 7 bars
Conditions and Logic:
Timeframe Check :
The strategy is designed specifically for the 1-minute timeframe. If the current chart is not on the 1-minute timeframe, a warning label is displayed on the chart instructing the user to switch to the 1-minute timeframe.
Williams %R Conditions :
Buy Condition: The strategy looks for a crossover of Williams %R from below -94 to above -94. This indicates a potential buying opportunity when the market is moving out of an oversold condition.
Sell Condition: The strategy looks for a crossunder of Williams %R from above -6 to below -6. This indicates a potential selling opportunity when the market is moving out of an overbought condition.
Deactivate Buy: If Williams %R crosses above -40, the buy signal is deactivated, suggesting that the buying condition is no longer valid.
Deactivate Sell: If Williams %R crosses below -60, the sell signal is deactivated, suggesting that the selling condition is no longer valid.
MACD Conditions :
MACD Histogram: Used to identify the momentum and the direction of the trend.
Long Entry: The strategy initiates a buy order if the MACD histogram shows a positive bar after a negative bar while a buy condition is active and Williams %R is above -94.
Long Exit: The strategy exits the buy position if the MACD histogram turns negative and is below the previous histogram bar.
Short Entry: The strategy initiates a sell order if the MACD histogram shows a negative bar after a positive bar while a sell condition is active and Williams %R is below -6.
Short Exit: The strategy exits the sell position if the MACD histogram turns positive and is above the previous histogram bar.
Trend Confirmation (Using SMA) :
Bullish Trend: The strategy considers a bullish trend if the current price is above the 7-bar SMA. A buy signal is only considered if this condition is met.
Bearish Trend: The strategy considers a bearish trend if the current price is below the 7-bar SMA. A sell signal is only considered if this condition is met.
Alerts:
Long Entry Alert: An alert is triggered when a buy order is executed.
Long Exit Alert: An alert is triggered when the buy order is closed.
Short Entry Alert: An alert is triggered when a sell order is executed.
Short Exit Alert: An alert is triggered when the sell order is closed.
Summary:
Buy Signal: Activated when Williams %R crosses above -94 and the price is above the 7-bar SMA. A buy order is placed if the MACD histogram shows a positive bar after a negative bar. The buy order is closed when the MACD histogram turns negative and is below the previous histogram bar.
Sell Signal: Activated when Williams %R crosses below -6 and the price is below the 7-bar SMA. A sell order is placed if the MACD histogram shows a negative bar after a positive bar. The sell order is closed when the MACD histogram turns positive and is above the previous histogram bar.
This strategy combines momentum (Williams %R), trend-following (MACD), and trend confirmation (SMA) to identify trading opportunities in the 1-minute timeframe. It is designed for short-term trading or scalping.

long&short signal Smart Money Concepts (SMC) with MACD Signals Smart Money Concepts (SMC) with MACD Signals
Advanced SMC and MACD Integration for Precision Trading
The "Smart Money Concepts (SMC) with MACD Signals" indicator is a powerful and versatile tool designed to enhance trading strategies by integrating two highly effective technical analysis methods into a single, cohesive indicator. This advanced script combines the Smart Money Concepts (SMC) methodology with the Moving Average Convergence Divergence (MACD) indicator to provide traders with a comprehensive trading solution that identifies key market trends and potential trading opportunities.
What It Does:
Smart Money Concepts (SMC):
The SMC component of this indicator identifies significant price levels and zones where market participants, particularly institutional investors, may be active. It calculates high and low anchor levels based on historical price data, creating zones that help traders understand where price action may encounter support or resistance. These anchor levels are used to plot background colors on the chart, highlighting critical areas of interest where price might react, and generating buy (long) and sell (short) signals based on price interactions with these levels.
MACD (Moving Average Convergence Divergence):
The MACD component provides insights into market momentum and trend strength. By calculating the difference between two moving averages and comparing it to a signal line, the MACD indicator helps traders identify potential changes in trend direction. The script plots the MACD line, signal line, and histogram, offering a clear visual representation of market momentum. Buy (long) and sell (short) signals are generated when the MACD line crosses above or below the signal line, providing timely alerts to potential trading opportunities.
Why It’s Special:
This indicator stands out for its dual functionality, combining the price level analysis of SMC with the momentum-based insights of MACD. The integration allows traders to benefit from both trend and price level analysis, offering a more robust and accurate trading tool. The SMC component highlights critical price zones and provides context for price action, while the MACD component confirms the strength and direction of market trends.
By using this combined approach, traders can make more informed decisions based on comprehensive market analysis. The indicator not only helps in identifying significant price levels and potential market reversals but also provides real-time signals to capitalize on these opportunities. Whether you are a day trader or a swing trader, the "Smart Money Concepts (SMC) with MACD Signals" indicator is designed to enhance your trading strategy with precision and clarity.
This unique combination of SMC and MACD offers a powerful toolset for traders looking to refine their trading strategies and improve their market analysis. With its user-friendly visualizations and signal generation, this indicator is an essential addition to any trader’s toolkit.

Volume-Weighted RSI with HMA SmoothingThis script combines a Volume-Weighted RSI, smoothed with a custom Hull Moving Average (HMA), with a modified MACD based on normalized net volume.
Volume-Weighted RSI: It is calculated by adjusting the closing price with a normalized On-Balance Volume (OBV) and then applying an RSI. This approach weights the RSI according to volume, providing a more accurate measure of the strength of the price movement.
Modified HMA: A Hull Moving Average (HMA) is used to smooth the Volume-Weighted RSI, enhancing the ability to identify market trend changes.
Possible Reversal from Oversold:
The Volume-Weighted RSI crosses above the oversold level.
It is displayed as an upward green triangle at the bottom of the chart, indicating that the market might be exhausting its oversold conditions and potentially starting an upward reversal.
Possible Reversal from Overbought:
The Volume-Weighted RSI crosses below the overbought level.
It is displayed as a downward red triangle at the top of the chart, indicating that the market might be exhausting its overbought conditions and potentially starting a downward reversal.
Confirmation with the Modified MACD: For a more robust interpretation, the behavior of the modified MACD can be observed alongside the RSI cross.
The MACD is also modified, using normalized net volume (calculated as the cumulative change in the closing price multiplied by volume) as the input instead of the standard closing price.
The direction and color change of the MACD bars indicate the market's momentum.
Alerts: Alerts are set to trigger automatically when the modified RSI crosses the oversold or overbought levels.
Español:
Este script combina un RSI ponderado por volumen, suavizado con un Hull Moving Average (HMA) personalizado, con un MACD modificado basado en volumen neto normalizado.
RSI Ponderado por Volumen: Se calcula ajustando el precio de cierre con un OBV (On-Balance Volume) normalizado y luego aplicando un RSI. Este enfoque pondera el RSI según el volumen, proporcionando una medida más precisa de la fuerza del movimiento del precio.
HMA Modificado: Se utiliza un Hull Moving Average (HMA) para suavizar el RSI Ponderado por Volumen, mejorando la capacidad de identificar cambios en la tendencia del mercado.
Posible Reversión desde Sobreventa:
El RSI Ponderado por Volumen cruza por encima del nivel de sobreventa.
Se muestra como un triángulo verde hacia arriba en la parte inferior del gráfico, indicando que el mercado podría estar agotando las condiciones de sobreventa y comenzar una posible reversión al alza.
Posible Reversión desde Sobrecompra:
El RSI Ponderado por Volumen cruza por debajo del nivel de sobrecompra.
Se muestra como un triángulo rojo hacia abajo en la parte superior del gráfico, indicando que el mercado podría estar agotando las condiciones de sobrecompra y comenzar una posible reversión a la baja.
Confirmación con el MACD Modificado: Para una interpretación más robusta, se puede observar el comportamiento del MACD modificado junto con el cruce del RSI.
El MACD también está modificado, utilizando el volumen neto normalizado (calculado como el cambio acumulativo en el precio de cierre multiplicado por el volumen) como entrada en lugar del precio de cierre estándar.
La dirección y el cambio de color de las barras del MACD indican el impulso del mercado.
Alertas: Las alertas están configuradas para activarse automáticamente cuando el RSI modificado cruza los niveles de sobreventa o sobrecompra.

[KVA] KMACDKMACD Indicator: Advanced Market Analysis Through Central Tendency Metrics
The KMACD (KAMVIA Moving Average Convergence Divergence) indicator is an advanced, multi-dimensional tool designed to provide traders and analysts with a deeper understanding of market dynamics. By integrating the classical MACD framework with statistical measures of central tendency, KMACD offers a sophisticated approach to identifying trends, reversals, and potential trading opportunities.
Key Features of the KMACD Indicator:
1. Enhanced MACD Calculation :
- The KMACD employs dual moving averages (fast and slow) of user-defined types (SMA, EMA, WMA) to calculate the MACD line, which represents the difference between these moving averages. This traditional approach is further enhanced by customizable signal smoothing, allowing users to fine-tune the sensitivity of the indicator.
2. Central Tendency Metrics :
- The indicator integrates additional statistical measures, such as Mean, Median, Mode, Standard Deviation, and Variance, calculated over a rolling window. These metrics provide insights into the central tendencies of the MACD values, helping traders understand the overall trend direction and the dispersion of price movements around the trend.
3. RSI-Like Oscillator :
- A unique RSI-like value derived from the MACD line is included to highlight overbought and oversold conditions. This offers a dual-layered perspective, combining the power of MACD and RSI methodologies, to signal potential market extremes with greater precision.
4. Customizable Visual Elements :
- KMACD allows users to toggle the visibility of the MACD line, Signal line, and Histogram, providing flexibility in how the data is presented. The histogram dynamically changes color—green when above zero, indicating bullish momentum, and red when below zero, indicating bearish momentum.
5. Horizontal Line Customization :
- The indicator includes customizable horizontal lines for the zero level, overbought, and oversold thresholds. These lines serve as visual cues to identify key price levels and market conditions.
6. Adaptive to Various Market Conditions :
- KMACD's comprehensive features make it adaptable to various market conditions, from trending markets to sideways consolidations. Whether you're looking to capture momentum shifts or identify potential reversal points, KMACD provides the analytical power needed to make informed trading decisions.
How to Use KMACD:
- Trend Identification : Use the MACD line in conjunction with central tendency measures (Mean, Median, Mode) to gauge the overall market trend and its strength. A rising MACD line, supported by higher mean and median values, typically indicates an uptrend.
- Momentum Analysis : The histogram and RSI-like value help in identifying the momentum behind price movements. Positive histogram bars suggest increasing bullish momentum, while negative bars suggest increasing bearish momentum.
- Overbought/Oversold Conditions : Monitor the RSI-like oscillator and the overbought/oversold levels to detect when the market may be poised for a reversal.
- Divergence Detection : Look for divergences between the MACD line and price action, supported by the central tendency measures, to spot potential reversal points.
Conclusion
The KMACD indicator is more than just a traditional MACD; it’s a comprehensive tool designed to cater to both novice and experienced traders. By incorporating central tendency metrics and customizable features, KMACD stands out as a versatile and powerful indicator that enhances market analysis and trading strategies. Whether you're navigating volatile markets or steady trends, KMACD offers the precision and depth needed to stay ahead.

MACD with 1D Stochastic Confirmation Reversal StrategyOverview
The MACD with 1D Stochastic Confirmation Reversal Strategy utilizes MACD indicator in conjunction with 1 day timeframe Stochastic indicators to obtain the high probability short-term trend reversal signals. The main idea is to wait until MACD line crosses up it’s signal line, at the same time Stochastic indicator on 1D time frame shall show the uptrend (will be discussed in methodology) and not to be in the oversold territory. Strategy works on time frames from 30 min to 4 hours and opens only long trades.
Unique Features
Dynamic stop-loss system: Instead of fixed stop-loss level strategy utilizes average true range (ATR) multiplied by user given number subtracted from the position entry price as a dynamic stop loss level.
Configurable Trading Periods: Users can tailor the strategy to specific market windows, adapting to different market conditions.
Higher time frame confirmation: Strategy utilizes 1D Stochastic to establish the major trend and confirm the local reversals with the higher probability.
Trailing take profit level: After reaching the trailing profit activation level scrip activate the trailing of long trade using EMA. More information in methodology.
Methodology
The strategy opens long trade when the following price met the conditions:
MACD line of MACD indicator shall cross over the signal line of MACD indicator.
1D time frame Stochastic’s K line shall be above the D line.
1D time frame Stochastic’s K line value shall be below 80 (not overbought)
When long trade is executed, strategy set the stop-loss level at the price ATR multiplied by user-given value below the entry price. This level is recalculated on every next candle close, adjusting to the current market volatility.
At the same time strategy set up the trailing stop validation level. When the price crosses the level equals entry price plus ATR multiplied by user-given value script starts to trail the price with EMA. If price closes below EMA long trade is closed. When the trailing starts, script prints the label “Trailing Activated”.
Strategy settings
In the inputs window user can setup the following strategy settings:
ATR Stop Loss (by default = 3.25, value multiplied by ATR to be subtracted from position entry price to setup stop loss)
ATR Trailing Profit Activation Level (by default = 4.25, value multiplied by ATR to be added to position entry price to setup trailing profit activation level)
Trailing EMA Length (by default = 20, period for EMA, when price reached trailing profit activation level EMA will stop out of position if price closes below it)
User can choose the optimal parameters during backtesting on certain price chart, in our example we use default settings.
Justification of Methodology
This strategy leverages 2 time frames analysis to have the high probability reversal setups on lower time frame in the direction of the 1D time frame trend. That’s why it’s recommended to use this strategy on 30 min – 4 hours time frames.
To have an approximation of 1D time frame trend strategy utilizes classical Stochastic indicator. The Stochastic Indicator is a momentum oscillator that compares a security's closing price to its price range over a specific period. It's used to identify overbought and oversold conditions. The indicator ranges from 0 to 100, with readings above 80 indicating overbought conditions and readings below 20 indicating oversold conditions.
It consists of two lines:
%K: The main line, calculated using the formula (CurrentClose−LowestLow)/(HighestHigh−LowestLow)×100 . Highest and lowest price taken for 14 periods.
%D: A smoothed moving average of %K, often used as a signal line.
Strategy logic assumes that on 1D time frame it’s uptrend in %K line is above the %D line. Moreover, we can consider long trade only in %K line is below 80. It means that in overbought state the long trade will not be opened due to higher probability of pullback or even major trend reversal. If these conditions are met we are going to our working (lower) time frame.
On the chosen time frame, we remind you that for correct work of this strategy you shall use 30min – 4h time frames, MACD line shall cross over it’s signal line. The MACD (Moving Average Convergence Divergence) is a popular momentum and trend-following indicator used in technical analysis. It helps traders identify changes in the strength, direction, momentum, and duration of a trend in a stock's price.
The MACD consists of three components:
MACD Line: This is the difference between a short-term Exponential Moving Average (EMA) and a long-term EMA, typically calculated as: MACD Line=12-period EMA−26-period
Signal Line: This is a 9-period EMA of the MACD Line, which helps to identify buy or sell signals. When the MACD Line crosses above the Signal Line, it can be a bullish signal (suggesting a buy); when it crosses below, it can be a bearish signal (suggesting a sell).
Histogram: The histogram shows the difference between the MACD Line and the Signal Line, visually representing the momentum of the trend. Positive histogram values indicate increasing bullish momentum, while negative values indicate increasing bearish momentum.
In our script we are interested in only MACD and signal lines. When MACD line crosses signal line there is a high chance that short-term trend reversed to the upside. We use this strategy on 45 min time frame.
ATR is used to adjust the strategy risk management to the current market volatility. If volatility is low, we don’t need the large stop loss to understand the there is a high probability that we made a mistake opening the trade. User can setup the settings ATR Stop Loss and ATR Trailing Profit Activation Level to realize his own risk to reward preferences, but the unique feature of a strategy is that after reaching trailing profit activation level strategy is trying to follow the trend until it is likely to be finished instead of using fixed risk management settings. It allows sometimes to be involved in the large movements.
Backtest Results
Operating window: Date range of backtests is 2023.01.01 - 2024.08.01. It is chosen to let the strategy to close all opened positions.
Commission and Slippage: Includes a standard Binance commission of 0.1% and accounts for possible slippage over 5 ticks.
Initial capital: 10000 USDT
Percent of capital used in every trade: 30%
Maximum Single Position Loss: -4.79%
Maximum Single Profit: +20.14%
Net Profit: +2361.33 USDT (+44.72%)
Total Trades: 123 (44.72% win rate)
Profit Factor: 1.623
Maximum Accumulated Loss: 695.80 USDT (-5.48%)
Average Profit per Trade: 19.20 USDT (+0.59%)
Average Trade Duration: 30 hours
These results are obtained with realistic parameters representing trading conditions observed at major exchanges such as Binance and with realistic trading portfolio usage parameters.
How to Use
Add the script to favorites for easy access.
Apply to the desired timeframe between 30 min and 4 hours and chart (optimal performance observed on 45 min BTC/USDT).
Configure settings using the dropdown choice list in the built-in menu.
Set up alerts to automate strategy positions through web hook with the text: {{strategy.order.alert_message}}
Disclaimer:
Educational and informational tool reflecting Skyrex commitment to informed trading. Past performance does not guarantee future results. Test strategies in a simulated environment before live implementation
