RedK_xMACD: Extending the classic MACD with a simple filterThis is a simple concept that attempts to squeeze more price action insights from the classic MACD
we add a 3rd (longer length, slower) Moving Average line that acts as a trend filter - so whenever we are ("we" = the price and the 2 other MAs) are above that filter line, we consider ourselves to be in the up-trend territory, and vica versa .. so the MACD calculation here - that is represented by the main (reg/green) line in the plot - will represent the distance between the slow MA and the filter MA - when that MACD line crosses the zero axis up or down, that represents the trand reversing from one direction to the other.
A signal line (a smoothed version of that MACD line) is still added for 2 reasons
1 - the signal line makes it easy to see if an eminent trend reversal is to be expected
2 - to stay visually-consistent with the classic MACD :)
the distance (or delta) between the other 2 MAs continues to reflect an indication of the short-term momentum and is what the histogram represents.
we still have the benefit of the convergence/diversion between the price itself and the histogram similar to the classic MACD
this MACD version will also clearly show how price and momentum action will lead the trend -- i know that's a big discussion topic :)
i added a classic MACD at the bottom panel, and used the same length settings (fast / slow) for side-by-side comparison
i coded this when i found that i use 3 moving averages all the time during my chart analysis, and while i'm a big fan of the classic MACD, i wanted to find a simple way to get my MACD to reflect what the 3 MAs on the price chart show. turned out to be insightful - i hope other fellow traders may find this useful
the code is simple and i started it from the built-in MACD in TradingView. Other annotations are added to the chart here as i believe this will better explain how the eXtended MACD works
- there are 4 reversals that occur in that chart, and i chose to show one in step-by-step fashion.
if more explanation is needed to how this can be used, pls let me know in the comments.
Đường Trung bình động Hội tụ/Phân kỳ (MACD)

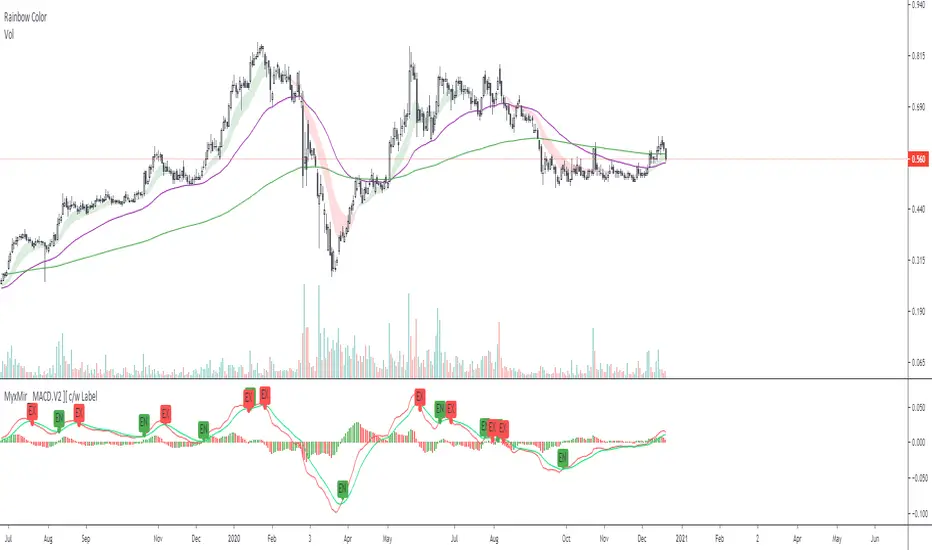
Myx.Mir_ MACD.V2 ][ c/w Hist.Color & LabelMoving average convergence divergence ( MACD ) is commonly and widely used for Technical Analysis .
// Basis- based on default setting
macdLine, signalLine, histLine = default setting
with additional "cosmetic/ Makeup"
1) for 4R1G set up Trader. Histogram color as follows:-
a) if Hist => 0 = Hist > Hist ? color.green : na, Hist < Hist ? color.red : na
b) if Hist <= 0 = Hist < Hist ? color.green : na, Hist > Hist ? color.red : na
2) crossover MACD Line, SignalLine- with label "EN" / "EX"
Do not follow the signal blindly. Trader's should be able to identify the trend whether there is uptrend, sideways and downtrend.
Entry and/or Exit are based on Trader's risk appetite.
[fareid] Quick Backtest Framework█ OVERVIEW
This Framework allows Pine Coders to quickly code Study() based signal/strategy and validate its viability before proceed to code with more advance/complex customized rules for entry, exit, trailstop, risk management etc..
This is somewhat an upgraded version of my earlier personal template with different strategy used, cleaner code
and additional features.
█ USE CASES
- You have an idea for trade signal and need a quick way to verify its potential before writing lengthy/complicated code
- You found a study script for trading signal in public library and want to validate it profitability with minimum effort before including it in your trading playbook
█ FEATURES
- Alert: Ready to use alert function based on signals from your custom indicator.
- Visual Backtest: Auto-plot entry, stop-loss and take profit for simple strategy performance analysis
- Backtest Statistic: Provide basic key metrics based on backtest strategy
- BTE External Signal Protocol: Ready to use code that will supply required state to PineCoders Backtesting & Trading Engine if you wish to have more advance and sophisticated backtesting engine
Notes: All of the above features have On/Off toggle
█ Description & How To Use
This Framework consist of 5 Modules but you only need to edit the first 2 Modules:
Module1: Indicator
Module2: Framework Input Protocol
Module3: Alert
Module4: Backtest
Module5: Backtest & Trading Engine
Tips: The source-code includes collapsible block by module for easy navigating
Module1: Indicator:
-----------------------------------------------------------------------------------
Main Module. Place custom indicator input parameter/calculation/indicator plotting here
Sample Strategy: Double MACD Crossover
MACD Signal: 1st MACD Cross above signal line indicate Buy Signal
1st MACD Cross below signal line indicate Sell Signal
MACD Filter: 2nd MACD is above 0 line indicate Uptrend
2nd MACD is below 0 line indicate Downtrend
Module2: Framework Input Protocol:
-----------------------------------------------------------------------------------
Use this module to connect main indicator/signal calculated in Module1 to the rest of the framework's module
4 variables needed to be defined here:
1. Uptrend
2. Dntrend
3. BuySignal
4. SellSignal
i'm not sure how to place a code snippet here to show you example so in the source code i already put a comment in Module2 on which part u need to edit. I hope its pretty simple to use.
Module3: Alert Module Description:
-----------------------------------------------------------------------------------
As long as the variables in Module2 properly defined, the alert module is ready to use without any further modification.
Input:
Enable Alert --> Enable TV's alert and plot signal to chart
Alert Type --> Set to take Buy only, Sell only or Both alert
Module4: Backtest Module Description:
-----------------------------------------------------------------------------------
As long as the variables in Module2 properly defined, the backtest module is ready to use without any further modification.
Input:
Backtest Stat --> Enable Backtest Statistic Label
Backtest Visual --> Enable Backtest visual simulation
Backtest Type --> Set to take Buy only or Sell only or both
SL Type -->
ATR : Set SL in ATR times Multiplier below entry price
Fixed : Set SL in fixed point below entry point (in 'Dollar'). e.g. for Stocks -> 0.5 equals to 50cent while for EURUSD currency -> 0.005 equal to 50 pips
HiLo Bar: Set SL at highest/lowest wick of previous bar plus/minus Fixed point. e.g. EURUSD HiLo=3 and Fixed Point = 0.0005, buy trade will place SL 5 Pips below lowest of previous 3 bar
SL ATR Multi --> Set Lookback Period used for SL's ATR calculation
SL ATR Multi --> Set ATR Multiplier for SL
SL Fixed --> Set Fixed Level for SL
SL Bar --> Set Number of previous bar to check for SL placement
TP RR Ratio --> Set TP based on RR multiplier. e.g. 2 means TP level will be twice further from entry point compared to Entry-SL distance.
Notes: The point is for preliminary testing, so it only supports 1 trade at a time and no Trailing Stop
Module5: Backtest & Trading Engine Description:
-----------------------------------------------------------------------------------
As long as the variables in Module2 properly defined, the Pinecoders BTE module is ready to use without any further modification.
Input:
External Signal Protocol --> Set ESP State to send to "Backtesting & Trading Engine "
Signal With Filter --> Use this to send entry signal that already filtered by this study indicator (without stoploss level)
Signal Without Filter --> Use this to send raw entry signal that are NOT YET FILTERED by this study indicator (without stoploss level)
Signal and Stop With Filter --> Use this to send entry signal WITH StopLoss that already filtered by this study indicator (with stoploss level)
Signal and Stop Without Filter --> Use this to send raw entry signal WITH StopLoss that are NOT YET FILTERED by this study indicator (with stoploss level)
Notes: Backtesting & Trading Engine already have built-in Filter, Entries and Stop Level. e.g. Unselect all their filter state if only want to use custom filter and make sure send Signal with Filter (with or without SL level)
█ DISCLAIMER:
This framework main objective is to create my personal indicator template so that i just have to modify the indicator module for preliminary testing in future.
The sample strategy included are for educational purpose only. Use at your own risk
credit: LucF/PineCoders for a lot of his scripts that i use as a guide to complete this

MACD With Trend Filter: Visual Backtest Module TemplateSample Strategy: MACD Crossover with trend filter options
MA Filter : Price Close Above MA, Search for Buy, Price Close Below MA, Search for Sell
ADX Filter : Take trade only when ADX is above certain treshold
MACD Signal : MACD Cross above signal line while under 0 line indicate Buy Signal
MACD Cross below signal line while above 0 line indicate Sell Signal
-----------------------------
Using Alert Module:
Enable Alert --> Enable TV's alert and plot signal to chart
Alert Type --> Set to take Buy only, Sell only or Both alert
----------------------------
Using Backtest Module:
Enable Backtest --> Enable Backtest simulation
Backtest Type --> Set to take Buy only, Sell only or Both
SL Type -->
ATR : Set SL in ATR times Multiplier below/above entry price
Fixed : Set SL in fixed point below entry point (in 'Dollar'). e.g. for Stocks -> 0.5 equals to 50cent while for EURUSD currency -> 0.005 equal to 50 pips
HiLo Bar : Set SL at highest/lowest wick of previous bar plus/minus Fixed point. e.g. EURUSD HiLo=3 and Fixed Point = 0.0005, buy trade will place SL 5 Pips below lowest of previous 3 bar
SL ATR Period --> Set Lookback Period used for SL's ATR calculation
SL ATR Multi --> Set ATR Multiplier for SL
SL Fixed --> Set Fixed Level for SL (Use when SL Type is either Fixed or HiLo Bar)
SL Bar --> Set Number of previous bar to check for SL placement
TP RR Ratio --> Set TP based on RR multiplier. e.g. 2 means TP level will be twice further from entry point compared to Entry-SL distance.
Notes: The point is for preliminary testing, so it only supports 1 trade at a time and no Trailing Stop
----------------------------
Disclaimer:
This script main objective is to create my personal indicator template so that i just have to modify the indicator module for preliminary testing in future.
Testing Alert Module so i can re-use it as template in future study/indicator
Testing Visual Backtest Module so i can re-use it as template in future study/indicator
i believe using Strategy function is a better approach for this but the entry/exit level seems to be hit n miss (at least for me, still trying to figure what i did wrong)
also, i rather code the strategy in other platform where i can use the more accurate tick data if i want to validate backtest statistics.
My study scripts was built only to test/visualize an idea to see its viability and if it can be used to optimize existing strategy.
credit: ADX code are originally from "ADX and DI" by @BeikabuOyaji although i re-wrote so i can have cleaner read and use RMA instead of SMA

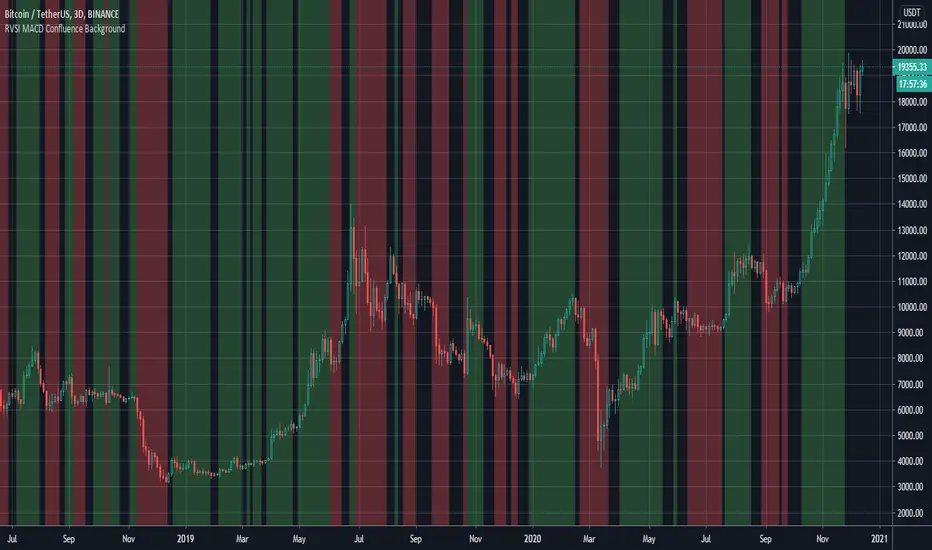
RVSI & MACD Confluence BackgroundThis indicator colors the background in vertical (green/red) stripes to indicate if the current trend is possibly bull / bear
A region where the background is not colored indicates that the present trend can not be identified
The algo combines the RVSI (Relative Volume Strength Index {ref fract} ) and the MACD
The Relative Volume Strength Index has been adapted to include 2 moving averages, one fast and one slow
This same fast slow lookback length is applied to the MACD for simplicity
What's interesting is that there is a very strong confluence between the MACD and RVSI, as the MACD is obtained from 'price action only' and the RVSI from the 'volume only'
So a break in confluence of these two might suggest that the current trend is weakening in confidence or can not be clearly identified
Generally, a green background means consider going long ie price trend is rising
A red background means consider going short ie price trend is falling
An absent background color means - consider exiting current trade or wait to get into a new trade
Best Regards, MoonFlag - and a special thanks/mention to 'fract' for the RVSI algo this is derived from
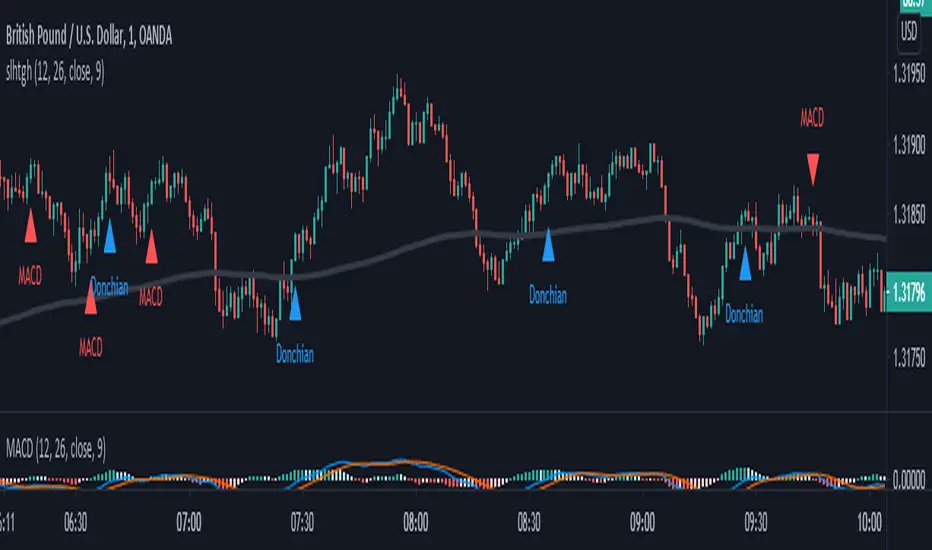
SALEH MACD Donchian + EMA & MACD + ADXI gathered all the signals coming from the MACD & Donchian channels indicators and filtered them with EMA 200 or ADX > 25 indicators (which both of them show the trend),
and put them on the chart to show me the buy and sell signals;
the signals rules are as following:
BUY:
when we have an uptrend ( the price is above the EMA 200 or ADX > 25 ) & the macd line cross up the signal line while they are both under the 0 level of histogram it generates buy signals.
SELL:
when we have a downtrend ( the price is below the EMA 200 or ADX > 25) & the macd line cross below the signal line while they are both above the 0 level of histogram it generates sell signals.
Donchian channel works as a confirmation for the macd signal.
this signals work best at London session, you can also filter them by chandelier exit indicator.

macd strategyOkay
User Avatar
Rules using ( MACD 12 26 Close 9 ):
Place a SELL signal when :
1. Histogram bar turned RED from GREEN
2. Within the previous group of green histogram bars the maximum value reached/passed +5.5
3. MACD fast & slow have values > 0
Place a BUY signal when :
1. Histogram bar turned GREEN from RED
2. Within the previous group of RED histogram bars has maximum value reached/passed -5.0
3. MACD fast & slow have values < 0
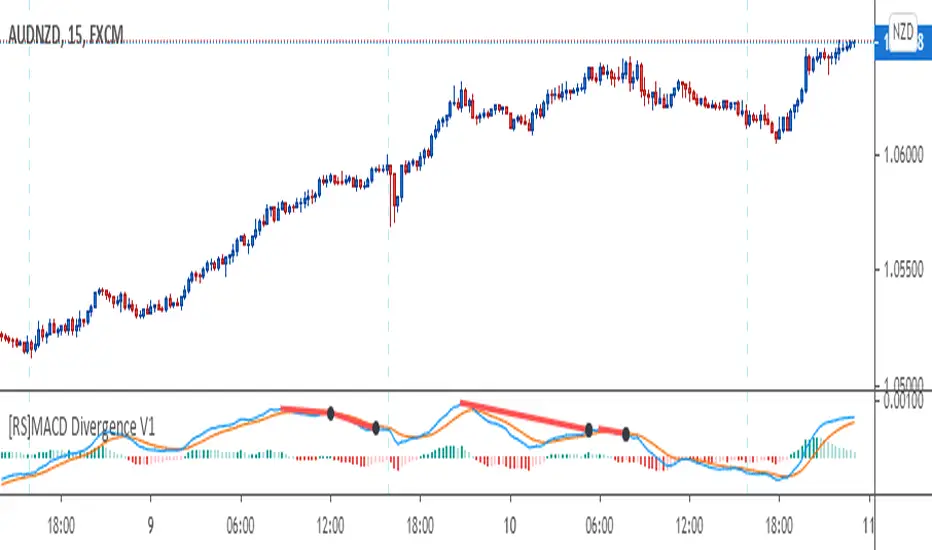
[RS]MACD Divergence V1This oscilator was created by Ricardo Santos using MACD's histogram as the series to find low and high fractals and from there find and plot divergences.
I just modified it a little bit to make it to look more like the MACD public library indicator and use the actual MACD series (instead of the histogram) to find the fractals and from there plot divergences.
I did this to make it easier for me and other fellow students of a Forex school where we use these type of divergences to find patterns.
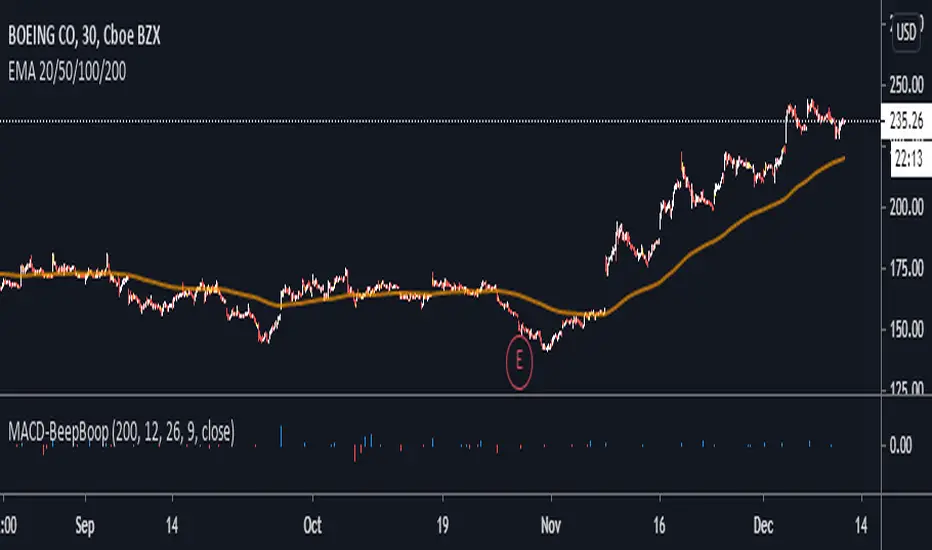
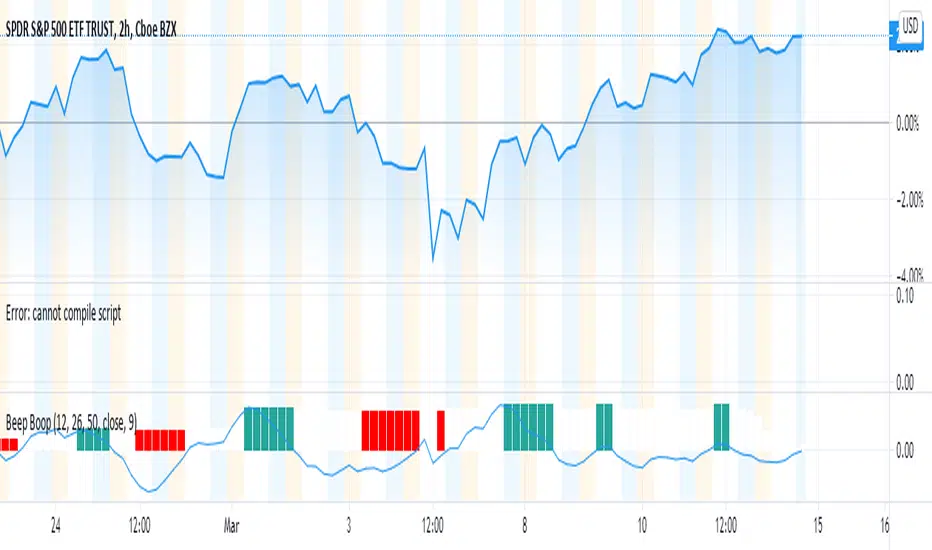
MACD BeepBoop Indicator
The indicator flags long or blue when the macd histogram value > 0 and above the ema and short or red when the macd histogram value < 0 and below the ema
I have added confirmations in the form of eliminating all bars on the histogram unless they meet the long / short entry conditions two bars in a row
You can customize the length of the ema that determines the long/short entry conditions in the settings
I have also added a yellow highlight to the bar in the chart that you would enter on. You would enter at the open of the bar following the signal bar
Stop Loss would be placed at the nearest pivot point or ATR of your choice
Note - republishing this after taking out original links
G-MACD ColorIt's just MACD and fill the color
How to use
RED : MACD < Signal line and MACD < 0
Blue : MACD > Signal line and MACD < 0
GREEN : MACD > Signal liine and MACD > 0
Yellow : MACD < Signal line and MACD < 0
Goodluck :D

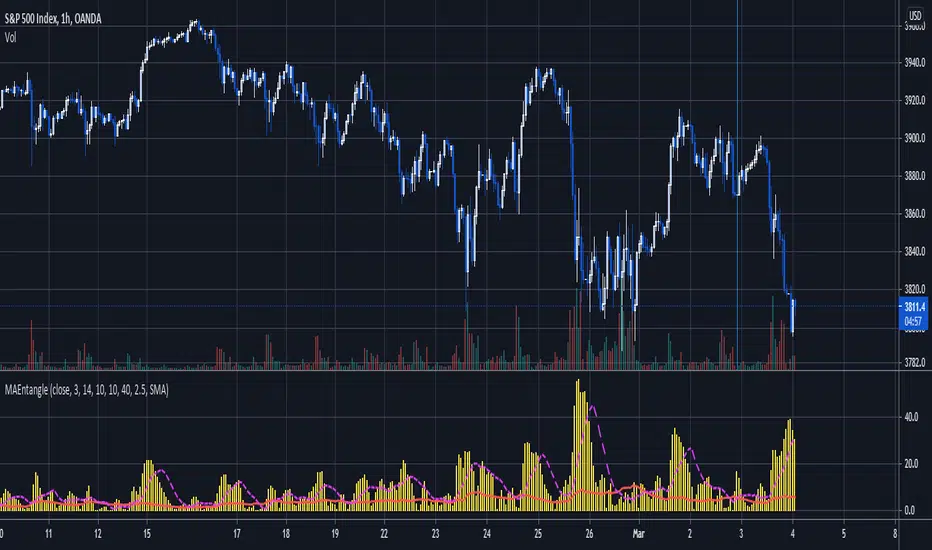
Moving Average EntanglementThis script uses the gap in moving averages standardized to the average true range to determine entry and exit points.
The red line represents the current percentage of ATR that is deemed "The Dead Zone" - a move that is too small to be reliable.
The histogram represents the gap between moving averages. When the histogram is above the red line, it confirms a breakout move.
The dashed line an be used as a secondary filter and is a moving average of the histogram.
When Standard Deviation mode is on, a third line is displayed, which represents how many standard Deviations the current histogram bar represents, and can be also used as a filter.
Reverse MACD IndicatorIntroducing the reverse MACD Indicator.
This is my Pinescript implementation of the reverse MACD indicator.
Much respect to Mr Johnny Dough the original creator of this idea.
Feel free to reuse this script, drop me a note below if you find this useful.
Investopedia defines the MACD as a trend-following momentum indicator that shows the relationship between two moving averages of a security’s price.
The MACD is calculated by subtracting the 26-period Exponential Moving Average ( EMA ) from the 12-period EMA .
The result of that calculation is the MACD line.
A nine-day EMA of the MACD called the "signal line," is then plotted on top of the MACD line, which can function as a trigger for buy and sell signals.
Traders may buy the security when the MACD crosses above its signal line and sell—or short—the security when the MACD crosses below the signal line.
Moving Average Convergence Divergence ( MACD ) indicators can be interpreted in several ways, but the more common methods are crossovers, divergences, and rapid rises/falls.
MACD triggers technical signals when it crosses above (to buy) or below (to sell) its signal line.
The speed of crossovers is also taken as a signal of a market is overbought or oversold.
MACD helps investors understand whether the bullish or bearish movement in the price is strengthening or weakening.
The MACD has a positive value (shown as the red line on the price chart ) whenever the 12-period EMA ( indicated by the blue line on the price chart) is above the 26-period EMA (the red line in the price chart) and a negative value when the 12-period EMA is below the 26-period EMA .
The more distant the MACD is above or below its baseline indicates that the distance between the two EMAs is growing.
The baseline here is the white line.
The Reverse function of the MACD provides value by letting the user know the specific price needed to expect a MACD cross over in the opposite direction.
This function can be used to designate risk parameters for a potential trade if using the MACD as their source of edge, letting the user know exactly where and how much their risk is for a potential trade which can be used to design an effective trading plan.
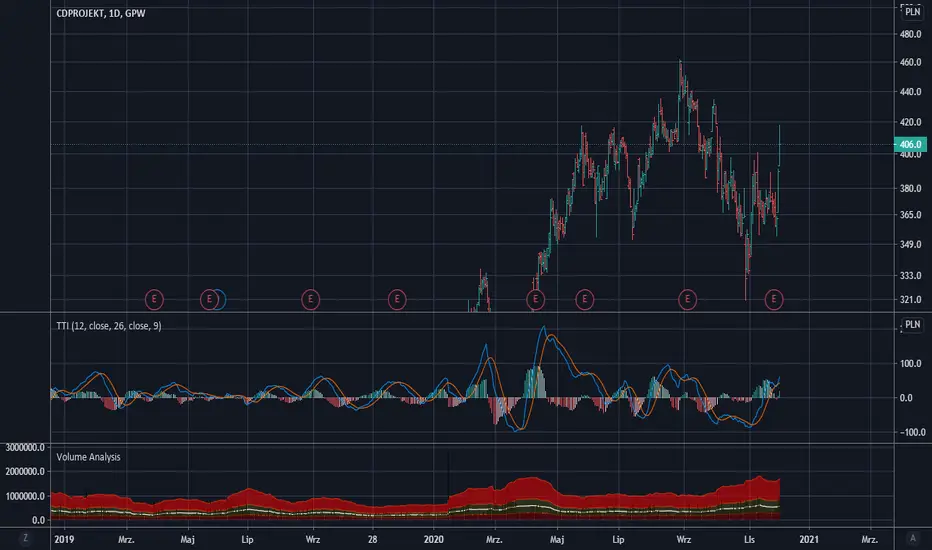
Trend Thrust Indicator - RafkaThis indicator defines the impact of volume on the volume-weighted moving average, emphasizing trends with greater volume.
What determines a security’s value? Price is the agreement to exchange despite the possible disagreement in value. Price is the conviction, emotion, and volition of investors. It is not a constant but is influenced by information, opinions, and emotions over time. Volume represents this degree of conviction and is the embodiment of information and opinions flowing through investor channels. It is the asymmetry between the volume being forced through supply (offers) and demand (bids) that facilitates price change. Quantifying the extent of asymmetry between price trends and the corresponding volume flows is a primary objective of volume analysis. Volume analysis research reveals that volume often leads price but may also be used to confirm the present price trend.
Trend thrust indicator
The trend thrust indicator (TTI), an enhanced version of the volume-weighted moving average convergence/divergence (VW-Macd) indicator, was introduced in Buff Pelz Dormeier's book 'Investing With Volume Analysis'. The TTI uses a volume multiplier in unique ways to exaggerate the impact of volume on volume-weighted moving averages. Like the VW-Macd, the TTI uses volume-weighted moving averages as opposed to exponential moving averages. Volume-weighted averages weigh closing prices proportionally to the volume traded during each time period, so the TTI gives greater emphasis to those price trends with greater volume and less emphasis to time periods with lighter volume. In the February 2001 issue of Stocks & Commodities, I showed that volume-weighted moving averages (Buff averages, or Vwmas) improve responsiveness while increasing reliability of simple moving averages.
Like the Macd and VW-Macd, the TTI calculates a spread by subtracting the short (fast) average from the long (slow) average. This spread combined with a volume multiplier creates the Buff spread
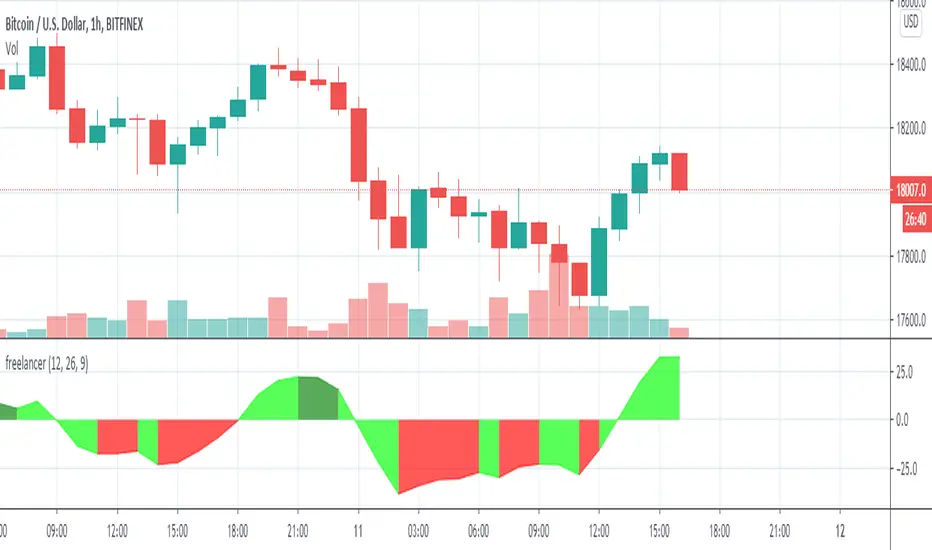
OsMAOsMA : Oscillator of Moving Averages.
OsMA is a common index because it is a histogram in the middle of MACD.
The histogram in the middle is a little difficult to handle, so I dared to display OsMA like MACD.
The one like MACD is OsMA, and the histogram in the middle is the amount of change in OSMA.
It is an indicator that is characterized by a strong and quick reaction.
OsMAとはMACDの真ん中のヒストグラムなのでありふれた指標です
真ん中のヒストグラムだけではちょっと扱い辛いので、あえてOsMAをMACDみたいに表示してみました
MACDみたいなやつがOsMAで、真ん中のヒストグラムはOSMAの変化量です
強烈に反応が早いのが特徴のインジケーターです

Beep Boop(Improved) Beep Boop Indicator for Trending Markets originally written by Trading Rush.
It is originally based on the MACD 12-26 and the 50 bar EMA.
The macd hist is color coded with green as buy and sell as red.
I added an option to use a couple of lower lag ema's (See line 13 - ema_signal).
MACD Trend CandlesThe script combines 2 indicators (MACD and Stoch-RSI) and puts them visually directly on the candles - can be used with normal OHLC candles or Heiken Ashi candles. Furthermore, you can derive divergences exremely easy directly visually from the candles as well. Lastly, a SMA 20 high and a SMA 20 low line build a trend channel.
Script is best used in trending markets to trade with the trend.
1) SMA trend channel:
* uptrend: close above
* downtrend: close below
* aggressive entry (uptrend) closing inside channel from below
* conservative entry (uptrend) closing above channel from inside
* hold (uptrend) until close below channel
* can be used accordingly for the downtrend
2) MACD candles
* visualization of the MACD histogram directly on the candles
* dark blue: histogram > 0 and histogram > histogram of previous candle
* light blue: histogram > 0 and histogram < histogram of previous candle
* orange: histogram < 0 and histogram < histogram of previous candle
* light blue: histogram < 0 and histogram > histogram of previous candle
* hold uptrend (dark/light blue candles) - combined with trend channel (above channel)
* hold downtrend (orange /yellow candles) - combined with trend channel (below channel)
* Color divergence: light blue candle > dark blue candle (price and MACD show divergence (bearish)
* Color divergence: yellow candle < orange candle (price and MACD show divergence (bullish)
* Trend change (0 line cross to upside) yellow or orange to dark blue
* Trend change (0 line cross to downside) dark or light blue to orange
3) Stoch RSI diamonds
* visualization of the STOCH-RSI as diamonds above or below the candle
* k, d line > 80: diamond above the candle
* k, d line < 20: diamond below the candle
* divergence caldle without diamond above > candle with diamond above (bearish divergence)
* divergence caldle without diamond below < candle with diamond below (bullish divergence)
Feel free to test each part individually and combine it with other indicators, e.g. BBands and Ichimoku Cloud - you will see it is a powerful visualization script
HAVE FUN

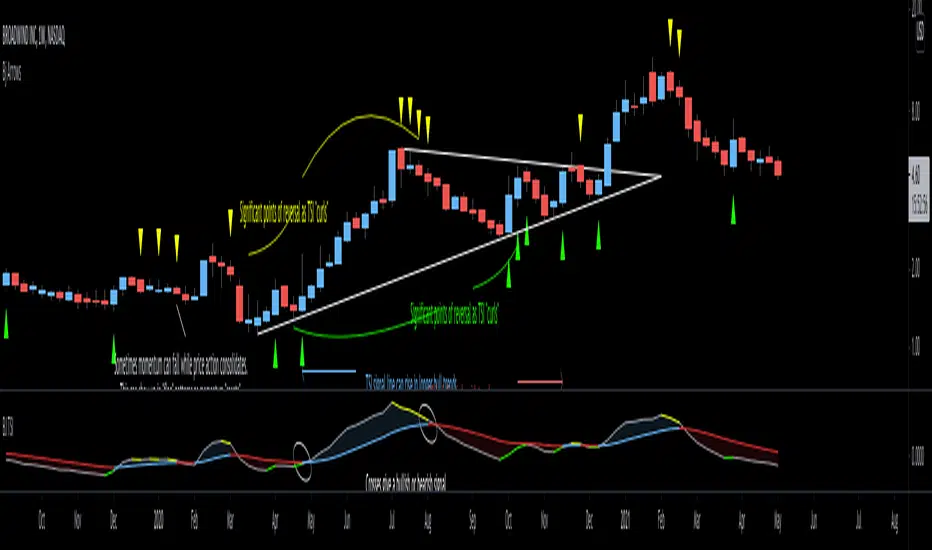
Bjorgum TSI-This script utilizes simple color changes of the TSI output signals to aid in interpretation of the classic TSI indicator.
-Crosses of the TSI value line and signal line are a bullish or bearish indication. TSI value line is colored green or yellow to help identify that the TSI value line is either dropping or rising, while over or under the signal line.
-This can help anticipate a cross, or significant points in the trend. TSI signal line changes color when rising or falling which can help to identify larger prevailing trends.
-Generally, a rising signal line can be an overall bullish move, while falling more bearish regardless of crosses.
*Resolution function enables multiple overlay for "Multi-timeframe analysis"*
SALEH All in One Strategythis script is based on MACD strategy
for MACD:
when we have an uptrend ( the price is above the EMA 200) & the macd line cross up the signal line while they are both under the 0 level of histogram it generates buy signals.
when we have a downtrend ( the price is below the EMA 200) & the macd line cross below the signal line while they are both above the 0 level of histogram it generates sell signals.
donchian channel works as a confirmation for the macd signal.
this strategy works best at London session.
feel free to comment
best regards Forexsquad2020
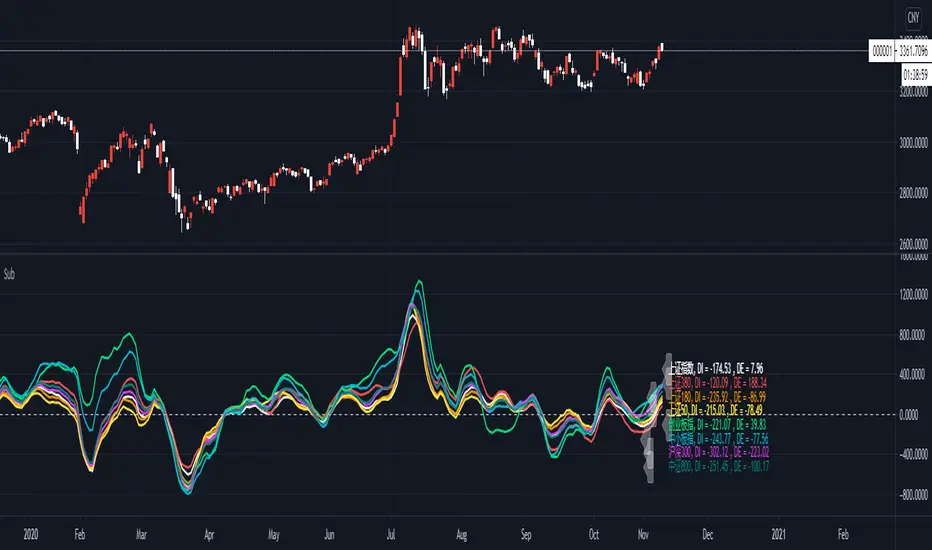
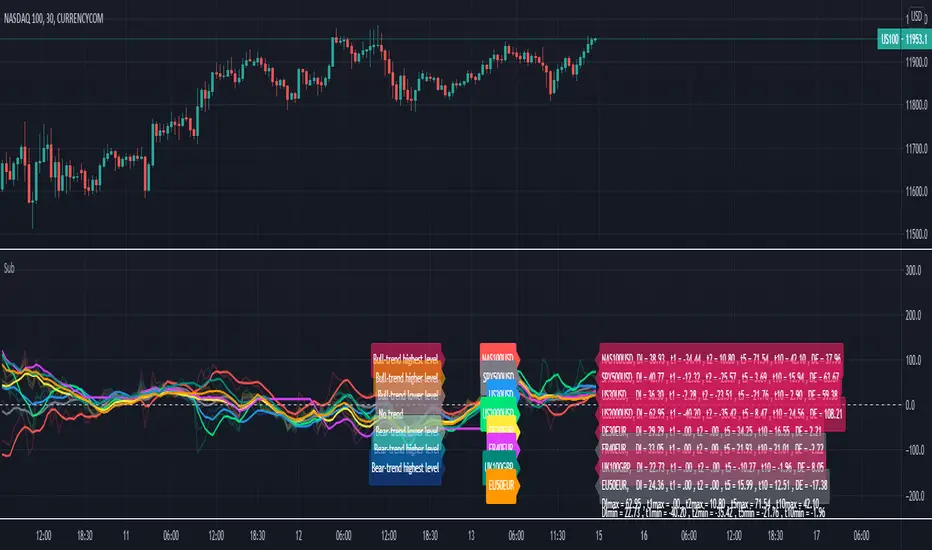
Deviation rate of Chinese stock market index// Deviation rate of Chinese stock market index
//The purpose of the indicator is to monitor the Chinese stock market index deviation rate to the 20EMA, so each major index can be observed longitudinally at the same time.
//This indicator give signal of which Index or instrument should you be focused and when should you enter the market to get a long or short position.
//The chart shows the deviation rate between the current price of each major index current price to the 20EMA.
//Also it count a deductive ratio between current price to the previous 20th bar close price to (which lead to the slope of the 20SMA)
//When using, adjust the corresponding period according to the chart period.
//The word DI (divergence) represents the deviation value between the current price and 20EMA, and DE (deduction) represents the deviation value between the current price and the 20 deduction price.
//Attention marker: The marker tells one of the moving average (EMA20 and MA20) is turning towards the opposite direction. When DE and DI one is plus , one is minus attention marker appear on the instrument title.
//Take the bull trend as an example. If the price is higher than ema20, the EMA20 is turning.If the price is higher than the close price of the bar 20 days ago , the sma20 is turning.
//When the ema20 has not turned around to opposite direction , and the ma20 is turning , the deviation rate of the moving average and the deviation rate of the deductible price are different in positive or negative.
//The marker as a reminder will appear on the instrument title.
//How to use this watchlist: You can freely replace the major indices with the instrument you are focused.
Relative Strength Index of EU and US Stock Index Trends quality//Relative Strength Index of European and US Stock Index Trends quality
//This indicator reveals the relative strength of European and US stock index futures.
//take Bull trend as an example , the current closed price>EMA20 value and the current closed price >20th previous bar closed price( deduction price),
//it's defined as a lower level bull trend .If the current price EMA20>EMA60, it's defined as a higher level bull trend .If the EMA20>EMA60>EMA120,it's defined as the highest level bull trend.
//You can choose to draw the curve with the deviation rate of the original major indexes to 20EMA, or draw the deviation rate with the average value (default value is 5 bars).
//In addition, a more technical method is added to analyze the deviation changes of the major indexes.The deviation rate changing velocity value, parameter tan (abbreviated by t) of 1, 2, 5, 10 is introduced.
//You can have the option of calculate the tan using average value of 5 candlesticks or original value.
//Taking tan1 as an example, it indicates how much the deviation rate between the current price and the previous candlestick has changed.
//The indicator of the index color and the description of the trend quality color can be switched off in option.
//In addition, this code color scheme is only suitable for black background (the code color needs to be changed by yourself if you use white background).

Divergence of Market Breadth & Price deduction indicatorHow it begin?
Traders and investors use market breadth in order to assess the index’s overall health. Market breadth can be a reliable, if not an accurate, indicator of an upcoming price rise in the index. Similarly, it can also provide early warning signs for a future price decline.
What is it?
market breadth in this case refer to percentage of stocks above 20 Simple Moving Average,which could be used as a barometer for the market.
How it works?
This paticular indicator compare the divergence of Nasdaq 100 and Russell 2000 percentage of stocks above 20 Simple Moving Average.
This indicator also include a deduction price method ,which is inspired from LEI & LoneCapital

MA MTF Momentum HistogramMy own interpretation indicator which i call multi time frame moving averages momentum with NO LAG EMA support (Optional).
The indicator is calculated by subtracting the long-term EMA from the short-term EMA .
This pretty much resembles the MACD moving averages calculation but without the smoothing of the histogram.
Can also be used to find divergences.
The background shows the main trend with higher time frame which can be set in the settings.
Aimed to use with Higher time frame (Double or more) but can also work with lower time frame.
How to use the indicator?
==Histogram==
Green: Momentum of asset is positive and increasing.
Lighter Green: Momentum of asset is still positive but decreasing and can revert to negative momentum.
Red: Momentum of asset is negative and increasing.
Lighter Red: Momentum of asset is still negative but increasing and revert to positive momentum.
==Background Color - Main Trend==
Green: HTF (Higher time frame) momentum is positive.
RED: HTF momentum is negative.
Feel free to comment and Follow to stay updated with upcoming scripts: www.tradingview.com
NOTE: BARS ARE COLORED BY DEFAULT WITH HISTOGRAM COLORS! (Can be changed in settings)
