Hybrid Market Score Suite - Impulse Monitor🔬 HYBRID MARKET SCORE SUITE - Impulse Monitor — Algorithmic Imbalance Scoring & Compact 28-Indicator Dashboard
Monitoring regular divergences, OB/OS zones, statistical deviations, and 28 metrics simultaneously is impractical to do manually. HMSS - Impulse Monitor updates them every tick in one compact dashboard, with an optional scoring layer.
━━━━━━━━━━━━━━━━━━━━━━━━━━━━━━━━━
🎯 WHAT IS THIS
HMSS - Impulse Monitor
Performs **Real-Time Monitoring** of 28 technical metrics across 3 fixed timeframes ( 5m / 15m / 30m ) simultaneously.
It processes market data on a **tick-by-tick** basis without lookahead, designed to detect developing market imbalances and local exhaustion points as they happen.
Since the indicator analyzes fixed multi-timeframe streams, it is chart TF-independent : switching your main chart timeframe does not affect the internal logic or scoring.
━━━━━━━━━━━━━━━━━━━━━━━━━━━━━━━━━
🔧 "SWISS ARMY KNIFE" — Daily Monitoring Tool
A compact table with extensive data that you use every day :
28 indicators across 3 timeframes (5m / 15m / 30m):
Divergences (9): RSI DIV, MFI DIV, CCI DIV, CMF DIV, MACD DIV, CVD DIV, DELTA RSI (DRSI) DIV, Elder DIV, STOCH DIV
OB/OS (5): RSI OB/OS, MFI OB/OS, CCI OB/OS, DRSI OB/OS, STOCH OB/OS
Z-Score (8): RSI Z-Score, MFI Z-Score, CCI Z-Score, STOCH Z-Score, DRSI Z-Score, CMF Zone, CVD Z-Score, MACD Z-Score
Special (6): Elder Force, Volume Climax, ZMO EXT, (Nadaraya Watson Envelope) NW ENV, ATR Spikes, VWAP Dev
A few "Special" metrics may be less familiar than classic oscillators, so here are quick notes on what they flag (not "better" indicators — just more niche tools):
NW ENV (Nadaraya–Watson Envelope): A kernel-smoothed price envelope (period 8) with deviation multipliers 2.25 (inner) and 7.75 (extreme). Labels reflect band breaches: !! = price outside the inner band (strong extension), !!! = outside the upper extreme band (rare upside extension), !!!! = outside the lower extreme band (rare downside extension). These are context tags for extension/mean-reversion risk, not trade commands.
ATR Spikes: Compares the current candle range (High–Low) to the recent average ATR(14) over the last 10 bars. A spike triggers when the candle is ≥ 2.0× larger than the average — often seen during climax-like moments (sharp expansion), useful as a “caution marker” for late-move entries.
Volume Climax: A Z-Score of volume over 20 periods. Flags unusually high volume above about 1.9σ . In practice, it helps highlight “crowd intensity” moments: heavy volume on a down candle can resemble panic-like supply; heavy volume on an up candle can resemble aggressive chasing. Treat it as context, not a directional guarantee.
normalized via Z-Score over a 100 -bar history. It highlights statistically stretched momentum when it deviates beyond roughly 2.0σ from its mean — a way to spot overheated acceleration.
All of this — across multiple timeframes simultaneously, in one compact table, without cluttering your chart with a dozen oscillators below. Works on any chart TF — your timeframe selection does not affect calculations.
Each block can be toggled in settings:
Divergence Block — forming regular divergences across oscillators/flows
OB/OS Block — overbought/oversold zones (RSI/MFI/CCI/Stoch etc.)
Z-Score Block — statistical deviations in sigmas (σ)
Special Indicators Block — special indicators and regime filters
Scoring Block — Hybrid Engine (Score, Pattern, Breakdown, Attention, Trade Type, Veto)
Use it as a dashboard for quick market assessment — like a Geiger counter for market anomalies.
━━━━━━━━━━━━━━━━━━━━━━━━━━━━━━━━━
🧠 SCORING SYSTEM — For Extreme Imbalances
An innovative data-driven engine that activates during moments of extreme imbalance :
• Calibrated using 380,000+ historical market data records
• Compares current indicator combinations with historical patterns
• Assigns a Score when significant combinations are detected
Think of the scoring system as a Storm Radar — it doesn't predict volatility explosions, but it "lights up" during storms and shows when the turbulence reaches its peak and begins to subside.
It is designed to assist in identifying potential impulse reversals during liquidation events, if that aligns with your approach.
The system is calibrated on a multi-month historical dataset of 380,000+ records collected minute-by-minute from cryptocurrency markets (BTC, ETH, SOL). During this period, the market showed both multi-month lows and several ATH (All-Time High) events. Statistical dependencies and indicator combination patterns were identified from this data.
━━━━━━━━━━━━━━━━━━━━━━━━━━━━━━━━━
🧠 SCORING ENGINE ARCHITECTURE
Concept & Logic:
This system utilizes a hybrid approach, combining classical technical analysis with statistical profiling. Instead of simply summing up indicator signals, the algorithm compares the current market state against a proprietary database of historical patterns ("Profiles") collected for specific assets.
The calculation logic is layered:
1. Base Layer (Indicator Analysis):
The system monitors 28 metrics (RSI, MFI, Z-Scores, CVD, ATR Spikes, VWAP DEV, etc.).
Standard Deviation (25 pts, Dim Cell): Occurs when an indicator exceeds a standard volatility threshold (e.g., Z-Score > 1.5). This registers as a common local anomaly.
Profile Alignment (50 pts, Bright Cell): Occurs when a value hits specific historical thresholds recorded in the Asset Profile. These are values where impulses or structural shifts occurred in the past data samples.
2. The Core Pattern Recognition (compressed historical scenarios):
The system scans for ~14 compressed market scenarios (Patterns). A pattern becomes active only when its specific "Kernel" of indicators fires simultaneously with a Coverage Ratio > 70%.
3. Confluence & Weighting:
The final score reflects the density of these matches. It identifies the "Winning Side" (Long vs. Short bias) based on the accumulated weight of base and profile scores.
Score Breakdown (The "X-Ray" Row):
The dashboard displays a breakdown row ( L:… S:… C:… A:… K:… ) to visualize the components of the Total Score:
L / S (Baseline): Cumulative weight of active indicators for Long or Short bias.
C (Core Multiplier): A dynamic coefficient applied when the match with a historical pattern "Kernel" is high.
A (AddSig): Points for secondary confirming factors that reinforce the active pattern.
K (Key Features): Internal code for High-Impact Anomalies . These are rare statistical outliers (e.g., extreme Z-Scores > 3.0) that carry significant weight due to their historical correlation with volatility expansion.
System States (Dashboard Output):
The text labels on the UI represent the statistical context of the market, not direct trade commands:
NEUTRAL: Balanced market, no dominant patterns.
SIGNAL FORMING: Early detection of potential accumulation or distribution structures.
TREND — WAIT: Market is in a directional phase; algorithm is monitoring for exhaustion or pivot points.
ON WATCH: High statistical confluence detected.
MAYBE LONG/SHORT: Directional statistical bias is present.
MAX SCORE: Indicates an "Extreme Score" condition. Historically, such values appear during significant market extensions (Global Lows/Highs) where pattern coverage can approach 100% alongside statistical anomalies.
BREAKOUT: Context suggests impulse continuation or level breach.
Disclaimer: This tool provides a statistical context assessment based on historical pattern matching. "Global Lows/Highs" / "New Low/High" are dataset-derived pattern names, not a directional claim. "Max Score" and "Key Features" describe rarity levels, not guaranteed outcomes. Past market behavior is not indicative of future performance.
━━━━━━━━━━━━━━━━━━━━━━━━━━━━━━━━━
🛡️ DRSI VETO — SAFETY MECHANISM
Sometimes "the setup exists by score", but the market is overextended — which can make timing riskier. This is where DRSI Veto comes in:
If the system indicates LONG , but DRSI Z-Score shows extreme overbought conditions (or vice versa for SHORT), the VETO activates, significantly reducing the final Score.
This helps filter out overextended "exhaustion" setups — technically valid by score, but stretched enough to increase mean-reversion risk without proper context. A clear VETO label appears in the table.
━━━━━━━━━━━━━━━━━━━━━━━━━━━━━━━━━
🎯 USE CASES — WHEN IT WORKS BEST
Dual Purpose: Efficiency & Detection
While the Scoring Engine hunts for invisible imbalances, the dashboard serves as your primary daily workstation . It replaces the need for multiple oscillator panes, keeping your charts clean while providing a "Heads-Up Display" for Oscillators, Money Flow, and Statistical Anomalies across three timeframes at once.
Identifying Liquidation-Driven Reversals:
The scoring system is most effective during high-impulse market movements — large liquidation cascades, stop-loss hunts, sharp imbalances. HMSS - Impulse Monitor helps spot potential exhaustion points within seconds or minutes, highlighting reaction zones during high-impulse moves.
When NOT to expect detections:
Markets can and often WILL reverse without the indicator firing. This tool is designed for high-volatility moments with significant liquidations . Reversals in low-volatility, "quiet" markets will likely occur without elevated readings.
This is intentional: higher-score conditions are designed to be relatively rare, not a daily occurrence. If your approach values selectivity, it may help to treat elevated readings as “patient-wait” moments — markets often reward waiting for cleaner, high-confluence regimes rather than forcing a setup every session.
Think of the scoring system as an airbag — most of the time you don't need it, but when it activates, its informational value is high. It's your storm radar: particularly useful when markets enter rare and dangerous regimes.
━━━━━━━━━━━━━━━━━━━━━━━━━━━━━━━━━
💡 FORMING DIVERGENCES — Real-Time Monitoring
Important note for experienced traders:
The indicator shows divergences that are CURRENTLY FORMING , not confirmed ones. This is Real-Time Monitoring mode — scoring updates every tick , allowing you to see the situation as it develops.
⚠️ No lookahead / no future leak: This script strictly uses lookahead=barmerge.lookahead_off (no future data is used in calculations).
On historical data, scores are always displayed based on closed candles. For better historical detail, use candles down to 1-10 seconds.
If a "forming" pattern disappears — this is a normal part of real-time monitoring: the market changes, and the assessment/confluence recalculates accordingly.
━━━━━━━━━━━━━━━━━━━━━━━━━━━━━━━━━
📈 DIVERGENCE PERCENTAGES — WHAT THEY MEAN
Percentages next to divergences show "Divergence Intensity" — how strongly price and oscillator have diverged between points.
Note: The presence of a divergence itself is factored into the scoring system. However, the percentage values (intensity) are currently NOT included in Score calculation. We may add them in the future if we accumulate sufficient data confirming their statistical significance. For now, percentages serve as a visual hint for your own analysis — an additional confirmation filter.
Note: The indicator also draws forming divergence lines directly on the price chart — for 6 key oscillators (RSI, MACD, MFI, CCI, DRSI, CVD).
━━━━━━━━━━━━━━━━━━━━━━━━━━━━━━━━━
🔧 SCORING SYSTEM COMPATIBILITY
Statistical data profiles are available for: BTC, ETH, and SOL
- Default mode is AUTO : BTC/ETH/SOL detected automatically; all other assets use 'ALTS' (ETH-based) profile
- Manual Override: You can select a specific profile in settings if Bar Replay testing shows it tracks your asset's volatility better
- Indicator readings as tools work on ANY assets and markets
- For non-crypto instruments (Forex, Stocks): if alerts trigger too often or too rarely, adjust MAX SCORE Thresholds in settings
Note: Alert threshold settings (Base, Total, MAX SCORE) also affect "Attention Level" and "Trade Type" display in the UI.
━━━━━━━━━━━━━━━━━━━━━━━━━━━━━━━━━
🔔 ALERT SYSTEM (4-STEP)
The alert system is tiered (each step can be toggled on/off):
Step 1: Base Score — Triggers when mathematical confluence reaches base threshold
Step 2: Core Pattern — Triggers when algorithmic pattern is detected (Breakout/Formation)
Step 3: Total Score — Triggers when total Score reaches threshold
Step 4: MAX SCORE Alert — Final high-score alert (individual thresholds for BTC/ETH/SOL/ALT)
Important: Alert thresholds simultaneously calibrate Attention and Trade Type in the UI.
For automation (bots / webhook-based tools): use Webhook URL. Keep in mind that maximum score is often reached at the wick tip, not at candle close — backtesting on longer TFs may show delayed data.
━━━━━━━━━━━━━━━━━━━━━━━━━━━━━━━━━
🧩 HMSS ECOSYSTEM: HMSS - Impulse Monitor vs. HMSS - Context Engine
This script (HMSS - Impulse Monitor) is one half of a specialized two-module system. It is designed to work either as a standalone tool or alongside its companion, HMSS - Context Engine.
Why separate scripts? To maximize responsiveness and detail without hitting Pine Script resource limits (memory/execution time), the ecosystem is split into two specialized engines. Merging them would compromise real-time performance.
Note: HMSS - Context Engine is not a different preset of the same script — it is a separate engine with its own indicator set, pattern library, and calibration profiles designed for a different purpose and a different analytical scope.
Key Differences & Synergy:
Distinct Purpose (Micro vs. Macro): HMSS - Impulse Monitor (This Script): Designed for "Market Reaction." It monitors 5m/15m/30m specifically to detect local exhaustion, liquidation wicks, and immediate imbalances. HMSS - Context Engine (Companion): Designed for "Market Context." It analyzes 1h/4h/1D/1W structures to identify global trends and major structural pivots.
Distinct Indicator Sets: Each engine includes components better suited for its timeframe domain. HMSS - Impulse Monitor features VWAP Deviation and ATR Spikes — metrics more relevant for intraday dynamics. HMSS - Context Engine incorporates structure-oriented indicators not present here: ADX Exhaustion, OBV Divergence & Z-Score, Delta Histograms, VixFix (WVF), Basis, Williams A/D, and Pivot Distances.
Distinct Calibration Profiles: While both engines are developed using historical market observations, their pattern libraries and threshold values are calibrated independently for their respective metric sets and use-cases. The same market event may register as "Extreme" on HMSS - Impulse Monitor while appearing "Neutral" on HMSS - Context Engine if the broader trend structure remains intact — and vice versa.
💡 Synergy Scenarios (How to use them together): Experienced traders often combine both modules to refine market context and decision-making:
• Trend Pullback (Scalp): If HMSS - Context Engine indicates a strong Trend, but HMSS - Impulse Monitor shows "Extreme Overbought/Oversold" (correction against trend) — this often highlights a short-term counter-trend opportunity or a re-entry point.
• Major Reversal Risk: If BOTH HMSS - Impulse Monitor and HMSS - Context Engine indicate "Max Score" / "Extreme Imbalance" simultaneously — this is a rare statistical event (confluence of micro and macro exhaustion) that historically correlates with significant structural reversals.
━━━━━━━━━━━━━━━━━━━━━━━━━━━━━━━━━
⚙️ TECHNICAL NOTES
🕰️ Real-Time Monitor (No Past Labels):
Crucial Concept: This tool is a Real-Time Monitor , not a "signal painter." It shows the market state HERE AND NOW — it does NOT draw historical Buy/Sell arrows or preserve past dashboard states. The only elements drawn on the chart are currently forming divergence lines.
Calculation Heavy:
We utilize maximum Pine Script limits for calculations. Initial loading may take up to 12-15 seconds — this reflects the precision and volume of processed data. After loading, the indicator operates without noticeable delays, processing data every tick .
Chart TF Independence:
The indicator analyzes fixed MTF streams, so your chart timeframe selection does not affect results. For reduced load and faster response, 5-60 minute charts are preferred.
Recommended Chart Timeframe:
For speed and lower load: 5–60 minutes (optimal)
For super-detailed history, you can go down to second-level candles, but this is a performance/memory tradeoff
Bar Replay — How to See Past Performance:
To understand how the Scoring Engine reacted to specific market moves (e.g., a past crash or pump), use Bar Replay Mode :
1s to 30s: Best accuracy (precise tick-emulation)
1 min: Acceptable (if your plan lacks seconds-based intervals)
> 5 min: Not recommended — accuracy drops as intrabar price action is lost
⚠️ > 15 min: Not recommended — may exceed memory limits (TradingView constraint)
To manage the extensive database of pattern weights and profiles while maintaining high performance, this engine utilizes a custom optimized data structure. This ensures the script operates smoothly within Pine Script's resource limits without compromising the depth of historical analysis.
━━━━━━━━━━━━━━━━━━━━━━━━━━━━━━━━━
🔬 TECHNICAL APPROACH (for the curious)
The indicator uses a proprietary compact data encoding system that allows transmitting information about divergences, their type, length, and intensity in a single numeric value. This enables efficient aggregation of data from multiple timeframes without exceeding Pine Script limits.
The scoring system is built on the Statistical Pattern Matching principle: current indicator combinations are compared against a library of statistically significant patterns, each with its own weight and type (Formation/Breakout).
━━━━━━━━━━━━━━━━━━━━━━━━━━━━━━━━━
🚀 QUICK START
Add HYBRID MARKET SCORE SUITE - Impulse Monitor to your chart.
Position table (recommended: bottom-right ) and adjust Offset / Spacer so it doesn't overlap price action.
In settings, toggle blocks by groups: Divergences / OB-OS / Z-Score / Special / Scoring — to match your trading style and load preferences.
For comfortable operation, use chart TF 5–60m .
━━━━━━━━━━━━━━━━━━━━━━━━━━━━━━━━━
🔄 DEVELOPMENT
The indicator receives periodic updates, including statistical pattern refinements as new market data is accumulated, to maintain relevance with current market conditions. Update schedule is not guaranteed.
━━━━━━━━━━━━━━━━━━━━━━━━━━━━━━━━━
🛡️ DISCLAIMER
This script is provided for informational and educational purposes only and does NOT constitute financial advice, investment advice, or a recommendation to buy/sell any asset.
All examples, descriptions, and statistics are based on historical observations. Market conditions can change, patterns can fail, and signals/labels may disappear or update in real time. No results are guaranteed.
Use this tool as one input among many. Always apply your own judgment, risk management, and independent verification (DYOR). Trading — especially with leverage — involves substantial risk, including the risk of total loss. You are solely responsible for your decisions and outcomes.
MFI

Market Exhaustion [WavesUnchained]Market Exhaustion
Multi-oscillator exhaustion detector combining MFI + optional CCI, HTF bias, StochRSI timing, and a divergence engine with an Exhaustion Score (0-100).
CORE CONCEPT
- Detects exhaustion via regular divergences anchored on price pivots
- Scores each divergence (0-100) using 5 components
- Line width = quality, color = direction (never thicker than main line)
OSCILLATOR MODES
- MFI : Engine uses MFI only
- CCI : Engine uses CCI mapped to 0-100
- MFI+CCI : Both plotted, engine source selectable (MFI or CCI)
EXHAUSTION SCORE (0-100)
1. Sequence (Div 1/2/3...) - repeated attempts increase score
2. Fatigue - no new oscillator extreme over lookback
3. Formation Time - bars between pivots
4. Reaction - post-divergence bounce/drop vs ATR
5. Impulse - MFI/CCI delta + swing size
DIVERGENCE ENGINE
- Price-pivot anchored (LL/HH) with osc confirmation (HL/LH)
- OS/OB gating with dynamic zones + fallback to 20/80
- Tolerant direction checks (price + osc eps)
- Auto cleanup (max objects)
HTF CONTEXT
- Auto-HTF MFI bias label
- Optional HTF filter for signals
- Bias bonus (optional) for Exhaustion Score
SIGNALS & TIMING
- StochRSI timing + MFI zone confirmation
- Context + timing signals (L/S markers)
- Zone confirm bars
VISUALIZATION
- Color-coded MFI line (OB/OS/neutral)
- Optional CCI (mapped 0-100) line
- Divergence line width = quality, endpoint markers
- Optional mid-label with score
- Dynamic zones + optional fill
BEST USE CASES
- Reversal scouting at extremes
- Filtering weak swings
- 15M-4H swing exhaustion reads
- HTF bias + divergence confluence
Version: 1.0.0
Author: WavesUnchained
Pine Script: v6

Reversal Signal by Vahid.jafarzadehReversal Signal by Vahid.j is a technical analysis tool designed to identify potential market turning points using a combination of Donchian channels, Fibonacci levels, and multi-oscillator divergences. This indicator calculates dynamic support and resistance levels based on recent highs and lows, applies key Fibonacci retracement zones, and evaluates divergences across multiple oscillators including RSI, MACD, Momentum, CCI, OBV, Stochastic, DI Oscillator, VWMA, CMF, and MFI.
Signals are displayed as bull 🐂 and bear 🐻 icons on the chart to indicate potential buy and sell zones. The indicator also tracks the cumulative divergence count, offering a quantitative perspective of market strength and trend reversal probability.
Alerts can be set for both bullish and bearish signals, enabling timely entries and exits based on divergence and Donchian-Fibonacci confluence.
-------
فارسی :
سیگنال بازگشت توسط Vahid.j یک ابزار تحلیل تکنیکال است که برای شناسایی نقاط احتمالی تغییر جهت بازار طراحی شده و از ترکیبی از کانالهای دونچیان، سطوح فیبوناچی و واگرایی چند نوسانگر استفاده میکند. این اندیکاتور سطوح حمایت و مقاومت پویا را بر اساس بالاترین و پایینترین قیمتهای اخیر محاسبه کرده، سطوح کلیدی فیبوناچی را اعمال میکند و واگراییها را در چندین نوسانگر شامل RSI، MACD، مومنتوم، CCI، OBV، استوکاستیک، DI اسیلاتور، VWMA، CMF و MFI ارزیابی میکند.
سیگنالها به صورت آیکون گاو 🐂 و خرس 🐻 روی چارت نمایش داده میشوند تا مناطق خرید و فروش احتمالی را نشان دهند. همچنین این اندیکاتور تعداد واگراییهای تجمعی را ردیابی میکند و دید کمی نسبت به قدرت بازار و احتمال بازگشت روند ارائه میدهد.
امکان فعالسازی آلارم برای سیگنالهای صعودی و نزولی وجود دارد تا بر اساس همگرایی واگرایی و سطوح دونچیان-فیبوناچی، ورود و خروجهای به موقع انجام شود

Normalized Volume Dynamics [NVD]Concept & Overview
**Normalized Volume Dynamics (NVD)** is a volume analysis indicator designed to reduce time-of-day noise and highlight unusual volume behavior relative to historical conditions.
Most standard volume indicators compare current volume to a rolling average, which can lead to misleading readings during naturally active periods.
**NVD** addresses this by using a time-normalized volume baseline, comparing the current bar’s volume to volume observed at the same intraday bar position across prior sessions, rather than to a generic moving average.
This approach helps distinguish expected activity from statistically abnormal volume.
**Market Suitability**
The time-normalized logic depends on consistent intraday data structure.
**Crypto (24/7 Markets):**
Continuous trading provides consistent intraday alignment, making normalization most reliable.
**Futures:**
Continuous futures contracts with minimal session gaps generally work well.
**Stocks & Forex:**
Session gaps, holidays, and irregular trading hours may introduce minor baseline drift. While the indicator remains functional, continuous markets are preferred for best accuracy.
**How the Indicator Works**
NVD combines three core components:
**1. Time-Normalized Volume Baseline**
Current volume is compared against the average volume of the same intraday bar position over prior sessions.
* Filters out predictable time-based volume patterns
* Highlights volume that exceeds what is historically typical for that point in the session
* Automatically falls back to a smoothed volume average on non-intraday charts or limited history
**2. Efficiency Oscillator (Lower Panel)**
The histogram evaluates the relationship between price movement and volume effort, showing how efficiently price is moving.
Color interpretation:
* **Green Columns:** Buying pressure with high efficiency (Trend is healthy).
* **Red Columns:** Selling pressure with high efficiency.
* **Yellow Columns:** Volume Spike. Abnormal volume detected (2x average) indicating a potential breakout or exhaustion.
* **Grey Columns:** Absorption/Churn. Volume is present but price is not moving significantly. This often happens before a violent move
**3. Informational Flow Signals (Main Chart)**
The indicator can mark candles where unusual volume coincides with price rejection. These markers are informational and require multiple conditions:
* Volume exceeds the selected baseline by a user-defined multiplier
* Price makes a new local high or low but closes back within the candle range, indicating rejection
* Optional Money Flow Index (MFI) filter confirms an overbought or oversold condition
**Dashboard Overview**
An optional dashboard provides a compact summary of the indicator’s internal states for quick reference.
The dashboard displays:
**Trend State (ADX)**
* Uses ADX to classify conditions as **TRENDING** or **RANGING**
* Helps contextualize whether volume behavior is occurring in a directional environment
**Flow Bias**
* Derived from the Efficiency Oscillator and VWAP relationship
* Displays:
**BUYING**
**SELLING**
**ABSORPTION** (low efficiency / churn)
* An arrow indicates whether price is positioned above or below VWAP
**Volume Status**
* Indicates whether current volume qualifies as a high-volume condition relative to the selected baseline
* Matches the logic used for histogram coloring and informational markers
**Multi-Timeframe Support**
* The dashboard can optionally run on a separate timeframe
* Users may choose to sync the histogram with the dashboard timeframe or keep it on the chart timeframe
*Note: The dashboard summarizes internal calculations and does not generate independent trade signals. All values update on confirmed bars.*
**How to Trade: "INFO" Signals**
The chart arrows are labeled **INFO BUY** and **INFO SELL** to emphasize that these are informational warnings of stopping volume, not blind entry signals.
**INFO BUY (Green Arrow):**
* **The Logic:** Sellers pushed price to a low, but massive volume entered to absorb the sell pressure, forcing a close in the upper range. This is a "Bear Trap" or Liquidity Sweep.
* **Usage:** If you are Short, this is a warning to tighten stops. If looking for Longs, wait for price to break the high of the signal candle for confirmation.
**INFO SELL (Red Arrow):**
* **The Logic:** Buyers pushed price to a high, but massive volume entered to block the move, forcing a close in the lower range. This is a "Bull Trap."
* **Usage:** If you are Long, this indicates overhead resistance/supply. If looking for Shorts, wait for price to break the low of the signal candle.
**Features & Settings**
* Time-Normalized or Recent-Average volume calculation modes
* Efficiency histogram with absorption and volume spike detection
* Optional MFI filter for informational signals
* VWAP-based contextual filter
* Dashboard showing trend state, flow bias, and volume status
* Non-repainting alerts triggered on bar close
**Recommended Usage**
* Higher timeframes (5m and above) generally provide clearer structure
* On lower timeframes, increasing the analysis period can help reduce noise
* Designed to be used as a supporting analysis tool, not a standalone system
**Disclaimer**
*This indicator is provided strictly for educational and informational purposes. It does not constitute financial, investment, trading, or other professional advice.*
*All calculations, visualizations, and signals produced by this indicator are derived solely from historical price and volume data. No representation is made that the indicator can predict future market behavior or outcomes. Any interpretations drawn from its output are the sole responsibility of the user.*
*Trading and investing involve substantial risk, including the possible loss of all or more than the initial capital. Market conditions can change rapidly, and past market behavior, patterns, or indicator performance do not guarantee similar results in the future.*
*The informational markers, alerts, dashboard readings, and histogram values generated by this indicator are not trade recommendations and should not be used as the sole basis for making trading decisions. Users are encouraged to combine this tool with their own analysis, risk management, and confirmation methods.*
*The author assumes no responsibility or liability for any trading decisions, losses, or damages resulting directly or indirectly from the use of this indicator. By using this script, you acknowledge that you are solely responsible for your trading decisions and outcomes.*
*Use at your own risk.*

MFI Volume Profile [Kodexius]The MFI Volume Profile indicator blends a classic volume profile with the Money Flow Index so you can see not only where volume traded, but also how strong the buying or selling pressure was at those prices. Instead of showing a simple horizontal histogram of volume, this tool adds a money flow dimension and turns the profile into a price volume momentum heat map.
The script scans a user controlled lookback window and builds a set of price levels between the lowest and highest price in that period. For every bar inside that window, its volume is distributed across the price levels that the bar actually touched, and that volume is combined with the bar’s MFI value. This creates a volume weighted average MFI for each price level, so every row of the profile knows both how much volume traded there and what the typical money flow condition was when that volume appeared.
On the chart, the indicator plots a stack of horizontal boxes to the right of current price. The length of each box represents the relative amount of volume at that price, while the color represents the average MFI there. Levels with stronger positive money flow will lean toward warmer shades, and levels with weaker or negative money flow will lean toward cooler or more neutral shades inside the configured MFI band. Each row is also labeled in the format Volume , so you can instantly read the exact volume and money flow value at that level instead of guessing.
This gives you a detailed map of where the market really cared about price, and whether that interest came with strong inflow or outflow. It can help you spot areas of accumulation, distribution, absorption, or exhaustion, and it does so in a compact visual that sits next to price without cluttering the candles themselves.
Features
Combined volume profile and MFI weighting
The indicator builds a volume profile over a user selected lookback and enriches each price row with a volume weighted average MFI. This lets you study both participation and money flow at the same price level.
Volume distributed across the bar price range
For every bar in the window, volume is not assigned to a single price. Instead, it is proportionally distributed across all price rows between the bar low and bar high. This creates a smoother and more realistic profile of where trading actually happened.
MFI based color gradient between 30 and 70
Each price row is colored according to its average MFI. The gradient is anchored between MFI values of 30 and 70, which covers typical oversold, neutral and overbought zones. This makes strong demand or distribution areas easier to spot visually.
Configurable structure resolution and depth
Main user inputs are the lookback length, the number of rows, the width of the profile in bars, and the label text size. You can quickly switch between coarse profiles for a big picture and higher resolution profiles for detailed structure.
Numeric labels with volume and MFI per row
Every box is labeled with the total volume at that level and the average MFI for that level, in the format Volume . This gives you exact values while still keeping the visual profile clean and compact.
Calculations
Money Flow Index calculation
currentMfi is calculated once using ta.mfi(hlc3, mfiLen) as usual,
Creation of the profileBins array
The script creates an array named profileBins that will hold one VPBin element per price row.
Each VPBin contains
volume which is the total volume accumulated at that price row
mfiProduct which is the sum of volume multiplied by MFI for that row
The loop;
for i = 0 to rowCount - 1 by 1
array.push(profileBins, VPBin.new(0.0, 0.0))
pre allocates a clean structure with zero values for all rows.
Finding highest and lowest price across the lookback
The script starts from the current bar high and low, then walks backward through the lookback window
for i = 0 to lookback - 1 by 1
highestPrice := math.max(highestPrice, high )
lowestPrice := math.min(lowestPrice, low )
After this loop, highestPrice and lowestPrice define the full price range covered by the chosen lookback.
Price range and step size for rows
The code computes
float rangePrice = highestPrice - lowestPrice
rangePrice := rangePrice == 0 ? syminfo.mintick : rangePrice
float step = rangePrice / rowCount
rangePrice is the total height of the profile in price terms. If the range is zero, the script replaces it with the minimum tick size for the symbol. Then step is the price height of each row. This step size is used to map any price into a row index.
Processing each bar in the lookback
For every bar index i inside the lookback, the script checks that currentMfi is not missing. If it is valid, it reads the bar high, low, volume and MFI
float barTop = high
float barBottom = low
float barVol = volume
float barMfi = currentMfi
Mapping bar prices to bin indices
The bar high and low are converted into row indices using the known lowestPrice and step
int indexTop = math.floor((barTop - lowestPrice) / step)
int indexBottom = math.floor((barBottom - lowestPrice) / step)
Then the indices are clamped into valid bounds so they stay between zero and rowCount - 1. This ensures that every bar contributes only inside the profile range
Splitting bar volume across all covered bins
Once the top and bottom indices are known, the script calculates how many rows the bar spans
int coveredBins = indexTop - indexBottom + 1
float volPerBin = barVol / coveredBins
float mfiPerBin = volPerBin * barMfi
Here the total bar volume is divided equally across all rows that the bar touches. For each of those rows, the same fraction of volume and volume times MFI is used.
Accumulating into each VPBin
Finally, a nested loop iterates from indexBottom to indexTop and updates the corresponding VPBin
for k = indexBottom to indexTop by 1
VPBin binData = array.get(profileBins, k)
binData.volume := binData.volume + volPerBin
binData.mfiProduct := binData.mfiProduct + mfiPerBin
Over all bars in the lookback window, each row builds up
total volume at that price range
total volume times MFI at that price range
Later, during the drawing stage, the script computes
avgMfi = bin.mfiProduct / bin.volume
for each row. This is the volume weighted average MFI used both for coloring the box and for the numeric MFI value shown in the label Volume .

NAMI Lite │ Zero-Repaint Momentum Wave + Reg Divergences (FREE)
NAMI Lite │ 100% Zero-Repaint Momentum Wave + Divergences (FREE)
The only zero-repaint, zero-lag momentum indicator that calls reversals hours early — even the free version beats all paid indicators.
No repainting on closed bars • Instant wave flips • Clean regular divergences • Money Flow confluence
Zero-Repaint Momentum Wave – CCI-based oscillator with real-time color flips (no lag, no lies)
Regular Bull/Bear Divergences – Faded lines on confirmed pivots only
Money Flow Oscillator – Volume-weighted filled areas for extra confirmation
This Lite version is intentionally limited — powerful enough to replace monthly subscriptions, but missing the pro features that make trading effortless.
Upgrade to Full NAMI Suite (One-Time Payment – Cancel Recurring Fees Forever):
Hidden Divergences with Divergence LABELS (catch 70% more massive moves)
200-Color Stochastic Heat Ribbon (gorgeous visual heatmaps)
True VWAP Oscillator + multi-source options
Buy/Sell Dots + Full Alerts (divergence, money flow, wave flips)
Full and Complete Customization (themes, lengths, colors)
Plus our other toolkits: TRAVIS, SMC Pro, and all future tools free
SEE IMAGE FOR COMPLETE NAMI VIEW
Over 800 traders already switched and saved thousands.

Delta Money Flow IndexThe Delta Money Flow Index is a modified version of the traditional Money Flow Index that uses directional volume instead of total volume to measure buying and selling pressure in a different way.
It helps traders identify overbought/oversold conditions based on actual buy/sell pressure rather than just total volume. It's designed for traders who want to see if price movements are backed by genuine buying or selling activity.
How to use it:
- Values above 80 indicate overbought conditions
- Values below 20 indicate oversold conditions
- The 50 level acts as a neutral zone. Above suggests buyers are in control, below suggests sellers are in control.
- Traders can check for divergences for potential reversal signals
- Works best on intraday timeframes where delta volume is most meaningful
What makes it different:
Unlike the standard MFI which uses total volume, the Delta MFI calculates an approximation of volume delta by assigning positive volume to up-closing candles and negative volume to down-closing candles.
This means:
- It focuses on directional pressure, not just activity
- Filters out low-conviction volume that doesn't move price
- Provides clearer signals when actual buying/selling dominates
The indicator includes visual aids like background colors for overbought/oversold and a fill showing whether the Delta MFI is above or below the 50 midpoint for quick interpretation.

AnkeAlgo A68 strategy™ || AnkeAlgo®[16.6]## ✅ Multi-Timeframe Trend Strategy Based on MFI and Momentum Factors
### 📌 Overview
This strategy combines **Money Flow Index (MFI)** and **Momentum** to identify trend continuation and momentum reversal opportunities in the crypto market. It focuses on volume-weighted capital flow and price strength, generating trend-biased signals suitable for swing and intraday traders.
---
### 📊 Technical Indicators Used
| Indicator | Purpose |
|-----------|---------|
| **MFI (Money Flow Index)** | Detects capital inflow/outflow and filters range-bound markets |
| **Momentum Indicator** | Measures price acceleration and confirms breakout strength |
| **Optional: ATR / EMA Filters** | Can be added for volatility stop or trend validation |
---
### ⚙️ Core Logic
- **Trend Confirmation**: MFI exceeds threshold and aligns with price direction
- **Momentum Entry Trigger**: Trades are executed only when momentum crosses a signal level
- **Noise Filter**: Avoids entries when MFI divergence or momentum weakness is detected
- **Position Management**: Supports ATR-based or percentage-based stop-loss systems
---
### 🪙 Market and Asset
✅ Designed for crypto derivatives
**Recommended symbol:** `ETHUSDT.P` (Perpetual Futures)
---
### ⏱️ Recommended Timeframes
- 30-minute
- 45-minute
- 1-hour
> The **45m timeframe** shows the most stable performance in forward testing.
---
### 📈 Strategy Features
- Performs best during trending and high-momentum phases
- Low overfitting risk, adaptable across different volatility environments
- Can be used as a signal engine for grid, martingale, or multi-asset systems
- Easily extendable to BTC, SOL, BNB, and other high-liquidity assets
---
### ⚠️ Risk Disclaimer
- This is **not** a mean-reversion strategy and may produce false signals in sideways markets
- Stop-loss management and position sizing are required for live deployment
- Backtest results do not guarantee live trading performance due to slippage and trading fees
---

RSI + MFIRSI and MFI combined, width gradient fields if OS or OB, shows divergences separate for wicks and bodies, shows dots when mfi and rsi oversold at the same time.

Hyper Strength Index | QuantLapse🧠 Hyper Strength Index (HSI) | QuantLapse
Overview:
The Hyper Strength Index (HSI) is a composite momentum oscillator designed to unify multiple strength measures into a single, adaptive framework. It combines the Relative Strength Index (RSI), Chande Momentum Oscillator (CMO), Money Flow Index (MFI), and Stochastic RSI to deliver a refined, multidimensional view of market momentum and overbought/oversold conditions.
Unlike traditional oscillators that rely on a single formula, the HSI averages four distinct momentum perspectives — price velocity, directional conviction, volume participation, and stochastic behavior — offering traders a more balanced and noise-resistant reading of market strength.
⚙️ Calculation Logic:
The Hyper Strength Index is computed as the normalized average of:
📈 RSI — classic measure of relative momentum.
💪 CMO — captures directional bias and intensity of moves.
💵 MFI — integrates volume and money flow pressure.
🔄 Stochastic RSI (K-line) — identifies momentum extremes and short-term turning points.
This fusion creates a smoother, more comprehensive signal, mitigating the weaknesses of any single oscillator.
🎯 Interpretation:
Overbought Zone (Default: > 75):
Indicates potential exhaustion of bullish momentum — a cooling phase or reversal may follow.
Oversold Zone (Default: < 7):
Suggests bearish exhaustion — a rebound or accumulation phase may emerge.
Neutral Zone (Between 7 and 75):
Represents balanced market conditions or trend continuation phases.
Visual cues highlight key conditions:
🔺 Red Highlights — Overbought regions or downward inflection points.
🔻 Green Highlights — Oversold regions or upward inflection points.
Neutral zones are shaded with subtle gray backgrounds for clarity.
💡 Key Features:
🔹 Multi-factor strength analysis (RSI + CMO + MFI + StochRSI).
🔹 Adaptive overbought/oversold detection.
🔹 Visual alerts via colored backgrounds and bar markers.
🔹 Customizable smoothing and length parameters for fine-tuning sensitivity.
🔹 Intuitive visualization ideal for both short-term scalping and swing trading setups.
🧭 Usage Notes:
Works best as a momentum confirmation tool — pair with trend filters like EMA, SuperTrend, or ADX.
In trending markets, use crossovers from extreme zones as potential continuation or exhaustion signals.
In ranging markets, exploit overbought/oversold reversals for high-probability mean reversion trades.
📘 Summary:
The Hyper Strength Index | QuantLapse distills multiple dimensions of market strength into a single, cohesive oscillator. By merging price, volume, and directional momentum, it provides traders with a more robust, responsive, and context-aware perspective on market dynamics — a next-generation evolution beyond the limitations of RSI or CMO alone.

Volume-Weighted Money Flow [sgbpulse]Overview
The VWMF indicator is an advanced technical analysis tool that combines and summarizes five leading momentum and volume indicators (OBV, PVT, A/D, CMF, MFI) into one clear oscillator. The indicator helps to provide a clear picture of market sentiment by measuring the pressure from buyers and sellers. Unlike single indicators, VWMF provides a comprehensive view of market money flow by weighting existing indicators and presenting them in a uniform and understandable format.
Indicator Components
VWMF combines the following indicators, each normalized to a range of 0 to 100 before being weighted:
On-Balance Volume (OBV): A cumulative indicator that measures positive and negative volume flow.
Price-Volume Trend (PVT): Similar to OBV, but incorporates relative price change for a more precise measure.
Accumulation/Distribution Line (A/D): Used to identify whether an asset is being bought (accumulated) or sold (distributed).
Chaikin Money Flow (CMF): Measures the money flow over a period based on the close price's position relative to the candle's range.
Money Flow Index (MFI): A momentum oscillator that combines price and volume to measure buying and selling pressure.
Understanding the Normalized Oscillators
The indicator combines the five different momentum indicators by normalizing each one to a uniform range of 0 to 100 .
Why is Normalization Important?
Indicators like OBV, PVT, and the A/D Line are cumulative indicators whose values can become very large. To assess their trend, we use a Moving Average as a dynamic reference line . The Moving Average allows us to understand whether the indicator is currently trending up or down relative to its average behavior over time.
How Does Normalization Work?
Our normalization fully preserves the original trend of each indicator.
For Cumulative Indicators (OBV, PVT, A/D): We calculate the difference between the current indicator value and its Moving Average. This difference is then passed to the normalization process.
- If the indicator is above its Moving Average, the difference will be positive, and the normalized value will be above 50.
- If the indicator is below its Moving Average, the difference will be negative, and the normalized value will be below 50.
Handling Extreme Values: To overcome the issue of extreme values in indicators like OBV, PVT, and the A/D Line , the function calculates the highest absolute value over the selected period. This value is used to prevent sharp spikes or drops in a single indicator from compromising the accuracy of the normalization over time. It's a sophisticated method that ensures the oscillators remain relevant and accurate.
For Bounded Indicators (CMF, MFI): These indicators already operate within a known range (for example, CMF is between -1 and 1, and MFI is between 0 and 100), so they are normalized directly without an additional reference line.
Reference Line Settings:
Moving Average Type: Allows the user to choose between a Simple Moving Average (SMA) and an Exponential Moving Average (EMA).
Volume Flow MA Length: Allows the user to set the lookback period for the Moving Average, which affects the indicator's sensitivity.
The 50 line serves as the new "center line." This ensures that, even after normalization, the determination of whether a specific indicator supports a bullish or bearish trend remains clear.
Settings and Visual Tools
The indicator offers several customization options to provide a rich analysis experience:
VWMF Oscillator (Blue Line): Represents the weighted average of all five indicators. Values above 50 indicate bullish momentum, and values below 50 indicate bearish momentum.
Strength Metrics (Bullish/Bearish Strength %): Two metrics that appear on the status line, showing the percentage of indicators supporting the current trend. They range from 0% to 100%, providing a quick view of the strength of the consensus.
Dynamic Background Colors: The background color of the chart automatically changes to bullish (a blue shade by default) or bearish (a default brown-gray shade) based on the trend. The transparency of the color shows the consensus strength—the more opaque the background, the more indicators support the trend.
Advanced Settings:
- Background Color Logic: Allows the user to choose the trigger for the background color: Weighted Value (based on the combined oscillator) or Strength (based on the majority of individual indicators).
- Weights: Provides full control over the weight of each of the five indicators in the final oscillator.
Using the Data Window
TradingView provides a useful Data Window that allows you to see the exact numerical values of each normalized oscillator separately, in addition to the trend strength data.
You can use this window to:
Get more detailed information on each indicator: Viewing the precise numerical data of each of the five indicators can help in making trading decisions.
Calibrate weights: If you want to manually adjust the indicator weights (in the settings menu), you can do so while tracking the impact of each indicator on the weighted oscillator in the Data Window.
The indicator's default setting is an equal weight of 20% for each of the five indicators.
Alert Conditions
The indicator comes with a variety of built-in alerts that can be configured through the TradingView alerts menu:
VWMF Cross Above 50: An alert when the VWMF oscillator crosses above the 50 line, indicating a potential bullish momentum shift.
VWMF Cross Below 50: An alert when the VWMF oscillator crosses below the 50 line, indicating a potential bearish momentum shift.
Bullish Strength: High But Not Absolute Consensus: An alert when the bullish trend strength reaches 60% or more but is less than 100%, indicating a high but not absolute consensus.
Bullish Strength at 100%: An alert when all five indicators (MFI, OBV, PVT, A/D, CMF) show bullish strength, indicating a full and absolute consensus.
Bearish Strength: High But Not Absolute Consensus: An alert when the bearish trend strength reaches 60% or more but is less than 100%, indicating a high but not absolute consensus.
Bearish Strength at 100%: An alert when all five indicators (MFI, OBV, PVT, A/D, CMF) show bearish strength, indicating a full and absolute consensus.
Summary
The VWMF indicator is a powerful, all-in-one tool for analyzing market momentum, money flow, and sentiment. By combining and normalizing five different indicators into a single oscillator, it offers a holistic and accurate view of the market's underlying trend. Its dynamic visual features and customizable settings, including the ability to adjust indicator weights, provide a flexible experience for both novice and experienced traders. The built-in alerts for momentum shifts and trend consensus make it an effective tool for spotting trading opportunities with confidence. In essence, VWMF distills complex market data into clear, actionable signals.
Important Note: Trading Risk
This indicator is intended for educational and informational purposes only and does not constitute investment advice or a recommendation for trading in any form whatsoever.
Trading in financial markets involves significant risk of capital loss. It is important to remember that past performance is not indicative of future results. All trading decisions are your sole responsibility. Never trade with money you cannot afford to lose.

MTF Oscillator Stack [BigBeluga]🔵 OVERVIEW
The MTF Oscillator Stack brings powerful multi-timeframe momentum analysis directly into your price chart. You can select one oscillator— RSI , MFI , or Stochastic RSI —and display it across up to 4 different timeframes. Each panel is neatly stacked horizontally above price , offering quick insight into cross-timeframe conditions like trend direction, exhaustion zones, and momentum shifts.
🔵 CONCEPTS
Single Oscillator Mode: Select one oscillator type (RSI, MFI, or Stoch RSI) to analyze across all selected timeframes.
Top-Chart Horizontal Panels: Oscillator plots are aligned horizontally at the top of the chart for seamless top-down reading.
Signal Comparison Arrows: Arrows (🢁 / 🢃) indicate oscillator position relative to its signal line.
Overbought/Oversold Zones: Transparent 30–70 fill zones highlight key reversal areas.
Dynamic Display Logic: Only enabled panels are shown; spacing adjusts based on active timeframes.
Timeframe Tagging: Each oscillator panel is labeled with its corresponding timeframe (e.g., 1H, 2H, 4H).
🔵 FEATURES
Choose one oscillator (RSI, MFI, or Stoch RSI) and apply it across up to 4 timeframes.
Each oscillator panel includes: price-synced plot, signal line, and zone shading.
Scale alignment allows users to place charts at the bottom or top.
Clear arrow signals show whether oscillator is bullish or bearish.
Individual length and signal settings per timeframe.
Toggle for alignment mode: evenly spaced or floating layout.
All panels use a consistent layout for faster decision-making.
🔵 HOW TO USE
Select your preferred oscillator and activate 2–4 key timeframes (e.g., 1H, 4H, D1, W1).
Use signal crossovers as a bullish (🢁) or bearish (🢃) trend cue.
Look for aligned extremes (e.g., all timeframes overbought) to spot momentum exhaustion.
Ideal for momentum confluence strategies and top-down confirmation.
Use horizontal layout to stay focused on price while assessing broader structure.
🔵 CONCLUSION
MTF Oscillator Stack simplifies complex multi-timeframe momentum analysis into one clean, actionable visual. Whether you're tracking RSI, MFI, or Stoch RSI, this tool helps you stay aligned with the broader trend—without ever leaving your main chart.

Range Breakout [sgbpulse]Range Breakout
1. Overview
The "Range Breakout " indicator is a powerful tool designed to identify and visually display price ranges on your chart using pivot points. It dynamically draws two distinct boxes – an External Range and an Internal Range – helping traders pinpoint potential support and resistance zones. Beyond its visual representation, the indicator offers a comprehensive set of 12 unique breakout alerts, providing real-time notifications for significant price movements outside these defined ranges. Additionally, it integrates RSI and MFI metrics for momentum confirmation.
2. How It Works
The indicator operates by identifying pivot points based on user-defined "left" and "right" bar lengths. A high pivot is a bar with a specified number of lower highs both to its left and right, and similarly for a low pivot.
External Range: Calculated using longer pivot lengths (default: 15 bars left, 6 bars right). This range represents broader, more significant price consolidation areas.
Internal Range: Calculated using shorter pivot lengths (default: 4 bars left, 3 bars right). This range captures tighter, more immediate price consolidations within the broader trend.
The External Range will always be greater than or equal to the Internal Range, as it's based on a wider historical context. Both ranges are displayed as transparent boxes on your chart, dynamically adjusting as new pivots are formed.
3. Key Features and Settings
Customizable Pivot Lengths:
External Range (Left/Right Bars): Adjust sensitivity for identifying the broader price range. Longer lengths lead to more stable, but less frequent, range updates.
Internal Range (Left/Right Bars): Adjust sensitivity for the tighter, more immediate price range.
Tool Tips: Minimum 6 bars for the External Range, and minimum 2 bars for the Internal Range.
Customizable Range Colors: Easily change the background colors of the External and Internal Range boxes to match your chart's aesthetic.
Dynamic Range Display: The indicator automatically updates the range boxes as new pivot highs and lows are formed, always presenting the most current valid ranges.
RSI / MFI Settings:
Timeframe Source: Select the timeframe for RSI and MFI calculation.
- Chart: Calculation based on the current chart timeframe.
- Daily: Always calculated based on the daily ("D") timeframe, even if the chart is on a lower timeframe.
RSI Length: Period length for RSI calculation (default: 14).
RSI Overbought Level: Overbought level for RSI (default: 70.0).
RSI Oversold Level: Oversold level for RSI (default: 30.0).
MFI Length: Period length for MFI calculation (default: 14).
MFI Overbought Level: Overbought level for MFI (default: 80.0).
MFI Oversold Level: Oversold level for MFI (default: 20.0).
4. Synergy of Ranges & Breakout Strength
The interaction between the External and Internal Ranges provides deep insights into price movement and breakout strength:
Immediate Direction: The movement of the Internal Range (up or down) indicates the short-term directional bias within the broader framework of the External Range.
Strength Confirmation: A breakout of the External Range, followed by a breakout of the Internal Range, confirms the strength of the move and increases confidence in the breakout.
Strong Momentum ("Leaving" Ranges Behind): When price breaks out with exceptionally strong momentum, it continues to move aggressively and does not immediately form new pivots. In such situations, the existing ranges (External and Internal) remain in place while the candles "leave them behind." A "Full Candle" breakout, where the entire candle moves past both ranges, indicates a particularly powerful and decisive move.
Momentum (RSI / MFI) as Confirmation:
- RSI (Relative Strength Index): Measures the speed and change of price movements. Extreme values (above 70 or below 30) indicate overbought/oversold conditions respectively, confirming strong momentum in a breakout.
- MFI (Money Flow Index): Similar to RSI but incorporates volume. Extreme values (above 80 or below 20) indicate strong money flow in/out, reinforcing breakout confirmation.
- Importance of Confirmation: If a breakout occurs but momentum indicators do not confirm it (for example, an upside breakout while RSI is declining), this could signal weakness in the move and the risk of a false breakout (Fakeout).
5. Visuals
The indicator provides clear visual representations on the chart:
Range Boxes:
Two dynamic boxes are drawn on the chart: one for the External Range and one for the Internal Range.
These boxes update continuously, displaying the current range boundaries based on the latest pivots. They provide an immediate visual indication of support and resistance levels.
RSI/MFI Status Labels:
Small text labels appear to the right of the current bar, vertically centered.
They display the status of RSI and MFI: RSI OB (Overbought), RSI OS (Oversold), MFI OB, MFI OS, along with the exact value.
Important: The labels remain on the chart as long as the condition holds (indicator is above/below the level), unlike alerts which mark a singular crossover event.
Plotting of Key Values:
The indicator plots six invisible series on the chart, primarily to allow the user to view the exact numerical values of:
- The upper and lower bounds of the External Range (External High, External Low).
- The upper and lower bounds of the Internal Range (Internal High, Internal Low).
- The calculated RSI and MFI values (RSI, MFI).
These values are accessible for viewing through TradingView's Data Window and also via the Status Line when hovering over the relevant candle. This enables more precise quantitative analysis of range levels and momentum.
6. Comprehensive Breakout Alerts
The "Range Breakout " indicator provides 12 distinct alert conditions for breakouts, allowing you to select the required level of confirmation for each alert. All alerts are triggered only upon a fully confirmed bar close (barstate.isconfirmed) to minimize false signals and ensure reliability.
All breakout alerts are configured to detect a Crossover/Crossunder of the levels, meaning a specific event where the price moves from one side of the range to the other.
External Range Breakout UP
- Close: Price closes above the External Range.
- Real Body: The entire "real body" of the candle (min of open/close prices) closes above the External Range.
- Full Candle: The entire candle (the lowest point of the candle) closes above the External Range.
External Range Breakout DOWN
- Close: Price closes below the External Range.
- Real Body: The entire "real body" of the candle (max of open/close prices) closes below the External Range.
- Full Candle: The entire candle (the highest point of the candle) closes below the External Range.
Internal Range Breakout UP
- Close: Price closes above the Internal Range.
- Real Body: The "real body" of the candle closes above the Internal Range.
- Full Candle: The entire candle closes above the Internal Range.
Internal Range Breakout DOWN
- Close: Price closes below the Internal Range.
- Real Body: The "real body" of the candle closes below the Internal Range.
- Full Candle: The entire candle closes below the Internal Range.
7. Ideal Use Cases
This indicator is ideal for traders who:
Want to clearly identify and monitor price consolidation zones.
Seek confirmation for breakout strategies across various timeframes.
Require reliable and automated alerts for potential entry or exit points based on range expansion.
8. Complementary Indicator
For even more comprehensive market analysis, we highly recommend using this indicator in conjunction with Market Structure Support & Resistance External/Internal & BoS .
This powerful complementary indicator automatically and accurately identifies significant support and resistance levels by locating high and low pivot points, as well as key Pre-Market High/Low levels. Its strength lies in its dynamic adaptability to any timeframe and asset, providing precise and relevant real-time levels while maintaining a clean chart. It also identifies Break of Structure (BoS) to signal potential trend changes or continuations.
Using both indicators together provides a robust framework for identifying defined ranges and potential trend shifts, enabling more informed trading decisions.
View Market Structure Support & Resistance External/Internal & BoS Indicator
9. Important Note: Trading Risk
This indicator is intended for educational and informational purposes only and does not constitute investment advice or a recommendation for trading in any form whatsoever.
Trading in financial markets involves significant risk of capital loss. It is important to remember that past performance is not indicative of future results. All trading decisions are your sole responsibility. Never trade with money you cannot afford to lose.

RSI Buy Sell Signals+ with MFI Cloud [RanaAlgo]Indicator Overview
This indicator combines RSI (Relative Strength Index) with MFI (Money Flow Index) to generate trading signals with additional confirmation filters. The key features include:
RSI Analysis (14-period) with overbought/oversold levels
MFI Cloud (20-period default) showing trend direction via EMAs
Enhanced Signal Generation with volume and trend confirmation options
Visual Elements including colored zones, signal labels, and an information panel
How to Use This Indicator
Basic Interpretation:
Buy Signals (green labels) appear when:
RSI crosses above oversold level (30) OR
RSI shows a rising pattern from oversold zone with volume/trend confirmation (if enabled)
Sell Signals (red labels) appear when:
RSI crosses below overbought level (70) OR
RSI shows a falling pattern from overbought zone with volume/trend confirmation (if enabled)
MFI Cloud provides trend confirmation:
Green cloud = bullish trend (fast EMA > slow EMA)
Red cloud = bearish trend (fast EMA < slow EMA)
Recommended Usage:
For Conservative Trading:
Enable both volume and trend confirmation
Require MFI cloud to align with signal direction
Wait for RSI to clearly exit overbought/oversold zones
For Active Trading:
Combine with price action at key support/resistance levels
Watch for divergence between price and RSI
The Information Panel (top-right) shows:
Current RSI value and status
MFI trend direction
Last generated signal
Current momentum
Customization Options:
Adjust RSI/MFI lengths for sensitivity
Modify overbought/oversold levels
Toggle volume/trend confirmation requirements
Adjust visual elements like cloud opacity and zone visibility

Money Flow Pulse💸 In markets where volatility is cheap and structure is noisy, what matters most isn’t just the move — it’s the effort behind it. Money Flow Pulse (MFP) offers a compact, color-coded readout of real-time conviction by scoring volume-weighted price action on a five-tier scale. It doesn’t try to predict reversals or validate trends. Instead, it reveals the quality of the move in progress: is it fading , driving , exhausting , or hollow ?
🎨 MFP draws from the traditional Money Flow Index (MFI), a volume-enhanced momentum oscillator, but transforms it into a modular “pressure readout” that fits seamlessly into any structural overlay. Rather than oscillating between extremes with little interpretive guidance, MFP discretizes the flow into clean, color-coded regimes ranging from strong inflow (+2) to strong outflow (–2). The result is a responsive diagnostic layer that complements, rather than competes with, tools like ATR and/or On-Balance Volume.
5️⃣ MFP uses a normalized MFI value smoothed over 13 periods and classified into a 5-tier readout of Volume-Driven Conviction :
🍆 Exhaustion Inflow — usually a top or blowoff; not strength, but overdrive (+2)
🥝 Active Inflow — supportive of trend continuation (+1)
🍋 Neutral — chop, coil, or fakeouts (0)
🍑 Selling Intent — weakening structure, possible fade setups (-1)
🍆 Exhaustion Outflow — often signals forced selling or accumulation traps (-2)
🎭 These tiers are not arbitrary. Each one is tuned to reflect real capital behavior across timeframes. For instance, while +1 may support continuation, +2 often precedes exhaustion — especially on the lower timeframes. Similarly, a –1 reading during a pullback suggests sell-side pressure is building, but a shift to –2 may mean capitulation is already underway. The difference between the two can define whether a move is tradable continuation or strategic exhaustion .
🌊 The MFI ROC (Rate of Change) feature can be toggled to become a volatility-aware pulse monitor beneath the derived MFI tier. Instead of scoring direction or structure, ROC reveals how fast conviction is changing — not just where it’s headed, but how hard it's accelerating or decaying. It measures the raw Δ between the current and previous MFI values, exposing bursts of energy, fading pressure, or transitional churn .
🎢 Visually, ROC appears as a low-opacity area fill, anchored to a shared lemon-yellow zero line. When the green swell rises, buying pressure is accelerating; when the red drops, flow is actively deteriorating. A subtle bump may signal early interest — while a steep wave hints at an emotional overreaction. The ROC value itself provides numeric insight alongside the raw MFI score. A reading of +3.50 implies strong upside momentum in the flow — often supporting trend ignition. A score of –6.00 suggests rapid deceleration or full exhaustion — often preceding reversals or failed breakouts.
・ MFI shows you where the flow is
・ ROC tells you how it’s behaving
😎 This blend reveals not just structure or intent — but also urgency . And in flow-based trading, urgency often precedes outcome.
🧩 Divergence isn’t delay — it’s disagreement . One of the most revealing features of MFP is how it exposes momentum dissonance — situations where price and flow part ways. These divergences often front-run pivots , traps , or velocity stalls . Unlike RSI-style divergence, which whispers of exhaustion, MFI divergence signals a breakdown in conviction. The structure may extend — but the effort isn’t there.
・ Price ▲ MFI ▼ → Effortless Markup : Often signals distribution or a grind into liquidity. Without rising MFI, the rally lacks true flow participation — a warning of fragility.
・ Price ▼ MFI ▲ → Absorption or Early Accumulation : Price breaks down, but money keeps flowing in — a hidden bid. Watch for MFI tier shifts or ROC bursts to confirm a reversal.
🏄♂️ These moments don’t require signal overlays or setup hunting. MFP narrates the imbalance. When price breaks structure but flow does not — or vice versa — you’re not seeing trend, you’re seeing disagreement, and that's where edge begins.
💤 MFP is especially effective on intraday charts where volume dislocations matter most. On the 1H or 15m chart, it helps distinguish between breakouts with conviction versus those lacking flow. On higher timeframes, its resolution softens — it becomes more of a drift indicator than a trigger device. That’s by design: MFP prioritizes pulse, not position. It’s not the fire, it’s the heat.
📎 Use MFP in confluence with structural overlays to validate price behavior. A ribbon expansion with rising MFP is real. A compression breakout without +1 flow is "fishy". Watch how MFP behaves near key zones like anchored VWAP, MAs or accumulation pivots. When MFP rises into a +2 and fails to sustain, the reversal isn’t just technical — it’s flow-based.
🪟 MFP doesn’t speak loudly, but it never whispers without reason. It’s the pulse check before action — the breath of the move before the breakout. While it stays visually minimal on the chart, the true power is in the often overlooked Data Window, where traders can read and interpret the score in real time. Once internalized, these values give structure-aware traders a framework for conviction, continuation, or caution.
🛜 MFP doesn’t chase momentum — it confirms conviction. And in markets defined by noise, that signal isn’t just helpful — it’s foundational.

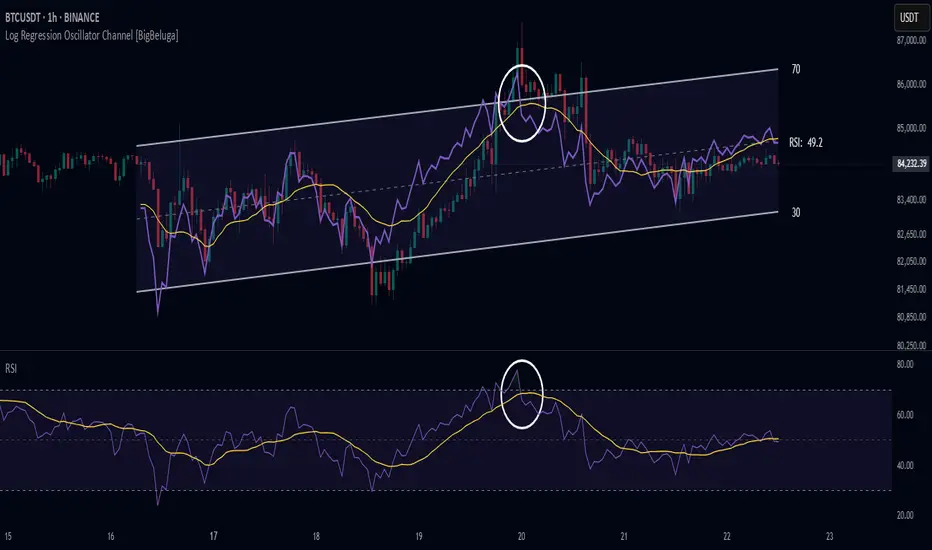
Log Regression Oscillator Channel [BigBeluga]
This unique overlay tool blends logarithmic trend analysis with dynamic oscillator behavior. It projects RSI, MFI, or Stochastic lines directly into a log regression channel on the price chart — offering an intuitive way to detect overbought/oversold momentum within the broader price structure.
🔵Key Features:
Logarithmic Regression Channel:
➣ Draws a trend-based channel using logarithmic regression, adapting to price growth curvature over time.
➣ Features upper, lower, and optional midline boundaries to visualize trend flow and range extremes.
Oscillator Overlay (RSI / MFI / Stochastic):
➣ Projects your chosen oscillator inside the channel using dynamic polylines.
➣ Allows switching between RSI, Money Flow Index, or Stochastic for versatile momentum insight.
Threshold-Based Scaling:
➣ The top and bottom of the channel represent traditional oscillator thresholds (e.g., RSI 70/30).
➣ Users can modify the scale in settings to customize what "overbought" or "oversold" means visually.
Signal Line Integration:
➣ Adds a yellow moving average (signal line) for smoother confirmation of oscillator turns.
➣ Helps identify divergence, momentum shifts, and fakeouts with better clarity.
Live Oscillator Readout:
➣ Displays the real-time oscillator value at the right edge of the chart.
➣ Ensures traders stay aware of current momentum levels without switching panels.
🔵Usage:
Momentum Context:
➣ When the oscillator touches the upper regression band, it may signal local overbought pressure.
➣ Touching the lower band may indicate oversold conditions within the current log trend.
Divergence Detection:
➣ Use the oscillator’s behavior relative to the channel slope to spot divergence from price.
➣ For example, RSI rising inside a falling channel can flag early trend shifts.
Trend-Sensitive Entries:
➣ Combine oscillator signals with log channel direction to filter trades in trend alignment.
➣ Signal line crossovers inside the channel act as early warning for momentum turns.
The Log Regression Oscillator Channel transforms how traders view classic momentum tools. By embedding oscillators into a logarithmic trend structure, it offers unmatched clarity on momentum positioning relative to price expansion. Ideal for swing traders, mean-reverters, or trend followers looking to sharpen entries and exits with style.
CFD Calculator For GFTC & INFINOX MT5Optimized CFD Trade Calculator + Pivot (Version 2) – For INFINOX MT5 & *GFTC
Risk Management & Entry Calculation:
Automatically computes the recommended entry lot size based on user inputs such as total capital and maximum loss percentage. For instance, a 0.4 lot position is sized to limit losses within 10% of a total capital of $1000 for a short position.
Pivot-Based Stoploss:
Dynamically updates stoploss levels using pivot high and low values. The indicator adjusts the pivot levels in real time as new extreme values are confirmed, ensuring that stoploss levels reflect current market conditions.
Real-Time Chart Display:
Key metrics are displayed through a customizable table, along with visual markers (triangles) that highlight breakouts. Shading is applied to indicate overbought/oversold conditions and divergence signals, with transparency and color settings fully configurable.
Additional Optional Features:
Users can selectively activate divergence, stochastic, and MFI signal alerts via the settings panel. These features are off by default to maintain a clean interface but can be enabled as needed.
User Interface Customization:
The indicator offers extensive customization for table headers, text, and background colors. This enables traders to tailor the display for optimal readability and integration with their charting style.
*GFTC : Global Financial Traders Council

Triple SRSI-MFI Ⅲ - Multi TimeframeTriple SRSI-MFI Ⅲ - Multi Timeframe Indicator
Description
The Triple SRSI-MFI Ⅲ - Multi Timeframe indicator is a powerful tool designed to combine Stochastic RSI (SRSI) and Money Flow Index (MFI) across multiple timeframes (higher, current, and lower). It provides a comprehensive view of market momentum and potential overbought/oversold conditions by calculating a weighted hybrid of SRSI-MFI values from three different timeframes. The indicator also integrates Bollinger Bands to help identify trend direction and volatility.
This indicator is ideal for traders who want to analyze market conditions across multiple timeframes without switching charts. It automatically adjusts settings based on the current timeframe and includes a dynamic weighting system optimized for Bitcoin volatility. Additionally, a real-time information panel displays the market state (buy/sell) and signal strength.
Key Features
Multi-Timeframe Analysis: Combines SRSI-MFI from higher, current, and lower timeframes for a holistic view.
Dynamic Weighting: Automatically adjusts weights for each timeframe based on Bitcoin volatility, with an option for manual customization.
Bollinger Bands Integration: Visualizes trend direction and volatility using Bollinger Bands, with customizable source selection.
Real-Time Info Panel: Displays market state (buy/sell) and signal strength (%) in the top-right corner of the chart.
Customizable Settings: Allows users to tweak MFI source, Bollinger Bands parameters, and visibility of individual components.
How to Use
Add to Chart: Add the "Triple SRSI-MFI Ⅲ - Multi Timeframe" indicator to your chart.
Interpret Signals:
Market State (Buy/Sell): Shown in the info panel. "Buy" when the average SRSI-MFI is above the Bollinger Bands basis, "Sell" when below.
Strength (%): The relative position of the average SRSI-MFI within the Bollinger Bands, scaled from 0% to 100%.
Overbought/Oversold Levels: The indicator plots horizontal lines at 80 (overbought) and 20 (oversold). Use these as potential reversal zones.
Combine with Price Action: Use the indicator in conjunction with price action or other tools for better decision-making.
Adjust Settings: Customize the settings (e.g., Bollinger Bands length, weights, visibility) to match your trading style.
Settings
MFI Source: Select the source for MFI calculation (default: "hlc3"). Options include "close", "open", "high", "low", "hl2", "hlc3", "ohlc4".
Bollinger Bands:
Length: Period for Bollinger Bands calculation (default: 20).
Multiplier: Standard deviation multiplier for the bands (default: 2.0).
Source: Choose which SRSI-MFI value to use for Bollinger Bands ("averageHybrid", "hybrid_higher", "hybrid_current", "hybrid_lower"; default: "hybrid_higher").
Weights:
Auto Weight Enabled: Enable/disable automatic weights based on Bitcoin volatility (default: true).
Higher/Current/Lower Weights: Manually set weights for each timeframe if auto-weight is disabled (defaults: 1.5, 1.0, 0.5).
Indicator On/Off:
Toggle visibility for Higher SRSI-MFI, Current SRSI-MFI, Lower SRSI-MFI, Average SRSI-MFI, and Bollinger Bands.
How It Works
SRSI-MFI Calculation:
Stochastic RSI (SRSI) and Money Flow Index (MFI) are calculated for three timeframes: higher, current, and lower.
The hybrid value (SRSI * (MFI / 100)) is computed for each timeframe.
Weighted Average:
The hybrid values are combined into a weighted average (averageHybrid) using dynamic or manual weights.
Bollinger Bands:
Bollinger Bands are applied to the selected source (e.g., hybrid_higher) to identify trend direction and volatility.
Relative Position:
The position of averageHybrid within the Bollinger Bands is scaled to a percentage (0% to 100%) for strength assessment.
Visualization:
Plots individual SRSI-MFI lines, Bollinger Bands, and overbought/oversold levels.
A real-time info panel provides market state and signal strength.
Notes
This indicator is best used as part of a broader trading strategy. It is not a standalone signal generator and should be combined with other forms of analysis.
The automatic weights are optimized for Bitcoin (BTC) volatility. For other assets, you may need to adjust the weights manually.
The indicator may require sufficient historical data to calculate higher and lower timeframe values accurately.

MFI Nexus Pro [trade_lexx]📈 MFI Nexus Pro is your reliable trading assistant!
📊 What is MFI Nexus Pro ?
MFI Nexus Pro is a trading indicator that analyzes cash flows in the market. It shows where money is moving — into or out of an asset, and based on this, generates buy or sell signals.
💡 The main components of the indicator
📊 The MFI Cash Flow Index (MFI)
shows the strength of cash flow into an asset. Values above 70 indicate overbought (an early sale is possible), and values below 30 indicate oversold (an early purchase is possible).
📈 Moving Averages (MA)
The indicator uses 10 different types of moving averages to smooth the MFI line.:
- SMA: Simple moving average
- EMA: Exponential moving average
- WMA: Weighted moving average
And other more complex types (HMA, KAMA, VWMA, ALMA, TEMA, ZLEMA, DEMA)
The choice of the type of moving average affects the speed of the indicator's response to market changes.
🎯 Bollinger Bands (BB)
Bands around the moving average that widen and narrow depending on volatility. They help determine when the MFI is out of the normal range.
🔄 Divergences
Divergences show discrepancies between price and MFI:
- Bullish divergence: the price is falling and the MFI is rising — an upward reversal is possible
- Bearish divergence: the price is rising and the MFI is falling — a downward reversal is possible
🔍 Indicator signals
1️⃣ Moving average signals (MA)
Buy signal
- What happens: MFI crosses its moving average from bottom to top
- What does it look like: the green triangle labeled "MA" under the chart
- What does it mean: money begins to actively flow into the asset, price growth is possible
Sell signal
- What happens: the MFI crosses the moving average from top to bottom
- What does it look like: a red triangle with the label "MA" above the chart
- What does it mean: money starts to leave the asset, the price may fall
2️⃣ Bollinger Band Signals (BB)
Buy signal
- What's happening: The MFI crosses the lower Bollinger band from bottom to top
- What it looks like: the green triangle marked "BB"
- What it means: The MFI was too low and is now starting to recover
Sell Signal
- What's going on: MFI crosses the upper Bollinger band from top to bottom
- What it looks like: a red triangle marked "BB"
- What it means: The MFI was too high and is now starting to decline
3️⃣ Divergence Signals (Div)
Buy Signal (Bullish Divergence)
- What's going on: the price is falling more than the MFI
- What it looks like: a green triangle marked "Div"
- What it means: despite the fall in price, money is already starting to return to the asset
Sell signal (bearish divergence)
- What is happening: the price is rising more strongly than the MFI
- What does it look like: the red triangle with the label "Div"
- What does it mean: despite the price increase, money is already starting to leave the asset
🛠️ Filters to filter out false signals
1️⃣ Minimum distance between the signals
- What it does: sets the minimum number of candles between signals
- Why it is needed: prevents signals from being too frequent during strong market fluctuations
- How to set it up: Set the number from 0 and above (default: 5)
2️⃣ "Waiting for the opposite signal" mode
- What it does: waits for a signal in the opposite direction before generating a new signal
- Why you need it: it helps you not to miss important trend reversals
- How to set up: just turn the function on or off
3️⃣ Filter by MFI levels
- What it does: generates signals only when the MFI is in the specified ranges
- Why it is needed: it helps to catch the moments when the market is oversold or overbought
- How to set up:
- For buy signals: set a range for oversold (e.g. 1-30)
- For sell signals: set a range for overbought (e.g. 70-100)
4️⃣ The RSI filter
- What it does: additionally checks the RSI values to confirm the signals
- Why it is needed: adds additional confirmation from another popular indicator
- How to set up: Similar to the MFI filter, set ranges for buying and selling
🔄 Signal combination modes
1️⃣ Normal mode ("None")
- How it works: all signals (MA, BB, Div) work independently of each other
- When to use it: for general market analysis or when learning how to work with the indicator
2️⃣ "And" mode ("MA and BB and Div")
- How it works: the alarm appears only when several conditions are triggered simultaneously
- Combination options:
- MA+BB: signals from the moving average and Bollinger bands
- MA+Div: signals from the moving average and divergence
- BB+Div: signals from the Bollinger bands and divergence
- MA+BB+Div: all three signals simultaneously
- When to use: for more reliable but rare signals
3️⃣ "OR" mode ("MA or BB or Div")
- How it works: the alarm appears when any of the conditions are triggered
- When to use: for frequent signals when you don't want to miss any opportunity.
🔌 Connecting to trading strategies
The indicator can be connected to your trading strategies using 5 different channels.:
1. Channel for MA signals: connects only signals from moving averages
2. BB signal channel: connects only the signals from the Bollinger bands
3. Channel for divergence signals: connects only divergence signals
4. Channel for "And" mode: connects only combined signals
5. Channel for "OR" mode: connects signals from any source
🔔 Setting up alerts
The indicator can send alerts when alarms appear.:
- Alerts for MA: when the MFI crosses the moving average
- Alerts for BB: when the MFI crosses the Bollinger bands
- Divergence alerts: when a divergence is detected
- Combined alerts: for "AND" and "OR" modes
🎭 What does the indicator look like on the chart ?
- MFI main line: purple line
- Overbought/oversold levels: horizontal lines at levels 30 and 70
- Middle line: dotted line at level 50
- MFI Moving Average: yellow line
- Bollinger bands: green lines around the moving average
- Signals: green and red triangles with corresponding labels
📚 How to start using MFI Nexus Pro
1️⃣ Initial setup
- Add an indicator to your chart
- Select the type of moving average and the period (you can leave it as the default)
- Activate the desired signal types (MA, BB, Div)
2️⃣ Filter settings
- Set the distance between the signals to get rid of unnecessary noise
- Adjust the MFI and RSI levels depending on how volatile your asset is
- If you need more reliable signals, turn on the "Waiting for the opposite signal" mode.
3️⃣ Operation mode selection
- First, use the standard mode to see all possible signals.
- When you get comfortable, try the "And" mode for more reliable signals.
- For active trading, you can use the "OR" mode
4️⃣ Setting up Alerts
- Select the types of signals you want to be notified about
- Set up alerts for "AND" or "OR" modes if you use them
5️⃣ Verification and adaptation
- Check the operation of the indicator on historical data
- Adjust the parameters for a specific asset
- Adapt the settings to your trading style
🌟 Usage examples
For trend trading
- Use MA signals in the direction of the main trend
- Turn on the "Waiting for the opposite signal" mode
- Set stricter levels for filters
For trading in a sideways range
- Use BB signals to detect bounces from the range boundaries
- Use the MFI level filter to confirm overbought/oversold conditions
- Adjust the Bollinger bands according to the width of the range
To determine the pivot points
- Pay attention to the divergence signals
- Use the "And" mode by combining divergences with other signals
- Check the RSI filter for additional confirmation
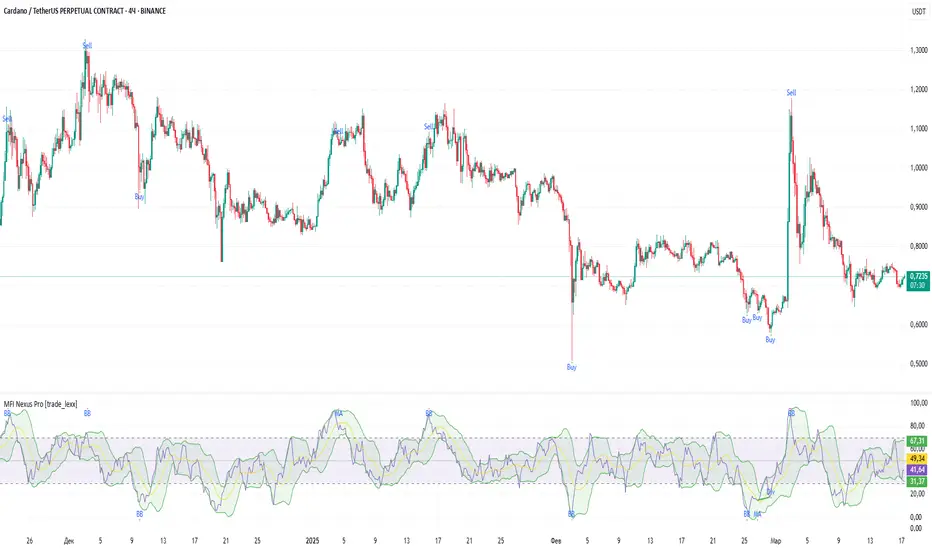
Money Flow Index MTF + Alerts with Candle Opacity & LabelsHow to Use the Money Flow Index MTF + Alerts with Candle Opacity & Labels Indicator
Overview:
This indicator is designed to help you gauge the buying and selling pressure in a market by using the Money Flow Index (MFI). Unlike many momentum oscillators, the MFI incorporates both price and volume, providing a unique perspective on market activity. It is particularly useful when you want to visually assess potential overbought or oversold conditions.
Indicator Components:
Money Flow Index (MFI) Calculation:
The indicator computes the MFI using a user-defined look-back period (default is 14 bars). The MFI is scaled between 0 and 100, where values above 80 typically indicate overbought conditions and values below 20 suggest oversold conditions.
Multi-Timeframe (MTF) Capability:
You can choose to calculate the MFI using either the current chart’s timeframe or a custom timeframe (for example, a 4-hour chart). This flexibility allows you to compare longer-term money flow trends against your primary trading timeframe.
Candle Opacity Based on MFI:
The opacity of the candles on your chart is dynamically adjusted based on the current MFI reading. When the MFI is high (near 100), candles become more opaque; when the MFI is low (near 0), candles appear more transparent. This visual cue can help you quickly spot changes in market momentum.
Visual Labels for Overbought/Oversold Conditions:
When the MFI crosses into the overbought territory, a red label reading “Overbought” is displayed above the high of the bar. Similarly, when it crosses into the oversold territory, a green label reading “Oversold” is placed below the low of the bar. These labels provide an immediate visual alert to potential reversal points or areas of caution.
Alert Conditions:
The script also includes alert conditions for both overbought and oversold signals. You can set up TradingView alerts so that you are notified in real time when the indicator detects these conditions.
Theory Behind the Money Flow Index (MFI):
The Money Flow Index is a momentum oscillator that uses both price and volume to signal the strength behind price moves.
Overbought Conditions: When the MFI is above 80, it suggests that buying pressure is very strong and the asset might be due for a pullback or consolidation.
Oversold Conditions: Conversely, when the MFI falls below 20, selling pressure is high and the asset might be oversold, potentially priming it for a bounce.
Keep in mind that in strong trending markets, overbought or oversold readings can persist for extended periods, so the MFI should be used in conjunction with other technical analysis tools.
Position Management Guidance:
While the indicator is useful for spotting potential overbought and oversold conditions, it is not designed to serve as an automatic signal to completely close a position. Instead, you might consider using it as a guide for pyramiding—gradually adding to your position over several days rather than exiting all at once. This approach allows you to better manage risk by:
Scaling In or Out Gradually: Instead of making one large position change, you can add or reduce your position in increments as market conditions evolve.
Diversifying Risk: Pyramiding helps you avoid the pitfalls of trying to time the market perfectly on a single trade exit or entry.
How to Get Started:
Apply the Indicator:
Add the indicator to your TradingView chart. Adjust the input settings (length, oversold/overbought levels, and resolution) as needed for your trading style and the market you’re analyzing.
Watch the Candles:
Observe the dynamic opacity of your candles. A sudden change in opacity can be a sign that the underlying money flow is shifting.
Monitor the Labels:
Pay attention to the “Overbought” or “Oversold” labels that appear. Use these cues in combination with your broader analysis to decide if it might be a good time to add to or gradually exit your position.
Set Up Alerts:
Configure TradingView alerts based on the indicator’s alert conditions so that you are notified when the MFI reaches extreme levels.
Use as Part of a Broader Strategy:
Remember, no single indicator should dictate your entire trading decision. Combine MFI signals with other technical analysis, risk management rules, and market insights to guide your trades.
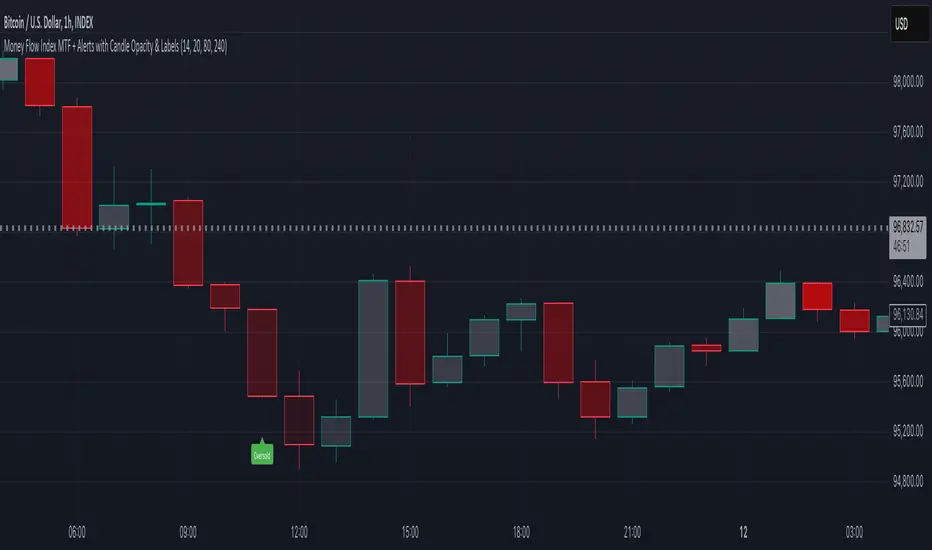
RVMM IndicatorRVMM Indicator
RVMM Indicator combines four indicators: RSI, VWAP, MFI, and Momentum to provide comprehensive technical analysis. This indicator helps traders identify potential market conditions based on the interaction of these indicators.
Components of the RVMM Indicator
1. RSI (Relative Strength Index)
RSI is a momentum indicator that measures the speed and change of price movements. RSI oscillates between 0 and 100 and is used to identify overbought and oversold conditions in the market.
Buy Level: Set at 30. When RSI falls below 30, the market is considered oversold, which may suggest a potential upward trend reversal.
Sell Level: Set at 70. When RSI rises above 70, the market is considered overbought, which may suggest a potential downward trend reversal.
2. VWAP (Volume Weighted Average Price)
VWAP is an indicator that combines price and volume to calculate the average price weighted by volume. VWAP is used to identify support and resistance areas and assess the strength of price movements.
Interpretation: If the price is above the VWAP line, the market is likely in an uptrend. If the price is below the VWAP line, the market is in a downtrend.
3. MFI (Money Flow Index)
MFI is a momentum indicator that considers both price and volume. MFI oscillates between 0 and 100 and is used to identify overbought and oversold conditions in the market.
Oversold Level: Set at 20. When MFI falls below 20, the market is considered oversold.
Overbought Level: Set at 80. When MFI rises above 80, the market is considered overbought.
4. Momentum
Momentum is an indicator that measures the speed of price changes. This indicator is used to identify the strength of a trend.
Interpretation: High momentum values indicate a strong uptrend, while low momentum values indicate a strong downtrend.
How to Use the RVMM Indicator
Interpreting Market Conditions:
RSI : Check RSI values below 30 to identify oversold conditions, and above 70 to identify overbought conditions.
VWAP : Observe whether the price is above or below the VWAP line to determine if the market is in an uptrend or downtrend.
MFI : Check if MFI is below 20 to identify oversold conditions, and above 80 to identify overbought conditions.
Momentum : Analyze momentum values to gauge the strength of the current trend.
Confirming Market Conditions:
Use VWAP, MFI, and Momentum to confirm market conditions identified by RSI.
If the price is above the VWAP line, and MFI and Momentum indicate the strength of the uptrend, the market may be in a bullish phase.
If the price is below the VWAP line, and MFI and Momentum indicate the strength of the downtrend, the market may be in a bearish phase.
Risk Management:
Set stop-loss and take-profit levels based on technical analysis and your trading preferences.
Monitor the market and adjust stop-loss and take-profit levels as market conditions change.
Example of Application
Here is an example of how to use the RVMM Indicator in practice:
Bullish Phase: When the price is above the VWAP line, RSI is below 30, and MFI and Momentum indicate the strength of the uptrend, the market is likely in a bullish phase.
Bearish Phase: When the price is below the VWAP line, RSI is above 70, and MFI and Momentum indicate the strength of the downtrend, the market is likely in a bearish phase.

Multi-indicator Signal Builder [Skyrexio]Overview
Multi-Indicator Signal Builder is a versatile, all-in-one script designed to streamline your trading workflow by combining multiple popular technical indicators under a single roof. It features a single-entry, single-exit logic, intrabar stop-loss/take-profit handling, an optional time filter, a visually accessible condition table, and a built-in statistics label. Traders can choose any combination of 12+ indicators (RSI, Ultimate Oscillator, Bollinger %B, Moving Averages, ADX, Stochastic, MACD, PSAR, MFI, CCI, Heikin Ashi, and a “TV Screener” placeholder) to form entry or exit conditions. This script aims to simplify strategy creation and analysis, making it a powerful toolkit for technical traders.
Indicators Overview
1. RSI (Relative Strength Index)
Measures recent price changes to evaluate overbought or oversold conditions on a 0–100 scale.
2. Ultimate Oscillator (UO)
Uses weighted averages of three different timeframes, aiming to confirm price momentum while avoiding false divergences.
3. Bollinger %B
Expresses price relative to Bollinger Bands, indicating whether price is near the upper band (overbought) or lower band (oversold).
4. Moving Average (MA)
Smooths price data over a specified period. The script supports both SMA and EMA to help identify trend direction and potential crossovers.
5. ADX (Average Directional Index)
Gauges the strength of a trend (0–100). Higher ADX signals stronger momentum, while lower ADX indicates a weaker trend.
6. Stochastic
Compares a closing price to a price range over a given period to identify momentum shifts and potential reversals.
7. MACD (Moving Average Convergence/Divergence)
Tracks the difference between two EMAs plus a signal line, commonly used to spot momentum flips through crossovers.
8. PSAR (Parabolic SAR)
Plots a trailing stop-and-reverse dot that moves with the trend. Often used to signal potential reversals when price crosses PSAR.
9. MFI (Money Flow Index)
Similar to RSI but incorporates volume data. A reading above 80 can suggest overbought conditions, while below 20 may indicate oversold.
10. CCI (Commodity Channel Index)
Identifies cyclical trends or overbought/oversold levels by comparing current price to an average price over a set timeframe.
11. Heikin Ashi
A type of candlestick charting that filters out market noise. The script uses a streak-based approach (multiple consecutive bullish or bearish bars) to gauge mini-trends.
12. TV Screener
A placeholder condition designed to integrate external buy/sell logic (like a TradingView “Buy” or “Sell” rating). Users can override or reference external signals if desired.
Unique Features
1. Multi-Indicator Entry and Exit
You can selectively enable any subset of 12+ classic indicators, each with customizable parameters and conditions. A position opens only if all enabled entry conditions are met, and it closes only when all enabled exit conditions are satisfied, helping reduce false triggers.
2. Single-Entry / Single-Exit with Intrabar SL/TP
The script supports a single position at a time. Once a position is open, it monitors intrabar to see if the price hits your stop-loss or take-profit levels before the bar closes, making results more realistic for fast-moving markets.
3. Time Window Filter
Users may specify a start/end date range during which trades are allowed, making it convenient to focus on specific market cycles for backtesting or live trading.
4. Condition Table and Statistics
A table at the bottom of the chart lists all active entry/exit indicators. Upon each closed trade, an integrated statistics label displays net profit, total trades, win/loss count, average and median PnL, etc.
5. Seamless Alerts and Automation
Configure alerts in TradingView using “Any alert() function call.”
The script sends JSON alert messages you can route to your own webhook.
The indicator can be integrated with Skyrexio alert bots to automate execution on major cryptocurrency exchanges
6. Optional MA/PSAR Plots
For added visual clarity, optionally plot the chosen moving averages or PSAR on the chart to confirm signals without stacking multiple indicators.
Methodology
1. Multi-Indicator Entry Logic
When multiple entry indicators are enabled (e.g., RSI + Stochastic + MACD), the script requires all signals to align before generating an entry. Each indicator can be set for crossovers, crossunders, thresholds (above/below), etc. This “AND” logic aims to filter out low-confidence triggers.
2. Single-Entry Intrabar SL/TP
One Position At a Time: Once an entry signal triggers, a trade opens at the bar’s close.
Intrabar Checks: Stop-loss and take-profit levels (if enabled) are monitored on every tick. If either is reached, the position closes immediately, without waiting for the bar to end.
3. Exit Logic
All Conditions Must Agree: If the trade is still open (SL/TP not triggered), then all enabled exit indicators must confirm a closure before the script exits on the bar’s close.
4. Time Filter
Optional Trading Window: You can activate a date/time range to constrain entries and exits strictly to that interval.
Justification of Methodology
Indicator Confluence: Combining multiple tools (RSI, MACD, etc.) can reduce noise and false signals.
Intrabar SL/TP: Capturing real-time spikes or dips provides a more precise reflection of typical live trading scenarios.
Single-Entry Model: Straightforward for both manual and automated tracking (especially important in bridging to bots).
Custom Date Range: Helps refine backtesting for specific market conditions or to avoid known irregular data periods.
How to Use
1. Add the Script to Your Chart
In TradingView, open Indicators , search for “Multi-indicator Signal Builder”.
Click to add it to your chart.
2. Configure Inputs
Time Filter: Set a start and end date for trades.
Alerts Messages: Input any JSON or text payload needed by your external service or bot.
Entry Conditions: Enable and configure any indicators (e.g., RSI, MACD) for a confluence-based entry.
Close Conditions: Enable exit indicators, along with optional SL (negative %) and TP (positive %) levels.
3. Set Up Alerts
In TradingView, select “Create Alert” → Condition = “Any alert() function call” → choose this script.
Entry Alert: Triggers on the script’s entry signal.
Close Alert: Triggers on the script’s close signal (or if SL/TP is hit).
Skyrexio Alert Bots: You can route these alerts via webhook to Skyrexio alert bots to automate order execution on major crypto exchanges (or any other supported broker).
4. Visual Reference
A condition table at the bottom summarizes active signals.
Statistics Label updates automatically as trades are closed, showing PnL stats and distribution metrics.
Backtesting Guidelines
Symbol/Timeframe: Works on multiple assets and timeframes; always do thorough testing.
Realistic Costs: Adjust commissions and potential slippage to match typical exchange conditions.
Risk Management: If using the built-in stop-loss/take-profit, set percentages that reflect your personal risk tolerance.
Longer Test Horizons: Verify performance across diverse market cycles to gauge reliability.
Example of statistic calculation
Test Period: 2023-01-01 to 2025-12-31
Initial Capital: $1,000
Commission: 0.1%, Slippage ~5 ticks
Trade Count: 468 (varies by strategy conditions)
Win rate: 76% (varies by strategy conditions)
Net Profit: +96.17% (varies by strategy conditions)
Disclaimer
This indicator is provided strictly for informational and educational purposes .
It does not constitute financial or trading advice.
Past performance never guarantees future results.
Always test thoroughly in demo environments before using real capital.
Enjoy exploring the Multi-Indicator Signal Builder! Experiment with different indicator combinations and adjust parameters to align with your trading preferences, whether you trade manually or link your alerts to external automation services. Happy trading and stay safe!

Weekly Bottom Finder 1.0A Tool for Identifying Market Bottoms
The Weekly Bottom Finder indicator is designed for in-depth market analysis on weekly timeframes. Utilizing innovative methodology, it allows traders to identify potential zones of market bottoms, which often mark the beginning of new bullish trends. This indicator combines multiple advanced algorithms working in unison to deliver accurate and reliable signals.
What Makes Weekly Bottom Finder Unique?
Comprehensive Approach
The indicator integrates several analytical techniques, including:
Volume Analysis: Evaluates market activity to highlight significant interest.
Money Flow Index (MFI): Detects overbought and oversold zones.
ATR (Average True Range): Accounts for market volatility.
Advanced Internal Algorithms: Measures trend strength and consistency.
Accurate Bottom Detection
Signals are only generated when all conditions confirm a potential market bottom. This minimizes false signals that are common with many other indicators.
Visualization
Potential market bottom zones are displayed as light green vertical lines, making signals easy to identify without cluttering the chart.
Adaptability
Weekly Bottom Finder automatically adjusts to market conditions, considering volume, volatility, and market dynamics, making it a versatile tool for different markets and scenarios.
Key Features
Parameter Synchronization
The indicator uses finely tuned thresholds for trend analysis, effectively filtering out short-term market noise.
Balanced Settings
Users can adjust the "Bottom Sensitivity" parameter to customize the indicator to their needs, providing either more or fewer signals based on their trading strategy.
Weekly Timeframe
Specifically designed for long-term analysis on weekly candles, the indicator performs effectively across various markets, including cryptocurrencies like Bitcoin, traditional stock markets, and forex trading. It's worth testing the indicator's performance on different exchanges for the same cryptocurrency. Price movements can vary slightly between exchanges, resulting in a different number of signals.
Volume Filters
An additional volume filter ensures that signals are generated only in zones where the market exhibits genuine participant interest.
How Does Weekly Bottom Finder Work?
Calculating Bottom Zones
The indicator identifies potential bottoms when prices are in oversold zones (low MFI) and the market shows high volume, indicating buyer interest.
Double Signal Verification
Each signal is filtered through a system of rules, including ATR and volume analysis, to avoid false positives.
Additional Information
Weekly Bottom Finder helps traders pinpoint key moments when the market may be reaching its lowest points, creating potential entry opportunities. However, it does not provide guarantees and serves only as a supplementary tool for deeper market understanding.
Please Note: Weekly Bottom Finder is an analytical tool that should be used alongside your own research and risk management strategies.
