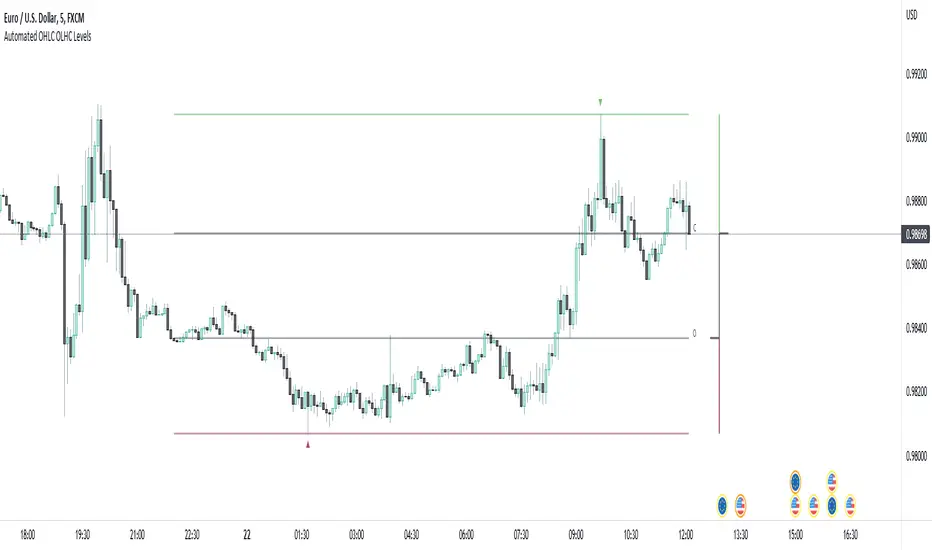
Automated OHLC OLHC LevelsA simple, clean, effective visualization tool, for the OHLC or OLHC of a chosen candle/timeframe.
Apply this indicator using a higher timeframe, in conjunction with other levels and the directional bias, to easily recognize trading opportunities at lower timeframes.
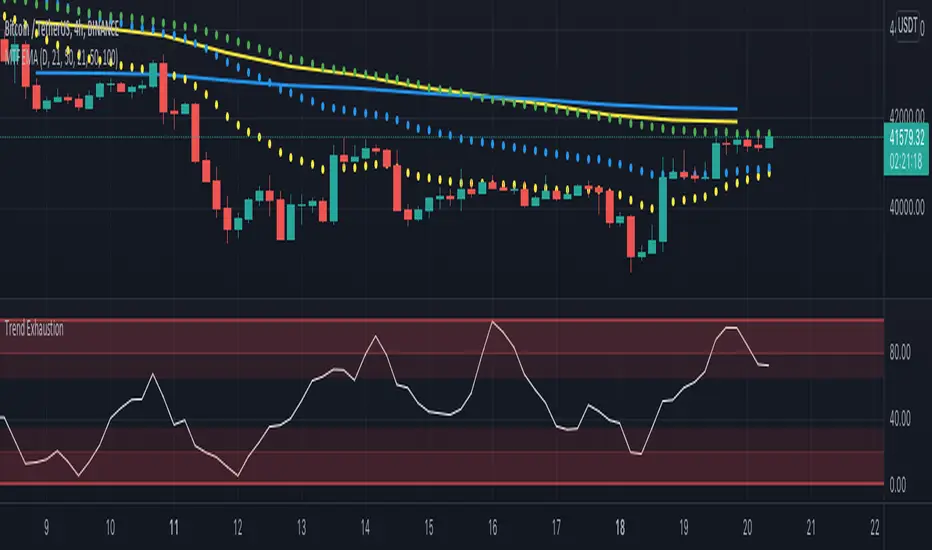
Multitimeframeanalysis
SuperTrend Momentum Chart(My goal creating this indicator) : Provide a quick way to check the current momentum of multiple timeframes. The Smart Momentum Chart was intended to be a live trading tool that should be used when a trader has already defined his edge and no longer needs the past Momentum data.
The Underlying Concept
What is Momentum ?
The Momentum shown is derived from a Mathematical Formula SUPERTREND , when price is above SUPERTREND its bullish Momentum and when its below SUPERTREND its Bearish Momentum. This indicator scans for candle closes on the timeframes you've selected and when there is a shift in momentum it notifies the trader with a color change and an alert if one was set up.
Technical inputs
- If you want to optimize the rate of signals to better fit your trading plan you would change the Factor input and ATR Length input. Increase factor and ATR Length to decrease the frequency of signals and decrease the Factor and ATR Length to increase the frequency of signals.
Quick TIP! : You can Sync all VFX SuperTrend Indicators together! All VFX SuperTrend indicators display unique information but its all derived from that same Momentum Formula. Keep the Factor input and ATR Length the same on other VFX SuperTrend indicators to have them operating on the same data.
Time Frame Inputs
- Your able to fill the chart with up to 8 timeframes
- If You don't need all 8 you can limit the amount to display by changing the "Time Frame Amount"
Display Inputs
- You can change the size of the chart and the color of the text
- You can toggle ON if you want to be signaled when a momentum switch occurs ( bullish to bearish or bearish to bullish )
- Your able to pick the Bullish and Bearish Colors of the Momentum switch
How it can be used ?
- Easily check the momentum of other Timeframes and use that information as a variable in your trading plan.
- quickly glance and know the momentum of any time frame before you enter any trade
- always know the momentum of the higher time frames
- Eliminate the need to switch from current chart
- Get an abundance of information in one location
- Have clear variables to structure your trades around

MTFA - Multi Time Frame Analysis - Moving AveragesThis indicator will help you make better informed trading decisions by showing higher time frame moving averages overlaid on a single chart. You can customise 4 moving averages.
Triple RSI strategyThis strategy is commonly used both in forex and stock markets for reversal trading. when the rsi line reaches and crosses simultaneously at 3 rsi setups i.e at 7, 14, and 21, a signal is generated.
This strategy works best in 1-hour timeframe. It provides over 60 to 80 percent accuracy in 1-hour timeframe.
In the stock market, this strategy provides an excellent entry point, if one is seeking small profits.
One can expect to make around 10 to 50 pips in the forex market easily. However, I advise seeking support from price action from the lower timeframe in the forex market.
I hope you like it.
Follow for more strategies and scripts like this.

Rsi/W%R/Stoch/Mfi: HTF overlay mini-plotsOverlay mini-plots for various indicators. Shows current timeframe; and option to plot 2x higher timeframes (i.e. 15min and 60min on the 5min chart above).
The idea is to de-clutter chart when you just want real-time snippets for an indicator.
Useful for gauging overbought/oversold, across timeframes, at a glance.
~~Indicators~~
~RSI: Relative strength index
~W%R: Williams percent range
~Stochastic
~MFI: Money flow index
~~Inputs~~
~indicator length (NB default is set to 12, NOT the standard 14)
~choose 2x HTFs, show/hide HTF plots
~choose number of bars to show (current timeframe only; HTF plots show only 6 bars)
~horizontal position: offset (bars); shift plots right or left. Can be negative
~vertical position: top/middle/bottom
~other formatting options (color, line thickness, show/hide labels, 70/30 lines, 80/20 lines)
~~tips~~
~should be relatively easy to add further indicators, so long as they are 0-100 based; by editing lines 9 and 11
~change the vertical compression of the plots by playing around with the numbers (+100, -400, etc) in lines 24 and 25

OHLC MTFThe script allows you to plot the opening, highest, lowest and closing (ohlc) values of a previous candle.
Settings :
- "Time Frame" : allows you to choose the reference time frame;
- "Offset" : sets which candle to select the data from.
Ex : If you select "1 day" as the time frame and "1" as the offset, the OHLC values of yesterday's daily candle will be displayed (regardless of your current time frame).

+ Multi-timeframe Multiple Moving Average LinesThis is a pretty simple script that plots lines for various moving averages (what I think are the most commonly used across all markets) of varying lengths of timeframes of the user's choosing. Timeframes range from 5 minutes up to one month, so regardless if you're a scalper or a swing trader there should be something here for you.
There are 8 lines (that can be turned on/off individually), which may seem like a lot, but if you use two averages and want to display four different timeframes for each, you can do that. The nice thing is that because the lines start plotting from the current bar they won't clutter up the screen. And obviously having moving averages from different timeframes on your chart makes price action more difficult to read (I mean sure, you can make them invisible, but who wants to do that all the time).
For each line there are two labels. One with the moving average type, and the other with its specific timeframe. I can't include the moving average length because it's not a string input. If anyone has a workaround for this, let me know, otherwise I would simply recommend setting different colors depending on the length, or if you only use one or two lengths and one or two moving averages this shouldn't be an issue. I had to use two labels because for the label text I couldn't include more than one string input, this is why there is an input for the 'moving average type label distance.'' You will want to adjust this depending on if you are trading crypto, futures, or forex because in some cases there may still be label overlap.
Pretty much everything else is self-explanatory.
I've added alerts. I might need to modify them if I can, because it would be nice for them to state the name and timeframe of the moving average. But I think this will do for now.
Enjoy!

Magnifying Glass (LTF Candles) by SiddWolf█ OVERVIEW
This indicator displays The Lower TimeFrame Candles in current chart, Like Zooming in on the Candle to see it's Lower TimeFrame Structure. It plots intrabar OHLC data inside a Label along with the volume structure of LTF candle in an eloquent format.
█ QUICK GUIDE
Just apply it to the chart, Hover the mouse on the Label and ta-da you have a Lower Timeframe OHLC candles on your screen. Move the indicator to the top and shrink it all the way up, because all the useful data is inside the label.
Inside the label: The OHLC ltf candles are pretty straightforward. Volume strength of ltf candles is shown at bottom and Volume Profile on the left. Read the Details below for more information.
In the settings, you will find the option to change the UI and can play around with Lower TimeFrame Settings.
█ DETAILS
First of all, I would like to thank the @TradingView team for providing the function to get access to the lower timeframe data. It is because of them that this magical indicator came into existence.
Magnifying Glass indicator displays a Candle's Lower TimeFrame data in Higher timeframe chart. It displays the LTF candles inside a label. It also shows the Volume structure of the lower timeframe candles. Range percentage shown at the bottom is the percentage change between high and low of the current timeframe candle. LTF candle's timeframe is also shown at the bottom on the label.
This indicator is gonna be most useful to the price action traders, which is like every profitable trader.
How this indicator works:
I didn't find any better way to display ltf candles other than labels. Labels are not build for such a complex behaviour, it's a workaround to display this important information.
It gets the lower timeframe information of the candle and uses emojis to display information. The area that is shown, is the range of the current timeframe candle. Range is a difference between high and low of the candle. Range percentage is also shown at the bottom in the label.
I've divided the range area into 20 parts because there are limitation to display data in the labels. Then the code checks out, in what area does the ltf candle body or wick lies, then displays the information using emojis.
The code uses matrix elements for each block and relies heavily on string manipulation. But what I've found most difficult, is managing to fit everything correctly and beautifully so that the view doesn't break.
Volume Structure:
Strength of the Lower TimeFrame Candles is shown at the bottom inside the label. The Higher Volume is shown with the dark shade color and Lower Volume is shown with the light shade. The volume of candles are also ranked, with 1 being the highest volume, so you can see which candle have the maximum to minimum volume. This is pretty important to make a price action analysis of the lower timeframe candles.
Inside the label on the left side you will see the volume profile. As the volume on the bottom shows the strength of each ltf candles, Volume profile on the left shows strength in a particular zone. The Darker the color, the higher the volume in the zone. The Highest volume on the left represents Point of Control (Volume Profile POC) of the candle.
Lower TimeFrame Settings:
There is a limitation for the lowest timeframe you can show for a chart, because there is only so much data you can fit inside a label. A label can show upto 20 blocks of emojis (candle blocks) per row. Magnifying Glass utilizes this behaviour of labels. 16 blocks are used to display ltf candles, 1 for volume profile and two for Open and Close Highlighter.
So for any chart timeframe, ltf candles can be 16th part of htf candle. So 4 hours chart can show as low as 15 minutes of ltf data. I didn't provide the open settings for changing the lower timeframe, as it would give errors in a lot of ways. You can change the timeframe for each chart time from the settings provided.
Limitations:
Like I mentioned earlier, this indicator is a workaround to display ltf candles inside a label. This indicator does not work well on smaller screens. So if you are not able to see the label, zoom out on your browser a bit. Move the indicator to either top or bottom of all indicators and shrink it's space because all details are inside the label.
█ How I use MAGNIFYING GLASS:
This indicator provides you an edge, on top of your existing trading strategy. How you use Magnifying Glass is entirely dependent on your strategy.
I use this indicator to get a broad picture, before getting into a trade. For example I see a Doji or Engulfing or any other famous candlestick pattern on important levels, I hover the mouse on Magnifying Glass, to look for the price action the ltf candles have been through, to make that pattern. I also use it with my "Wick Pressure" indicator, to check price action at wick zones. Whenever I see price touching important supply and demand zones, I check last few candles to read chart like a beautiful price action story.
Also volume is pretty important too. This is what makes Magnifying Glass even better than actual lower timeframe candles. The increasing volume along with up/down trend price shows upward/downward momentum. The sudden burst (peak) in the volume suggests volume climax.
Volume profile on the left can be interpreted as the strength/weakness zones inside a candle. The low volume in a price zone suggests weakness and High volume suggests strength. The Highest volume on the left act as POC for that candle.
Before making any trade, I read the structure of last three or four candles to get the complete price action picture.
█ Conclusion
Magnifying Glass is a well crafted indicator that can be used to track lower timeframe price action. This indicator gives you an edge with the Multi Timeframe Analysis, which I believe is the most important aspect of profitable trading.
~ @SiddWolf

Multi-timeframe MomentumThe Multi-timeframe momentum indicator is similar in concept to a velocity indicator like rate-of-change, but visualizes smoothed price changes by applying an EMA and linear regression to price difference at every bar. Momentums from 1 minute to 1 quarter are plotted on a single chart using the request.security function. Standard and Fibonacci timeframes are available as well as the ability to hide high-timeframes to keep the chart clean. Like any oscillator, divergence in the momentums can be used to identify price reversals in conjunction with support and resistance. When linear regression is applied, high and low inflection points are used to identify reversals in a manner similar to MACD.
Much love to DumpCap! The script is presented sans secret sauce.

Multi-timeframe EMAThe Multi-timeframe exponential moving average (EMA) indicator visualizes EMAs from 1 minute to 1 quarter on a single chart using the request.security function. Standard and Fibonacci timeframes are available as well as the ability to hide high-timeframe EMAs to keep the chart clean. Cross-overs and arrangement of the EMAs indicate sentiment.
Much love to DumpCap! The script is presented sans secret sauce.
MTF High LowThis is a Multi-Time Frame High Low Indicator that plots the highest and lowest price levels of the chart timeframe and a user selected higher timeframe.
The length can be optimized by the user from settings (default value is 6 candles) and table position can also be adjusted.
The calculation does not takes into account the last candle price data to form a view using the current close price as described below:
If Close > mid value of High + Low, view is Bullish
If Close < mid value of High + Low, view is Bearish
The above is also calculated for the higher timeframe and view for both timeframe is updated in the chart.
The color coding is dynamic based upon the current close price levels and comparisons with High, Low and Mid values.
The mid values level plot is hidden by default and can be enabled and saved as default if the user likes so.

[BM] HTF Candle Evolution█ OVERVIEW
This script shows how a higher timeframe candle evolves over time.
It was created as a visual aid to #TheStrat and provides a new way of looking at Timeframe Continuity.
█ FEATURES
General
HTF: Higher Timeframe selection with dropdown and ability to manually input a timeframe that is not present in the dropdown.
Label: Show a label with the selected higher timeframe.
Marker: Shows a marker symbol at the start of each new higher timeframe.
Align: Aligns the candles around a selected center line.
The Strat
Multi-timeframe analysis is used extensively in #TheStrat (created by Rob Smith), so the ability to add #TheStrat coloring has been made available.
Scenario: Define the colors for the strat scenario's.
Coloring of: Choose which part of the candles you want the selected strat scenario colors to be applied to.
Band: Display a band that shows the active strat scenario color of the selected higher timeframe.
All features are completely customizable.

2TimeFrame Candles by EsIstTurnt//Not my original idea, Ive pretty much just doubled the code to have 2 Candles .All Credit goes to the creator of "Multi-Time Period Charts" as I have it saved in my library. I cant find it anymore and searching the script doesn't appear it seems so if its you let me know (and ill credit you). Why did I opt to plot 2 candles you say? 2*candles=(info)*2. 3 if we count the regular plot. Anything more than that and its too busy/blurring to really visualize trends but this was a bit of a game changer no more switching timeframes back and forth .

Stacked EMAsStacked Daily & Weekly EMAs + Labels
Pretty much self-explanatory indicator that shows the current momentum based on the key exponential moving averages.
Three stages of the EMAs:
1. Stacked Positively (Bullish) - EMAs are stacked on top of each other which represents a healthy bullish uptrend (green Label).
2. Stacked Negatively (Bearish) - EMAs are stacked below each other meaning the trend is bearish (red label).
3. Stacked Neutral (Neutral) - EMAs are crossing each other without any clear direction = chop (yellow label).
Hope it helps.

Liquidity Heatmap LTF [LuxAlgo]This indicator displays column heatmaps highlighting candle bodies with the highest associated volume from a lower user selected timeframe.
Settings
LTF Timeframe: Lower timeframe used to retrieve the closing/opening price and volume data. Must be lower than the current chart timeframe.
Other settings control the style of the displayed graphical elements.
Usage
It can be of interest to show which candles from a lower timeframe had the highest associated volume, this allows for the highlighting of areas where a candle body was the most traded by market participants.
The area with the highest activity is highlighted in the script with a yellow color (or another user selected color) and additionally by two lines forming an interval.
When the candle body with the highest volume is overlapped by a candle body with lower volume this one will be highlighted instead, hence why certain areas of high activity might not be highlighted by the heatmap.
It is recommended to hide regular candles or use a more discrete graphical presentation of prices when using this tool. Lines are also displayed to highlight the full candle range as well as if a candle was bullish (in green) or bearish (in red). These lines can be hidden if the user is only interested in the heatmap.

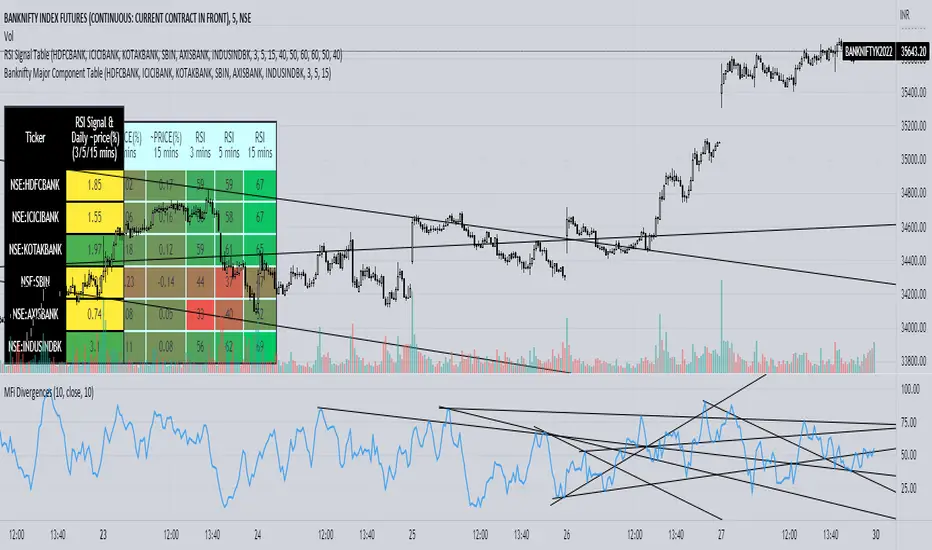
Banknifty Major Component TableThe table presented here is comprised of major Banknifty Index constituents showing price change in percentage terms and RSI value of three different timeframes to gauge overall Banknifty sentiment. This table is primarily created to cater scalpers and day traders. It helps traders to see market activity at a glance.
[CP]Pivot Boss Multi Timeframe CPR Inception with MACD and EMAINTRODUCTION:
This indicator combines multi-timeframe CPR bands with MACD Momentum and EMA trend, all projected on the candlestick chart through a novel visualization.
If you have seen my other indicators on TradingView, you would know that I use floor pivots a lot and “Secrets of a Pivot Boss” is my favorite book. While using floor pivots, time and again I have noticed an interesting price behavior,
Trending moves in price typically start from around the Central Pivot Range (CPR). The CPR could be from ANY timeframe. These moves can easily be caught using simple momentum and trend indicators like MACD and EMA crossovers.
Yes, it is that simple. Follow along to understand how to use this indicator.
INDICATOR SETTINGS:
RANGEBOUND MACD AND EMA MARKINGS:
TradingView limits the max number of labels that can be shown on a chart to 500. Therefore, if you go far back enough, you won't see any markings for the MACD or EMA setups. If you are looking to test the efficacy of this indicator in the past, change the start and end dates to your desired timeframe and then select the ‘Mark MACD and EMA Setups in Range?’ option.
MULTI TIMEFRAME CENTRAL PIVOT RANGE:
Here you can select CPRs and their bands from which timeframes are shown on the chart. I will share my favorite settings later in this description.
CPR CONFIGURATION:
Show CPR Labels: CPRs markings can carry labels, so that you don’t confuse between which line is what. Use this setting to toggle them On/Off.
Show Next Time Period Pivots: Check this option if you want to see the CPR of the next time period. This is typically done to figure out the ’Two Day CPR Relationship’ . Read the book, “Secrets of a Pivot Boss”, to understand more.
EMA TREND:
Show EMA on the Chart: EMAs will be plotted on the chart. Standard stuff.
Mark EMA Crossovers on Chart: EMA crossovers will be marked on the chart in diamond shapes. If you are using EMA crossovers, I recommend setting this option to True.
Rest of the EMA settings are fairly obvious.
MACD MOMENTUM:
Projecting MACD parameters directly on the candlesticks is surely going to give you a new perspective about price action and MACD.
Also, in order to better understand the MACD projections on the chart, you can add a standard MACD indicator on the chart with default settings to figure out what my indicator is actually showing you.
Marking MACD Crossovers on Chart: Marks the MACD signal crossovers on the chart. This visualization was a game changer for me.
Show MACD Histogram on Chart: Projects the complete MACD Histogram in a novel fashion (Try it!). You will be able to visually see the ebbs and flow of momentum in the charts.
Mark MACD Histogram Peaks on Chart: Marks only the MACD peaks instead of the complete histogram. Peaks are a great way to enter an ongoing trend and to play an intraday rangebound market.
Rest of the settings are just the standard settings that you will find in a typical MACD indicator.
ALERTS:
Not shown in the settings panel, but I have added alerts for EMA and MACD Crossovers so that you don’t have to sit in front of the charts or constantly check the price all day long.
If you don’t know how to set alerts in TradingView, then please Google it.
INDICATOR USAGE EXAMPLES:
This indicator can be used in intraday as well as in higher timeframes.
There are quite a few variations possible, I personally prefer to use the EMA crossovers in intraday (5m) and MACD on Daily timeframes.
This is just a matter of personal preference, some people might prefer using EMAs only or MACD only in all timeframes.
Here are my personal settings for the intraday 5-minute timeframe:
Turn on all the CPR pivots starting from Yearly all the way to Daily. You can turn on 6 hourly and 4 hourly as well if you want.
Hourly CPR is mostly used when the price is in a strong trend and you missed the entry and don’t know when to enter. Price will typically experience pullbacks towards the Hourly CPR, before resuming in the direction of the trend. That is your chance to hop onto the bandwagon.
For Intraday, I keep the Bands off. Just a personal preference here.
You can turn ON the Show CPR Labels , if you want.
Turn ON both the options in the EMA TREND section. You would want to see the EMA crossovers marked on the chart as well as the EMAs themselves, as the distance between the two EMAs will give you an idea about the strength of the trend.
Keep rest of the settings in the EMA section as default (you can change the colors if you wish). I keep the same EMAs as the ones kept in the MACD indicator. I like to keep things simple.
In the MACD MOMENTUM section, turn ON Mark MACD Histogram Peaks on Chart and all the other options turned OFF. Leave the other settings as default. By the way, these are the default settings of the standard MACD Indicator.
You can set up EMA Bullcross and Bearcross alarms if you like.
Before checking out the examples, remember one super simple rule:
SOME OF THE BEST TRENDING MOVES IN THE MARKET, BE IT INTRADAY OR OTHERWISE, ORIGINATE IN THE VICINITY OF A LARGER TIMEFRAME PIVOT/CPR.
Look for price settling above/below a pivot, and then a move away from the pivot in any direction is typically a trending move.
You can use hourly pivots or MACD Histogram peaks marked on the chart to enter an existing trend, or add to your positions.
Let’s have a look at a few recent intraday examples from the Crypto, Indian, and US equity markets.
I have added my comments in the charts to make you easily understand what is going on.
Understand that both, moving average crossover and MACD, will give out a lot of signals (chop) every day. But almost 70% of them are going to be fake signals. It is the signals that you get when the price is near a Pivot, that tend to convert into gorgeous trending moves that last.
BTC 5m Charts
NIFTY Futures 5m Charts (good intraday trends are hard to find here, as the market is very efficient)
TSLA 5m Charts
Some important points for using this indicator in higher timeframes:
For higher timeframes, my personal preference is to go with the MACD indicator. I personally find MACD to be lethal on daily and weekly timeframes, if you know how to use it well.
The default settings of the indicator are the settings I use for both, Daily and Weekly, timeframes. Additionally, I turn off the CPR labels.
In theory large trending moves still have a big probability to start near an important pivot level, however, in larger timeframes, trending moves can start from anywhere. They need not start in the vicinity of any important pivot (but they often do!).
Weekly pivots can act as great pullback levels when the price is in strong momentum, when trading on the daily timeframe.
Quarterly Pivots act as great pullback levels when the price is in strong momentum, when trading on the weekly timeframe.
BTC Weekly Chart
BTC Daily Chart
Nifty Weekly Chart
Nifty Daily Chart
NASDAQ Weekly Chart
NASDAQ Daily Chart
FINAL WORDS:
Please understand that I have Cherry Picked the examples to showcase the capability of the indicator and its usage.
DO NOT conflate the accuracy of examples with the accuracy of this indicator.
Biggest catch is the fact that this indicator, like every other indicator out there, will have whipsaws. Some I have also marked in the example charts.
You need to come up with your own technique to avoid whipsaws, one technique I have shared here…… big moves typically start near pivots.
Work on avoiding whipsaws and finding you own edge in the markets.
If you really want to learn how to use Pivots, read the book ’Secrets of a Pivot Boss’ . This book can change your life.

Multi Timeframe EMA by DigitaldYou can use this indicator to show the Daily-EMAs beside the EMAs of the current timeframe.
Everything can be adjusted
Cheers
Ichimoku Buy/Sell Signals of manual MTF Tenkan crossing KijunIchimoku Buy/Sell Signals based on fast, small time frame Tenkans crossing longer timeframes Kijuns - Manual MTF Analysis
This code marks the potential change of direction based on the input of one timeframe's Ichimoku Tenkan (conversion) line crossing over a higher, longer timeframe's Ichimoku Kijun (base) line.
Feel free to change the inputs if need be and to hide the yellow box. Use Ichimoku rules of Tenkan, Kijun, Lagging Span, and Cloud for Take profit/Stop Losses. It is best to wait 3-5 minutes after the signal to enter to confirm the trend and to confirm if the Lagging Span has broken key levels. I refer to the book Trading with Ichimoku - A Practical Guide to Low-Risk Ichimoku Strategies by Karen Peloille as the Ichimoku rulebook. Good luck.
For day trading/scalping/intraday - 1min/3min/5min
Tenkan Line Timeframe = 1min
Kijun Line Timeframe = 5min
For swing trading - multiple days/weeks - 4HR/Daily/Weekly Charts
Tenkan Line Timeframe = day
Kijun Line Timeframe = week

MTF Pivots Zones [tanayroy]Dear Fellow Traders,
I only publish scripts that I use and found good for my trading. Pivots are my favorite indicator. I use daily, weekly, monthly, quarterly, and yearly pivots levels. multiple pivot zones are very strong levels and I like to watch these levels for possible price action.
But when I include all pivots levels at a time, my charts get too clumsy. To see price action properly, you need a clean chart. And when we trade we want to see only important levels within the price horizon.
To resolve this, I created this script, which shows important levels within my display option. I control the display option with 14 periods ATR and a multiplier to adjust the display levels.
The following chart displays levels within 14 ATR * 0.5 multipliers. As the price progress, it will automatically add levels and delete levels that do not come within this option.
What levels are included?
I have used traditional pivot calculation and included Daily, Weekly, Monthly, Quarterly, and Yearly pivots with high and low.
What options are available?
You can replace the yearly timeframe with your desired time frame and can adjust the ATR multiplier to increase or decrease display levels.
Use this in 5m, 15m, or 1H chart or any timeframe below Daily.
Please like, share, and comment.

Multi-Timeframe Squeeze Pro/DIM/Momentum/MAIMPORTANT NOTE:
-> The table will not display any timeframes lower than the current one
-> This indicator combine multiple popular indicators and give ability to use them on Multiple timeframes (MFT)
-> Indicators used for the MFT are: Squeeze / Momentum / 10X DIM and Stacked MA (or EMA)
-> Give at glance a good way to see the trend all different timeframes
-> If you are using in combination with squeeze pro please use the one from @Beardy_Fred since it matches the colours and condition used
Credits :
-> J. Welles Wilder creating the Directional Movement System (DMS) (1978); and
-> John Carter applying the DMS to create the popular Simpler Trading 10X Bars indicator.
-> @Beardy_Fred creating a first version including MOM and SQZ
-> Makit0's evolution of Lazybear's script to factor in the TTM Squeeze Pro upgrades - Squeeze PRO Arrows
I have adapted the version from @Beardy_Fred to provide a more complete and customisable indicator while including also the Stacked EMA/MA for further validation
Explanation:
You can learn more about each indicators following those links:
Squeeze Pro:
10X:
Momentum Histogram:
The stacked EMA/MA highlights when the MA/EMA are in order:
Red when they are stacked from the highest to the lowest
Green when they are stacked from the lowest to the highest
Yellow when they are stacked without a clear order
Customisation:
You can customise:
Timeframes
Settings for each indicators (10X/MA/Momentum/Squeeze)
Colors
Visibility
Trade Signals:
If you are going Long, Since this is a combination ideally on the timeframe you are trading you should have all green + green on the above timeframes (those colors are the default ones but can be changed)
-> Green on 10X indicator meaning you are in an uptrend
-> EMA or MA (depending on the configuration of the indicator) Green meaning EMA or MA
-> Squeeze should be Orange or Red ideally (indicating an high or medium Squeeze)
-> Momentum should be Cyan indicating an increase in momentum (while Dark Blue could indicate a reversal)
Standalone indicators:
- Squeeze Pro
- 10X Bar
- Stacked MA
- Momentum

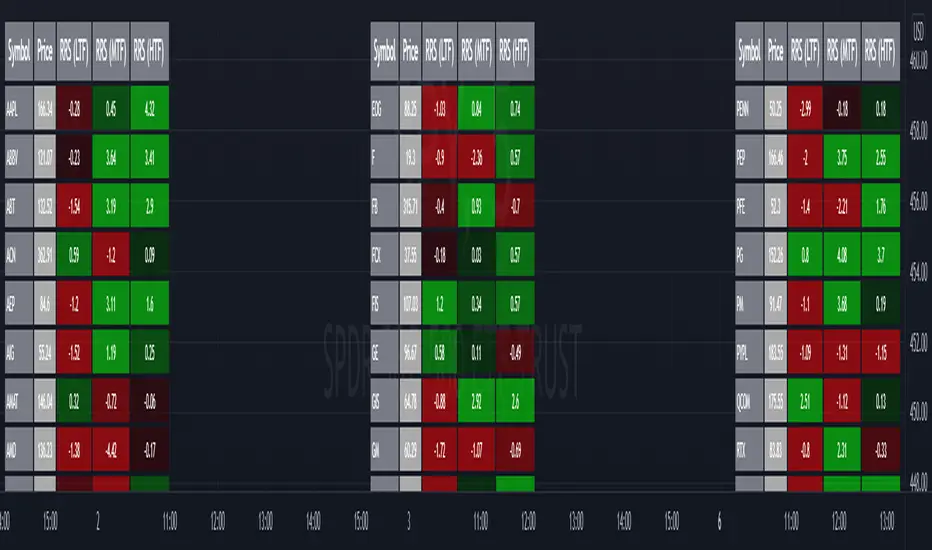
Relative Strength Screener V2 - Top 100 volume leadersNew and improved strength heatmap for the top 100 volume leaders in the S&P. Coded in a workaround to the 40 request.security limitation that currently exists in Pine. Added the ability to input the number of columns (time frames) you wish to display.
For 3 time frame analysis, add the indicator to your chart 3 times. Change the number of columns to 3 for each of these indicators. Specify the column and time frame for each one (example, 5 minute for column 1, 1 hour for column 2 and Daily chart for column 3). It will automatically resize the columns/tables to properly display the output. This provides a sort of "Strength Heatmap" for the top 100 stocks in the S&P. To achieve this, make a copy of the indicator and substitute lines 68-105 with the following premade watchlists :
Make a copy 1 - FIrst 38 volume leaders in the S&P
s01 = input.symbol('AAPL', group = 'Symbols', inline = 's01')
s02 = input.symbol('ABBV', group = 'Symbols', inline = 's02')
s03 = input.symbol('ABT', group = 'Symbols', inline = 's03')
s04 = input.symbol('ACN', group = 'Symbols', inline = 's04')
s05 = input.symbol('AEP', group = 'Symbols', inline = 's05')
s06 = input.symbol('AIG', group = 'Symbols', inline = 's06')
s07 = input.symbol('AMAT', group = 'Symbols', inline = 's07')
s08 = input.symbol('AMD', group = 'Symbols', inline = 's08')
s09 = input.symbol('APA', group = 'Symbols', inline = 's09')
s10 = input.symbol('ATVI', group = 'Symbols', inline = 's10')
s11 = input.symbol('AXP', group = 'Symbols', inline = 's11')
s12 = input.symbol('BA', group = 'Symbols', inline = 's12')
s13 = input.symbol('BBWI', group = 'Symbols', inline = 's13')
s14 = input.symbol('BBY', group = 'Symbols', inline = 's14')
s15 = input.symbol('BK', group = 'Symbols', inline = 's15')
s16 = input.symbol('BMY', group = 'Symbols', inline = 's16')
s17 = input.symbol('BRK.B', group = 'Symbols', inline = 's17')
s18 = input.symbol('C', group = 'Symbols', inline = 's18')
s19 = input.symbol('CAT', group = 'Symbols', inline = 's19')
s20 = input.symbol('CCL', group = 'Symbols', inline = 's20')
s21 = input.symbol('CFG', group = 'Symbols', inline = 's21')
s22 = input.symbol('CL', group = 'Symbols', inline = 's22')
s23 = input.symbol('CNC', group = 'Symbols', inline = 's23')
s24 = input.symbol('COF', group = 'Symbols', inline = 's24')
s25 = input.symbol('COP', group = 'Symbols', inline = 's25')
s26 = input.symbol('COST', group = 'Symbols', inline = 's26')
s27 = input.symbol('CRM', group = 'Symbols', inline = 's27')
s28 = input.symbol('CVS', group = 'Symbols', inline = 's28')
s29 = input.symbol('CVX', group = 'Symbols', inline = 's29')
s30 = input.symbol('DAL', group = 'Symbols', inline = 's30')
s31 = input.symbol('DIS', group = 'Symbols', inline = 's31')
s32 = input.symbol('DISCA', group = 'Symbols', inline = 's32')
s33 = input.symbol('DISCK', group = 'Symbols', inline = 's33')
s34 = input.symbol('DISH', group = 'Symbols', inline = 's34')
s35 = input.symbol('DLTR', group = 'Symbols', inline = 's35')
s36 = input.symbol('DOW', group = 'Symbols', inline = 's36')
s37 = input.symbol('DVN', group = 'Symbols', inline = 's37')
s38 = input.symbol('EBAY', group = 'Symbols', inline = 's38')
Make a copy 2 - Tickers 39 to 76
s01 = input.symbol('EOG', group = 'Symbols', inline = 's01')
s02 = input.symbol('F', group = 'Symbols', inline = 's02')
s03 = input.symbol('FB', group = 'Symbols', inline = 's03')
s04 = input.symbol('FCX', group = 'Symbols', inline = 's04')
s05 = input.symbol('FIS', group = 'Symbols', inline = 's05')
s06 = input.symbol('GE', group = 'Symbols', inline = 's06')
s07 = input.symbol('GIS', group = 'Symbols', inline = 's07')
s08 = input.symbol('GM', group = 'Symbols', inline = 's08')
s09 = input.symbol('GS', group = 'Symbols', inline = 's09')
s10 = input.symbol('HD', group = 'Symbols', inline = 's10')
s11 = input.symbol('IBM', group = 'Symbols', inline = 's11')
s12 = input.symbol('INTC', group = 'Symbols', inline = 's12')
s13 = input.symbol('JNJ', group = 'Symbols', inline = 's13')
s14 = input.symbol('JPM', group = 'Symbols', inline = 's14')
s15 = input.symbol('KR', group = 'Symbols', inline = 's15')
s16 = input.symbol('LUV', group = 'Symbols', inline = 's16')
s17 = input.symbol('LVS', group = 'Symbols', inline = 's17')
s18 = input.symbol('MA', group = 'Symbols', inline = 's18')
s19 = input.symbol('MCD', group = 'Symbols', inline = 's19')
s20 = input.symbol('MCHP', group = 'Symbols', inline = 's20')
s21 = input.symbol('MDT', group = 'Symbols', inline = 's21')
s22 = input.symbol('MET', group = 'Symbols', inline = 's22')
s23 = input.symbol('MGM', group = 'Symbols', inline = 's23')
s24 = input.symbol('MOS', group = 'Symbols', inline = 's24')
s25 = input.symbol('MPC', group = 'Symbols', inline = 's25')
s26 = input.symbol('MRK', group = 'Symbols', inline = 's26')
s27 = input.symbol('MRNA', group = 'Symbols', inline = 's27')
s28 = input.symbol('MS', group = 'Symbols', inline = 's28')
s29 = input.symbol('MSFT', group = 'Symbols', inline = 's29')
s30 = input.symbol('MU', group = 'Symbols', inline = 's30')
s31 = input.symbol('NCLH', group = 'Symbols', inline = 's31')
s32 = input.symbol('NEE', group = 'Symbols', inline = 's32')
s33 = input.symbol('NEM', group = 'Symbols', inline = 's33')
s34 = input.symbol('NFLX', group = 'Symbols', inline = 's34')
s35 = input.symbol('NKE', group = 'Symbols', inline = 's35')
s36 = input.symbol('NVDA', group = 'Symbols', inline = 's36')
s37 = input.symbol('ORCL', group = 'Symbols', inline = 's37')
s38 = input.symbol('OXY', group = 'Symbols', inline = 's38')
Make a copy 3 - tickers 77 to 114
s01 = input.symbol('PENN', group = 'Symbols', inline = 's01')
s02 = input.symbol('PEP', group = 'Symbols', inline = 's02')
s03 = input.symbol('PFE', group = 'Symbols', inline = 's03')
s04 = input.symbol('PG', group = 'Symbols', inline = 's04')
s05 = input.symbol('PM', group = 'Symbols', inline = 's05')
s06 = input.symbol('PYPL', group = 'Symbols', inline = 's06')
s07 = input.symbol('QCOM', group = 'Symbols', inline = 's07')
s08 = input.symbol('RTX', group = 'Symbols', inline = 's08')
s09 = input.symbol('SBUX', group = 'Symbols', inline = 's09')
s10 = input.symbol('SCHW', group = 'Symbols', inline = 's10')
s11 = input.symbol('SLB', group = 'Symbols', inline = 's11')
s12 = input.symbol('SYF', group = 'Symbols', inline = 's12')
s13 = input.symbol('T', group = 'Symbols', inline = 's13')
s14 = input.symbol('TFC', group = 'Symbols', inline = 's14')
s15 = input.symbol('TGT', group = 'Symbols', inline = 's15')
s16 = input.symbol('TJX', group = 'Symbols', inline = 's16')
s17 = input.symbol('TMUS', group = 'Symbols', inline = 's17')
s18 = input.symbol('TSLA', group = 'Symbols', inline = 's18')
s19 = input.symbol('TWTR', group = 'Symbols', inline = 's19')
s20 = input.symbol('TXN', group = 'Symbols', inline = 's20')
s21 = input.symbol('UAL', group = 'Symbols', inline = 's21')
s22 = input.symbol('UNH', group = 'Symbols', inline = 's22')
s23 = input.symbol('V', group = 'Symbols', inline = 's23')
s24 = input.symbol('VIAC', group = 'Symbols', inline = 's24')
s25 = input.symbol('WBA', group = 'Symbols', inline = 's25')
s26 = input.symbol('WFC', group = 'Symbols', inline = 's26')
s27 = input.symbol('WMT', group = 'Symbols', inline = 's27')
s28 = input.symbol('WYNN', group = 'Symbols', inline = 's28')
s29 = input.symbol('XOM', group = 'Symbols', inline = 's29')
s30 = input.symbol('SPY', group = 'Symbols', inline = 's30')
s31 = input.symbol('SPY', group = 'Symbols', inline = 's31')
s32 = input.symbol('SPY', group = 'Symbols', inline = 's32')
s33 = input.symbol('SPY', group = 'Symbols', inline = 's33')
s34 = input.symbol('SPY', group = 'Symbols', inline = 's34')
s35 = input.symbol('SPY', group = 'Symbols', inline = 's35')
s36 = input.symbol('SPY', group = 'Symbols', inline = 's36')
s37 = input.symbol('SPY', group = 'Symbols', inline = 's37')
s38 = input.symbol('SPY', group = 'Symbols', inline = 's38')
Multi-Timeframe 10XIMPORTANT NOTE:
-> The timeframe for this indicator must be set at 1 minute;
-> If the chart timeframe is higher than 1 minute, the results shown in the table for timeframes lower than the chart will not be correct;
-> Tradingview's own documentation explains this as follows: " It is not recommended to request data of a timeframe lower that the current chart timeframe, for example 1 minute data from a 5 minutes chart. The main problem with such a case is that some part of a 1 minute data will be inevitably lost, as it’s impossible to display it on a 5 minutes chart and not to break the time axis. In such cases the behavior of security can be rather unexpected "; and
-> It is therefore recommended that this indicator is placed in a standalone 1min chart window, and the window resized to only show the table to avoid any issues.
Credits:
-> J. Welles Wilder creating the Directional Movement System (DMS) (1978); and
-> John Carter applying the DMS to create the popular Simpler Trading 10X Bars indicator.
Introduction:
Quickly see the quality and strength of a trend based on Directional Movement Index (DMI).
The Average Directional Index (ADX), Minus Directional Indicator (-DI) and Plus Directional Indicator (+DI) represent a group of directional movement indicators that form a trading system developed by Welles Wilder. Although Wilder designed his Directional Movement System with commodities and daily prices in mind, these indicators can also be applied to stocks. Wilder determined directional movement by comparing the difference between two consecutive lows with the difference between their respective highs.
+DI and -DI are derived from smoothed averages of these differences and measure trend direction over time. These two indicators are often collectively referred to as the DMI. ADX is in turn derived from the smoothed averages of the difference between +DI and -DI; it measures the strength of the trend (regardless of direction) over time.
Trade Signals:
-> Green indicates an uptrend i.e. when +DI is above -DI and ADX is greater than 20 - there is more upward pressure than downward pressure in the price;
-> Red indicates a downtrend i.e. when -DI is above +DI and ADX is greater than 20 - there is more downward pressure on the price; and
-> Yellow indicates no strong directional trend and potential for a reversal.
Standalone Indicator:
The 10X Bars version of the indicator can be found here:
