PIVOT BACKGROUND AND TABLE BY PRANOJIT DEYThis shows pivot trend in relation with the day open line. it makes the day bias easily understandable.Chỉ báo Pine Script®của mukherjee_debasri8
Ichimoku Green BG by Pranojit DeyThis indicator shows ichimoku bulliush trend background so that the option buyers can understand bullish trend easily.Chỉ báo Pine Script®của mukherjee_debasri5
Nifty 3m Multi-Filter System (Non-Repainting Trend Signals)Nifty Intraday swing trading in Index options can be used for 3m/5m/15m timeframes for small profits.Chỉ báo Pine Script®của Sheetalss27
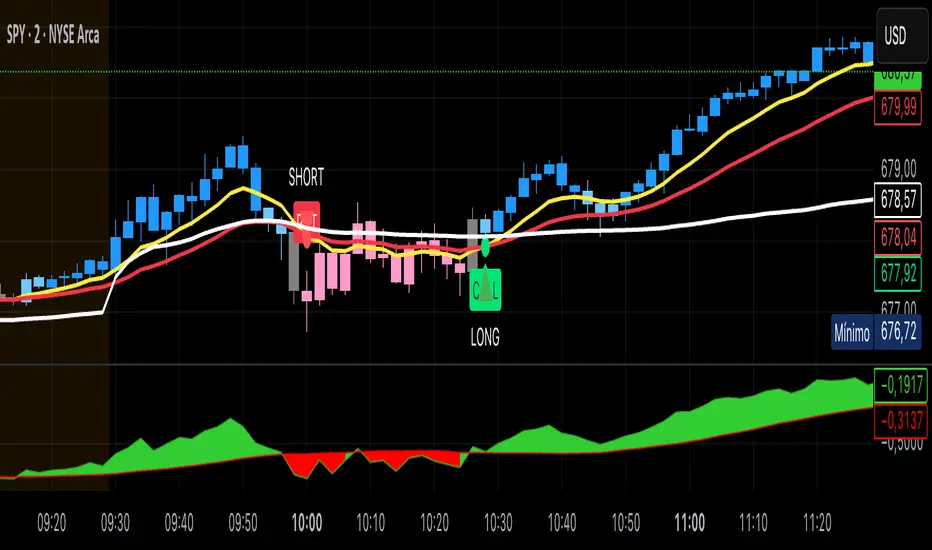
Kai GoNoGo 2mKai GoNoGo 2m is a multi-factor trend confirmation system designed for fast intraday trading on the 2-minute chart. It combines EMAs, MACD, RSI and ADX through a weighted scoring model to generate clear Go / NoGo conditions for both CALL (long) and PUT (short) setups. The indicator paints the candles with pure colors to show the current strength of the trend: Strong Go (Bright Blue): Full bullish alignment across EMAs, momentum and trend strength. Weak Go (Light Blue): Bullish structure but with softer momentum. Weak NoGo (Light Pink): Bearish structure starting to develop. Strong NoGo (Bright Pink): Full bearish alignment across all components. Neutral (Gray): No trend, compression or transition phase. Components included: EMA Trend Structure (9/21/50/100/200) MACD Momentum (12-26-9) RSI Confirmation (14) ADX Trend Strength Filter via DMI (14,14) Scoring system inspired by the original GoNoGo concept, improved for speed-based trading. Designed for: Scalping, 0DTE options, FAST trend continuation entries, and momentum confirmation on QQQ, SPY, NQ, ES and high-beta names. This version uses pure colors (no gradients) for maximum clarity when trading fast charts.Chỉ báo Pine Script®của dgr_abogado1180
MarketMafia Internals Overlay (0.5 steps, pure overlay)This indicator is designed to give you the over all heartbeat of the market for SPY,QQQ and IWM. Designed to give more confirmation on the internals of the markets direction to help keep you on the right side of the market Chỉ báo Pine Script®của bonnevalfoodsCập nhật 6
CE-PE Options Price Tracker - Call, Put, PCR, Calendar SpreadThis advanced TradingView indicator provides a real-time, side-by-side visualization of both Call and Put option price action for Indian derivatives—including Nifty , BankNifty , Sensex , and major commodities. Designed for active option traders, it simplifies scanning for directional bias, volatility, and premium flows at any user-selected strike. Key Features: Dual Option Candle Visualization: Instantly visualize both Call and Put prices as candlesticks for any selected strike—compare price action, structure, and momentum with clarity. Premium Differential Tracking (C-P Diff): Analyze market skew and sentiment with live premium difference between Call and Put options. Put-Call Ratio (PCR) Widget: Real-time PCR analysis and signal (Bullish/Bearish/Neutral) with custom threshold levels, helping you track sentiment shifts and trading triggers. Calendar Spread Analysis: Easily spot arbitrage and hedging opportunities between near and next expiry dates for both Call and Put—coloured expansion/contraction signals keep you focused on volatility premium flows. Volatility Panel: Live volatility calculation on both calls and puts, along with Buy/Sell signals to alert you of trend or momentum shifts based purely on option volatility. User-Friendly Controls: Pick underlying, strike, expiry (including next expiry) and custom colour themes in seconds. Visual Alerts: Candle and shape signals for key option price trend events and PCR reversals. How to Use: Apply this indicator to any Indian index or commodity options chart on TradingView. Select the underlying, expiry, and strike to monitor. All signals and premium data update in real time—supporting scalping, swing, or statistical strategies. Best Suited For: Directional option traders Arbitrage and calendar spread specialists PCR sentiment and volatility signal followers Active intraday and expiry scalpers Anyone wanting a fast options dashboard with intuitive dashboard-style visuals Note: This tool is designed for study and analysis only. Options trading involves significant risk. Always combine technical analysis with risk management and consult a financial advisor if needed.Chỉ báo Pine Script®của shivkumar503244Cập nhật 9987
VMS Multi Index Options Buying IndicatorDetailed User Guide This system is a multi-faceted toolkit designed for traders who use options. It synthesizes information from the underlying asset, specific call and put options, and market structure to generate a consolidated view. Core Philosophy: The tool is built on the principle of "Multi-Timeframe, Multi-Indicator Confirmation." It avoids relying on a single signal. Instead, it seeks confluence between momentum, trend, market structure, and volume data across different components (underlying, call, and put) before suggesting a trade. 1. The Legal Agreement & Setup Getting Started: The first thing you will see is a mandatory disclaimer. You must type "agree" into the input field to activate the indicator and acknowledge the associated risks. Defining Your Instruments: The core of the setup is specifying the two options you want to analyze. Call Option Symbol: Input the specific symbol for the call option you are tracking. Put Option Symbol: Input the specific symbol for the put option you are tracking (typically, these would be similar strike prices and expiry). 2. Understanding the Primary Signal The main trading signal is derived from a multi-index analysis applied separately to your chosen call and put options. The Histogram (Momentum Gauge): You will see two histograms (bar charts) on the main panel. The top section (above the zero line) represents the Call Option's momentum. The bottom section (below the zero line) represents the Put Option's momentum. Interpretation: Green Bars (Call) / Red Bars (Put): Indicate a "BUY" signal for that respective option. Yellow Bars (Call) / Orange Bars (Put): Indicate a "WEAK" or cautionary signal. Gray Bars: Indicate "NO TRADE" conditions. The height and position of the bars show the strength and direction of the momentum oscillator. The Signal Dashboard (Your Command Center): A table provides a numerical breakdown of the signal strength. This is where you get the "why" behind the colors. Overall Signal: The final verdict ("BUY CALL", "WEAK PUT", "NO TRADE"). Strength (/7): A score out of 7 for each option. A score of 4 or higher is considered a strong signal. A score of 3 is weak. This score is an aggregate of several factors: Momentum Oscillator Value & Direction Momentum above a defined threshold Short-term vs. Long-term trend alignment "Squeeze" state (a volatility contraction indicator) A bonus for fresh momentum crossovers. Key Takeaway: Look for the option with the higher strength score, and only consider trades when the score is 3 or above, with a preference for scores of 4+. 3. Integrating Market Context The indicator overlays several other analytical tools to provide context for the primary signal. Confluence with these tools increases the probability of a successful trade. Support & Resistance (S/R) Lines: Multiple colored horizontal lines are drawn on the chart, representing key support and resistance levels derived from monthly, weekly, and daily data. How to Use: Observe the price action relative to these levels. A "BUY CALL" signal that occurs near a major support line (e.g., L0, L1, L2) is significantly more powerful. Conversely, a "BUY PUT" signal near a major resistance line (e.g., L8, L9, L10) carries more weight. Trend Filter (Intraday Level): A thick line that acts as a dynamic trend filter. How to Use: This is a simple but effective filter. If price is above this line, it suggests a bullish intraday bias. Favor "BUY CALL" signals. If price is below this line, it suggests a bearish intraday bias. Favor "BUY PUT" signals. Ignore or be very cautious with signals that go against the Trend Filter. Volume Analysis Dashboard: A separate table provides a deep dive into volume data for both the underlying asset and your specified options. How to Use: This confirms whether money flow agrees with your technical signal. A "BUY CALL" signal is reinforced if the underlying and the call option are seeing higher buy volume % and more bullish candles. A "BUY PUT" signal is reinforced if the underlying and the put option are seeing higher buy volume % and more bullish candles. Call-Put Spread Analysis: This measures the difference in price between your call and put options. How to Use: A rising or positive spread suggests market sentiment is becoming more bullish (calls are gaining value faster than puts). A falling or negative spread suggests market sentiment is becoming more bearish (puts are gaining value faster than calls). Use this to confirm the bias of your primary signal. 4. Entry Execution & Risk Management Entry Timing: The ideal entry occurs when the primary signal triggers ("BUY CALL/PUT") and you have confluence from at least 2 of the 3 contextual factors: Price is respecting a key S/R level. The Trend Filter aligns with the signal direction. Volume and Spread data confirm the momentum. Built-in Alerts: You can set alerts for the "Buy Call" and "Buy Put" conditions so you are notified when a strong signal triggers. Risk Management: This is paramount. The indicator does not provide stop-loss or take-profit levels. You must employ your own risk management strategy, such as: Placing a stop-loss below the recent swing low (for calls) or above the recent swing high (for puts). Using a fixed percentage or rupee-based risk per trade. Quick-Reference Cheat Sheet Step Component What to Look For Action 1 Primary Signal Histogram color & "Overall Signal" in dashboard. Green/Red: Strong signal. Yellow/Orange: Weak signal. Gray: No trade. 2 Signal Strength "Strength (/7)" score in dashboard. ≥4: Strong. =3: Weak/Cautious. <3: Ignore. 3 Market Structure Price relative to S/R lines & Trend Filter. Bullish Confluence: Signal + Price near support + Above Trend Filter. Bearish Confluence: Signal + Price near resistance + Below Trend Filter. 4 Volume Confirmation Volume Dashboard. Underlying and option should show higher Buy Volume % and more Bullish Candles in the direction of your trade. 5 Sentiment Check Call-Put Spread. Rising/Positive Spread: Confirms bullish bias. Falling/Negative Spread: Confirms bearish bias. 6 Final Decision Composite of all factors. High-Probability Trade: Strong primary signal (Step 1 & 2) with confluence from Steps 3, 4, and/or 5. 7 Execute & Manage Your Trading Plan. Enter trade. Always use a stop-loss. Take profits based on your predefined plan. The Illusion of the "Perfect Indicator" The human mind, especially when faced with the complexity and stress of financial markets, seeks certainty. It wants a system that says, "Buy here, sell there, and you will win." This desire creates a dangerous vulnerability: the belief that a tool can replace judgment. The final note, "This system is designed to inform your decisions, not to make them for you," is a direct antidote to this illusion. Here’s a breakdown of what that truly means: 1. The Tool is a Compass, Not an Autopilot Think of this indicator as a high-tech compass on a ship. It can tell you: The direction of the wind (momentum). The depth of the water (support/resistance). The set of the currents (trend). The activity in other nearby vessels (volume). But it cannot: Steer the ship for you. Decide when to reef the sails in a sudden storm (volatility spike). Choose the final destination (your financial goals). Abandon ship if it starts to sink (your risk management). You are the captain. The tool provides superb data, but you must synthesize it with experience, intuition, and an overarching strategy. Blindly following any signal, no matter how strong, is like setting your autopilot in a crowded shipping lane and going to sleep. 2. The Gap Between Signal and Execution A "BUY CALL" signal is a moment in time. Your execution is another. The market is a dynamic, living entity. What was true at the close of the candle when the signal generated may not be true 30 seconds later when your order is placed. Slippage: The price you get vs. the price you see. Gaps: The market can open beyond your risk parameters. Latency: The signal is historical; you are trading in the present. Your skill lies in navigating this gap. The indicator highlights a potential opportunity, but your discipline in order placement, patience for the right entry, and ability to abort a setup that "looks wrong" in real-time are what separate professionals from amateurs. 3. The Context is King (And the Indicator Can't See Everything) No indicator has access to the full context of the market. Macro-Events: Is there a central bank announcement in 30 minutes? The indicator doesn't know. You should. Earnings: Did a major sector company just report disastrous earnings, changing the sentiment for the entire index? Global Cues: Are international markets crashing? A signal might be technically perfect but fundamentally suicidal given the broader context. You are the one who must bring this macro-awareness to the table. The tool provides a micro-view; you provide the macro-view. 4. The Psychology of the Trader is the Ultimate System This is the most important element. You can have the best tool in the world, but if your mind is not trained, you will lose. Confirmation Bias: The tool gives a "WEAK PUT" signal, but you are already bearish. You interpret it as a "STRONG PUT" and over-leverage. Hope & Fear: A trade goes against you. The indicator might still be holding its signal, but your fear triggers an early exit. Or conversely, a "NO TRADE" signal appears, but your hope for a win makes you enter anyway. Revenge Trading: After a loss, you ignore the "NO TRADE" signal and jump into the next setup to "win your money back." The indicator is a logic-based system. Trading is a psychological endeavor. The tool can suggest what to do, but it cannot give you the discipline to follow through or the wisdom to deviate when necessary. In Essence: Using this powerful system without the final note in mind is like giving a masterfully crafted, precision sniper rifle to someone who has never been taught to breathe steadily, account for wind, or manage their trigger squeeze. The rifle is capable, but the outcome is entirely dependent on the skill and discipline of the person holding it. Therefore, use the tool to: Focus your attention on high-probability setups. Provide a framework for your analysis. Save time on manual calculations. But never abdicate your responsibility to: Apply sound risk management on every single trade. Maintain emotional discipline. Consider the broader market context. Make the final call. The ultimate goal is not to find a system you can follow blindly, but to use tools like this to become a more informed, disciplined, and self-aware trader. The indicator is a part of your edge; you are the source of it.Chỉ báo Pine Script®của madhavbbsCập nhật 5564
ai cruhsera pullback strategy to donchain lower and upperbands.. best for cypro lower timeframe scalping..Chiến lược Pine Script®của rehankhan100880
SLAW TRADING SCALP-XSLAW TRADING SCALP-X – Multi-Filter Scalping Suite SLAW TRADING SCALP-X is an intraday scalping tool designed for fast markets (crypto, FX, indices) on lower timeframes such as 1m–5m charts. It combines multiple classic concepts into a single, rule-based framework and only prints signals when several conditions agree. The script uses: Heikin Ashi structure to smooth noise and detect bullish/bearish candle bias. Dual EMAs (fast & slow) to define the main trend and to filter trades in the direction of that trend. Stochastic and MACD as momentum filters. Both can vote for long/short, contributing to a combined momentum score. Swing / pivot detection (local highs/lows and fractals) to locate potential exhaustion zones and entries near short-term reversals. ATR-based volatility filter that ignores “dead” low-volatility periods and overly explosive candles, adapting automatically across different markets. Candle-quality filter that checks body/wick ratios to avoid extreme wick manipulation and very small bodies. A momentum score is built from Stochastic, MACD and swing conditions. Long or short signals are only allowed when the score reaches a configurable minimum, the trend filter agrees, price is close to the fast EMA, volatility is inside a healthy range, and the candle passes the body/wick quality checks. The script also contains signal-management logic: Maximum number of consecutive signals in the same direction (to avoid endless buying or selling in trends). Minimum bar distance between two signals (to reduce over-trading and clustering). When all filters line up, the indicator plots “L” and “S” labels on the chart and exposes corresponding alertconditions (“LONG” and “SHORT”) so traders can connect it to webhooks or bots. This script is intended as a tool for discretionary traders, not an automatic profit guarantee. It works best when combined with your own risk management, session filters and higher-timeframe analysis. Nothing in this indicator is financial advice; always test on a demo account and adapt the parameters to your market and timeframe.Chỉ báo Pine Script®của numanozmen9993
Today Range Calculator1. Indicator Name Today (Today’s Volatility) 2. One-line Introduction Displays real-time 30-day historical volatility (HV30) as a compact table on the chart, helping traders instantly assess market risk levels. 3. General Overview Today ↑↓ is a lightweight informational widget that calculates and displays the 30-day Historical Volatility (HV30) of the asset in real time. Using logarithmic returns over the past 30 periods, the script computes variance and then annualizes it to express volatility as a percentage (%) per year. The result is shown in a clean 1x1 table cell, which can be positioned anywhere on the chart—top/bottom, left/right—depending on your preference. This makes it easy to quickly evaluate whether the current market is high-risk (volatile) or stable, without cluttering the chart. It’s especially useful for position sizing, risk management, volatility-based entry/exit decisions, and as a filter for breakout strategies. Built with performance in mind, the script uses minimal system resources and can be used alongside any indicator or strategy without interference. 4. Key Advantages 📈 Real-time HV30 Display Calculates and displays 30-day historical volatility using annualized log return variance. 📍 Custom Table Positioning Place the volatility display in any corner of the chart for optimal visibility. 🧮 Accurate Log Return Calculation Uses logarithmic returns to ensure precise volatility representation over time. 🎯 Quick Market Sentiment Read Helps you determine at a glance whether the asset is in a calm or volatile environment. 🧼 Minimalist Design Clean 1-cell table format keeps your chart readable and organized. 🚀 Ultra-Lightweight Script Runs efficiently with negligible impact on chart performance. 📘 Indicator User Guide 📌 Basic Concept Today ↑↓ calculates 30-day Historical Volatility (HV30) by analyzing the asset’s log returns over the past 30 bars. The result is annualized and shown as a percentage to reflect volatility in standardized terms. Useful for gauging risk levels and strategy suitability in current market conditions. ⚙️ Settings Explained Table Position: Choose where the volatility table appears: Top Left / Top Right / Bottom Left / Bottom Right 📈 High Volatility Example HV30 > 50% indicates a volatile environment Suggests wider stop-losses, cautious position sizing, or favoring breakout strategies 📉 Low Volatility Example HV30 < 15% suggests a calm market or range-bound behavior Useful as a signal for upcoming volatility expansions or breakout preparations 🧪 Recommended Use Cases Position Sizing: Scale position size based on HV30 readings Strategy Filter: Activate certain systems only when volatility meets predefined conditions Breakout Timing: Identify low-volatility zones as potential breakout opportunities 🔒 Precautions This indicator does not generate buy/sell signals; it is a volatility reference tool HV thresholds vary across asset classes—adjust interpretation accordingly Since HV30 is historical, it may lag during rapid market changesChỉ báo Pine Script®của c9indicator27
Thi Cloud EMA SystemThis is a spinoff of the Ripster's cloud system. I altered it in order to be more accurate using the 5 min candle instead of the 10Chỉ báo Pine Script®của TheBullandBearLounge10
Multi-Asset Option Strike PricesMulti-Asset Option Strike Prices automatically plots dynamic option strike levels for multiple assets on your chart. The indicator detects the active symbol and draws strike ladders above and below the current price using customizable strike increments (FX, indices, commodities, metals, etc.). It also rounds price to the nearest strike, giving a precise structural reference used by institutional options desks. These strike levels help traders visualize trend direction, trend boundaries, and potential turning points based on how price interacts with known option clusters. By mapping evenly spaced strike steps, the indicator also highlights natural stop-loss and take-profit zones within a trend, allowing traders to manage risk around predictable option-driven price levels. Supports up to 10 assets, includes custom line styling, and provides automatic strike labeling.Chỉ báo Pine Script®của Kevnett6
MarketMafia Internals (TICK / ADD / VOLD)this indicator has been built to give the over all heartbeat of the market. Keeping you from fake outs . Chỉ báo Pine Script®của bonnevalfoods5
LGZ – Liquidity Gravity Zones v1 📌 LGZ – Liquidity Gravity Zones (SVI + Net CVD + Volume) Original Liquidity-Driven Price Magnet Model by Thomas Aaroon 📘 Concept Overview LGZ (Liquidity Gravity Zones) is a new, original liquidity-based price-attraction model built using three core components: SVI (Shock Volume Index) – measures abnormal volume spikes at each strike Net CVD (NCP = CE_CVD − PE_CVD) – the real directional order-flow imbalance Total Volume (CE + PE) – true liquidity density at each strike Using these three elements, the indicator calculates Liquidity Gravity Weight (LGW) for every strike and identifies the strongest zones that attract price during the session. 🧠 Why This Indicator? Traditional OI-based methods (long build-up, short build-up, OI change etc.) often lag. LGZ focuses only on: Real traded volume Actual buy/sell aggression (CVD) Shock events Dealer hedging pressure Strike-level liquidity clusters This makes it far more responsive for intraday traders. ⭐ Core Formula Liquidity Gravity Weight (LGW) LGW = |SVI| × |Net CVD| × Total Volume Where: SVI = Shock Volume Index (Z-score based) Net CVD (NCP) = CE_CVD − PE_CVD Total Volume = CE_volume + PE_volume LGW indicates how strongly a strike is pulling price toward it. 🎯 What the Indicator Shows ✔ Top Liquidity Gravity Zones (LGZ-1, LGZ-2, LGZ-3) These are the strongest price magnets for the day. ✔ Gravity Lines on Chart Each LGZ is plotted as a horizontal magnet line extending to the right. ✔ Strike-Level Liquidity Table Shows: Strike SVI (Shock intensity) LGW (Gravity strength) This table gives a complete picture of the intraday liquidity landscape. 📈 How to Use (Intraday Trading Strategy) 🔵 1. Price gravitates toward LGZ-1 If price is below LGZ-1 → upward pull If price is above LGZ-1 → downward pull 🔵 2. LGZ Flips = Trend Change If LGZ-1 suddenly jumps to a different strike: → strong trend acceleration 🔵 3. LGZ Cluster = Reversal / Consolidation Zone Multiple LGZ levels around the same strike indicate → liquidity saturation → reversal or slowdown. 🔵 4. Combine with Price Action Best clarity on 5-minute timeframe Use 1-minute only for entry. 🔬 Why LGZ Works The indicator models the same reality driving option markets: Where option volume + orderflow (CVD) + shock liquidity concentrate, market makers hedge, and price moves toward that strike. This is the foundation of dealer hedging mechanics and liquidity-based price movement. 🔧 Inputs Symbol prefix (e.g., NIFTY) Expiry (YYMMDD) Center strike & range Number of gravity zones Color customizationChỉ báo Pine Script®của MathThomasCập nhật 71
Binary Options v3.2This strategy is used for backtesting event contract binary options with 180 days of ETH 1-minute data. Win rate 63.3, number of orders 13060, parameters can be adjusted for different market conditionsChỉ báo Pine Script®của zuzl3104Cập nhật 335
Breakout Finder By Hitesh Somani(Aapkainvestments)Breakout Finder By Hitesh Somani(Aapkainvestments) Welcome to one of the most powerful momentum reversal indicators designed specifically for traders looking to catch high-probability reversal signals with precision and confidence. ✅ This indicator gives high-probability SELL signals based on RSI momentum and Bollinger Band breakouts. ✅ It filters noise and avoids over-trading, focusing only on setups that meet high-conviction criteria with built-in back-to-back signal prevention. ✅ Works best on 5-minute and 15-minute timeframes in trending markets. ✅ Features dual-mode operation: RSI Confirmation mode for momentum validation or Pure Price Action mode for breakout detection. ✅ Automatically calculates Entry, Stop Loss, and Target levels with customizable Risk:Reward ratio (default 1:1.5). Suggested Rules to Use This Indicator Effectively Follow these rules and you'll see the accuracy improve significantly: • Best trading hours: 9:30 AM to 2:30 PM – Avoid trades in the last hour of market • Entry Strategy: Enter short when the low of the signal candle breaks on the next candle • Stop Loss: Automatically set at the higher of signal candle high or previous candle high • Target: Default 1:1.5 Risk:Reward ratio (customizable up to 1:10) • Trail Stop Loss: After reaching 1:1 risk:reward, consider trailing your stop to lock in profits • If a new signal comes while an earlier trade is running, the indicator automatically prevents back-to-back signals (shows blue circle for filtered signals) • Use RSI Confirmation mode for higher accuracy in trending markets, or disable it for pure price action setups • Monitor the Intelligence Dashboard for real-time RSI, Breakout status, Entry, SL, and Target levels These simple rules, when followed with discipline, can help you extract consistent profits from momentum reversals and breakout pullback trades. This isn't just another Indicator — it's built in-house by Hitesh Somani, tested on real price action, and trusted by the Aapka Investment community. Disclaimer: This content is purely for educational purposes. We are not responsible for any financial profits or losses resulting from use of this tool or content.Chỉ báo Pine Script®của buysellprediction6
Cash secured put finderHelps identifying conservative and aggressive putsChỉ báo Pine Script®của waqasadvertisements28
Nifty Options CVD ChainNifty Options CVD Chain – Professional Strike-Level Volume Delta Tool Nifty Options CVD Chain provides a clear and reliable view of option-side volume pressure by showing True TradingView CVD (Cumulative Volume Delta) for the most active NIFTY option strikes. This tool is designed for traders who monitor option flow to understand market sentiment, absorption, and directional bias more effectively. How It Works The script automatically detects the ATM (At-The-Money) strike from the underlying NIFTY price and evaluates the two most liquid surrounding levels: ATM CE & ATM PE ATM +100 CE & ATM +100 PE ATM –100 CE & ATM –100 PE These ±100 strikes are typically the most traded, providing meaningful data for flow-based decision making. All values are retrieved using TradingView’s native ta.requestVolumeDelta(), ensuring the same precision and methodology as the official CVD indicator. Key Features ✔ True TV CVD (No approximations) The indicator uses TradingView’s built-in algorithm for up/down volume classification. No custom delta logic, no recalculated volume, and no synthetic estimations. ✔ Strike-Level Volume Delta Table A clean, compact table overlay shows CVD for each strike, formatted in a professional K/M/B style with two-decimal accuracy. ✔ Automatic Strike Selection ATM detection is based on the underlying symbol (NSE:NIFTY) and adapts automatically as price moves. ✔ Clear Market Insights This tool helps you read: CE vs PE volume imbalance Short-term sentiment shifts Absorption at key option levels Flow-based trend continuation or exhaustion Best For Intraday & positional index traders Option flow and order-flow interpreters Traders who track CE/PE dominance Anyone wanting a quick read of market pressure without scanning the full option chain Notes This indicator displays CVD ONLY for the selected strikes; it is not a full option chain. Values depend on data availability from the NSE feed. For best results, pair with your preferred price action or trend tools.Chỉ báo Pine Script®của MathThomas61
QQQ to NQ Levels (Manual)This Indicator lets you manually plot out QQQ levels on your NQ chart. I use this indicator during Asia and London where strike levels remain static. I would use the close of NQ and QQQ at 4PM and then just have good support/resistance strike levels.Chỉ báo Pine Script®của Jarcel11
Scalping Market Strctures[SumitQuants]🇮🇳🔥 **Scalping Market Structures ** Built for Scalper and Market Structure Breakout Trader A clean, lightning-fast market structure engine designed for Indian scalpers who need precise Swing Points, BOS/CHoCH, and True Breakout Signals — without clutter, lag, or noise. Perfect for 1-min, 3-min, 5-min scalping on indices & stocks. 🧠 Why This Indicator Stands Out Most structure tools repaint or clutter your chart. This one is simple, sharp, and brutally effective. It reveals: ➡ True swing highs & lows ➡ Where structure flips (BOS/CHoCH) ➡ Counter-trend reversals ➡ Buy/Sell pressure points ➡ 0.5 retracement zones for sniper entries It reads the chart the way scalpers need: Fast. Clean. Accurate. 🔥 What’s Inside (Complete Feature Stack) 🎯 1. Automatic Swing High/Low Detection (Scalper-Optimized) Instant swing labeling that adapts to your timeframe: ✔ HH (Higher High) ✔ LH (Lower High) ✔ HL (Higher Low) ✔ LL (Lower Low) Buy / Sell swing labels appear automatically: 🟥 “Sell ↓” on bearish swing highs 🟩 “Buy ↑” on bullish swing lows Perfect for reading trend direction in seconds. ⚡ 2. Real BOS & CHoCH Detection Clean breakout logic that respects your choice: ✔ BOS via Candle Close ✔ BOS via Wick Break Plus: ✨ CHoCH mode (first counter-trend BOS automatically renamed to CHoCH) ✨ Breakout lines drawn with your color & style ✨ Mid-point BOS labels for perfect visibility Spot reversals & trend flips with zero confusion. 📏 3. The 0.5 Retracement Tool (Smart Entry Zone) Beautiful mid-retracement lines drawn ONLY when trend conditions match: 🔹 Appears between recent swing high → low 🔹 Shows ideal 50% pullback zone 🔹 Perfect for sniper re-entries during expansions Enable/disable anytime. Fully customizable. 🔍 4. Trend Context in One Glance The script tracks: ✔ Last swing direction ✔ Whether the market is making HH/LH or HL/LL ✔ Bias shift moments ✔ When highs or lows get invalidated This gives you real structure awareness — the foundation of SMC scalping. 🔔 5. Clean Breakout Visualization Whenever a swing high or swing low gets taken out: 🔥 A BOS line is drawn 🔥 A BOS/CHoCH label appears 🔥 The previous swing is deactivated 🔥 Trend context is updated instantly No repaint. No lag. No ambiguity. 🧽 6. Ultra-Clean UI ✔ Minimalist labels ✔ Light/dark-mode friendly ✔ Zero clutter ✔ Focus on price, not drawings A scalper’s dream: fast, clean, actionable. 🧪 Who Is This Built For? ✔ NIFTY/BANKNIFTY Scalpers ✔ Price Action Traders ✔ SMC Traders ✔ Smart Money Reversal Traders ✔ Anyone who trades 1m–15m charts ✔ Traders who want a simple but powerful structure tool ⚡ Why Indian Traders Love It 🔸 Calls out structure shifts instantly 🔸 Helps spot reversals BEFORE the move starts 🔸 Makes scalping simple & visual 🔸 Eliminates noisy indicators 🔸 Gives pure price-action clarity 🔸 Works on every timeframe & instrument This is not just a structure tool — It’s your scalping radar. 🛒 Get Full Access This indicator is available inside the Courses Section on the official website. 👉 Purchase & Access: www.ironmindtrader.com Inside the course: 🔧 Installation Steps 📘 How to Use the Structure System 🎯 Scalping Entry Logic 🔄 Updates IncludedChỉ báo Pine Script®của SumitQuants8
IV & Gamma Hedge Profile [ML Bayesian]OANDA:XAUUSD This indicator calculates the Greeks of options using the gamma and implied volatility of each strike price to generate a profile. This profile is then used as a component in determining whether the market bias is bullish or bearish. After that, we perform historical back-calculation to conduct a meta-analysis, giving us a confidence value that helps determine how many percent the bias leans toward bullish or bearish. For trade entries, we use MACD and volume signals together, and the indicator also displays TP and SL lines.Chỉ báo Pine Script®của Thanapongpun27
MAG8 Breadth RSI This indicator is for my personal monitoring breadth of MAG 8 , including AVGO for use to trade spy/es and qqq/nq. A green bar over 6 translates to 6 out of the 8 stocks have RSI's<30. Conversely a red indicator at 6 would indicate 6 out of 8 are overbought, RSI >70. Extreme 6-8 of 8 either overbought (red) or oversold (green) Moderate 4-5 of 8 either overbought (red) or oversold (green) No Signal 0-3 of 8 either overbought (red) or oversold (green) Not trading advice but thought I would share. Chỉ báo Pine Script®của Jones51614
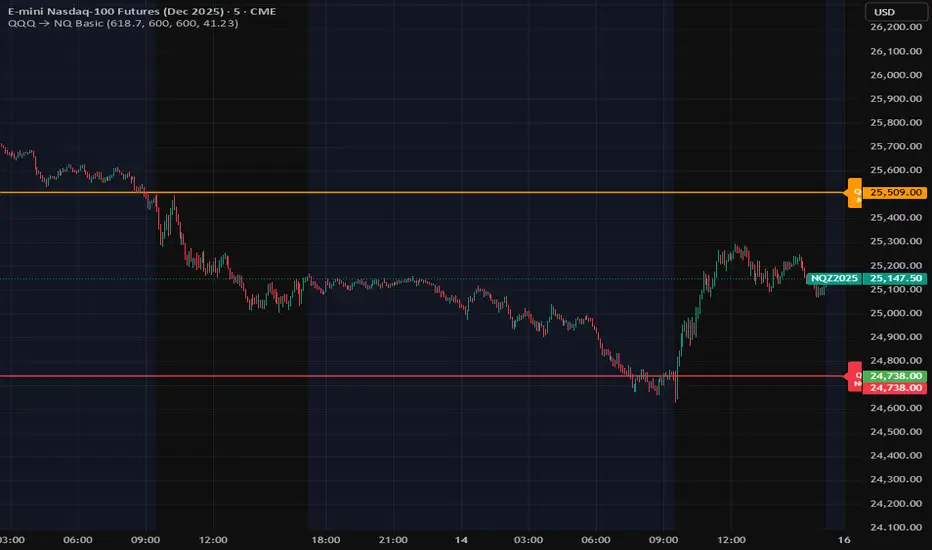
QQQ → NQ BasicConverting QQQ to NQ and fields for QQQ Gamma, Call Wall, Put Wall and Editable ratioChỉ báo Pine Script®của Jones51611