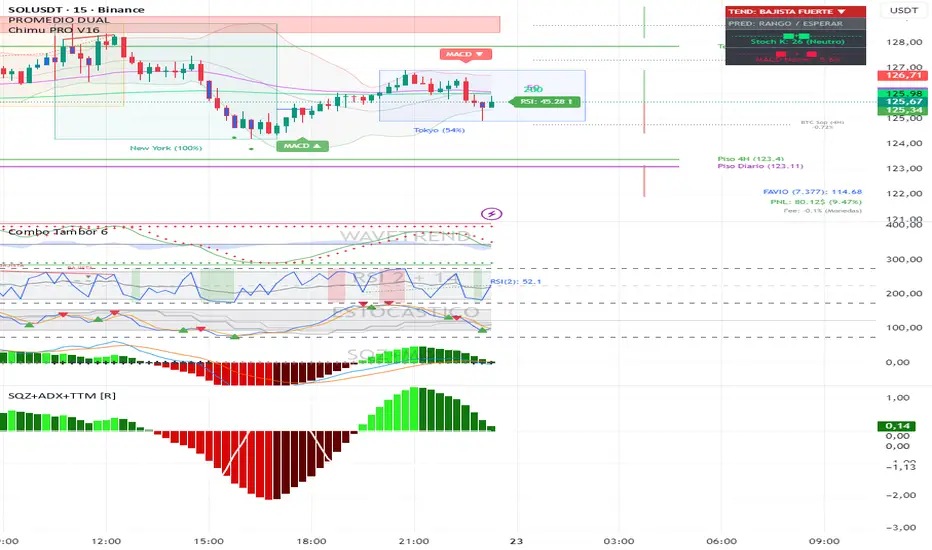
Squeeze + ADX + TTM [V6]Execution speed: The TradingView engine processes v6 scripts much faster.
Stability: By using standard functions like ta.sma or ta.linreg, the indicator is less prone to calculation errors on lower timeframes.
Clarity: I've reorganized the ADX calculation within a function to make it more readable if you decide to modify it later.
Chỉ báo và chiến lược
Enhanced Trend & ML ScreenerThe Enhanced Trend & EMA Screener is a multi-symbol dashboard that aggregates trend, momentum, and structure signals across up to 8 user-defined assets.
Why this script is unique (The Problem & Solution): Traders often struggle to monitor multiple assets for confluence without cluttering their workspace with 8 different charts. Single-metric screeners (like simple EMA crosses) generate too much noise. This script solves this by fusing 5 distinct analytical engines into a single "Confluence Score" for each ticker, allowing you to monitor your entire watchlist from one chart.
How the Confluence Engine Works: Each ticker is analyzed in real-time against five criteria:
EMA Kinetics: Checks for crossovers on 10, 21, 50, and 89-period EMAs.
Ichimoku Structure: Checks if price is above (Bullish) or below (Bearish) the Cloud to ensure trades align with equilibrium.
ADX Strength: Filters out weak trends by comparing +DI and -DI.
ATR Regimes: Analyzes volatility expansion vs contraction. Bullish signals are stronger during volatility expansion.
Linear Regression Slope: Uses the slope of the regression line as a proxy for "predicted persistence."
Dashboard Features:
Symbol Row: Customizable inputs for up to 8 tickers (Default: SPY, QQQ, and Tech Giants).
Sentiment Matrix: Color-coded cells (Green/Red/Gray) for instant trend recognition.
Debug Table: An optional secondary table that shows the raw math (Price vs EMA values) for transparency.
MTF Overlay: Includes a Weekly trend check to ensure Daily signals align with the higher timeframe.
How to Use:
Setup: Add the script to your chart (e.g., SPY Daily).
Customize: Go to settings and input your preferred 8 tickers.
Scan: Look for "Full Green" rows. If a ticker is Bullish on EMA, Ichimoku, and ADX, it is a high-probability setup.
Alerts: The script generates alerts when any of your watched tickers trigger a key EMA crossover.
Disclaimer: The screener uses request.security to fetch data. While lookahead is disabled to prevent repainting, slight data lag may occur depending on the liquidity of the tickers selected.

MACD Classic MT5 Style (2 Lines + Histogram)MACD Classic MT5 Style (แบบ MetaTrader 5) มีความแตกต่างจาก MACD ทั่วไปที่ใช้กันใน TradingView พอสมควรครับ นี่คือคำอธิบายว่ามันทำงานอย่างไรและอ่านค่าอย่างไรครับ:
1. ความแตกต่างสำคัญ (Key Difference)
MACD ทั่วไป (Standard):
มี 2 เส้น (เส้น MACD และ เส้น Signal)
ฮิสโตแกรม (แท่งกราฟ) คือ ส่วนต่าง (Gap) ระหว่าง 2 เส้นนั้น
MACD แบบ MT5 (Classic MT5):
เส้น MACD จะถูกวาดออกมาเป็น แท่งกราฟ (Histogram) แทนที่จะเป็นเส้น
เส้น Signal จะเป็น เส้น (Line) สีแดงพาดผ่านแท่งกราฟ
สรุปคือ: ในแบบ MT5 แท่งกราฟคือตัวพระเอก (MACD) ส่วนเส้นคือตัวช่วยกรอง (Signal)
Here is the English translation of the explanation:
MACD Classic MT5 Style vs. Standard MACD
The "Classic MT5 Style" MACD differs significantly from the standard MACD typically found on TradingView. Below is an explanation of its mechanics and how to interpret it.
1. Key Differences
Standard MACD (TradingView Default):
Displays 2 Lines (MACD Line and Signal Line).
The Histogram represents the difference (gap) between those two lines.
MT5 Style MACD (Classic):
The MACD value is plotted as a Histogram (bars) instead of a line.
The Signal Line appears as a standard Line (usually red) overlaying the histogram.
In summary: In the MT5 style, the Histogram represents the actual MACD Line, while the separate line acts as the Signal filter.


Binance Perp Basis % (Auto)Hello,
This script is pretty much self explanatory.
It is the real-time basis rate % of Binance futures crypto paired with USDT.
If the indicator shows "NaN" it means that the coin exists in USDT.P but does not have a homologue in spot to run the basis rate & calculation.
To change colors:
for positive & negative basis rate % you simply have to open the script & change the values here shown:
//=== 4. Plot =================================================================
col = basis >= 0 ? color.new(color. white , 0) : color.new(color. black , 0)
To change the 0 line color and opacity:
line(0, "Zero line", color=color.new(color.gray, 60), linestyle=hline.style_dashed)

Swing HelperThis script, titled "Swing helper", is a multi-metric dashboard designed to provide a comprehensive snapshot of a security's volatility, relative volume, and price action health directly on the chart. It focuses on Average Daily Range (ADR) relationship and key performance indicators to help traders identify setups like volatility contractions or trend strength.
Key Features
Dual-ADR Analysis: Calculates and compares Long-Term (LT) and Short-Term (ST) ADR percentages. The ADR Ratio helps identify when volatility is expanding or contracting relative to historical norms.
Relative Volume (RVol): Compares current volume to a 20-day moving average, highlighting institutional participation.
Dynamic Closing Range: Visualizes where the price is closing relative to the day's true range (the "Closing Range %"), indicating buying or selling pressure.
SMA 50 Distance: A unique metric that measures the price's distance from the 50-day Simple Moving Average in "ADR units," helping to gauge how overextended a stock is.
Automated Price Projections: Dynamically plots -1x and -2x ADR levels from the current price to provide immediate downside targets or support levels.
Custom Bar Coloring: Highlights specific price action patterns:
Inside Days (Blue)
Upside Reversals (Green)
Downside Reversals (Red)
Visual Customization
The script includes a highly flexible Summary Table with customizable positions, sizes, and colors (including borders and headers), allowing it to fit into any dark or light mode chart layout without obstructing price action.
How to Use
Volatility Contraction: Watch for the ADR Ratio to drop, indicating a tightening range before a potential breakout.
Relative Strength: Look for high RVol combined with a high Closing Range % (e.g., >75%) to confirm strong demand.
Mean Reversion: Use the SMA50 Dist metric to identify when a stock is "stretched" too far from its moving average relative to its daily volatility.

Ramo Trend Reversal Set (HTF Confirmed)Ramo Trend Reversal (HTF Confirmed)
Short – net – profesyonel
Sistem mantığını tek başına anlatıyor

Weekly Bullish Engulfing ScreenerThis is a weekly Bullish engulfing screener to find the stocks ready to breakout


Price Action High 2 + Risk/Reward VisualizerIntroduction: Price Action High 2 (Bull Flag) Setup
This script identifies the High 2 (H2) setup, a staple price action pattern popularized by Al Brooks. The High 2 is a high-probability continuation pattern designed to catch the resumption of a bull trend after a two-legged pullback (a "complex" bull flag).
In a strong uptrend, the first attempt to end a pullback often fails (High 1). The High 2 represents the second, and usually more reliable, attempt by bulls to take control, often forming a "double bottom" structure within the flag.
How the Logic Works
The indicator follows a strict state-machine logic to ensure the pattern is valid:
Trend Confirmation: The script filters for an established uptrend where price is above a rising EMA (adjustable in settings).
Pullback Identification: It looks for a sequence of bars making lower highs.
High 1 (H1): The first bar in the correction that breaks above the high of the prior bar.
The Second Leg: The script then waits for the price to again fail to break a high, confirming a second leg of the pullback.
High 2 (H2): The signal is triggered when a bar breaks the high of the previous bar for the second time.
Key Features
Signal Bar Quality Filter: Not all High 2s are equal. This script includes a filter ensuring the signal bar closes in the upper portion of its range (bullish conviction) to avoid "weak" breakouts.
Automated Risk/Reward Visualizer: Upon a signal, the script automatically projects a Stop Loss (at the signal bar low) and a Take Profit level based on a customizable R:R ratio.
Clean Visuals: Labeled "H2" markers and dashed trend lines keep the chart uncluttered.
How to Trade It
Entry: Place a buy-stop order 1 tick above the High 2 signal bar.
Stop Loss: Traditionally placed below the low of the signal bar or the most recent swing low.
Target: Common targets include a 1:2 Risk/Reward ratio or the previous major swing high.
Settings Guide
EMA Length: Adjust this to match your timeframe (e.g., 20 for intraday, 50 for daily).
Min Close %: Set this to 50% or higher to ensure you only take trades where the bulls finished the bar strong.
Risk:Reward Ratio: Customize your profit targets to align with your personal trading plan.

BTC Valuation ZonesBTC Valuation – Distance From 200 MA
This indicator provides a simple but powerful Bitcoin valuation framework based on how far price is from the 200-period Moving Average, a level that has historically acted as Bitcoin’s long-term equilibrium.
Instead of predicting tops or bottoms, this tool focuses on mean-reversion behavior:
When price deviates too far above the 200 MA → risk increases
When price deviates deeply below the 200 MA → long-term opportunity increases

Ichimoku MTF Heatmap WITH ALERT meeting D and W conditionsThis is a version of the Ichimoku Cloud Heatmap but adds a can't miss alert when it meets Daily and Weekly conditions. The cloud metric is still being refined and the qualifier is ignoring just the cloud for now. As of 12/21/2025 GLD is meeting the conditions to set this flag.

Manipulation Candle (RIC) V0.2Interpretation and Trading Use
Boxed Candles: Represent 15-minute periods with unusually high range relative to daily volatility. These may signal:
Market manipulation (e.g., stop hunts or fakeouts).
Breakouts, reversals, or high-impact news.
Entry/exit points in strategies focusing on volatility expansion.
No Boxes: Indicates normal or low-volatility candles (range < threshold).
Multi-Timeframe Analysis: On lower timeframes (e.g., 5-min), boxes encompass multiple bars. On higher (e.g., 1-hour), they highlight specific 15-min segments.
Example: On a volatile stock like TSLA, a 0.2 multiplier might highlight candles during earnings releases, aiding in spotting trading opportunities.
Limitations and Considerations
Drawing Limits: TradingView caps drawing objects at ~500 per script. On long histories, older boxes may not load—zoom in or reduce chart bars.
Data Availability: Requires 15-minute and daily data; may not work on illiquid symbols or non-standard charts (e.g., Renko).
Real-Time Delays: Boxes appear only after 15-min closes; no intra-bar drawing.
No Alerts Built-In: Add custom alerts via TradingView's alert system (e.g., on condition changes).
Performance: Efficient, but on very low timeframes with long history, it may use more resources due to persistent boxes.
Customization: For extensions (e.g., labels, multiple timeframes), modify the code carefully in Pine Script® v6 to avoid errors.
Version History
V0.2: Added persistent historical boxes; refined new candle detection.
Future Updates: Potential additions like box limits or multi-multiplier support. Check for updates in the script comments.
If you encounter issues or need customizations, refer to TradingView's Pine Script® documentation or community forums. For error-free extensions in Pine Script® v6, ensure proper variable scoping, type declarations, and testing on historical data.

Rango Pre-Apertura (8am-9am)Overview
This indicator is specifically designed for the index trading community, with a focus on US30 (Dow Jones). It centers on the concepts of "Capital Injection" and "Opening Traps," automatically identifying the most critical liquidity levels prior to the New York Open (09:30 AM EST).
Indicator Logic
The script operates on the premise that the range formed between 08:00 AM and 09:00 AM EST acts as a key accumulation or manipulation zone before the official session. By marking these levels, traders can visualize where institutional algorithms are likely to seek liquidity before the day’s primary expansive move begins.
Key Features
08:00 - 09:00 AM Range: Automatically calculates and projects the exact High and Low of this pre-market window.
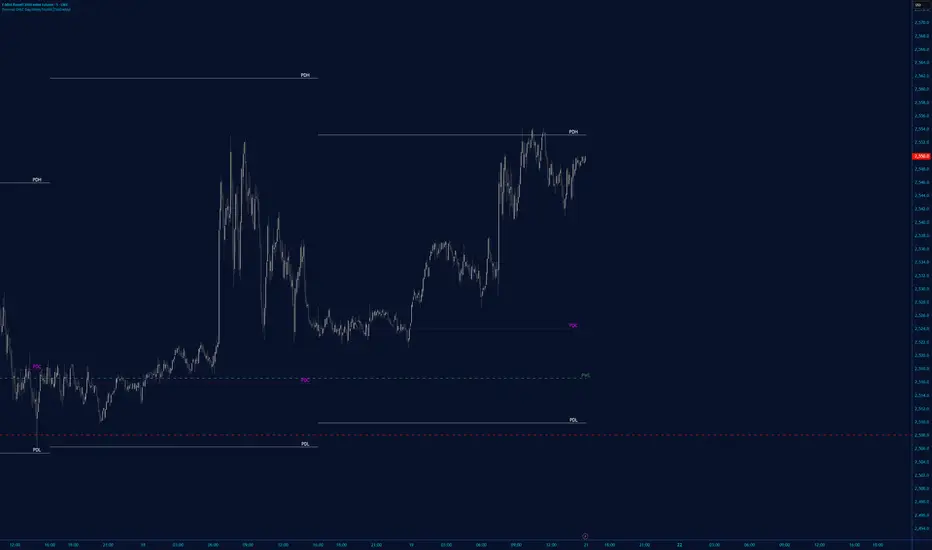
Previous Day Levels (PDH/PDL): Identifies the Previous Day High and Low as primary zones for External Liquidity (BSL/SSL).
Visual Clarity: Lines are projected only until 01:00 PM EST to keep the chart clean for post-session analysis.
Professional Styling: Uses non-continuous plots to avoid visual noise and diagonal line "bleeding" between trading days.
How to Trade with this Script
Mapping: Identify whether the price opens above or below the 8:00 AM range.
The Trap: Look for liquidity sweeps (Stop Runs) of the marked lines exactly at 09:30 AM.
Confirmation: Combine this indicator with price action to detect "Force Invalidations" (Engulfing patterns) at H1 or H4 Points of Interest (POI).

Portfolio P&L Table 10 SlotsOverview
This indicator displays a compact, Excel-style position P&L table directly on your TradingView chart. It is designed to help traders track unrealized profit/loss for a manually-entered position and ensure the calculations only apply to the symbols you actually trade, preventing confusion when switching between tickers.
The script is symbol-aware: it checks the current chart symbol against up to 10 user-defined position slots and shows P&L only when a match is found.
Core Concept
Most P&L scripts on TradingView rely on a single set of inputs (average price, quantity), which remains active even when the user changes chart symbols. That can lead to incorrect P&L displays on instruments where no position exists.
This indicator solves that by combining:
Symbol matching logic (ticker / exchange:ticker / base ticker normalization)
Slot-based position storage (up to 10 positions)
Dynamic real-time P&L calculations driven by the chart’s live price
As a result, the table behaves like a “position panel” that follows the chart, while respecting your actual holdings list.
Matching & Display Logic
Symbol Detection
The indicator compares the current chart symbol to each slot’s symbol using multiple matching methods to reduce false mismatches:
Full symbol (EXCHANGE:TICKER)
Ticker only (TICKER)
Normalized “base ticker” extraction (useful when your chart format differs from inputs)
Position Selection
The first matching slot is selected and displayed.
If no slot matches, the table shows “No position for this symbol” and does not output P&L values.
P&L Calculation Logic
When a valid slot is matched and its values are valid:
Unrealized Gross P&L
Long: (Last Price − Avg Price) × Quantity
Short: (Avg Price − Last Price) × Quantity (handled via direction multiplier)
Unrealized Net P&L (optional)
If fees are enabled, the script subtracts the slot’s total fees from gross P&L.
P&L %
Calculated relative to average price, direction-adjusted for long/short positions.
Breakeven Price
Without fees: breakeven = average price
With fees: breakeven is adjusted using fees / quantity and direction.
The table updates automatically with market movement because all values are recalculated from the chart’s current price.
Inputs and Defaults
General
Include Fees? (default: Off)
Text Size
Table Position (Top/Bottom, Left/Right)
Slots (1 → 10)
Each slot contains:
Symbol (example formats: NVTS, NASDAQ:NVTS, NYSE:PATH)
Side (Long / Short)
Average Price
Quantity
Total Fees (optional; applied only when “Include Fees” is enabled)
Colors (Fully Customizable)
The table supports user-defined colors for:
Header text/background
Body text/background
Positive P&L color
Negative P&L color
Neutral/no-position color
This allows you to match the table visually to any chart theme.
The indicator is intended for :
Quick P&L visibility while charting
Avoiding accidental P&L “carry over” when switching symbols
Tracking a shortlist of positions without external spreadsheets
If you trade more than 10 tickers regularly, the script can be extended further using the same slot architecture.
Limitations
Values are unrealized and based on the chart’s price (close/last available feed).
The script does not track multiple lots per symbol automatically; each slot represents a single consolidated position (avg + total qty).
Disclaimer
This script is provided for educational and analytical purposes only. It does not constitute financial advice, investment recommendations, or an invitation to trade. Trading involves risk, and past performance does not guarantee future results. Always verify your position data and calculations independently before making trading decisions.

Volume-Weighted Fibonacci PivotThis indicator automatically plots dynamic Fibonacci retracement and extension levels based on a volume-weighted pivot point within a user-defined lookback period or date range. It intelligently calculates a central "pivot" price biased toward high-volume bars, then draws symmetric levels both upward (extensions) and downward (retracements) for balanced confluence analysis.
How It Works (Technical Methodology)
Lookback Period Determination
Multiple filter modes control the data range used for calculations:
"Last X Bars": Fixed number of recent bars (default 400, max 4999).
"Manual Date": User-specified start date.
"Interactive (Chart)": Confirmed start date via input.
"None": Full available history (falls back to max bars).
Optionally, when using "Last X Bars", calculations can pull data from a higher/lower user-selected timeframe via request.security() for multi-timeframe alignment.
A dotted vertical line marks the start point in date-based modes.
Range and Pivot Calculation
Within the selected period:
Highest high and lowest low define the full price range.
Average volume is computed across the period.
Volume-Weighted Pivot: Average close price only from bars where volume > average volume (fallback to simple midpoint if no high-volume bars).
This creates a "smart" central pivot that leans toward areas of greater participation, often aligning with institutional activity.
Fibonacci Level Generation
User-configurable ratios (default: 0.236, 0.382, 0.5, 0.618, 0.786, 1.0, 1.272, 1.414, 1.618).
Levels are calculated symmetrically around the volume-weighted pivot:
Upward: Pivot + (Range × Ratio × Correction Factor) – teal/cyan shades.
Downward: Pivot - (Range × Ratio × Correction Factor) – red shades.
Correction Factor (default 0.5): Scales level spacing for tighter/wider grids without altering ratios.
Only the user-defined number of active lines (default 9) are drawn.
Visual Construction
Central Pivot Line: Thick yellow horizontal line with label showing exact price.
Up/Down Levels: Dashed lines extended into the future, labeled with ratio direction ("Up" or "Dn").
All objects redraw only on the last bar for performance, clearing previous drawings.
Multi-Timeframe Option
When enabled with "Last X Bars":
Pulls high/low/volume data from specified timeframe.
Aligns the pivot and levels to higher-timeframe structure while displaying on current chart – ideal for intraday traders seeking HTF confluence.
How to Use
This tool provides clean, volume-aware Fibonacci grids for identifying potential support/resistance, reversal zones, and targets.
Volume-Weighted Pivot: Often acts as a strong mean reversion level or fair value area.
Upward Levels (Teal): Potential resistance/extensions in bullish moves; watch for reactions on retests.
Downward Levels (Red): Potential support/retracements in bearish moves.
Confluence: High probability when price reacts at levels aligning with other tools (order blocks, pivots, volume profile).
Correction Factor: Lower values (<0.5) for tighter grids in ranging markets; higher (>0.5) for trending markets.
Multi-Timeframe Mode: Use on lower charts (e.g., 15m) with HTF input (e.g., 4H or Daily) to project major structure levels.
Common Setups:
Pullbacks to 0.618–0.786 zones for continuation entries.
Breaks beyond 1.0–1.618 for extension targets.
Reactions near pivot line for mean reversion trades.
Adjust ratios and active line count to match your preferred Fibonacci style (classic retracement vs. extensions).
Disclaimer
This indicator is a technical analysis tool and should be used in conjunction with other forms of analysis. Past performance does not guarantee future results. Always use proper risk management.

Long-term KST (Know Sure Thing)Description
Long-term Know Sure Thing (KST) oscillator, specifically adapted for non-24h markets such as stocks, indices, ETFs and futures.
This version correctly scales the weekly ROC periods based on the actual trading week length and daily session duration of the instrument — making it accurate across different asset classes (European indices, US equities, crypto, etc.).
Key features:
• Fully customizable trading week (5 days for most stock markets, 7 days for crypto/24h markets)
• Customizable daily session length (8.5h for FTSE MIB/DAX, 6.5h for US equities, 24h for crypto/forex)
• Automatically adjusts bar count per week on any chart timeframe (including Weekly)
• Classic Martin Pring KST parameters (10/13/15/20 ROC weeks, 10/13/15/20 SMA weeks, 1-2-3-4 weighting)
• Includes signal line (SMA of KST) and visual fill between KST and signal (green/red)
What is the Long-term KST used for?
The KST (Know Sure Thing) is a momentum oscillator created by Martin Pring to detect major trend changes, confirm the primary trend direction, and identify significant reversals in medium- to long-term cycles (weeks to months).
Main practical uses:
• Major trend reversals: KST crossing above/below signal line
• Primary trend confirmation: KST above/below zero line
• Classic divergences: Price vs KST divergences often precede important tops/bottoms
• Cycle identification: Helps spot the end of multi-month corrections or the start of new bull/bear phases
• Trend-following filter: Stay long when KST > 0 and rising, stay short when KST < 0 and falling
It is especially powerful on major indices (FTSE MIB, DAX, SPX, NDX, RUT, CAC40, Nikkei…) because it captures institutional money flow with fewer, higher-quality signals compared to faster oscillators.
Best used on:
• Daily, 4H, Weekly charts
• European indices (FTSE MIB, DAX, IBEX…)
• US indices/ETFs (SPX, NDX, RUT…)
• Crypto pairs (set week_length=7, session_duration=24h)
Enjoy trading the big-picture momentum!

Daily candle separation + NY open + First hour open Daily candle separation + NY open + First hour open

Options Volume IndicatorShows the RSI volume based on options volume. Useful for comparing against asset buy and sell signals to see strength of demand for recent options.

VWAP Extreme Zones (Elite Style)Short Description
VWAP Extreme Zones (Elite Style) highlights statistically stretched price areas above and below VWAP, helping traders identify potential overextension, mean-reversion zones, and high-risk breakout areas during intraday sessions.
Disclaimer
This indicator is provided for educational and analytical purposes only.
It does not constitute financial advice or trade signals.
All trading involves risk. Always confirm with price action, market context, and proper risk management before taking any trade.

High/Low Tracker (Dual Sessions)VV4High and lows in 2 timeframes
16:00 -> 03:55
19:30 -> 02:55
Toggle on/off of
- Auto extending untill 09:25
- Live updating during price action
Configure linestyles, box styles
It is now displaying correctly for both CL and ES

SMC Strategy Tool v1.0 - Institutional SuiteDescription: The SMC Strategy Tool v1.0 is a comprehensive technical analysis suite designed for traders following the Smart Money Concepts (SMC) methodology. It combines market structure, institutional liquidity zones, and mathematical pivots to provide a high-probability trading environment.
Key Features:
Automatic Market Structure: Real-time detection of CHoCH (Change of Character) and BOS (Break of Structure) based on price action confirmation.
Institutional Order Flow (FVG): Identifies Fair Value Gaps with a dynamic mitigation system (boxes disappear once the price fills the inefficiency).
Premium & Discount Zones: Automatically calculates the current trading range and highlights the "cheap" (Discount) and "expensive" (Premium) areas for optimal entry.
Daily Pivot Points: Seamless integration of Daily Pivots (P, R1-R3, S1-S3) for institutional confluence.
Live Analytics Dashboard: A clean, non-intrusive table monitoring Market Phase, RSI (Momentum), and ATR (Volatility).
Smart Alerts: Built-in logic for "Discount Entry" during Bullish trends and "Premium Entry" during Bearish trends.
How to Trade:
Identify the Trend: Look at the Dashboard for the current Market Phase (Bullish/Bearish).
Wait for Value: Do not chase the price. Wait for the price to return to the Discount Zone (for Longs) or Premium Zone (for Shorts).
Find Confluence: The highest probability trades occur when a Discount/Premium entry aligns with an FVG and a Daily Pivot level.
Confirmation: Check the RSI cell. If it's red/green, the move might be exhausted; wait for a neutral reading or a structural reaction.
Available Alerts:
Trend Shift (CHoCH): Get notified immediately when the market structure shifts (e.g., from Bearish to Bullish).
Trend Continuation (BOS): Signals when the current trend is confirmed by a new structural break.
Discount Zone Entry (Long Bias): Notifies you when the price enters the Discount Zone while the Market Phase is Bullish. This prevents FOMO buying at high prices.
Premium Zone Entry (Short Bias): Notifies you when the price enters the Premium Zone while the Market Phase is Bearish. This ensures you are selling at institutional "expensive" prices.
How to set up Alerts:
Click the Alerts icon in the right sidebar.
Under Condition, select: SMC Strategy Tool v1.0 - Institutional Suite.
Select "Any alert() function call" (or Qualsiasi chiamata alla funzione alert()).
Choose your preferred notification method (Popup, Email, or App notification).
The alert message will automatically include the Ticker, Timeframe, and the specific action to take!
