Smart match finder🔍 Pattern Match Finder
What It Does:
This indicator finds historical price patterns that look similar to your current price action and projects what might happen next based on what happened after those past patterns.
How It Works:
📊 Captures Current Pattern - Takes the last 30 bars (configurable) of price movement as your "current pattern"
🔎 Searches History - Scans up to 2,500 bars back looking for price patterns that moved similarly
📈 Matches by Trend - When "Same Condition" is ON, it only finds patterns that moved in the same direction (bullish matches bullish, bearish matches bearish)
🎯 Quality Filter - Uses correlation (75%+ by default) to ensure matches are high quality, not random
🔮 Projects Future - Takes what happened AFTER those historical matches and draws a prediction (yellow dashed line) showing where price might go next
📊 Shows Best Match - Highlights the best matching pattern with cyan vertical lines and overlays it on your current chart
Key Features:
✅ Trend-aware matching - Finds patterns with same market direction
✅ Quality scoring - Shows correlation % and match quality (Excellent/Good/Fair)
✅ Visual projection - Yellow prediction line showing expected price movement
✅ Smart filtering - Adjustable correlation and distance thresholds
✅ No match alerts - Warns you when no similar patterns exist
Technical Strength:
This indicator employs advanced statistical correlation analysis combined with normalized pattern recognition algorithms, making it highly effective for identifying statistically significant price pattern repetitions with quantifiable confidence metrics.
⚠️ Important Disclaimer:
This tool is for educational and analytical purposes only. Pattern projections are based on historical data and should NOT be used as the sole basis for buy/sell decisions. Always combine with proper risk management, fundamental analysis, and other technical tools before making any trading decisions.
Pattern

Friday-Monday Pattern Backtest (Market Rebellion)Tests the "Friday-Monday Pattern" popularized by Tom Hougaard / Market Rebellion.
PATTERN LOGIC:
• When Friday's high is LOWER than Thursday's high (setup condition)
• Then Friday's low is often revisited on the following Monday
WHAT THIS INDICATOR SHOWS:
• Orange background highlights valid setup bars (Thu-Fri-Mon)
• Red horizontal line marks Friday's low (the target level)
• Green "SUCCESS" label = Monday hit Friday's low
• Red "FAIL" label = Monday did not reach Friday's low
• Stats table (top-right) shows total setups, successes, and success rate
USE THIS TO:
• Backtest the pattern on any daily chart (works best on indices, forex, futures)
• Verify the claimed "overwhelming" tendency statistically
• Identify which markets/timeframes show the highest success rate
CREDITS:
Pattern idea from Tom Hougaard / Market Rebellion: x.com
Indicator by BacktestBay for transparent pattern verification.
USAGE NOTES:
• Must be applied to DAILY charts
• Uses time_close("D") for accurate day-of-week detection on forex pairs
• No trading signals - purely for statistical backtesting

Engulfing Failed Zone Detector by RWBTradeLabEngulfing Failed Zone Detector by RWBTradeLab
A clean, non-repainting tool that focuses on one thing only: showing where strong engulfing patterns failed and the market broke through their base.
What this indicator does
This script automatically scans for confirmed engulfing patterns (Regular & E-Regular) and then tracks where those structures are invalidated.
It highlights two types of failure zones:
1. Buy Engulfing Failed
* A bullish engulfing pattern forms (Regular or E-Regular).
* Later, a bearish candle closes below the base low of that engulfing.
* The zone from the base candle to the failure candle is marked as Buy EG Failed .
2. Sell Engulfing Failed
* A bearish engulfing pattern forms (Regular or E-Regular).
* Later, a bullish candle closes above the base high of that engulfing.
* The zone from the base candle to the failure candle is marked as Sell EG Failed .
Only the first clear failure after each engulfing is drawn, keeping the chart clean and readable.
Visuals on chart
1. A rectangle (box) is drawn from the engulfing base candle to the failure candle.
2. Labels are placed automatically:
* Buy EG Failed (below the zone)
* Sell EG Failed (above the zone)
3. Label distance from the zone is controlled by Text Offset from Box (%).
4. Separate color controls for:
* Buy Engulfing Failed Box Color
* Sell Engulfing Failed Box Color
The label style matches Engulfing Detector by RWBTradeLab for a consistent visual experience.
Alerts
Built-in alerts trigger only on confirmed bar close when a new failure completes:
* Buy EG Failed
* Sell EG Failed
Each alert message includes:
* Brand prefix: RWBTradeLab
* Price
* Time
* Ticker
Perfect for linking with bots, webhooks or alert-based trade management.
Key settings
Candle Length (closed candles)
* Defines how many recent confirmed candles are scanned (the live bar is excluded).
Display toggles
* Buy Engulfing Failed
* Sell Engulfing Failed
* Text
Turn each element ON/OFF to control how much information you want on the chart.
Text Offset from Box (%)
* Controls how far the label is placed from the failed zone, with a safe minimum to keep labels clear and readable.
Non-repainting confirmation
* All detection and alerts are based on closed candles only.
* No signals from the running candle, no repaint tricks.
* Once a failure zone appears, it stays fixed.
Best use
Failed engulfing zones can reveal:
* Broken demand/supply zones
* Liquidity grabs where “smart money” flushed traders out
* Strong momentum shifts after a failed reversal attempt
* Levels where continuation or clean retests often occur
Works on any symbol and timeframe. For best results, combine with:
* Higher timeframe structure
* Key support/resistance or supply/demand mapping
* Your own confirmation tools and risk management
Disclaimer
This indicator is a technical pattern-detection tool, not financial advice. Trading involves risk. Always confirm signals with your own analysis and use proper risk management.
Creator: RWBTradeLab
If this script adds value to your trading, please leave a ⭐ and share your feedback.

Engulfing Overlap Zone Detector by RWBTradeLabEngulfing Overlap Zone Detector by RWBTradeLab
A focused, non-repainting tool that detects high-value “overlap zones” formed when one engulfing pattern fails and the opposite side immediately takes control.
What this indicator does
Instead of showing every engulfing pattern, this script filters out noise and highlights only Engulfing Overlap Zones:
1. It internally detects both:
* Regular Engulfing (R EG)
* E-Regular Engulfing (ER EG)
2. It then checks for engulfing failure:
* A Sell EG fails when a bullish candle closes above its base high.
* A Buy EG fails when a bearish candle closes below its base low.
3. After the failure, it looks for an opposite-side engulfing confirmation.
4. When the failed zone and the new opposite engulfing zone overlap, the script marks that region as a Buy EG Overlap or Sell EG Overlap zone.
Only these premium, overlap-based structures are shown on the chart.
Visuals on chart
1. Two stacked rectangles are drawn for each overlap setup:
* The failed engulfing zone
* The opposite confirming engulfing zone
2. Clean labels appear at the edge of the overlap:
* Buy EG Overlap (bullish zone)
* Sell EG Overlap (bearish zone)
3. Text distance from the zone is adjustable via Text Offset from Box (%).
4. Separate color controls for:
* Buy Engulfing Overlap Box
* Sell Engulfing Overlap Box
Alerts
Built-in alerts trigger only on confirmed bar close when a new overlap setup completes:
*Buy EG Overlap
*Sell EG Overlap
Each alert message includes price, time and ticker, prefixed with RWBTradeLab for easier filtering and automation.
Key settings
1. Candle Length (closed candles) – Defines how many recent confirmed candles are scanned (current bar is excluded).
2.Display toggles – Turn ON/OFF:
* Buy Engulfing Overlap
* Sell Engulfing Overlap
* Text labels
3. Text Offset from Box (%) – Controls how far the label is placed from the overlap zone, with a safe minimum to keep labels readable.
Non-repainting logic
* All calculations use closed candles only .
* No running-bar signals, no repaint tricks.
* The zones and alerts reflect stable, confirmed structures.
Best use
This indicator is designed to help you spot:
* Liquidity grabs and fake outs followed by real reversals
* Strong continuation zones after a failed attempt by the opposite side
* High-quality reaction areas for entries, pullbacks and retests
Works on any symbol or timeframe. For best results, combine with:
* Higher-timeframe market structure
* Key support/resistance or supply/demand zones
* Your own trade management and confirmation rules
Disclaimer
This script is a technical pattern-detection tool, not financial advice. Trading involves risk. Always use proper risk management and confirm signals with your own analysis.
Creator: RWBTradeLab
If this indicator helps your trading, please leave a ⭐ and share your feedback.

121 Pattern ULTRA V6 [NXT2017] Harmonic Pattern + Volume ProfileHello Big Players! 🌍
Let’s get real for a second. Drawing lines on a chart is easy. Geometry is nice. But do you know what actually moves price? Volume.
If you are trading Harmonic Patterns blindly without checking where the money actually changed hands, you are gambling. That is why I created the 121 Pattern ULTRA. It combines precise geometric symmetry with the raw truth of the Volume Profile.
🔥 The Game Changer: Pattern-Specific Volume Profile
This is the feature that separates the pros from the amateurs. Whenever a valid "121 Pattern" is detected, this script doesn't just show you the entry (D-Point). It automatically calculates and draws a Volume Profile (VP) explicitly covering the range of the pattern.
Why is this huge?
Validation: It shows you exactly where the volume was traded during the pattern formation.
The POC (Point of Control): The script highlights the POC (Red Line). If price reacts at the D-Point and you see volume support/resistance from the profile, you have a high-probability setup.
No Clutter: The profile only appears on the valid pattern. No messy charts.
🦅 The "121" Geometry
This isn't your standard ABCD. The "121" is a specialized retracement pattern designed to catch the end of a correction and the start of a new impulse.
Precision Ratios: It checks for strict Fibonacci ratios (AB is 61.8% or 78.6% of XA).
Symmetry: It ensures the time/price slope of the X-B leg matches the B-D leg.
Fractal Scanning: The engine scans 9 different dimensions simultaneously (Pivot lengths from 5 up to 233). It finds the small scalps AND the big swings at the same time.
⚙️ Features under the Hood
History Filter: No more spam. The script remembers the last 30 patterns and filters out duplicates.
Live Statistics: A dashboard table shows you exactly how many Bullish vs. Bearish setups have formed on the current chart and timeframe.
Fully Customizable: Toggle specific sizes, change colors, or adjust the Volume Profile resolution (Rows/Width) to fit your style.
🚀 How to trade it?
Wait for the "121" label to appear.
Look at the Volume Profile: Is the market accepting or rejecting specific levels?
Check the POC: Are we bouncing off a high-volume node?
Execute at the D-Point.
Drop a boost 🚀 if you like the tool and let me know your results in the comments!
Disclaimer: This tool is for educational purposes only. Always manage your risk.
Scrolling through some screenshots:
The sizes can be displayed all at once, but you can also select individual sizes separately.

Auto Seasonality Scanner by Novatrix CapitalThe Auto Seasonality Scanner analyzes historical daily price data to identify recurring seasonal patterns in the market. It highlights periods over the last 10 years where certain price movements have historically occurred. This indicator is designed for the DAILY (1D) timeframe only.
Key Features:
Visualizes historical entry and exit points for Long and Short patterns using vertical lines.
Option to exclude specific years (e.g., 2020) from the analysis.
Optional filter by US election cycles.
Calculates average returns, win rates, trade lengths, and number of trades for each pattern.
Displays results in a customizable table with color-coded Long and Short patterns.
This tool is for educational and informational purposes only. It provides a visual guide to potential recurring seasonal trends and does not constitute financial advice or trading recommendations.

Direction via Zone Break [by rukich]🟠 OVERVIEW
The indicator shows the direction of movement and zones: SSL, BSL, FVG.
Zones serve as support/resistance and as validation/invalidation of a movement reversal.
🟠 COMPONENTS
The direction of movement is built based on a three-candle swing high (BSL) and swing low (SSL) pattern. If swing high (BSL) and swing low (SSL) are formed, and then an internal swing high/low is formed (depending on the direction of movement), then in case the initial movement continues — for example, in an upward movement — the new swing low (SSL) will be the minimum before the update, i.e., the internal low, while the swing high (BSL) will be formed according to the three-candle pattern.
A change of direction is considered when a candle closes beyond the key swing high/low (BSL/SSL), depending on the direction of movement. For example, in an upward movement, a break occurs when a candle closes beyond the swing low (SSL). After that, the swing high (BSL) will be the nearest fractal (swing high), and the swing low (SSL) will be formed according to the three-candle pattern.
All the above logic also applies to downward movements.
Within each movement, there can be FVG zones, which can act as support/resistance or indicate weakness in the movement direction.
Note: if the movement is upward, only bullish FVG+ will be displayed; if the movement is downward, only bearish FVG- will be displayed.
Weakness of movement direction.
For example, consider an upward impulse with the nearest FVG+ zone. If the price closes beyond the lower boundary of the zone, it will be considered invalidated (inv. FVG-), which in turn indicates weakness in the movement direction and a possible local short, which may subsequently lead to a break of the entire movement.
🟠 HOW TO USE
There are only two visual settings in the configuration:
Show previous SSL/BSL – enables/disables the display of all previous SSL/BSL zones
Show Bullish/Bearish trend – enables/disables background shading between SSL and BSL for visual understanding of the movement direction
On the chart, the following are displayed:
Labels with current SSL/BSL
FVG+- / inv. FVG+- zones, for trading in the movement direction
In case the nearest FVG is invalidated, a label will appear with the text: Weak bullish/bearish & local short/long (this is not a signal, but only indicates the probability of a potential move based on the weakness of the nearest zone)
🟠 CONCLUSION
The indicator helps determine the current movement with zones for trading in the direction, and also indicates movement weakness through invalidation of the nearest zones.

BETradez HTF Order Blocks BETradez HTF Order Blocks identifies and displays order blocks from higher timeframes on your chart. It detects Break of Structure (BOS) events, when price breaks above the highest high or below the lowest low—then scans back up to 200 bars to find the last opposing candle, which becomes the order block zone. The indicator displays up to 5 active order blocks per side (bullish in green, bearish in red), automatically extends them forward in time, and can hide invalidated blocks when price violates them. You can customize the timeframe (use chart or a custom higher timeframe), adjust forward extension, show optional wick lines and center lines, and control label text size. Order blocks often act as support/resistance zones where institutional activity occurred, making them useful for identifying potential entry areas, support/resistance levels, and risk management points in multi-timeframe analysis.

Viprasol Elite Advanced Pattern Scanner# 🚀 Viprasol Elite Advanced Pattern Scanner
## Overview
The **Viprasol Elite Advanced Pattern Scanner** is a sophisticated technical analysis tool designed to identify high-probability double bottom (DISCOUNT) and double top (PREMIUM) patterns with unprecedented accuracy. Unlike basic pattern detectors, this elite scanner employs an AI-powered quality scoring system to filter out false signals and highlight only the most reliable trading opportunities.
## 🎯 Key Features
### Advanced Pattern Detection
- **DISCOUNT Patterns** (Double Bottoms): Identifies bullish reversal zones where price may bounce
- **PREMIUM Patterns** (Double Tops): Detects bearish reversal zones where price may decline
- Multi-point validation system (5-point structure)
- Symmetry analysis with customizable tolerance
### 🤖 AI Quality Scoring System
Each pattern receives a quality score (0-100) based on:
- **Symmetry Analysis** (32% weight): How closely the two bottoms/tops match
- **Trend Context** (22% weight): Strength of the preceding trend using ADX
- **Volume Profile** (22% weight): Volume confirmation at key points
- **Pattern Depth** (16% weight): Significance of the pattern's price range
- **Structure Quality** (16% weight): Overall pattern formation quality
Quality Grades:
- ⭐ **ELITE** (88-100): Highest probability setups
- ✨ **VERY STRONG** (77-87): Strong trade opportunities
- ✓ **STRONG** (67-76): Valid patterns with good potential
- ○ **VALID** (65-66): Acceptable patterns meeting minimum criteria
### 🎯 Intelligent Target System
Three target modes per pattern direction:
- **Conservative**: 0.618 Fibonacci extension (safer, closer targets)
- **Balanced**: 1.0 extension (moderate risk/reward)
- **Aggressive**: 1.618 extension (higher risk/reward)
Targets automatically adjust based on pattern quality score.
### 🔧 Advanced Filtering Options
- **Volatility Filter (ATR)**: Excludes patterns during extreme volatility
- **Momentum Filter (ADX)**: Ensures sufficient trend strength
- **Liquidity Filter (Volume)**: Confirms adequate trading volume
### 📊 Pattern Lifecycle Management
- Real-time neckline tracking with extension multiplier
- Pattern invalidation after extended wait period
- Breakout/breakdown confirmation
- Reversal detection (pattern failure scenarios)
- Target achievement tracking
### 🌈 Premium Visual System
- Color-coded quality levels
- Cyber-themed color scheme (Neon Green/Hot Pink/Purple/Cyan)
- Transparent fills for pattern zones
- Dynamic labels with pattern information
- Elite dashboard showing live pattern stats
## 📈 How To Use
### Basic Setup
1. Add indicator to your chart
2. Enable desired patterns (DISCOUNT and/or PREMIUM)
3. Adjust quality threshold (default: 65) - higher = fewer but better signals
4. Set your preferred target mode
### Trading DISCOUNT Patterns (Bullish)
1. Wait for pattern detection (labeled points 1-4)
2. Check quality score on dashboard
3. Entry on breakout above neckline (point 5)
4. Stop loss below the lowest bottom
5. Target shown automatically based on your mode
6. ⚠️ Watch for pattern failure (break below bottoms = SHORT signal)
### Trading PREMIUM Patterns (Bearish)
1. Wait for pattern detection (labeled points 1-4)
2. Check quality score on dashboard
3. Entry on breakdown below neckline (point 5)
4. Stop loss above the highest top
5. Target shown automatically based on your mode
6. ⚠️ Watch for pattern failure (break above tops = LONG signal)
## ⚙️ Input Settings Guide
### 🔍 Detection Engine
- **Left/Right Pivots**: Higher = fewer but cleaner patterns (default: 6/4)
- **Min Pattern Width**: Minimum bars between bottoms/tops (default: 12)
- **Symmetry Tolerance**: Max % difference allowed between levels (default: 1.8%)
- **Extension Multiplier**: How long to wait for breakout (default: 2.2x pattern width)
### ⭐ Quality AI
- **Min Quality Score**: Only show patterns above this score (default: 65)
- **Weight Distribution**: Customize what matters most (symmetry/trend/volume/depth/structure)
### 🔧 Filters
- **Volatility Filter**: Avoid choppy markets (recommended: ON)
- **Momentum Filter**: Ensure trend strength (recommended: ON)
- **Liquidity Filter**: Volume confirmation (recommended: ON)
### 💎 Target System
- Choose target aggression for each pattern type and direction
- Higher quality patterns get adjusted targets automatically
## 🎨 Visual Customization
- Adjust colors for DISCOUNT/PREMIUM patterns
- Set quality-based color coding
- Customize label sizes
- Toggle dashboard visibility and position
- Show/hide historical patterns
## 🚨 Alert System
Set up TradingView alerts for:
- 🚀 **LONG Signals**: DISCOUNT breakout, PREMIUM failure
- 📉 **SHORT Signals**: PREMIUM breakdown, DISCOUNT failure
- ✅ **Target Achievement**: When price hits your target
## 💡 Pro Tips
1. **Higher Timeframes = Better Signals**: Patterns on 4H, Daily, Weekly are more reliable
2. **Quality Over Quantity**: Focus on ELITE and VERY STRONG grades
3. **Combine with Trend**: DISCOUNT in uptrend, PREMIUM in downtrend = best results
4. **Watch Pattern Failures**: Failed patterns often provide strong counter-trend signals
5. **Adjust for Your Style**: Intraday traders use Conservative, swing traders use Aggressive
## 🔒 Pattern Invalidation
Patterns become invalid if:
- No breakout/breakdown within extension period
- Support/resistance levels are broken prematurely
- Pattern shown in faded colors = no longer active
## ⚠️ Risk Disclaimer
This indicator is a tool for technical analysis and does not guarantee profitable trades. Always:
- Use proper risk management
- Combine with other analysis methods
- Never risk more than you can afford to lose
- Past performance does not indicate future results

Simple Line📌 Understanding the Basic Concept
The trend reverses only when the price moves up or down by a fixed filter size.
It ignores normal volatility and noise, recognizing a trend change only when price moves beyond a specified threshold.
Trend direction is visually intuitive through line colors (green: uptrend, red: downtrend).
⚙️ Explanation of Settings
Auto Brick Size: Automatically determines the brick/filter size.
Fixed Brick Size: Manually set the size (e.g., 15, 30, 50, 100, etc.).
Volatility Length: The lookback period used for calculations (default: 14).
📈 Example of Identifying Buy Timing
When the line changes from gray or red to green, it signals the start of an uptrend.
This indicates that the price has moved upward by more than the required threshold.
📉 Example of Identifying Sell Timing
When the line changes from green to red, it suggests a possible downtrend reversal.
At this point, consider closing long positions or evaluating short entries.
🧪 Recommended Use Cases
Use as a trend filter to enhance the accuracy of existing strategies.
Can be used alone as a clean directional indicator without complex oscillators.
Works synergistically with trend-following strategies, breakout strategies, and more.
🔒 Notes & Cautions
More suitable for medium- to long-term trend trading than for fast scalping.
If the brick size is too small, the indicator may react to noise.
Sensitivity varies greatly depending on the selected brick size, so backtesting is essential to determine optimal values.
❗ The Trend Simple Line focuses solely on direction—remove the noise and focus purely on the trend.
초대 전용 스크립트
이 스크립트에 대한 접근이 제한되어 있습니다. 사용자는 즐겨찾기에 추가할 수 있지만 사용하려면 사용자의 권한이 필요합니다. 연락처 정보를 포함하여 액세스 요청에 대한 명확한 지침을 제공해 주세요.
이 비공개 초대 전용 스크립트는 스크립트 모더레이터의 검토를 거치지 않았으며, 하우스 룰 준수 여부는 확인되지 않았습니다. 트레이딩뷰는 스크립트의 작동 방식을 충분히 이해하고 작성자를 완전히 신뢰하지 않는 이상, 해당 스크립트에 비용을 지불하거나 사용하는 것을 권장하지 않습니다. 커뮤니티 스크립트에서 무료 오픈소스 대안을 찾아보실 수도 있습니다.
작성자 지시 사항
.
c9indicator
면책사항
해당 정보와 게시물은 금융, 투자, 트레이딩 또는 기타 유형의 조언이나 권장 사항으로 간주되지 않으며, 트레이딩뷰에서 제공하거나 보증하는 것이 아닙니

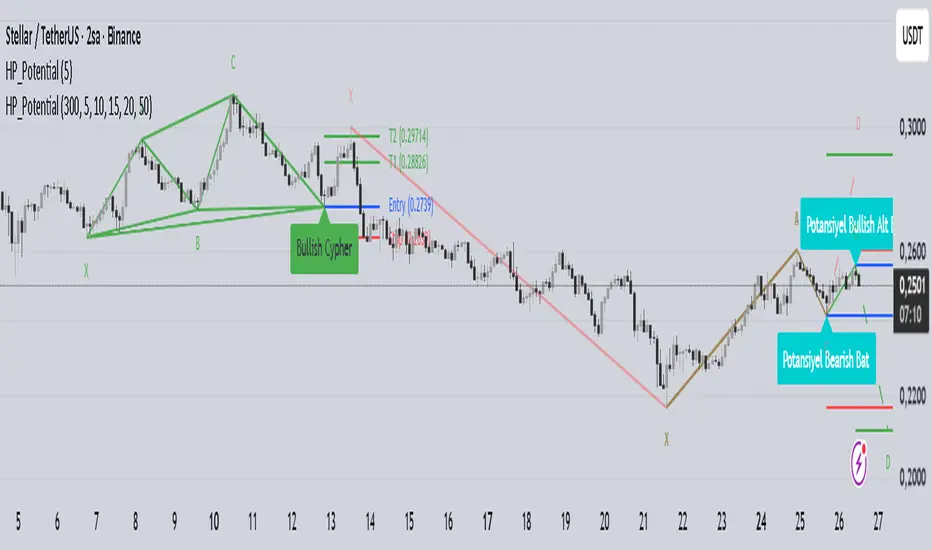
Harmonic Patterns with Potential DetectionThis indicator is designed to automatically detect commonly used Harmonic Patterns in financial markets and provide early warnings for "Potential" patterns that have not yet completed. It utilizes a Multi-ZigZag structure to analyze price movements across different timeframes simultaneously.
Key Features:
Advanced Pattern Detection:
Detects the following 8 harmonic patterns in both Bullish and Bearish directions:
Gartley
Bat
Alt Bat
Butterfly
Crab
Deep Crab
Shark
Cypher
Potential Pattern Detection (Early Warning System):
Calculates the probable D point (Entry Level) after the C point is formed, even before the pattern is fully completed, and visualizes it with dashed lines.
This feature allows traders to prepare and plan their trading strategies before the pattern completes.
Automatically plots Entry, Stop, and Target levels for potential patterns.
Multi-ZigZag Analysis:
Scans the market using 5 different ZigZag lengths (5, 10, 15, 20, 50). This allows you to see both short-term and long-term patterns on the same chart.
Each ZigZag period uses distinct color coding, making it easy to distinguish which timeframe a pattern belongs to.
User-Friendly Visuals:
Completed patterns are shown with clear lines and labels (X, A, B, C, D).
Hovering over pattern labels (Tooltip) displays detailed information including the pattern name, entry, target, and stop levels.
Only valid and active patterns are highlighted to prevent visual clutter.
Alert System:
You can set alerts for both completed patterns (when point D is formed) and potential patterns (when point C is formed).
Fully compatible with the TradingView alert system.
How to Use:
Add the indicator to your chart.
Select which patterns to scan for in the settings menu (all are selected by default).
Customize ZigZag sensitivities according to your strategy.
Dashed lines indicate "Potential" (uncompleted) opportunities, while solid lines indicate "Completed" patterns.
Disclaimer: This indicator is for educational and analytical purposes only. It does not constitute investment advice. Harmonic patterns are probability-based analysis methods and may not always yield successful results.
Analog Flow [KedArc Quant]Overview
AnalogFlow is an advanced analogue based market projection engine that reconstructs future price tendencies by matching current price behavior to historical analogues in the same instrument. Instead of using traditional indicators such as moving averages, RSI, or regression, AnalogFlow applies pattern vector similarity analysis - a data driven technique that identifies historically similar sequences and aggregates their subsequent movements into a smooth, forward looking curve.
Think of it as a market memory system:
If the current pattern looks like one we have seen before, how did price move afterward?
Why AnalogFlow Is Unique
1. Pattern centric - it does not rely on any standard indicator formula; it directly analyzes price movement vectors.
2. Adaptive - it learns from the same instrument's past behavior, making it self calibrating to volatility and regime shifts.
3. Non repainting - the projection is generated on the latest completed bar and remains fixed until new data is available.
4. Noise resistant - the EMA Blend engine smooths the projected trajectory, reducing random variance between analogues.
Inputs and Configuration
Pattern Bars
Number of bars in the reference pattern window: 40
Projection Bars
Number of bars forward to project: 30
Search Depth
Number of bars back to look for matching analogues: 600
Distance Metric
Comparison method: Euclidean, Manhattan, or Cosine (default Euclidean)
Matches
Number of top analogues to blend (1-5): Top 3
Build Mode
Projection type: Cumulative, MeanStep, or EMA Blend (default EMA Blend)
EMA Blend Length
Smoothness of the projected path: 15
Normalize Pattern
Enable Z score normalization for shape matching: true
Dissimilarity Mode
If true, finds inverse analogues for mean reversion analysis: false
Line Color and Width
Style settings for projection curve: Blue, width 2
How It Works with Past Data
1. The system builds a memory bank of patterns from the last N bars based on the scanDepth value.
2. It compares the latest Pattern Bars segment to each historical segment.
3. It selects the Top K most similar or dissimilar analogues.
4. For each analogue, it retrieves what happened after that pattern historically.
5. It averages or smooths those forward moves into a single composite forecast curve.
6. The forecast (blue line) is drawn ahead of the current candle using line.new with no repainting.
Output Explained
Blue Path
The weighted mean future trajectory based on historical analogues.
Smoother when EMA Blend mode is enabled.
Flat Section
Indicates low directional consensus or equilibrium across analogues.
Upward or Downward Slope
Represents historical tendency toward continuation or reversal following similar conditions.
Recommended Timeframes
Scalping / Short Term
1m - 5m : Short winLen (20-30), small ahead (10-15)
Swing Trading
15m - 1h : Balanced settings (winLen 40-60, ahead 20-30)
Positional / Multi Day
4h - 1D : Large windows (winLen 80-120, ahead 30-50)
Instrument Compatibility
Works seamlessly on:
Stocks and ETFs
Indices
Cryptocurrency
Commodities (Gold, Crude, etc.)
Futures and F&O (both intraday and positional)
Forex
No symbol specific calibration needed. It self adapts to volatility.
How Traders Can Use It
Forecast Context
Identify likely short term price path or drift direction.
Reversal Detection
Flip seekOpp to true for mean reversion pattern analysis.
Scenario Comparison
Observe whether the current regime tends to continue or stall.
Momentum Confirmation
Combine with trend tools such as EMA or MACD for directional bias.
Backtesting Support
Compare projected path versus realized price to evaluate reliability.
FAQ
Q1. Does AnalogFlow repaint?
No. It calculates only once per completed bar and projects forward. The future path remains static until a new bar closes.
Q2. Is it a neural network or AI model?
Not in the machine learning sense. It is a deterministic analogue matching engine using statistical distance metrics.
Q3. Why does the projection sometimes flatten?
That means similar historical setups had no clear consensus in direction (neutral expectation).
Q4. Can I use it for live trading signals?
AnalogFlow is not a signal generator. It provides probabilistic context for upcoming movement.
Q5. Does higher scanDepth improve accuracy?
Up to a point. More depth gives more analogues, but too much can dilute recency. Try 400 to 800.
Glossary
Analogue
A past pattern similar to the current price behavior.
Distance Metric
Mathematical formula for pattern similarity.
Step Vector
Difference between consecutive closing prices.
EMA Blend
Exponential smoothing of the projected path.
Cumulative Mode
Adds sequential historical deltas directly.
Z Score Normalization
Rescaling to mean 0 and variance 1 for shape comparison.
Summary
AnalogFlow converts the market's historical echoes into a structured, statistically weighted forward projection. It gives traders a contextual roadmap, not a signal, showing how similar past setups evolved and allowing better informed entries, exits, and scenario planning across all asset classes.
Disclaimer
This script is provided for educational purposes only.
Past performance does not guarantee future results.
Trading involves risk, and users should exercise caution and proper risk management when applying this strategy.

Auto Chart PatternsAuto Chart Patterns automatically scans the chart for major technical patterns and marks them directly on price action. It detects:
• Head & Shoulders (bearish reversal)
• Inverse Head & Shoulders (bullish reversal)
• Rising and Falling Wedges
• Double / Triple Tops and Bottoms
• Cup & Handle (bullish continuation)
For each pattern, the script draws the structure (trendlines / neckline), shades the pattern zone, and places a label with the pattern name.
It also generates optional trade signals:
• “BUY” when a bullish pattern breaks out with confirmation
• “SELL” when a bearish pattern breaks down with confirmation
Confirmations can include:
• Follow-through candle in the breakout direction
• Volume spike vs recent average
• RSI momentum agreement
Inputs let you control:
• Pivot sensitivity (left/right bars)
• Pattern types to display
• Cup & Handle depth rules
• Confirmation rules for entry/exit signals
This tool is designed to help you visually spot reversal and continuation setups, highlight potential breakout levels (necklines / wedge boundaries), and time trades with clearer confirmation instead of guessing.
Disclaimer: This script is for educational/technical analysis purposes only. It does not guarantee future performance, does not execute trades, and is not financial advice. Always confirm signals with your own analysis and risk management before entering any position.

Pattern DetectorPattern Detector
Identifies and summarizes common chart patterns on any symbol/timeframe. Shows a compact table of the most recent confirmed patterns (up to 6), optional candle coloring that matches table row colors, and optional targets for context. Designed for analysis support only.
What it detects
Triangles and wedges, flags and pennants, head & shoulders (and inverse), rectangles, channels, broadening formations, double/triple tops & bottoms, cup & handle (and inverse), rounding tops/bottoms, diamonds, bump & run, island reversals, staircase patterns, V patterns, gaps (up/down), pipe/spike patterns, harmonic ABCD, Elliott (simplified), three drives, Quasimodo, dead cat bounce, tower top/bottom, shakeout, and Wolfe waves.
Inputs
Lookback Mode: Auto or Manual (Manual Lookback bars)
Min Confidence to Confirm: threshold for confirmation
Display: Show Pattern Table, Show Pattern Numbers, Color Pattern Candles
Style: table row colors; bullish/bearish direction colors
Notes:
Candle coloring uses the table’s row colors and requires Show Pattern Table to be enabled.
Targets are approximate and for reference only.
Alerts
Pattern Confirmed
Pattern Target Reached
Important
Educational/information tool only; not a signal generator and not financial advice.
No performance guarantees. Use with other analysis and risk management.
Calculations update in real time; confirmations happen on closed bars. Detected patterns can change intrabar; use closed‑bar alerts for greater reliability.
Results may vary by symbol, timeframe, liquidity, and volatility.

Wolfe Waves [BigBeluga]🔵 OVERVIEW
The Wolfe Waves pattern was first introduced by Bill Wolfe , a trader and analyst in the 1980s–1990s who specialized in market geometry and natural rhythm cycles. Wolfe observed that price often forms symmetrical wave structures that anticipate equilibrium points where supply and demand meet. These formations, called Wolfe Waves , gained popularity as a reliable pattern for forecasting both short- and long-term reversals.
The Wolfe Waves indicator automatically detects these patterns in real time. It tracks sequences of five pivots (points 1 through 5) and connects them with wave lines. Users can select either Bullish or Bearish Wolfe Waves depending on their trading bias. When the pattern fails, the lines automatically turn red to highlight invalidation.
🔵 CONCEPTS
Five-Point Structure – Wolfe Waves are defined by five pivots (1–5), which together form the basis of the wave pattern.
Bullish Pattern – Occurs when price compresses downward into point 5, signaling a potential upside reversal.
Bearish Pattern – Occurs when price extends upward into point 5, forecasting a downside reversal.
Validation & Failure – The pattern is considered valid once all five pivots form; if price fails to respect the expected breakout, the indicator marks the structure as broken with red lines.
🔵 FEATURES
Automatic detection of Bullish and Bearish Wolfe Waves.
Labels each pivot (1–5) on the chart for clarity.
Draws connecting lines between pivots to visualize the wave structure.
Projects target/dashed lines (EPA/ETA) based on Wolfe Wave geometry.
Lines automatically turn red when the pattern is broken, giving immediate feedback.
Customizable color scheme for bullish (lime) and bearish (orange) waves.
Adjustable sensitivity for pivot detection.
🔵 HOW TO USE
Choose between Bullish or Bearish mode depending on your analysis.
Watch for the formation of all five pivots; the indicator labels them clearly.
Look for potential entries near point 5, with the expectation that price will travel toward the projected EPA line.
Use invalidation (lines turning red) as a risk management warning to exit failed setups.
Combine with momentum, volume, or higher-timeframe analysis to increase reliability.
🔵 CONCLUSION
The Wolfe Waves brings the classic Wolfe Wave theory into an automated TradingView tool. Inspired by Bill Wolfe’s original concept of natural market cycles, this indicator detects, labels, and validates Wolfe Waves in real time. With automatic invalidation marking and customizable settings, it offers traders a structured way to harness one of the most well-known geometric reversal patterns.

ADR% / CDR% Range Analyzer - PajameinThe "ADR%/CDR% Range Analyzer" is a versatile TradingView indicator designed for traders who want to monitor and compare the "Average Daily Range (ADR%)" and "Current Daily Range (CDR%)" in real-time. ADR% represents the average percentage range (high-low relative to low) over a user-defined number of daily bars, helping you gauge a stock's typical volatility. CDR% shows the current session's range as a percentage, either intraday (customizable from start to end price) or full daily, allowing you to assess how the current bar's movement stacks up against historical norms.
Key features include:
- "Visual Comparison": Displays both values as clean labels on the chart with customizable positions (separate or combined).
- "Dynamic Background Coloring": CDR% label background changes color based on its relation to ADR%—light green for low volatility (< low threshold), light blue for neutral (between thresholds), and light red for high volatility (> high threshold). This helps quickly spot expansion or contraction in daily moves.
- "Flexibility": Works on any timeframe, with options for intraday customization and anti-clipping adjustments for multi-pane layouts.
This indicator is ideal for day traders, swing traders, or anyone tracking volatility breakouts, range-bound setups, or risk management based on expected daily moves.
Input Settings Guide
Here's a breakdown of each setting and how it enhances your trading workflow:
- "Show ADR%" (Boolean, default: true)
Toggle to display/hide the ADR% label. Use this to declutter your chart when focusing solely on current range.
- "Show CDR%" (Boolean, default: true)
Toggle to display/hide the CDR% label. Ideal for charts where you only need historical average or current metrics.
- "ADR% Length" (Integer, default: 20, min: 1)
Number of daily bars for averaging the range percentage. Shorter lengths (e.g., 10) for recent volatility; longer (e.g., 50) for broader trends.
- "CDR%: Start" (Source, default: low)
Starting price for intraday CDR% (e.g., open, previous close). Customize for specific range measurements like gap fills.
- "CDR%: End" (Source, default: high)
Ending price for intraday CDR% (e.g., low, close). Pair with Start for targeted ranges, like open-to-low for downside capture.
- "Intraday Display" (String dropdown: "Intraday CDR%", "Daily CDR%", default: "Daily CDR%")
Switch between real-time intraday calculation (dynamic updates) or fixed daily value (stable, non-repainting).
- "Low Threshold %" (Float, default: 40.0, range: 0-100)
Percentage of ADR% below which CDR% gets the low (green) background. Lower it (e.g., 30%) for stricter low-volatility alerts.
- "High Threshold %" (Float, default: 60.0, range: 0-100)
Percentage of ADR% above which CDR% gets the high (red) background. Raise it (e.g., 70%) to highlight only extreme expansions.
- "ADR% Text Color" (Color picker, default: black)
Foreground color for ADR% text. Choose contrasting colors for dark/light themes.
- "CDR% Text Color" (Color picker, default: black)
Foreground color for CDR% text. Ensures readability over dynamic backgrounds.
- "Low CDR% Background (below low threshold)" (Color picker, default: light green with 70% transparency)
Background for subdued ranges. Adjust opacity for subtlety.
- "Mid CDR% Background (between thresholds)" (Color picker, default: light blue with 70% transparency)
Neutral background for typical moves.
- "High CDR% Background (above high threshold)" (Color picker, default: light red with 70% transparency)
Alert-style background for breakouts.
- "Cell Height %" (Integer, default: 8, range: 1-20)
Vertical padding for labels as a percentage of chart height. Increase (e.g., 12) in multi-pane layouts to prevent text clipping; decrease for compact views.
- "ADR% Position" (String dropdown: Top/Bottom/Middle Left/Right/Center, default: Bottom Right)
Placement of ADR% label. Use separate positions for side-by-side comparison.
- "CDR% Position" (String dropdown: Top/Bottom/Middle Left/Right/Center, default: Bottom Right)
Placement of CDR% label. Matching positions auto-stacks them vertically.
- "Text Size" (String dropdown: Tiny/Small/Normal/Large, default: Normal)
Font size for labels. "Small" for dense charts; "Normal" for clarity.
Usage Tips
- "Volatility Trading": Set thresholds to 50%/80% for spotting range expansions during news events.
- "Multi-Timeframe": Apply on 5-min charts with daily ADR for intraday targets (e.g., aim for 80% of ADR).
- "Customization": For forex/crypto, tweak Start/End to session opens. Test in replay mode to verify non-repainting.
- "Limitations": Intraday mode updates live but may not repaint until bar close; daily mode is fixed.

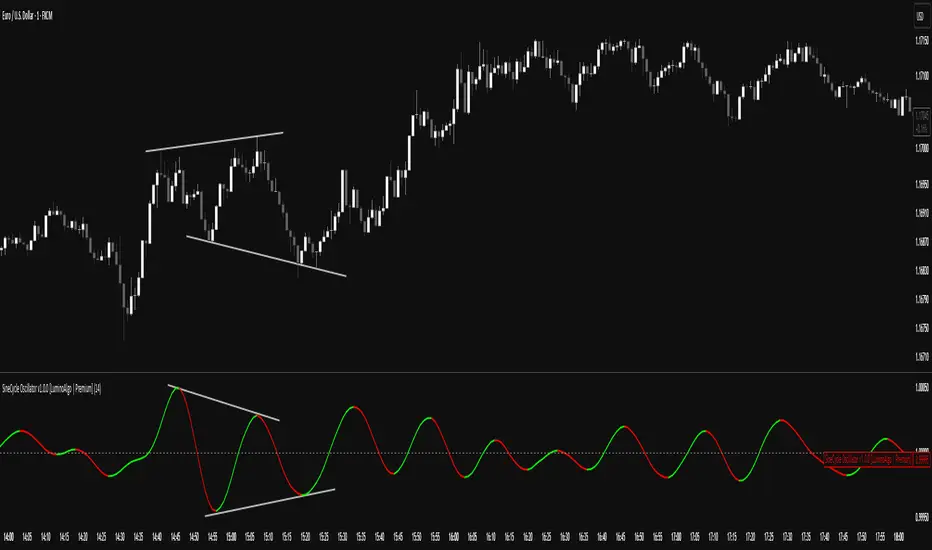
SigmoidCycle Oscillator [LuminoAlgo]Purpose:
The SineCycle Oscillator measures price momentum using sigmoid function mathematics (S-curve transformation) borrowed from neural network theory. It generates an oscillator that fluctuates around 1.0, identifying momentum shifts and potential reversal points.
Mathematical Foundation:
This indicator applies the sigmoid logistic function concept: y = 1/(1+e^-x) , which creates an S-shaped curve. In financial markets context, this transformation:
- Maps price changes to a bounded range (-1 to +1)
- Provides non-linear sensitivity (high near zero, low at extremes)
- Naturally filters outliers without lag penalty
Calculation Process:
1. Statistical Normalization: Price deviations are measured from a moving average baseline and scaled by recent volatility (standard deviation over N periods)
2. Sigmoid Transformation: Normalized values undergo S-curve transformation, which weights small movements linearly but compresses large movements logarithmically
3. Dual Timeframe Analysis:
• Short window: User-defined period (N)
• Long window: Double period (2N)
• Ratio calculation: Short sigmoid average ÷ Long sigmoid average
4. Volatility-Weighted Smoothing: Final values use exponential smoothing where the smoothing factor adjusts based on the coefficient of variation (volatility/mean ratio)
What Makes This Different:
Unlike linear momentum oscillators (RSI, Stochastic) that use fixed mathematical relationships, the sigmoid transformation creates variable sensitivity zones. This mimics how professional traders mentally weight price movements.
Trading Application:
Signal Types:
- Momentum: Green (>1.0) = bullish, Red (<1.0) = bearish
- Reversals: 1.0 line crosses with volume confirmation
- Divergence: Price makes new high/low, oscillator doesn't
- Exhaustion: Extended readings (>1.2 or <0.8) suggest overextension
Optimal Conditions:
- Works best: Trending markets with clear swings
- Avoid: Low volume, ranging markets under 1% daily movement
- Timeframes: 4H and above for reliability
Parameter Guidelines:
- Length 8-10: Day trading (expect more whipsaws)
- Length 14-20: Swing trading (balanced signals)
- Length 25-30: Position trading (fewer, stronger signals)
Limitations:
- Lag increases with higher length settings
- Can give false signals during news-driven spikes
- Requires additional confirmation in choppy markets
Trading Framework:
Based on momentum persistence theory - assumes trends continue until sigmoid curve flattens (indicating momentum exhaustion). The mathematical model captures both mean reversion (extreme readings) and trend following (mid-range readings) characteristics.
Intelligent Trading SuiteIntelligent Trading Suite
“One script to rule them all.”
Overview
The Intelligent Trading Suite is a professional-grade decision system built in Pine Script. It is a unified engine—not a bundle of indicators—that combines adaptive pattern recognition, historical memory, and multi-context intelligence into one framework. Using a deep historical pattern database and integrating session dynamics, market calendars, holiday effects, and economic events, it filters noise and adapts to conditions. Core emphasis: precise pattern detection with target-price projection that remains stable as new candles print (mitigates target drift) and early detection of forming geometric patterns and divergences/hidden divergences.
Core Features
All-Timeframe Operation: Works across every TradingView timeframe—from 1m to 1W—without performance drift.
Pattern Recognition with Targets: Detects triangles, wedges, cup & handle, flags, and H&S; projects targets and stabilizes them against common drift as price evolves.
Early Signal Engine: Flags forming patterns and divergences before completion and notifies when prerequisites align.
Historical Pattern Intelligence: Stores and compares thousands of prior states (Hull, VWAP, RSI, MACD, SMA, CVD) to weight current conditions and calibrate confidence.
Context & Regime Awareness: Adjusts for volatility regimes, liquidity sessions, day-of-week bias, holidays, and macro events.
Unified Signal & Confidence: Fuses all streams into a single Overall signal with calibrated confidence levels (Weak / Neutral / Strong).
Visualization & Alerts
Compact Ultimate Intelligence Table showing each analytical pillar, plus the Overall signal, and an option to show them on the chart as well.
Alerts on table for: new pattern detection, divergence events, volatility shifts, and trend reversals.
Important Notes
-Free plan runtime: TradingView Free accounts may hit platform limits.
Fix: Open settings → switch Mode from Paid to Free → runs within Free limits.
-Heavy computation: The script is calculation- and data-intensive; initial runs can take time.
If a rare runtime error occurs, simply reload the page and continue.
Attributions
Hull Moving Average (Alan Hull)
VWAP (Volume Weighted Average Price)
RSI (Relative Strength Index, J. Welles Wilder Jr.)
MACD (Moving Average Convergence Divergence, Gerald Appel)
Black Flag ATR bands (Jose Azcarate)
Proprietary enhancements, target-stabilization logic, and the nuclear intelligence architecture are original research for this suite.
Compliance
Educational and analytical use only
No financial advice
Ad-free; aligned with TradingView House Rules
Proper attribution included
Access
To get access, please read the Author’s instructions on the script’s page.

Internal Pivot Pattern [LuxAlgo]The Internal Pivot Pattern indicator is a novel method allowing traders to detect pivots without excessive delay on the chart timeframe, by using the lower timeframe data from a candle.
It features custom colors for candles and zigzag lines to help identify trends. A dashboard showing the accuracy of the pattern is also included.
🔶 USAGE
We define a pivot as the occurrence where the middle candle over a specific interval (for example, the most recent 21 bars) is the highest (pivot high) or the lowest (pivot low). This method commonly allows for identifying swing highs/lows on a trader's chart; however, this pattern can only be identified after a specific number of bars has been formed, rendering this pattern useless for real-time detection of swing highs/lows.
This indicator uses a different approach, removing the need to wait for candles to form on the user chart; instead, we check the lower timeframe data of the current candle and evaluate for the presence of a pivot given the internal data, effectively providing pivot confirmation at the candle close.
An internal pivot low pattern is indicative of a potential uptrend, while an internal pivot high is indicative of a potential downtrend.
Candles are colored based on the last internal pivot detected, with blue candle colors indicating that the most recent internal pivot is a pivot low, indicating an uptrend, while an orange candle color indicates that the most recent internal pivot is a pivot high, indicating a downtrend.
🔹 Timeframes
The timeframe setting allows controlling the amount of lower timeframe data to consider for the internal pivot detection. This setting must be lower than the user's chart timeframe.
Using a timeframe significantly lower than the user chart timeframe will evaluate a larger amount of data for the pivot detection, making it less frequent, while using a timeframe closer to the chart timeframe can make the internal pivot detection more frequent, and more prone to false positives.
🔹 Accuracy Dashboard
The Accuracy Dashboard allows evaluating how accurate the detected patterns are as a percentage, with a pattern being judged accurate if subsequent patterns are detected higher or lower than a previous one.
For example, an internal pivot low is judged accurate if the following internal pivot is higher than it, indicating that higher highs have been made.
This dashboard can be useful to determine the timeframe setting to maximize the respective internal pivot accuracy.
🔶 SETTINGS
Timeframe: Timeframe for detecting internal swings
Accuracy Dashboard: Enable or disable the Accuracy Dashboard.
🔹 Style
Internal Pivot High: Color of the dot displayed upon the detection of an internal pivot high
Internal Pivot Low: Color of the dot displayed upon the detection of an internal pivot low
Zig-Zag: Color of the zig-zag segments connecting each internal pivot
Candles: Enable candle coloring, with control over the color of the candles highlighting the detected trend

Momentum Reversal StrategyBEST USE IN 15MIN TIME FRAME EURUSD / XAUSUD
1. Strategy Overview
This strategy hunts short-term momentum reversals at key levels during high-liquidity sessions.
Timeframes: 5-minute for entries; 15-minute for trend context
Sessions: London for EUR/USD & GBP/USD; New York for XAU/USD
Pairs: EUR/USD, GBP/USD, XAU/USD
Indicators (3 max):
EMA(20) and EMA(50) (close)
MACD (12, 26, 9) histogram
Optional: RSI(14) (for divergence filter)
2. Entry Rules
Trend Filter (15 min):
Long only if EMA20 > EMA50; short only if EMA20 < EMA50.
Price-Action Zone (5 min):
Identify recent swing high/low within past 20 bars.
Draw horizontal support (for longs) or resistance (for shorts).
Indicator Alignment (5 min):
MACD histogram crossing from negative to positive for longs, positive to negative for shorts.
Candle close beyond EMA20 in direction of trade.
Candle Confirmation:
Bullish engulfing or hammer at support for longs; bearish engulfing or shooting star at resistance for shorts.
Entry Execution:
Place market order on candle close that meets all above.
3. Exit Rules
Stop-Loss (SL):
Long: 1.5× ATR(14) below entry candle low.
Short: 1.5× ATR(14) above entry candle high.
Take-Profit (TP):
Set at 2× SL distance (RR 1:2).
Trailing SL:
After price moves 1× SL in profit, trail SL to breakeven.
Partial Booking:
Close 50% at 1× SL (50% of TP), move SL to entry.
Close remaining at full TP.
4. Trade Management
False Signal Filter: Skip trades when RSI(14) > 70 for longs or < 30 for shorts (avoids overbought/oversold extremes).
One Trade at a Time: No multiple positions on same pair.
Session Cutoff: Close any open trade 15 minutes before session end.
5. Risk Parameters
Risk per Trade: 1% of account equity.
Reward Target: ≥2% (1:2 RR) per trade.
Win-Rate Expectancy: ≥75% based on indicator confluence and price-action confirmation.

PRO Investing - LevelPRO Investing - Level
📊 Dynamic Support/Resistance
This indicator plots the PRO Investing Level, defined as the midpoint between the highest high and lowest low over the past 252 trading days (default lookback period, equivalent to ~1 year). It acts as a key mean-reversion reference level, useful for identifying potential support/resistance zones or market equilibrium levels.
Features:
🕰️ Option to display only today’s level or historical levels.
⚙️ Customizable lookback period for flexibility across timeframes and strategies.
📉 Teal line plotted directly on the chart, highlighting this institutional-grade level.
Ideal for traders looking to anchor price action to significant historical ranges—particularly useful in mean-reversion, breakout, or volatility compression strategies.

FVG Trailing Stop [LuxAlgo]The FVG Trailing Stop indicator tracks unmitigated Fair Value Gaps (FVG) data to produce a Trailing Stop indicator able to determine if the market is uptrending or downtrending easily.
🔶 USAGE
The FVG Trailing Stop is intended to identify trend directions through its position relative to the closing price:
Bullish: Price is located above the Trailing Stop, indicating that all Bearish FVGs have been mitigated and the trend is anticipated to continue upwards.
Bearish State: Price is located below the Trailing Stop, indicating that all Bullish FVGs have been mitigated and the trend is anticipated to continue downwards.
The Trailing Stop originates from two extremities obtained from the average of respective unmitigated FVGs. The specific directional average is also displayed as a more transparent secondary line, however, the trailing stop is derived from this value and a new trend will not be detected until the opposite directional average is crossed.
Price reaching the Trailing Stop is caused by retracements and can lead to the following scenarios:
Outcome 1: The directional average is crossed next, indicating a new trend direction.
Outcome 2: The directional average is held as support or resistance, leading to a new impulse and a continuation of the trend.
🔹 Reset on Cross
While price crossing the Trailing Stop should be considered as a sign of an upcoming trend change; it is possible for the price to still evolve outside it.
As a solution, we have included the "Reset on Cross" feature, which (as the name suggests) hides and resets the Trailing Stop each time it is crossed, leading to a "Neutral" state.
This opens the opportunity for the Trailing Stop to be displayed again once the price moves again in the direction of the pre-established trend. A trader might use this to accumulate positions within a specific trend.
🔶 DETAILS
The script uses a typical identification method for FVGs. Once identified, the script collects the point of the FVG farthest from the current price when formed.
For Upwards FVGs this is the bottom of the FVG.
For Downwards FVGs this is the top of the FVG.
The data is managed only to use the last input lookback of FVGs. If an FVG is mitigated, it frees up a spot in the memory for a new FVG, however, if the lookback is full, the oldest will be deleted.
From there, it uses a "trailing" logic only to move the Trailing Stop in one direction until the trailing stop resets or the direction flips.
The extremities used to calculate the Trailing Stop are created from 2 calculation steps, the first step involves taking the raw average of the FVG mitigation levels, and the second step applies a simple moving average (SMA) smoothing of the precedent-obtained averages.
🔶 SETTINGS
Unmitigated FVG Lookback: Sets the maximum number of Unmitigated FVGs that the script will use.
Smoothing Length: Sets the smoothing length for the Trailing Stop to reduce erratic results.
Reset on Cross: When enabled, hide and reset the Trailing Stop until the price starts moving in the pre-established trend direction again.

Market Sessions & Viewer Panel [By MUQWISHI]▋ INTRODUCTION :
The “Market Sessions & Viewer Panel” is a clean and intuitive visual indicator tool that highlights up to four trading sessions directly on the chart. Each session is fully customizable with its name, session time, and color. It also generates a panel that provides a quick-glance summary of each session’s candle/bar shape, helping traders gain insight into the volatility across all trading sessions.
_______________________
▋ OVERVIEW:
_______________________
▋ CREDIT:
This indicator utilizes the “ Timezone — Library ”. A huge thanks to @n00btraders for effort and well-organized work.
_______________________
▋ SESSION PANEL:
The Session Panel allows traders to visually compare session volatility using a candlestick/bar pattern.
Each bar represents the price action during a session and includes the session status, session name, closing price, change(%) from open, and a tooltip that reveals detailed OHLC and volume when hovered over.
Chart Type:
It offers two styles Bar or Candle to display based on traders’ preference
Sorting:
Allowing to arrange session candles/bars based on…
—Left to Right: The most recently opened on the left, moving backward in time to the right.
—Right to Left: The most recently opened on the right, moving backward in time to the left.
—Default: Arrange sessions in the user-defined input order.
_______________________
▋ CHART VISUALIZATION:
The chart visualization highlights each trading session using color-coded backgrounds in two selectable drawing styles that span their respective active timeframes. Each session block provides session’s name, close price, and change from open.
Chart Type: Candle
Chart Type: Box
Extra Drawing Feature:
This feature may not exist in other indicators within the same category, it extends the session block drawing to the projected end of the session. This's done through estimation based on historical data; however, it doesn’t function fully on seconds-based timeframes due to drawing limitations.
_______________________
▋ INDICATOR SETTINGS:
Section(1): Sessions
(1) Universal Timezone.
(2) Each Session: Enable/Disable, Name, Color, and Time.
Section(2): Session Panel
(1) Show/Hide Session Panel.
(2) Chart Type: Candle/Bar.
(3) Bar’s Up/Down color.
(4) Width and Height of the bar.
(5) Location of Session Panel on chat.
(6) Sort: Left to Right (most recent session is placed on the left), Right to Left (most recent session is placed on the right), and Default (as input arrangement).
Section(3): Chart Visualization
(1) Show/Hide Chart Block Visualization.
(2) Draw Shape: Box/Candle.
(3) Border Style and Size.
(4) Label Styling includes location, size, and some essential selectable infos.
Please let me know if you have any questions
