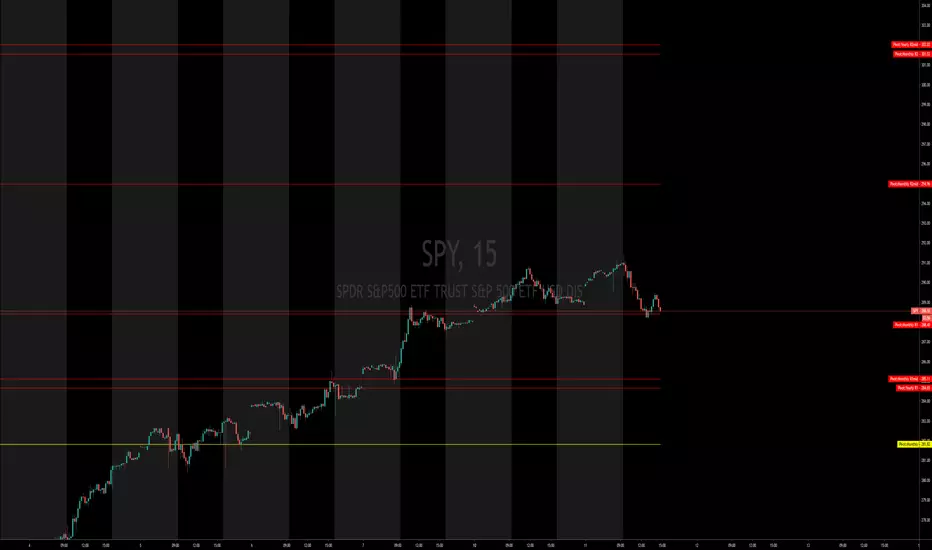
PivotWidthForNextSession@scorpiomanojFRMCalculates daily and weekly pivot width to assess next day's possible setup.
Also has features to plot daily and weekly pivot levels without charts.
It also plots 0.65 of 20 day average level of pivot width and 125% of 20 day average level of pivot width.
If pivot width is less than 0.65 of 20 day average level of pivot width, the possibility of a trending day can be seen in the following session.
If pivot width is more than 1.25 of 20 day average level of pivot width, the possibility of a ranging day can be seen in the following session.
Suggested settings:
The suggested settings are for assessing daily pivot width.
1) Inputs tab - Keep default settings
2) Setup tab - Ensure you uncheck every thing except the following :
a) Daily cpr width
b) 65% of 20 day average
c) 125% of 20 day average
Color combinations can be chosen for the above.
The preferred chart time frame is 5 min time frame.
Pivot

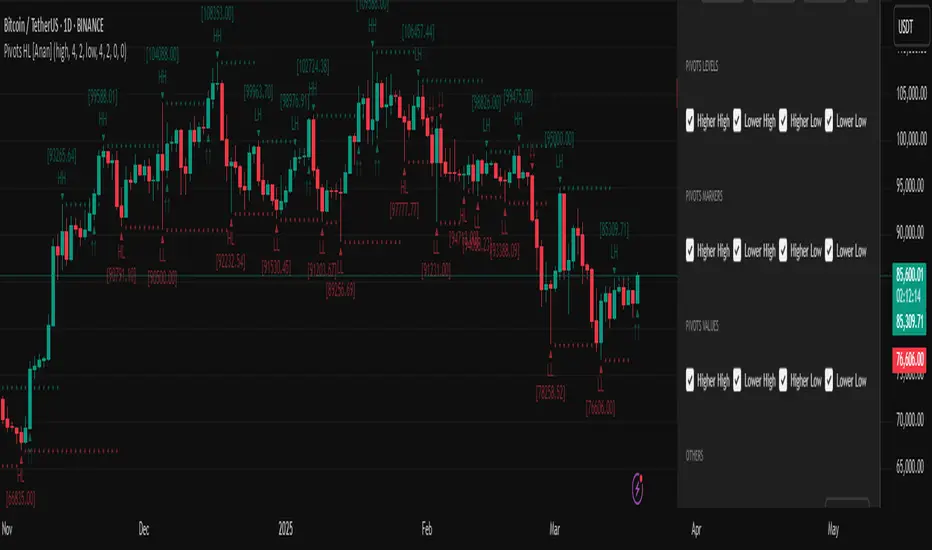
Pivot Points High Low (HH/HL/LH/LL) [Anan]Hello Friends,
This is my own version of ( Pivot Hilo Support n Resistance Levels R3-3 by JustUncleL )
- V4 Pinescript
- Removed MA dependency filters
- Add some arrows
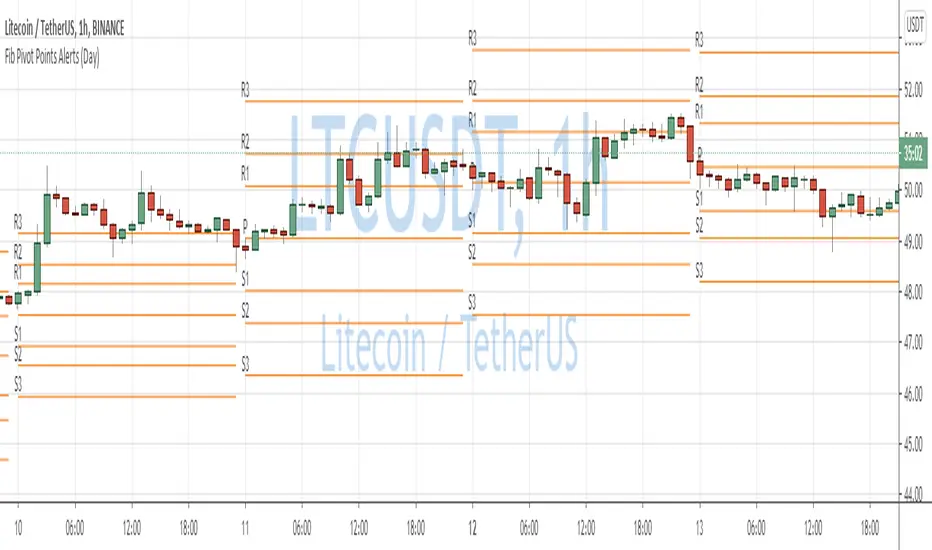
BOSS| FIBONACCIBOSS PRO TRADING SYSTEM INDICATORS
Used to determine directional movement and potential Fibonacci support/resistance levels.
Pivot Points use the prior period's high, low and close to estimate future support and resistance levels.
Set alerts for each individual fib and pivot, or set one alert for any fib or pivot cross.
Use Daily for lower time frames
Use Weekly for higher timeframes
Use monthly for 12H and up
Indicator Is a part of our PRO trading system.
Purchase System Here: bosscripts.com

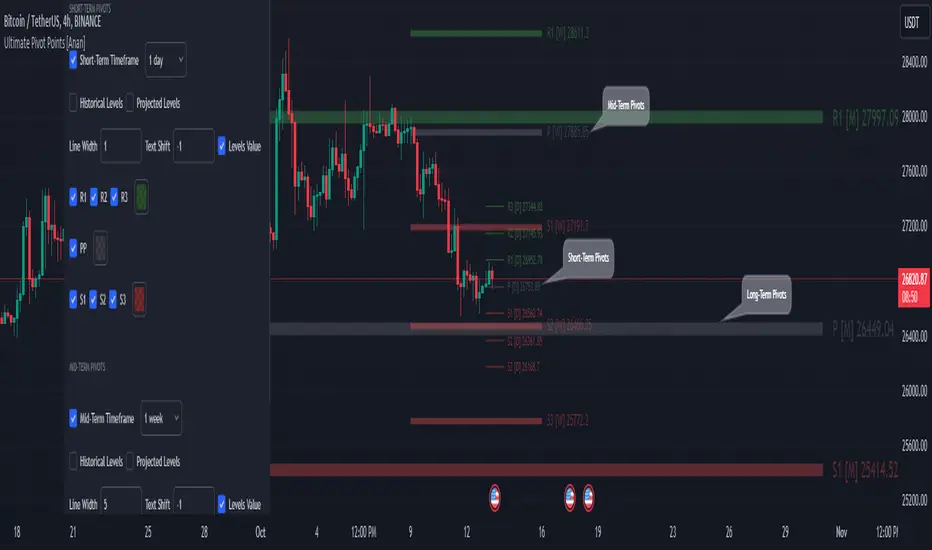
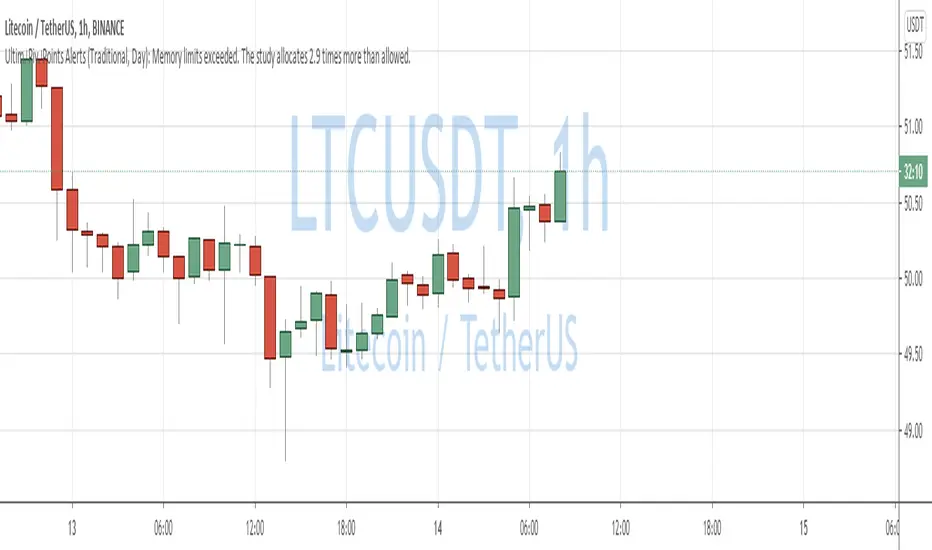
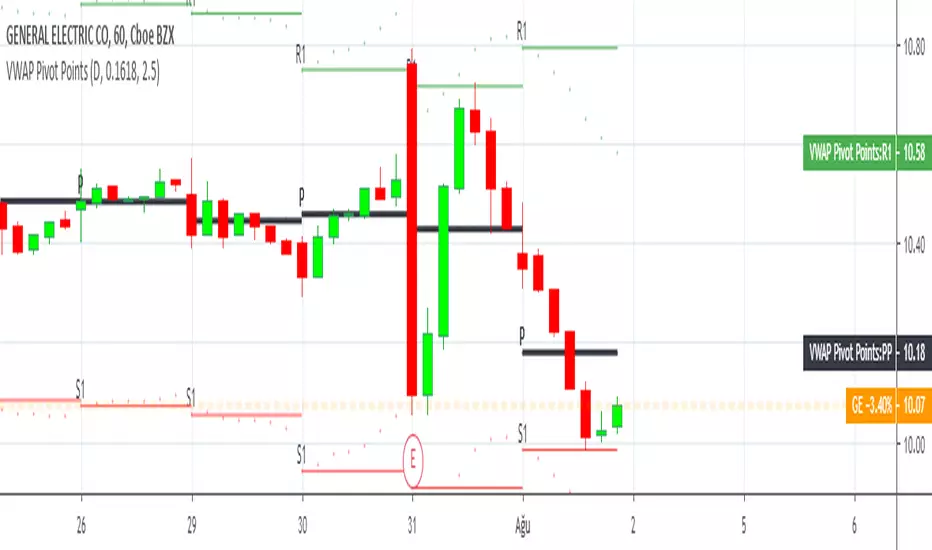
Ultimate Pivot Points [MTF/3in1/4Types/Projection/Alerts]-[Anan]Ultimate Pivot Points !
- V4 Pinescript.
- 4 Types of Pivot Points (Traditional , Fibonacci , Woodie , Camarilla ).
- Multi-time Frame: you can select Pivots Timeframe (1m, 3m ,5m,15m,30m,45m,1h,2h,3h,4h,1D,1W,1M).
- Three Pivot Points in one chart, I called them and they all have option to show or hide.
- Unlimited Number Of Pivots Back for all periods.
- Projection Pivot Points Levels.
- Each Pivot line have a label and value with period .
- Control with Line Width.
- Control with labels location with Text Shift Factor.
- Separate alerts for every Pivot Points levels.
Thanks QuantNomad for the inspiration.
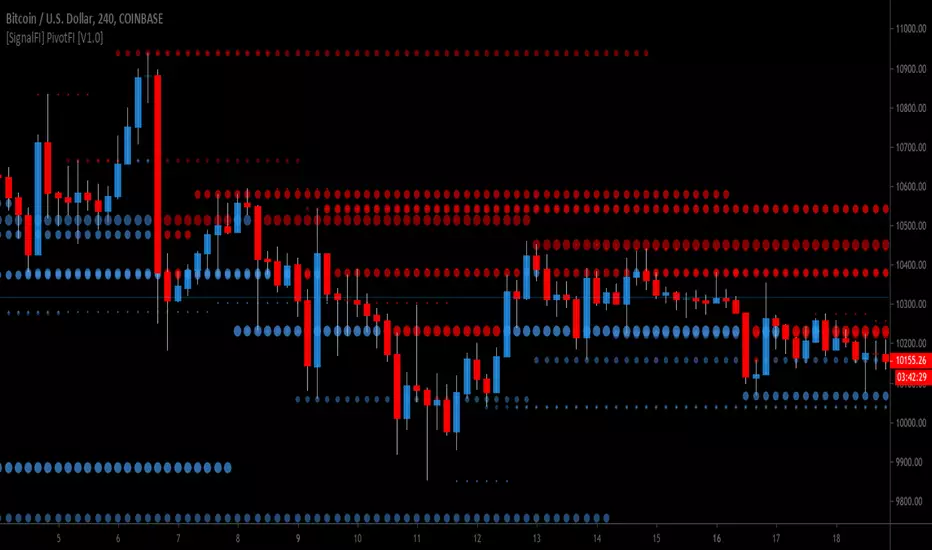
[SignalFI] PivotFI [V1.0]PivotFI provides support and resistance lines based on Fibonacci pivots lengths in any timeframe of your choosing.
Pivots included:
5,8,13,21,34,55
Timeframes:
Any
SignalFI was created to help traders and investors to effectively analyze the market based on the Golden Mean Ratio (Fibonacci numbers), plan a trade and ultimately execute it. To help inform and educate market decisions we developed a set of Trading Indicators which are available on TradingView , the most advanced and yet easy to use charting platform available on the web.
SignalFI indicators are just that, indicators. Our indicators are generally configured to use completely historical data (negating repaint), and we advise all alerts created with SignalFI indicators to be fired upon "close" of the current candle. Our indicators can provide valuable context and visualization support when performing market analysis and executing buy and sell decisions. However. we are not financial experts, and all information presented on this site or our other media outlets are for educational purposes only.
For subscription information, visit www.signalfi.net and follow us on twitter: @signalfi_
QuantNomad - Ultimate Pivot Points AlertsCreated a universal script for pivot points alerts.
In the script, you can choose one of 4 pivot point types: Traditional, Fibonacci, Woodie, and Camarilla.
You are able to create separate alerts for every level or create one for price crossing any level.
For separate levels, you can choose: "Cross", "Crossover" and "Crossunder".
You can also choose to show/hide:
Historical Levels
Levels Values
Current Levels - Levels calculated on the current period, on close of the period they will become valid levels for next periods. These levels do not participate in alerts calculations.
Because of some TradingView limitations, alerts won't be fired for the first bar of the session.
In the script used new v4 plotting features, so will be able to plot levels and labels nicely. Unfortunately, there is a limit on the number of consecutive lines you can plot on the plot (around 50), so historical lines in the past will disappear after 6-7 periods.
And remember:
Past performance does not guarantee future results.

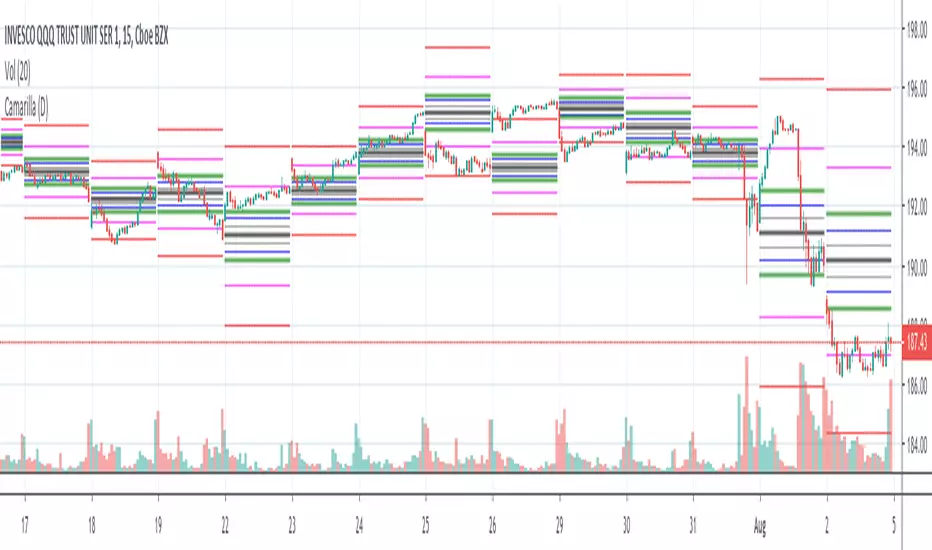
Camarilla Pivots (D,W,M) Secrets of a Pivot BossPrimarily for equities as no provision has been made to control the timing at which the open close high low are determined, indeed, I see no straightforward mechanism to do so in Pinescript.
Development aided by: but with the entirely different calculations presented in "Secrets of a Pivot Boss" by Franklin Ochoa. And far cleaner and less-redundant code.
To trade the indicator, watch the H3,H4,H5 and L3,L4,L5 bars. There are two built-in strategies. Depending on pivot width, sell at H3 and buy at L3 with stop at H4/L4 or above. For strongly trending environments: buy at H4, cover at H5--similarly for downtrends.

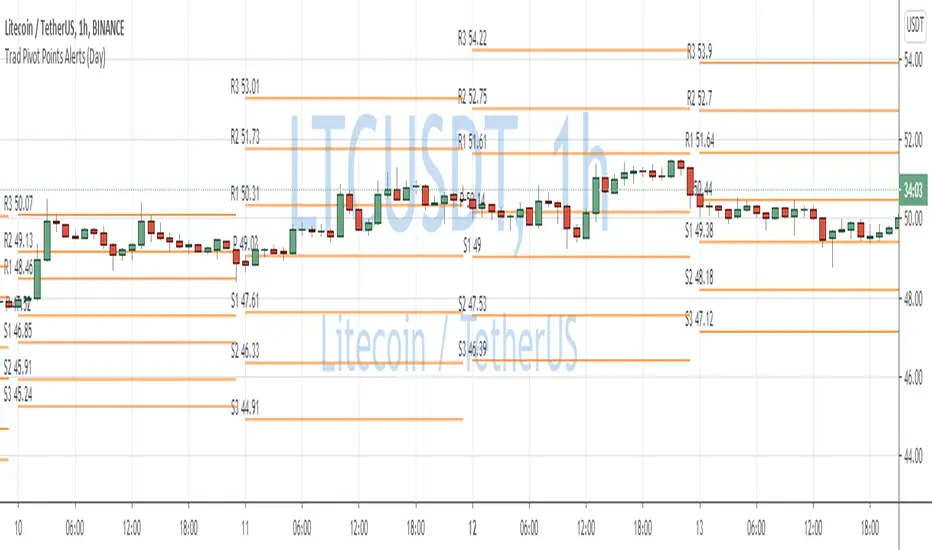
Traditional Pivot Points AlertsCreated a script for alerts on Traditional Pivot Points.
You will be able to create separate alerts for every level or create one for price crossing any level.
Because of some TradingView limitations, alerts won't be fired for the first bar of the session. Will try to solve that in the new versions.
In the script used new v4 plotting features, so will be able to plot levels and labels nicely. Unfortunately, there is a limit on the number of consecutive lines you can plot on the plot (around 50), so lines in the past will disappear.
You can enable/disable in params displaying level itself on the chart.
And remember:
Past performance does not guarantee future results.

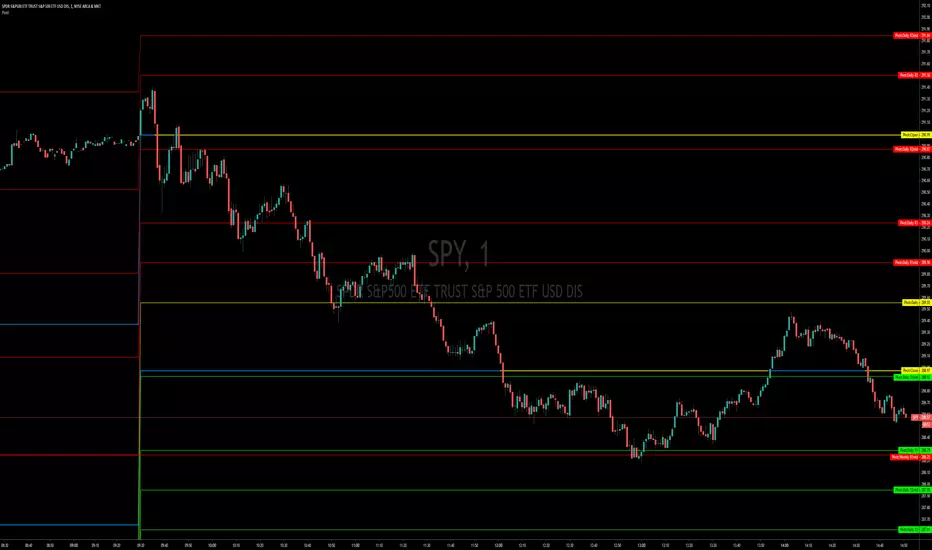
Pivot LevelsThis indicator automatically plots 3 important "Pivot Levels" to watch when day trading.
This simple but effective tool plots out important levels from the prior trading day, and updates every day. I noticed that significant levels such as the close, the high, and the low from the prior day often serve as important support/resistance levels in the future.
The previous day high is displayed as the green line, the close is displayed as the white line, and the low is plotted as the red line.
Enjoy!

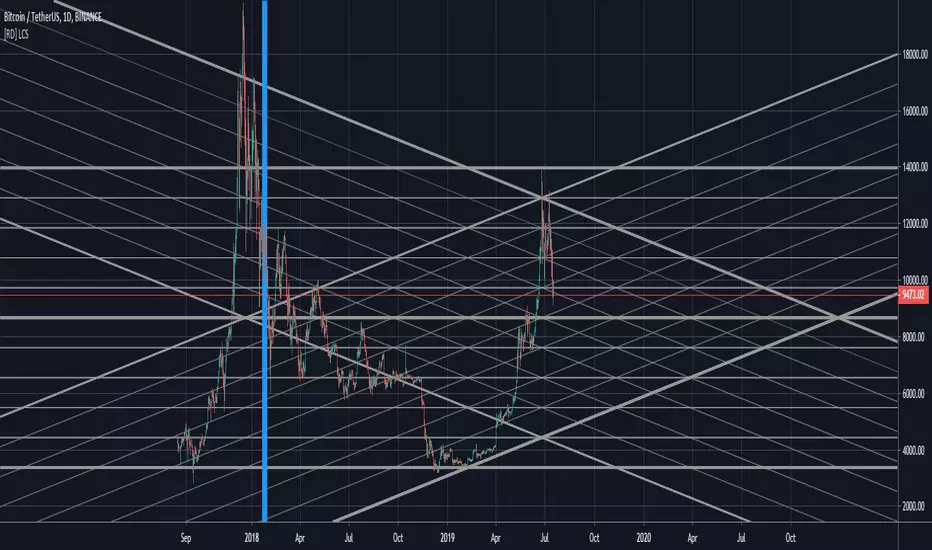
[RD] LCS - line channels (basic) v3 - [republish]==================================================================
July 18 2019 - LCS - line channels (basic) by RootDuk
Version : v3 - read the notes
==================================================================
Easy script to draw channels based on ie. GANN using the following
input params
- ibback : barsback to search for high and low
- ffactor : factor to up/downscale the lines
- oextend : extend lines, left, right, both, none
- bshowline : show horizontal lines yes/no
- bsshowdown : show diag down lines yes/no
- bsshowup : show diag up lines yes/no
- bshowindm : show index marker, where is you current ibback
===================================================================
Notes
===================================================================
When you use this code, pls let me know where and how you used it
as iam always curious what some can do with it. Thanks!
===================================================================
Updates
===================================================================
v1
v2 - July 17 2019
- Removed support wallets from source code. I think the source
- has been deleted because of this, find no other clue.
v3 - July 18 2019
- Republish
Fibonacci Pivot Points AlertsCreated a script for alerts on Fibonacci Pivot Points.
You will be able to create separate alerts for every level or create one for price crossing any level.
Because of some TradingView limitations, alerts won't be fired for the first bar of the session. Will try to solve that in the new versions.
In the script used new v4 plotting features, so will be able to plot levels and labels nicely. Unfortunately, there is a limit on the number of consecutive lines you can plot on the plot (around 50), so lines in the past will disappear.
And remember:
Past performance does not guarantee future results.
Very easy scalping indicator for non skilled traderThunderScalp is bundled indicator for scalping trader with simple usage and high winning rate. It works for any time frame.
The indicators are:
Humidity Pole Signal is Buy or Sell signal based on Humidity indicator or volume consolidation mapping
Interactive Signal is Buy or Sell signal based on Chart Pattern analyzer
Pivot Support and Resistance is candle support and resistance up to 3 layer for each
Fractal Support and resistance is support and resistance based on fractal candles
Scalping MA is moving average lines which best suite for scalping


QuantNomad - Pivot Points AlertsVery simple scripts that will allow you to receive alerts for new Pivot Lows/Highs Points.
A solid arrow points to actual point low/high point, transparent - to the bar, you'll receive alerts for (Shifter by rightBars).
And remember:
Past performance does not guarantee future results.


Pivot Points Monthly & YearlyMonthly and Yearly only
What is a Pivot Point?
A pivot point is a technical analysis indicator, or calculations, used to determine the overall trend of the market over different time frames. The pivot point itself is simply the average of the high, low and closing prices from the previous trading day. On the subsequent day, trading above the pivot point is thought to indicate ongoing bullish sentiment, while trading below the pivot point indicates bearish sentiment.
The pivot point is the basis for the indicator, but it also includes other support and resistance levels that are projected based on the pivot point calculation. All these levels help traders see where the price could experience support or resistance. Similarly, if the price moves through these levels it lets the trader know the price is trending in that direction.
When the price of an asset is trading above the pivot point, it indicates the day is bullish or positive.
When the price of an asset is trading below the pivot point, it indicates the day is bearish or negative.
The indicator typically includes four additional levels: S1, S2, R1, and R2. These stand for support one and two, and resistance one and two.
Support and resistance one and two may cause reversals, but they may also be used to confirm the trend. For example, if the price is falling and moves below S1, it helps confirm the downtrend and indicate a possible continuation to S2.
This Script includes the Mid Pivot Points, Open and Close levels
Pivot Points, Daily, Weekly, Open and Close lines What is a Pivot Point?
A pivot point is a technical analysis indicator, or calculations, used to determine the overall trend of the market over different time frames. The pivot point itself is simply the average of the high, low and closing prices from the previous trading day. On the subsequent day, trading above the pivot point is thought to indicate ongoing bullish sentiment, while trading below the pivot point indicates bearish sentiment.
The pivot point is the basis for the indicator, but it also includes other support and resistance levels that are projected based on the pivot point calculation. All these levels help traders see where the price could experience support or resistance. Similarly, if the price moves through these levels it lets the trader know the price is trending in that direction.
When the price of an asset is trading above the pivot point, it indicates the day is bullish or positive.
When the price of an asset is trading below the pivot point, it indicates the day is bearish or negative.
The indicator typically includes four additional levels: S1, S2, R1, and R2. These stand for support one and two, and resistance one and two.
Support and resistance one and two may cause reversals, but they may also be used to confirm the trend. For example, if the price is falling and moves below S1, it helps confirm the downtrend and indicate a possible continuation to S2.
This Script includes the Mid Pivot Points, Open and Close levels