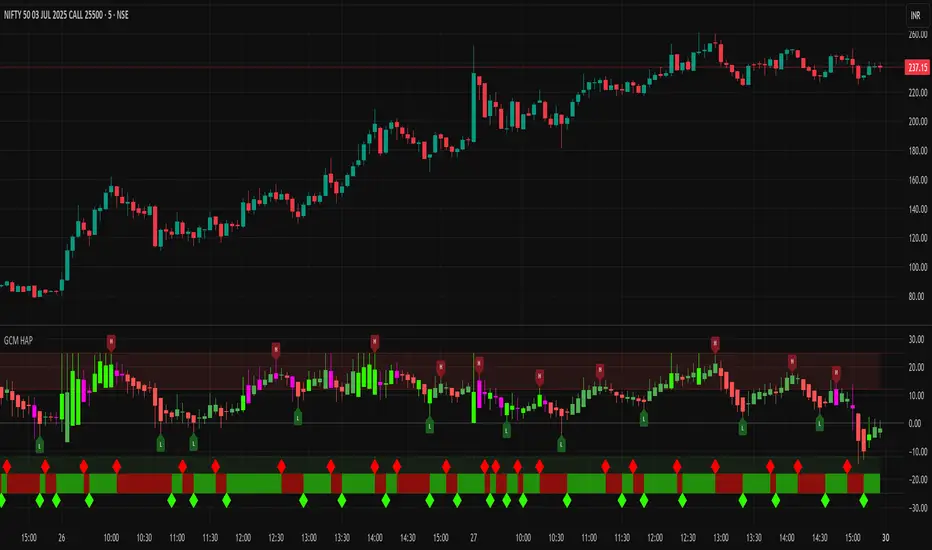
GCM Heikin Ashi with PivotsTitle: GCM Heikin Ashi with Pivots
Description:
Overview
This indicator provides a powerful combination of trend visualization, precise reversal signals, and volume confirmation in a clean, customizable sub-chart. It is designed to help traders identify trend momentum using Heikin Ashi candles, pinpoint confirmed swing highs and lows (pivots), and spot surges in buying pressure with our unique Volume Rate-of-Change (VROC) highlighter.
The key feature of this script is its non-repainting pivot signals. A pivot high or low is only confirmed and plotted after a specific number of subsequent bars have closed, ensuring the signals are reliable and do not change after they appear.
Key Features
Heikin Ashi Sub-Chart: Displays smoothed Heikin Ashi candles in a separate pane to clearly visualize trend strength and direction without cluttering the main price chart.
Non-Repainting Pivot Signals: Uses ta.pivothigh and ta.pivotlow to identify confirmed swing points. The signals will not repaint or move once they are printed on the chart.
Smart Volume Spike Analysis (VROC): A Heikin Ashi candle will be highlighted in a distinct bright green (#2dff00) when the volume increases significantly on a bullish price candle. This "volume-confirmed" candle can signal strong conviction behind a move.
Complete Label Customization: Take full control over the look and feel of your signals:
Label Mode: Choose between "High & Low" (H/L) or "Buy & Sell" (B/S) to match your trading terminology.
Custom Colors: Set unique colors for both the high and low pivot labels.
Label Style: Select from various shapes like boxes, circles, diamonds, or squares.
Label Size: Adjust the size of the labels from Tiny to Huge for perfect visibility.
Adjustable Pivot Sensitivity: Fine-tune the pivot detection algorithm by setting the number of bars required to the left (strength) and right (confirmation) of a pivot point.
How to Use & Interpret the Signals
Assess the Trend with Heikin Ashi:
A series of green HA candles with little to no lower wicks indicates strong bullish momentum.
A series of red HA candles with little to no upper wicks indicates strong bearish momentum.
Look for Volume Confirmation:
A bright green highlighted candle signals a surge in buying pressure (VROC spike). This adds significant weight to bullish moves and can act as a leading indicator for a new leg up.
Identify Entry/Exit Points with Pivot Labels:
An "L" or "B" label marks a confirmed swing low. This is a potential buying opportunity, especially if it is followed by green Heikin Ashi candles and, ideally, a bright green VROC spike candle.
An "H" or "S" label marks a confirmed swing high. This is a potential selling/shorting opportunity, especially as HA candles turn red.
Example Strategy (High-Confluence)
A powerful way to use this indicator is to look for a sequence of events:
Wait for a "Buy" (B) or "Low" (L) signal to appear, confirming a bottom has likely formed.
Wait for the first bright green VROC spike candle to appear after the signal. This confirms that buyers are stepping in with conviction.
Consider an entry based on this high-confluence setup, using the swing low as a potential stop-loss area.
Settings Explained
Pivot Detection:
Left Bars (Strength): Number of bars to the left of a pivot. A higher number finds more significant pivots.
Right Bars (Confirmation): Number of bars to the right required to confirm a pivot. This creates a lag for reliability.
Volume Spike Detection (VROC):
Enable Volume Spike Highlighting: Turn the bright green candle highlight on or off.
VROC Length: The lookback period for calculating the volume's rate of change.
VROC Threshold %: The percentage volume must increase to trigger a highlight.
Label Customization:
Label Text Mode: Choose between "High & Low" or "Buy & Sell".
Label Color, Style, and Size: Full cosmetic control for the pivot labels.
Final Note
This indicator is a tool to aid in technical analysis and should not be used as a standalone trading system. Always use it in conjunction with other analysis methods, proper risk management, and a sound trading plan.
Enjoy!
Điểm Pivot và cấp độ
SHA Multi Pivot Points -v1.0.0🔎Using Pivot Points in Trading
Traders use PPs to help determine predefined support and resistance levels to guide their trading strategies. In addition, traders identify potential price reversals, trend direction, and breakout opportunities:
Trend identification: PPs act as a reference level to gauge market sentiment. If the price opens above the PP and remains above it, traders interpret this as an uptrend. Conversely, if the price opens below the pivot point and stays below, it suggests a downtrend.
Support and resistance determination: Pivot levels are natural barriers where price reactions frequently occur. Traders may enter long positions near support levels, expecting a price bounce, or if the price approaches resistance levels, traders may consider shorting the asset.
Breakout trading: When the price breaks above resistance or support, it may indicate strong momentum for further movement.
Reversal identification: Traders also look for failed breakouts or price rejections at pivot levels to anticipate reversals.
Trading strategy combinations: Traders can improve accuracy by combining PPs with other technical analysis indicators.
1. Camarilla Pivot Points
📌 Overview:
Developed by Nick Scott in 1989, Camarilla Pivot Points are designed for short-term, intraday trading. Unlike traditional pivots, Camarilla levels are tighter and more responsive, making them useful in volatile markets.
📐 Key Levels:
It generates eight levels:
- Resistance: Initial Level (R1), Mid-range Level (R2), Sell Reversal Level (R3), Breakout Level (R4)
- Support: Initial Level (S1), Mid-range Level (S2), Buy Reversal Level (S3), Breakout Level (S4)
✅ How to Use:
- S1/R1 + RSI or volume divergence to confirm weak momentum and early reversals.
- S2/R2 with price action patterns to enter early on major moves before L3/H3 get tested.
- S3/R3: Mean-reversion zones → price often reverses.
- Break of S4/R4: Strong breakout → trend-following signal.
- Combine with volume or candlestick confirmation for entries.
🔹 2. Floor (Standard) Pivot Points
📌 Overview:
This is the most traditional pivot method, widely used by floor traders. It’s symmetrical and provides a clear central pivot point with equally spaced support and resistance levels.
📐 Key Levels:
- Povit Points : Average price (PPs)
- Resistance : First price ceiling (R1), Stronger ceiling (R2), Extreme resistance (R3)
- Support : First price floor (S1), Stronger floor (S2), Extreme support (S3)
✅ How to Use:
- Above PPs = bullish bias; Below PPs = bearish bias.
- S1/R1 are most used for intraday targets.
- S2–S3/R2–R3 indicate potential extreme moves.
- Often used in combination with momentum indicators.
🔹 3. Woodie Pivot Points
📌 Overview:
Woodie’s pivot formula gives double weight to the closing price, emphasizing the most recent session's sentiment.
📐 Key Levels:
- Povit Points : Weighted average (PPs)
- Resistance : First price ceiling (R1), Stronger resistance (R2)
- Support : First price floor (S1), Stronger support (S2)
✅ How to Use:
- Works best in fast-moving markets.
- PPs acts as a momentum-based balance level.
- Good for scalpers and momentum traders.
🔹 4. Fusion Pivot Points
📌 Overview:
This method differs significantly — it calculates only one support and one resistance level, adjusting based on the relationship between the open and close.
📐 Key Levels:
- Povit Points : Single directional (PPs)
- Resistance : Potential ceiling (R)
- Support : Potential floor (S)
✅ How to Use:
- Not symmetrical → more responsive to price behavior.
- Best for breakout or reversal strategies.
- Use when you're expecting directional momentum.
🔹 5. Classic Pivot Points (Traditional)
📌 Overview:
Also known as Standard or Traditional Pivot Points, this is the default method used by most charting platforms. It offers a balanced and simple framework.
📐 Key Levels:
- Povit Points : Central price level (PPs)
- Resistance : First ceiling (R1), Stronger resistance (R2), Extreme resistance (R3)
- Support : First floor (S1), Stronger floor (S2), Extreme support (S3)
✅ How to Use:
- PPs is the market’s equilibrium point.
- Helps define market structure, bias, and trade zones.
- Combine with order blocks, RSI, or MACD for confirmation.
📊 Summary Comparison :
1. Camarilla Pivot Points
- Focus : Mean Reversion & Breakouts
- Best Use : Scalping, Day Trading
2. Floor Pivot Points
- Focus : General Support/Resistance
- Best Use : Intraday, Swing
3. Woodie Pivot Points
- Focus : Recent Close Emphasis
- Best Use : Momentum Trading
4. Fusion Pivot Points
- Focus : Trend/Breakout
- Best Use : Directional Breakouts
5. Classic Povit Points
- Focus : Market Structure
- Best Use : General Use
⚠️ Disclaimer
The information and tools provided in this script are for educational and informational purposes only. They do not constitute financial advice, investment recommendations, or a solicitation to buy or sell any financial instrument.
Trading in the financial markets involves risk of loss and is not suitable for every investor. You are solely responsible for your trading decisions. Always do your own research, use proper risk management, and consult a licensed financial advisor before making any financial decisions.

HMA Swing Levels [BigBeluga]An advanced swing structure and trend-following tool built on Hull Moving Average logic, designed to detect major reversals and track dynamic support/resistance zones.
This indicator analyzes price swings using pivot highs/lows and a smoothed HMA trend baseline. It highlights key reversal levels and keeps them active until breached, giving traders a clear visual framework for price structure and trend alignment. The pivots are calculated in real-time using non-lagging logic, making them highly responsive to market conditions.
🔵 CONCEPTS
Combines a fast-reacting Hull Moving Average (HMA) with pivot logic to capture precise directional changes.
Detects non-lagging reversal highs and lows when pivot points form and the HMA direction flips.
Projects these reversal levels forward as horizontal support/resistance lines until broken by price.
Active trend is shown with a step-style trail line that reflects HMA bias over time.
🔵 FEATURES
Swing Level Detection:
Identifies high/low reversals when trend direction changes and plots horizontal zones.
Non-lagging logic of swing points detection:
if h == high and high < h and change > 0
// Detected Swing High
if l == low and low > l and change < 0
// Detected Swing Low
Persistent Support & Resistance Lines:
Each detected swing high or low is extended forward until price invalidates the level. Dotted style is applied once breached.
Color-Coded Trend Trail:
Displays a stepped trend trail using HMA slope: lime = uptrend, blue = downtrend.
Automatic Labeling:
Each reversal level is labeled with its price for clear reference.
Age-Based Line Thickness:
Every level increases in thickness every 250 bars. The longer the level lasts, the stronger it is.
🔵 HOW TO USE
Use green (support) and blue (resistance) levels to frame key reaction zones.
Trade with the trend defined by the trail color: lime for bullish bias, blue for bearish.
Explore where buy or sell orders are stacked
Look for breaks of swing lines to anticipate trend shifts or breakout setups.
Adjust the "Trend Change" input to tune the sensitivity of swing detection.
Adjust the "SwingLevels" input to define how far back to search for valid pivots.
🔵 CONCLUSION
HMA Swing Levels offers a hybrid approach to structural and trend-based trading. With automated non-lagging swing detection, persistent support/resistance tracking, and intuitive HMA-based trend coloring, it provides a powerful visual system for discretionary and systematic traders alike.

DP_MoneyFlow_Osc_V4**DP_Moneyflow_Osc_V4** is a custom, volume‐weighted momentum oscillator built around the classic Money Flow Index (MFI), with a few twists to help you spot more reliable reversal points:
***Best way to use it is to take the signals as alert points, to understand when money is starting to flow in or starting to flow out. It is not intended to be a Buy or Sell signal at the point of entry where the label is printed.***
1. **Core Calculation**
* Computes the standard MFI on your chart’s native timeframe:
* Money Flow = typical price (H+L+C)/3 × volume
* Segregates positive vs. negative flow based on whether price rose or fell on each bar
* Smooths each with an N-bar SMA, forms the ratio, and maps it into a 0–100 scale
2. **Inversion & Smoothing**
* You can **invert** the oscillator around 50 (so peaks become troughs and vice versa) with the **Reverse MFI** toggle.
* Applies two layers of smoothing (one for raw noise reduction, another for longer-term trend stability).
3. **Dynamic Coloring**
* Above Overbought (OB) threshold → solid red; below Oversold (OS) → solid green.
* In between, it linearly fades from red/green toward black as it approaches the 50 midpoint.
* **Invert Colors** flips the hue logic (red ↔ green) if you prefer.
4. **Overbought/Oversold Zones**
* Plots horizontal lines at your chosen OB/OS levels.
* Optionally fills the zone between them for quick visual reference.
5. **Peak/Trough Signal Labels**
* Detects **true extremes** by finding when the oscillator reverses direction right at or beyond your OB/OS levels.
* Prints a tiny “OB” or “OS” label **exactly at that pivot bar**, so you see the high or low of the swing.
6. **Alternation Toggle**
* Prevents two consecutive “OS” or “OB” labels by enforcing strict Buy/Sell alternation—turn this on or off via **Enable Signal Alternation**.
---
**Use-Case**: This oscillator excels at pinpointing the *tops* and *bottoms* of strong volume‐backed moves, giving you clear pivot markers rather than every threshold crossover. Tweak the smoothing and threshold inputs to calibrate sensitivity to your market and timeframe.

cd_cisd_market_CxHi Traders,
Overview:
Many traders follow market structure to identify the market direction and seek trade opportunities in line with the trend.
However, markings derived from user-defined inputs can create different structures, depending on personal choices. For instance, choosing a pivot distance of 3 instead of 2 alters the structure, even though the chart remains the same. Ideally, the structure should remain consistent.
"Change in State Delivery" ( CISD ) is a widely accepted concept among traders and is considered a significant indicator of market direction based on the gain/loss of CISD levels.
In this indicator, CISD is selected as the primary criterion for marking market structure, eliminating the influence of user-dependent variations.
Here is a summary of the key logic and rules applied:
• When the price forms a new high/low, that level is only considered a pivot if a CISD has occurred.
• A bullish CISD is always followed by a bearish CISD, and vice versa.
• Pivot points form the internal structure.
• The internal structure is used to interpret the swing structure.
• Probabilities are derived from internal structure patterns.
________________________________________
Details:
How is CISD determined?
As is commonly known:
• When price makes a new high, the opening level of the first candle in the consecutive bullish candle sequence is marked.
• When price makes a new low, the opening of the first candle in the consecutive bearish sequence is marked.
• If there’s only one candle in the sequence, its opening level is used.
In a bullish market, losing a bearish CISD level (i.e., a close below it) or in a bearish market, gaining a bullish CISD level (i.e., a close above it) is interpreted as a potential shift in buyer-seller dominance and a possible market reversal.
________________________________________
How are internal (pivot) levels determined?
• When price closes below a bearish CISD level, the highest candle's high becomes a pivot high (PH).
• When price closes above a bullish CISD level, the lowest candle's low becomes a pivot low (PL).
• If the new PH is above the previous PH, it’s labeled as HH (Higher High); otherwise, LH (Lower High).
• If the new PL is below the previous PL, it’s labeled as LL (Lower Low); otherwise, HL (Higher Low).
________________________________________
Internal Market Structure:
• A series of HHs indicates a bullish internal structure.
• A series of LLs indicates a bearish internal structure.
________________________________________
Swing (Main) Market Structure:
Using internal pivots and previous swing levels, the main market structure is derived.
• A new swing high (SH) requires the price to move above the previous SH.
• A new swing low (SL) requires the price to move below the previous SL.
________________________________________
Probability Calculation:
Pivot levels forming the internal structure are coded as five-element sequences.
There are 64 possible combinations of such sequences made from consecutive PH and PL values.
Each pattern’s frequency from its starting candle is tracked.
To make it more understandable:
For example, after the four-sequence “HH, LL, LH,HL”, either HH or LH might follow.
The table shows the statistical likelihood of both possible outcomes for the most recent four-element sequence on the chart.
________________________________________
How reliable is it?
To assess reliability, results are calculated from the beginning using:
Success Rate (Suc. Rt) = Number of Correct Predictions / Total Predictions
This value is added to the table for reference.
It’s important to note that no statistical outcome guarantees certainty—every result offers a different interpretation. What truly matters is to avoid getting stopped out 😊.
________________________________________
Menu Options:
Show/hide preferences and color selections can be customized via the indicator menu.
________________________________________
What’s Coming in Future Versions?
Features such as FVG (Fair Value Gaps) between swing levels, volume imbalances, order blocks / mitigation blocks, Fibonacci levels, and relevant trade suggestions will be added.
________________________________________
This is a BETA version that I believe will help simplify your market reading. I’d be happy to hear your feedback and suggestions.
Cheerful Trading!

SMT DivergenceSMT Divergence Indicator
This powerful indicator identifies high-probability reversal points by detecting SMT (Smart Money Technique) divergences between two correlated assets. It spots subtle shifts in market momentum, revealing when one asset fails to confirm the price action of another—often signaling an impending trend change.
Key Features:
Inter-Market Divergence Detection: Automatically compares the price action of the main symbol with a second user-defined asset.
Identifies Key Reversals: Pinpoints both bullish and bearish SMT divergences, highlighting hidden strength in downtrends and underlying weakness in uptrends.
Customizable Pivot Detection: Allows fine-tuning of the pivot length to adjust sensitivity for different market conditions and timeframes.
Flexible Display Modes: Choose between clean 'Lines' connecting the diverging pivots or precise 'Labels' marking the exact high/low points.
Full Visual Customization: Complete control over the colors and line thickness for seamless integration with your existing chart layout.
Built-in Alerts: Stay notified of every potential opportunity with alerts for both bullish and bearish signals.
Settings:
Core Parameters:
Comparison Symbol: Select the second asset to compare against for divergence analysis (e.g., NQ1! if you are charting ES1!).
Pivot Length: Defines the number of bars to the left and right required to confirm a pivot high or low.
Visual Settings:
Display Style: Choose to visualize divergences as 'Lines' or 'Labels'.
Bearish/Bullish Color: Set custom colors for bearish and bullish divergence indicators.
Line Width: Adjust the thickness of the divergence lines for optimal visibility.
Perfect for traders who utilize inter-market analysis to confirm trade ideas. The SMT Divergence indicator provides a crucial edge by exposing non-confirmations between related assets, allowing for earlier and more confident entries into potential market reversals.

The Butterfly [theUltimator5]This is a technical analysis tool designed to automatically detect and visualize Butterfly harmonic patterns based on recent market pivot structures. This indicator uses a unique plotting and detection algorithm to find and display valid Butterfly patterns on the chart.
The indicator works in real-time and historically by identifying major swing highs and lows (pivots) based on a user-defined ZigZag length. It then evaluates whether the most recent price structure conforms to the ideal proportions of a bullish or bearish Butterfly pattern. If the ratios between price legs XA, AB, BC, and projected CD meet defined tolerances, the pattern is plotted on the chart along with a projected D point for potential reversal.
Key Features:
Automatic Pivot Detection: The script analyzes recent price action to construct a ZigZag pattern, identifying swing points as potential X, A, B, and C coordinates.
Butterfly Pattern Validation: The pattern is validated against traditional Fibonacci ratios:
--AB should be approximately 78.6% of XA.
--BC must lie between 38.2% and 88.6% of AB.
--CD is projected as a multiple of BC, with user control over the ratio (e.g., 1.618–2.24).
Bullish and Bearish Recognition: The pattern logic detects both bullish and bearish Butterflies, automatically adjusting plotting direction and color themes.
Custom Ratio Tolerance: Users can define how strictly the AB/XA and BC/AB legs must adhere to ideal ratios, using a percentage-based tolerance slider.
Fallback Detection Logic: If a new pattern is not identified in recent bars, the script performs a backward search on the last four pivots to find the most recent valid pattern.
Force Mode: A toggle allows users to force the drawing of a Butterfly pattern on the most recent pivot structure, regardless of whether the ideal Fibonacci rules are satisfied.
Dynamic Visualization:
--Clear labeling of X, A, B, C, and D points.
--Colored connecting lines and filled triangles to visualize structure.
--Optional table displaying key Fibonacci ratios and how close each leg is to ideal values.
Inputs:
Length: Controls the sensitivity of the ZigZag pivots. Smaller values result in more frequent pivots.
Tolerance (%): Adjustable threshold for acceptable deviation in AB/XA and BC/AB ratios.
CD Length Multiplier: Projects point D by multiplying the BC leg using a value between 1.618 and 2.24.
Force New Pattern: Overrides validation checks to display a Butterfly structure on recent pivots regardless of ratio accuracy.
Show Table: Enables a table showing calculated ratios and deviations from the ideal.

Murrey Math Lines v6Murrey Math Lines v6
This is not just another Murrey Math indicator. It's a complete, ground-up modernization of the classic concept, rebuilt with the latest Pine Script features for unparalleled performance, accuracy, and usability. While preserving the core mathematical genius of T.H. Murrey's system, this version introduces a suite of modern tools designed for today's trader.
What are Murrey Math Lines?
Murrey Math Lines (MML) are a powerful system of support and resistance based on geometric formulas developed by T.H. Murrey. As a derivation of W.D. Gann's observations, Murrey's geometry simplifies Gann's theories into a more accessible application. The core principle is that price action tends to trend and retrace in 1/8th intervals.
These intervals create a "trading octave" with distinct levels, each having its own characteristic behavior:
& - Ultimate Resistance & Support: These lines are the hardest to break. They represent the top and bottom of the expected price range and are prime areas for reversals.
- Major Pivot: This is the most significant level, offering the strongest support and resistance within the octave. Price has a high probability of stopping and reversing here.
& - Strong Pivot/Reversal: These are strong, secondary pivot points where price often struggles to pass through.
& - The Trading Range: The price tends to consolidate between these two lines about 50% of the time. A decisive break outside this range often signals the start of a new trend.
& - Weak Support/Resistance: These levels are weaker, but when price moves too quickly towards them, they can act as initial stopping points or areas for a minor reversal.
& - Extended Octave: These lines show extreme overbought and oversold conditions beyond the primary 0/8 to 8/8 octave.
Modern Enhancements in This Version
Session-Locked Precision: Anchor the Murrey Lines to the start of a specific trading session (e.g., NYSE open). The levels remain constant for the entire session, providing a stable and reliable framework for your daily analysis.
Visual Trading & Reversal Zones: Instead of just lines, this indicator can fill the key trading range (3/8 to 5/8) and reversal zones (0/8-1/8 & 7/8-8/8) with color, giving you an instant visual reference of market sentiment.
Dynamic "Closest Price" Labels: Declutter your chart! The indicator can intelligently display only the label for the Murrey level closest to the current price, keeping your view clean while providing critical information at a glance.
Integrated Alert System: Never miss a key level touch again. Set up alerts for when the price approaches major lines, the trading range, or all lines, customized to your trading style.
Advanced Pine Script Engine: Built on a modern codebase using User-Defined Types and dynamic drawing objects (line, box, label). This ensures the indicator is fast, efficient, and non-repainting, even on lower timeframes.
Intuitive User Interface: Settings are neatly organized into collapsible groups with clear tooltips, making it incredibly easy to customize every aspect of the indicator, from calculation parameters to colors.
A Note on Accuracy
Some of the other Murrey Math indicators on TradingView use different formulas and therefore produce varying results. This version has been carefully checked against MML indicators on other professional platforms to ensure its calculations are accurate and reliable.
Credits
This indicator is a complete overhaul and modernization of the original "MM Lines " script. Full credit for the original calculation logic and concept goes to its author, JRL_6.

Grothendieck-Teichmüller Geometric SynthesisDskyz's Grothendieck-Teichmüller Geometric Synthesis (GTGS)
THEORETICAL FOUNDATION: A SYMPHONY OF GEOMETRIES
The 🎓 GTGS is built upon a revolutionary premise: that market dynamics can be modeled as geometric and topological structures. While not a literal academic implementation—such a task would demand computational power far beyond current trading platforms—it leverages core ideas from advanced mathematical theories as powerful analogies and frameworks for its algorithms. Each component translates an abstract concept into a practical market calculation, distinguishing GTGS by identifying deeper structural patterns rather than relying on standard statistical measures.
1. Grothendieck-Teichmüller Theory: Deforming Market Structure
The Theory : Studies symmetries and deformations of geometric objects, focusing on the "absolute" structure of mathematical spaces.
Indicator Analogy : The calculate_grothendieck_field function models price action as a "deformation" from its immediate state. Using the nth root of price ratios (math.pow(price_ratio, 1.0/prime)), it measures market "shape" stretching or compression, revealing underlying tensions and potential shifts.
2. Topos Theory & Sheaf Cohomology: From Local to Global Patterns
The Theory : A framework for assembling local properties into a global picture, with cohomology measuring "obstructions" to consistency.
Indicator Analogy : The calculate_topos_coherence function uses sine waves (math.sin) to represent local price "sections." Summing these yields a "cohomology" value, quantifying price action consistency. High values indicate coherent trends; low values signal conflict and uncertainty.
3. Tropical Geometry: Simplifying Complexity
The Theory : Transforms complex multiplicative problems into simpler, additive, piecewise-linear ones using min(a, b) for addition and a + b for multiplication.
Indicator Analogy : The calculate_tropical_metric function applies tropical_add(a, b) => math.min(a, b) to identify the "lowest energy" state among recent price points, pinpointing critical support levels non-linearly.
4. Motivic Cohomology & Non-Commutative Geometry
The Theory : Studies deep arithmetic and quantum-like properties of geometric spaces.
Indicator Analogy : The motivic_rank and spectral_triple functions compute weighted sums of historical prices to capture market "arithmetic complexity" and "spectral signature." Higher values reflect structured, harmonic price movements.
5. Perfectoid Spaces & Homotopy Type Theory
The Theory : Abstract fields dealing with p-adic numbers and logical foundations of mathematics.
Indicator Analogy : The perfectoid_conv and type_coherence functions analyze price convergence and path identity, assessing the "fractal dust" of price differences and price path cohesion, adding fractal and logical analysis.
The Combination is Key : No single theory dominates. GTGS ’s Unified Field synthesizes all seven perspectives into a comprehensive score, ensuring signals reflect deep structural alignment across mathematical domains.
🎛️ INPUTS: CONFIGURING THE GEOMETRIC ENGINE
The GTGS offers a suite of customizable inputs, allowing traders to tailor its behavior to specific timeframes, market sectors, and trading styles. Below is a detailed breakdown of key input groups, their functionality, and optimization strategies, leveraging provided tooltips for precision.
Grothendieck-Teichmüller Theory Inputs
🧬 Deformation Depth (Absolute Galois) :
What It Is : Controls the depth of Galois group deformations analyzed in market structure.
How It Works : Measures price action deformations under automorphisms of the absolute Galois group, capturing market symmetries.
Optimization :
Higher Values (15-20) : Captures deeper symmetries, ideal for major trends in swing trading (4H-1D).
Lower Values (3-8) : Responsive to local deformations, suited for scalping (1-5min).
Timeframes :
Scalping (1-5min) : 3-6 for quick local shifts.
Day Trading (15min-1H) : 8-12 for balanced analysis.
Swing Trading (4H-1D) : 12-20 for deep structural trends.
Sectors :
Stocks : Use 8-12 for stable trends.
Crypto : 3-8 for volatile, short-term moves.
Forex : 12-15 for smooth, cyclical patterns.
Pro Tip : Increase in trending markets to filter noise; decrease in choppy markets for sensitivity.
🗼 Teichmüller Tower Height :
What It Is : Determines the height of the Teichmüller modular tower for hierarchical pattern detection.
How It Works : Builds modular levels to identify nested market patterns.
Optimization :
Higher Values (6-8) : Detects complex fractals, ideal for swing trading.
Lower Values (2-4) : Focuses on primary patterns, faster for scalping.
Timeframes :
Scalping : 2-3 for speed.
Day Trading : 4-5 for balanced patterns.
Swing Trading : 5-8 for deep fractals.
Sectors :
Indices : 5-8 for robust, long-term patterns.
Crypto : 2-4 for rapid shifts.
Commodities : 4-6 for cyclical trends.
Pro Tip : Higher towers reveal hidden fractals but may slow computation; adjust based on hardware.
🔢 Galois Prime Base :
What It Is : Sets the prime base for Galois field computations.
How It Works : Defines the field extension characteristic for market analysis.
Optimization :
Prime Characteristics :
2 : Binary markets (up/down).
3 : Ternary states (bull/bear/neutral).
5 : Pentagonal symmetry (Elliott waves).
7 : Heptagonal cycles (weekly patterns).
11,13,17,19 : Higher-order patterns.
Timeframes :
Scalping/Day Trading : 2 or 3 for simplicity.
Swing Trading : 5 or 7 for wave or cycle detection.
Sectors :
Forex : 5 for Elliott wave alignment.
Stocks : 7 for weekly cycle consistency.
Crypto : 3 for volatile state shifts.
Pro Tip : Use 7 for most markets; 5 for Elliott wave traders.
Topos Theory & Sheaf Cohomology Inputs
🏛️ Temporal Site Size :
What It Is : Defines the number of time points in the topological site.
How It Works : Sets the local neighborhood for sheaf computations, affecting cohomology smoothness.
Optimization :
Higher Values (30-50) : Smoother cohomology, better for trends in swing trading.
Lower Values (5-15) : Responsive, ideal for reversals in scalping.
Timeframes :
Scalping : 5-10 for quick responses.
Day Trading : 15-25 for balanced analysis.
Swing Trading : 25-50 for smooth trends.
Sectors :
Stocks : 25-35 for stable trends.
Crypto : 5-15 for volatility.
Forex : 20-30 for smooth cycles.
Pro Tip : Match site size to your average holding period in bars for optimal coherence.
📐 Sheaf Cohomology Degree :
What It Is : Sets the maximum degree of cohomology groups computed.
How It Works : Higher degrees capture complex topological obstructions.
Optimization :
Degree Meanings :
1 : Simple obstructions (basic support/resistance).
2 : Cohomological pairs (double tops/bottoms).
3 : Triple intersections (complex patterns).
4-5 : Higher-order structures (rare events).
Timeframes :
Scalping/Day Trading : 1-2 for simplicity.
Swing Trading : 3 for complex patterns.
Sectors :
Indices : 2-3 for robust patterns.
Crypto : 1-2 for rapid shifts.
Commodities : 3-4 for cyclical events.
Pro Tip : Degree 3 is optimal for most trading; higher degrees for research or rare event detection.
🌐 Grothendieck Topology :
What It Is : Chooses the Grothendieck topology for the site.
How It Works : Affects how local data integrates into global patterns.
Optimization :
Topology Characteristics :
Étale : Finest topology, captures local-global principles.
Nisnevich : A1-invariant, good for trends.
Zariski : Coarse but robust, filters noise.
Fpqc : Faithfully flat, highly sensitive.
Sectors :
Stocks : Zariski for stability.
Crypto : Étale for sensitivity.
Forex : Nisnevich for smooth trends.
Indices : Zariski for robustness.
Timeframes :
Scalping : Étale for precision.
Swing Trading : Nisnevich or Zariski for reliability.
Pro Tip : Start with Étale for precision; switch to Zariski in noisy markets.
Unified Field Configuration Inputs
⚛️ Field Coupling Constant :
What It Is : Sets the interaction strength between geometric components.
How It Works : Controls signal amplification in the unified field equation.
Optimization :
Higher Values (0.5-1.0) : Strong coupling, amplified signals for ranging markets.
Lower Values (0.001-0.1) : Subtle signals for trending markets.
Timeframes :
Scalping : 0.5-0.8 for quick, strong signals.
Swing Trading : 0.1-0.3 for trend confirmation.
Sectors :
Crypto : 0.5-1.0 for volatility.
Stocks : 0.1-0.3 for stability.
Forex : 0.3-0.5 for balance.
Pro Tip : Default 0.137 (fine structure constant) is a balanced starting point; adjust up in choppy markets.
📐 Geometric Weighting Scheme :
What It Is : Determines the framework for combining geometric components.
How It Works : Adjusts emphasis on different mathematical structures.
Optimization :
Scheme Characteristics :
Canonical : Equal weighting, balanced.
Derived : Emphasizes higher-order structures.
Motivic : Prioritizes arithmetic properties.
Spectral : Focuses on frequency domain.
Sectors :
Stocks : Canonical for balance.
Crypto : Spectral for volatility.
Forex : Derived for structured moves.
Indices : Motivic for arithmetic cycles.
Timeframes :
Day Trading : Canonical or Derived for flexibility.
Swing Trading : Motivic for long-term cycles.
Pro Tip : Start with Canonical; experiment with Spectral in volatile markets.
Dashboard and Visual Configuration Inputs
📋 Show Enhanced Dashboard, 📏 Size, 📍 Position :
What They Are : Control dashboard visibility, size, and placement.
How They Work : Display key metrics like Unified Field , Resonance , and Signal Quality .
Optimization :
Scalping : Small size, Bottom Right for minimal chart obstruction.
Swing Trading : Large size, Top Right for detailed analysis.
Sectors : Universal across markets; adjust size based on screen setup.
Pro Tip : Use Large for analysis, Small for live trading.
📐 Show Motivic Cohomology Bands, 🌊 Morphism Flow, 🔮 Future Projection, 🔷 Holographic Mesh, ⚛️ Spectral Flow :
What They Are : Toggle visual elements representing mathematical calculations.
How They Work : Provide intuitive representations of market dynamics.
Optimization :
Timeframes :
Scalping : Enable Morphism Flow and Spectral Flow for momentum.
Swing Trading : Enable all for comprehensive analysis.
Sectors :
Crypto : Emphasize Morphism Flow and Future Projection for volatility.
Stocks : Focus on Cohomology Bands for stable trends.
Pro Tip : Disable non-essential visuals in fast markets to reduce clutter.
🌫️ Field Transparency, 🔄 Web Recursion Depth, 🎨 Mesh Color Scheme :
What They Are : Adjust visual clarity, complexity, and color.
How They Work : Enhance interpretability of visual elements.
Optimization :
Transparency : 30-50 for balanced visibility; lower for analysis.
Recursion Depth : 6-8 for balanced detail; lower for older hardware.
Color Scheme :
Purple/Blue : Analytical focus.
Green/Orange : Trading momentum.
Pro Tip : Use Neon Purple for deep analysis; Neon Green for active trading.
⏱️ Minimum Bars Between Signals :
What It Is : Minimum number of bars required between consecutive signals.
How It Works : Prevents signal clustering by enforcing a cooldown period.
Optimization :
Higher Values (10-20) : Fewer signals, avoids whipsaws, suited for swing trading.
Lower Values (0-5) : More responsive, allows quick reversals, ideal for scalping.
Timeframes :
Scalping : 0-2 bars for rapid signals.
Day Trading : 3-5 bars for balance.
Swing Trading : 5-10 bars for stability.
Sectors :
Crypto : 0-3 for volatility.
Stocks : 5-10 for trend clarity.
Forex : 3-7 for cyclical moves.
Pro Tip : Increase in choppy markets to filter noise.
Hardcoded Parameters
Tropical, Motivic, Spectral, Perfectoid, Homotopy Inputs : Fixed to optimize performance but influence calculations (e.g., tropical_degree=4 for support levels, perfectoid_prime=5 for convergence).
Optimization : Experiment with codebase modifications if advanced customization is needed, but defaults are robust across markets.
🎨 ADVANCED VISUAL SYSTEM: TRADING IN A GEOMETRIC UNIVERSE
The GTTMTSF ’s visuals are direct representations of its mathematics, designed for intuitive and precise trading decisions.
Motivic Cohomology Bands :
What They Are : Dynamic bands ( H⁰ , H¹ , H² ) representing cohomological support/resistance.
Color & Meaning : Colors reflect energy levels ( H⁰ tightest, H² widest). Breaks into H¹ signal momentum; H² touches suggest reversals.
How to Trade : Use for stop-loss/profit-taking. Band bounces with Dashboard confirmation are high-probability setups.
Morphism Flow (Webbing) :
What It Is : White particle streams visualizing market momentum.
Interpretation : Dense flows indicate strong trends; sparse flows signal consolidation.
How to Trade : Follow dominant flow direction; new flows post-consolidation signal trend starts.
Future Projection Web (Fractal Grid) :
What It Is : Fibonacci-period fractal projections of support/resistance.
Color & Meaning : Three-layer lines (white shadow, glow, colored quantum) with labels showing price, topological class, anomaly strength (φ), resonance (ρ), and obstruction ( H¹ ). ⚡ marks extreme anomalies.
How to Trade : Target ⚡/● levels for entries/exits. High-anomaly levels with weakening Unified Field are reversal setups.
Holographic Mesh & Spectral Flow :
What They Are : Visuals of harmonic interference and spectral energy.
How to Trade : Bright mesh nodes or strong Spectral Flow warn of building pressure before price movement.
📊 THE GEOMETRIC DASHBOARD: YOUR MISSION CONTROL
The Dashboard translates complex mathematics into actionable intelligence.
Unified Field & Signals :
FIELD : Master value (-10 to +10), synthesizing all geometric components. Extreme readings (>5 or <-5) signal structural limits, often preceding reversals or continuations.
RESONANCE : Measures harmony between geometric field and price-volume momentum. Positive amplifies bullish moves; negative amplifies bearish moves.
SIGNAL QUALITY : Confidence meter rating alignment. Trade only STRONG or EXCEPTIONAL signals for high-probability setups.
Geometric Components :
What They Are : Breakdown of seven mathematical engines.
How to Use : Watch for convergence. A strong Unified Field is reliable when components (e.g., Grothendieck , Topos , Motivic ) align. Divergence warns of trend weakening.
Signal Performance :
What It Is : Tracks indicator signal performance.
How to Use : Assesses real-time performance to build confidence and understand system behavior.
🚀 DEVELOPMENT & UNIQUENESS: BEYOND CONVENTIONAL ANALYSIS
The GTTMTSF was developed to analyze markets as evolving geometric objects, not statistical time-series.
Why This Is Unlike Anything Else :
Theoretical Depth : Uses geometry and topology, identifying patterns invisible to statistical tools.
Holistic Synthesis : Integrates seven deep mathematical frameworks into a cohesive Unified Field .
Creative Implementation : Translates PhD-level mathematics into functional Pine Script , blending theory and practice.
Immersive Visualization : Transforms charts into dynamic geometric landscapes for intuitive market understanding.
The GTTMTSF is more than an indicator; it’s a new lens for viewing markets, for traders seeking deeper insight into hidden order within chaos.
" Where there is matter, there is geometry. " - Johannes Kepler
— Dskyz , Trade with insight. Trade with anticipation.

Market Sell-Off GaugeOVERVIEW
The Market Sell‑Off Gauge identifies high‑conviction, risk‑off entry opportunities by detecting broad market sell‑off behavior and rising stablecoin dominance, then confirming risk‑off sentiment via NDX weakness, VIX spikes, and elevated volume. It uses fuzzy logic and sigmoid scaling to convert raw signals into a smooth, bounded metric.
FEATURES
Sell‑Off Detection - calculates percentage drops in the primary asset over a user‑defined lookback.
Stablecoin Dominance Surge - tracks combined USDT/USDC dominance rises as a proxy for on‑chain “flight to safety.”
Macro Confirmation
NDX Weakness (NASDAQ‑100)
VIX Spikes (CBOE Volatility Index)
Elevated Volume on declining bars
Fuzzy Logic & Scaling - component values feed into a fuzzy‑logic membership scor and are passed through a sigmoid compressor (–1 to +1). Weighted aggregation derives the final result of the gauge (or metric).
VISUALISATION
Continuous line plot - Smoothed metric (–1 to +1), colored cold‑to‑warm.
Entry circles - Highlighted when all conditions (fuzzy or crisp) are met after the time offset.
Time‑Offset marker - Vertical line/label showing the user‑specified “start” bar.
Component table - Displays real‑time % changes & volume multiples in the lower right of the indicator.
USAGE
Asset drop % - The threshold percent decline to register a sell‑off.
Stables rise % - The threshold percent increase in stablecoin dominance to qualify as a “flight to safety.”
NDX drop % - The threshold percent decline in the NASDAQ‑100 for macro confirmation.
VIX rise % - The threshold percent increase in VIX. Contributes to risk‑off validation.
Volume Multiplier - Defines how many times above SMA volume must rise to confirm conviction.
Lookback Period - Controls the number of bars over which % changes are measured.
Time Offset - Point in time beyond which bars to “fade” historical signals, enables focus on recent data only.
Fuzzy Logic Settings - Enables fuzzy scoring and set membership threshold & sensitivity.
Weights - allows for adjusting the relative importance of each component (Asset, Stables, NDX, VIX, Volume).
Sigmoid Steepness (k) - Controls curve steepness for compression (0.1 = very flat → 5.0 = very sharp S‑curve).
Chart & settings
Best applied on 4H or Daily BTCUSD (or similar) charts to capture meaningful sell‑off events.
Combine with broader trend filters (e.g., moving averages) for trend‑aligned entries.
Adjust Sigmoid Steepness and Membership Sensitivity to fine‑tune signal crispness vs. smoothness. Refer to tooltips.
Disclaimer
This indicator is intended for educational purposes only. Always perform your own due diligence before making financial decisions.

CDP - Counter-Directional-Pivot🎯 CDP - Counter-Directional-Pivot
📊 Overview
The Counter-Directional-Pivot (CDP) indicator calculates five critical price levels based on the previous day's OHLC data, specifically designed for multi-timeframe analysis. Unlike standard pivot points, CDP levels are calculated using a unique formula that identifies potential reversal zones where price action often changes direction.
⚡ What Makes This Script Original
This implementation solves several technical challenges that existing pivot indicators face:
🔄 Multi-Timeframe Consistency: Values remain identical across all timeframes (1m, 5m, 1h, daily) - a common problem with many pivot implementations
🔒 Intraday Stability: Uses advanced value-locking technology to prevent the "stepping" effect that occurs when pivot lines shift during the trading session
💪 Robust Data Handling: Optimized for both liquid and illiquid stocks with enhanced data synchronization
🧮 CDP Calculation Formula
The indicator calculates five key levels using the previous day's High (H), Low (L), and Close (C):
CDP = (H + L + C) ÷ 3 (Central Decision Point)
AH = 2×CDP + H – 2×L (Anchor High - Strong Resistance)
NH = 2×CDP – L (Near High - Moderate Resistance)
AL = 2×CDP – 2×H + L (Anchor Low - Strong Support)
NL = 2×CDP – H (Near Low - Moderate Support)
✨ Key Features
🎨 Visual Elements
📈 Five Distinct Price Levels: Each with customizable colors and line styles
🏷️ Smart Label System: Shows exact price values for each level
📋 Optional Value Table: Displays all levels in an organized table format
🎯 Clean Chart Display: Minimal visual clutter while maximizing information
⚙️ Technical Advantages
🔐 Session-Locked Values: Prices are locked at market open, preventing intraday shifts
🔄 Multi-Timeframe Sync: Perfect consistency between daily and intraday charts
✅ Data Validation: Built-in checks ensure reliable calculations
🚀 Performance Optimized: Efficient code structure for fast loading
💼 Trading Applications
🔄 Reversal Zones: AH and AL often act as strong turning points
💥 Breakout Confirmation: Price movement beyond these levels signals trend continuation
🛡️ Risk Management: Use levels for stop-loss and take-profit placement
🏗️ Market Structure: Understand daily ranges and potential price targets
📚 How to Use
🚀 Basic Setup
Add the indicator to your chart (works on any timeframe)
Customize colors for easy identification of support/resistance zones
Enable the value table for quick reference of exact price levels
📈 Trading Strategy Examples
🟢 Long Bias: Look for bounces at NL or AL levels
🔴 Short Bias: Watch for rejections at NH or AH levels
💥 Breakout Trading: Enter positions when price decisively breaks through anchor levels
↔️ Range Trading: Use CDP as the central reference point for range-bound markets
🎯 Advanced Strategy Combinations
RSI Integration for Enhanced Signals: 📊
📉 Oversold Bounces: Combine RSI below 30 with price touching AL/NL levels for high-probability long entries
📈 Overbought Rejections: Look for RSI above 70 with price rejecting AH/NH levels for short opportunities
🔍 Divergence Confirmation: When RSI shows bullish divergence at support levels (AL/NL) or bearish divergence at resistance levels (AH/NH), it often signals stronger reversal potential
⚡ Momentum Confluence: RSI crossing 50 while price breaks through CDP can confirm trend direction changes
⚙️ Configuration Options
🎨 Line Customization: Adjust width, style (solid/dashed/dotted), and colors
👁️ Display Preferences: Toggle individual levels, labels, and value table
📍 Table Position: Place the value table anywhere on your chart
🔔 Alert System: Get notifications when price crosses key levels
🔧 Technical Implementation Details
🎯 Data Reliability
The script uses request.security() with lookahead settings to ensure historical accuracy while maintaining real-time functionality. The value-locking mechanism prevents the common issue where pivot levels shift during the trading day.
🔄 Multi-Timeframe Logic
⏰ Intraday Charts: Display previous day's calculated levels as stable horizontal lines
📅 Daily Charts: Show current day's levels based on yesterday's OHLC
🔍 Consistency Check: All timeframes reference the same source data
🤔 Why CDP vs Standard Pivots?
Counter-Directional Pivots often provide more accurate reversal points than traditional pivot calculations because they incorporate the relationship between high/low ranges and closing prices more effectively. The formula creates levels that better reflect market psychology and institutional trading behaviors.
💡 Best Practices
💧 Use on liquid markets for most reliable results
📊 RSI Combination: Add RSI indicator for overbought/oversold confirmation and divergence analysis
📊 Combine with volume analysis for confirmation
🔍 Consider multiple timeframe analysis (daily levels on hourly charts)
📝 Test thoroughly in paper trading before live implementation
💪 Example Market Applications
NASDAQ:AAPL AAPL - Tech stock breakouts through AH levels
$NYSE:SPY SPY - Index trading with CDP range analysis
NASDAQ:TSLA TSLA - Volatile stock reversals at AL/NL levels
⚠️ This indicator is designed for educational and analytical purposes. Always combine with proper risk management and additional technical analysis tools.

Worldwide Sessions and Open Range BreakoutThis script shows when the various normal market hours for each of the major worldwide markets (Asia, New York, and London). It also draws a line on the opening range for each of these market sessions. The opening range defaults to the first 15 minutes of the session, but this can be customized.
This script does automatically handle the session times regardless of your time zone or what time frame you are on. No need to set anything! This probably can't handle non-normal trading days, such as partial days.
This script is made for futures, but would likely work for other markets, like Forex.

Momentum Flip Pro - Advanced ZigZag Trading SystemMomentum Flip Pro - Advanced ZigZag Trading System
Complete User Guide
📊 What This Indicator Does
The Momentum Flip Pro is an advanced position-flipping trading system that automatically identifies trend reversals using ZigZag patterns combined with momentum analysis. It's designed for traders who want to always be in the market, flipping between long and short positions at optimal reversal points.
Key Features:
Automatically flips positions at each ZigZag reversal point
Dynamic stop loss placement at exact ZigZag levels
Real-time trading dashboard with performance metrics
Capital tracking and ROI calculation
Three momentum engines to choose from
🎯 How It Works
Entry Signal: When a ZigZag point appears (circle on chart), the indicator:
Exits current position (if any)
Immediately enters opposite position
Places stop loss at the exact ZigZag price
Exit Signal: Positions are closed when the next ZigZag appears, then immediately reversed
Position Management:
Long Entry: ZigZag bottom (momentum turns UP)
Short Entry: ZigZag peak (momentum turns DOWN)
Stop Loss: Always at the ZigZag entry price
Take Profit: Next ZigZag point (automatic position flip)
⚙️ Recommended Settings
For Day Trading (5m-15m timeframes):
Momentum Engine: Quantum
- RSI Length: 9-12
- Quantum Factor: 3.5-4.0
- RSI Smoothing: 3-5
- Threshold: 8-10
For Swing Trading (1H-4H timeframes):
Momentum Engine: MACD
- Fast Length: 12
- Slow Length: 26
- Signal Smoothing: 9
- MA Type: EMA
For Position Trading (Daily):
Momentum Engine: Moving Average
- Average Type: EMA or HMA
- Length: 20-50
📈 How to Use for Trading
Add to Chart:
Add indicator to your chart
Set your starting capital
Choose your preferred momentum engine
Understanding Signals:
Green circles: Strong bullish momentum reversal
Red circles: Strong bearish momentum reversal
Purple circles: Normal momentum reversal
Entry labels: Show exact entry points with tooltips
Trading Rules:
Enter LONG when you see an up arrow + green/purple circle
Enter SHORT when you see a down arrow + red/purple circle
Stop loss is automatically at the ZigZag level
Hold until next ZigZag appears (exit + reverse)
Risk Management:
Risk per trade = Entry Price - Stop Loss
Position size = (Capital * Risk %) / Risk per trade
Recommended risk: 1-2% per trade
💡 Best Practices
Market Conditions:
Works best in trending markets
Excellent for volatile pairs (crypto, forex majors)
Avoid during low volume/consolidation
Timeframe Selection:
Lower timeframes (5m-15m): More signals, higher noise
Higher timeframes (1H+): Fewer signals, higher reliability
Sweet spot: 15m-1H for most traders
Momentum Engine Selection:
Quantum: Best for volatile markets (crypto, indices)
MACD: Best for trending markets (forex, stocks)
Moving Average: Best for smooth trends (commodities)
📊 Dashboard Interpretation
The trading dashboard shows:
Current Capital: Your running balance
Position: Current trade direction
Entry/Stop: Your risk levels
Statistics: Win rate and performance
ROI: Overall return on investment
⚠️ Important Notes
Always Active: This system is always in a position (long or short)
No Neutral: You're either long or short, never flat
Automatic Reversal: Positions flip at each signal
Stop Loss: Fixed at entry ZigZag level (doesn't trail)
🎮 Quick Start Guide
Beginners: Start with default settings on 1H timeframe
Test First: Use paper trading to understand the signals
Small Size: Begin with 1% risk per trade
Track Results: Monitor the dashboard statistics
Adjust: Fine-tune momentum settings based on results
🔧 Customization Tips
Color Signals: Enable to see momentum strength
Dashboard Position: Move to preferred screen location
Visual Settings: Adjust colors for your theme
Alerts: Set up for automated notifications
This indicator is ideal for traders who prefer an always-in-market approach with clear entry/exit rules and automated position management. The key to success is choosing the right momentum engine for your market and maintaining disciplined risk management.

Multi-Timeline 1.0Multi-TimeLines 1.0 - Comprehensive Description
WHAT IT DOES:
This indicator creates dynamic horizontal support/resistance lines based on opening prices captured at user-defined New York times. Unlike static horizontal lines, these levels automatically appear and disappear based on sophisticated session logic, providing traders with time-sensitive reference levels that adapt to market sessions.
HOW IT WORKS - TECHNICAL IMPLEMENTATION:
1.
Timezone Conversion Engine:
The script uses Pine Script's "America/New_York" timezone functions to ensure all time calculations are based on NY time, regardless of the user's chart timezone. This eliminates confusion and provides consistent behavior across global markets.
2.
Dual-Category Time Classification System:
The indicator employs a unique two-category classification system:
Category A (16:00-23:59 NY): Evening times that extend overnight until next day 15:59 NY
Category B (00:00-15:59 NY): Day times that extend until same day 15:59 NY
This classification handles the complex logic of overnight sessions and prevents lines from incorrectly resetting at midnight for evening times.
3. Price Capture Mechanism:
Uses precise time-hit detection with backup systems for edge cases (especially midnight 00:00). When a specified time occurs, the script captures the bar's opening price and stores it in persistent variables using Pine Script's var declarations.
4. Session-Aware Display Logic:
Lines only appear during their designated "display windows" - periods when the captured price level is relevant. The script uses conditional plotting with plot.style_linebr to create clean breaks when lines are inactive.
5. Smart Reset System:
Different reset behaviors based on time classification:
Category A times persist across midnight (for overnight analysis)
Category B times reset on day changes (except 00:00 which captures AT day change)
Automatic cleanup when display windows close
ORIGINALITY & UNIQUE FEATURES:
1. Overnight Session Handling:
Unlike basic horizontal line tools, this script properly handles overnight spans for evening times, making it invaluable for analyzing gaps and overnight price action.
2. Automatic Session Management:
No manual line drawing required - the script automatically manages when lines appear/disappear based on NY market sessions (15:59 close, 18:00 after-hours start).
3. Time-Window Display Logic:
Lines only show during relevant periods, reducing chart clutter and focusing attention on currently active levels.
TRADING CONCEPTS & APPLICATIONS:
1. Session-Based Analysis:
Capture opening prices at key session times:
00:00 NY: Sydney/Asian session start
03:00 NY: London pre-market
08:00 NY: London session open
09:30 NY: NYSE opening bell
18:00 NY: After-hours start
2. Gap Analysis:
Evening times (20:00-23:59) that extend overnight are particularly useful for:
Identifying potential gap-fill levels
Tracking overnight high/low breaks
Setting reference points for next-day trading
3. Support/Resistance Framework:
Opening prices at significant times often act as:
Intraday support/resistance levels
Reference points for breakout/breakdown analysis
Pivot levels for mean reversion strategies
HOW TO USE:
1. Time Input:
Enter times in "HH:MM" format using 24-hour NY time:
"09:30" for NYSE open
"15:30" for late-day reference
"20:00" for evening level (extends overnight)
2. Line Behavior:
Blue/Green/Cyan/Red lines: Your custom times
Yellow line: After-hours day open (18:00 NY start)
Lines appear with breaks during inactive periods
3. Strategic Setup:
Use 2-3 key session times for your trading style
Combine morning times (immediate reference) with evening times (overnight analysis)
Toggle after-hours line based on your market focus
CALCULATION METHOD:
The script uses direct opening price capture (no smoothing or averaging) at precise time hits, ensuring the most accurate representation of actual market levels at specified times. This raw price approach maintains the integrity of actual market opening prices rather than manipulated or calculated values.
This method is particularly effective because opening prices at significant times often represent institutional order flow and can act as magnetic levels throughout subsequent sessions.

Previous Day High & Low)Previous Day High & Low (PDH/PDL)
This simple but essential tool plots the previous day's high and low as dynamic horizontal lines across the current trading session. Ideal for traders who rely on key support and resistance levels, this indicator automatically updates at the start of each new day and extends the levels across the chart.
🔹 Features:
Automatically tracks and draws the previous day’s high and low.
Lines update cleanly at each new session.
Helps identify breakout and reversal zones.
Perfect for scalpers, intraday traders, and anyone watching for reactions at key levels.
NY opennew york open.
new york open hours of the past two weeks up until two days ahead are shown as vertical lines which is great for both analyzing past data and seeing where would future new york open align with compared to your own future analysis.
TradeJorno - Time + Price Levels
Tired of manually drawing and updating important ICT or SMC time and price levels on your charts every day?
Here’s an indicator to draw important TIME and PRICE levels automatically.
Here’s what you can highlight in realtime on your charts:
1. Previous major highs and lows
⁃ Previous daily and weekly highs and low
- Weekly dividing lines
2. Session highs/lows
⁃ Plot the high and low of Asia and London sessions.
⁃ Customise the timeframe and appearance on the chart.
- Previous session settlement price.
3. Various price levels
⁃ Pre-market opening prices : midnight, 7:30 and 8:30
⁃ Regular market opening prices: 9:30, 10:00, 14:00
- end of session settlement prices
4. Market opening range high and low
⁃ Lines extending throughout the current session
⁃ Customise the timeframe and appearance on the chart.
5. ICT Macro times
- Draw customisable vertical lines and labels to indicate the start of each ICT macro
period.
Let us know in the comments below if there’s anything else we need to add!

Pair TradingPAIR TRADING
Description:
This indicator is a simple and intuitive tool for rotating between two assets based on their relative price ratio. By comparing the prices of Asset A and Asset B, it plots a “ratio line” (gray) with dynamic upper and lower boundaries (red and blue).
When the ratio reaches the red line, Asset A is expensive → rotate out of A and into B.
When the ratio touches the blue line, Asset A is cheap → rotate back into A.
The chart also shows:
🔹 Background highlights for visual cues
🔹 “Rotate to A” or “Rotate to B” markers for easy decisions
🔹 A live summary table with mean ratio, upper/lower boundaries, and current ratio
How to Use:
Select Asset A and Asset B in the settings.
Adjust the Lookback Period and Threshold if needed.
Watch the gray ratio line as it moves:
Above red line? → Consider rotating into B
Below blue line? → Consider rotating into A
Use the background color changes and rotation labels to spot clear rotation opportunities!
Why Pair Trading?
Pair trading is a powerful way to manage a portfolio because it neutralizes market direction risk and focuses on relative value.
By rotating between correlated assets, you can:
Smooth out returns
Avoid holding a weak asset too long
Capture reversion when assets diverge too far
This approach can enhance risk-adjusted returns and help keep your portfolio balanced and nimble!
How to Pick Pairs:
Choose assets with strong correlation or similar drivers.
Look for common trends (sector, macro).
Start with assets you know best (high-conviction ideas).
Make sure both have good liquidity for reliable trading!
TO HELP FIND CORRELATED ASSETS:
Use the Correlation Coefficient indicator in TradingView:
Click Indicators
Search for “Correlation Coefficient”
Add it to your chart
Input the symbol of the second asset (e.g., if you’re on MSTR, input TSLA).
This plots the rolling correlation coefficient — super helpful!
Pair trading can turn big swings into steady rotations and help you stay active even when the market is choppy. It’s a simple, practical approach to keep your portfolio balanced.

ICT Directional FVG Indicator (Buffered SL)This is the first indicator I have ever made, and I am very new to Pine Script. I’ve tried my best to create this as a strategy, but I’m still learning, so please be kind and constructive with your feedback!
ICT Directional FVG Indicator (Buffered SL)
This indicator is designed for traders who follow ICT (Inner Circle Trader) concepts, focusing on Fair Value Gaps (FVGs), liquidity sweeps, and session-based trading. It automatically detects bullish and bearish FVGs, highlights them on the chart, and identifies liquidity sweep events. The indicator features three customizable Kill Zones (London, New York, and Asia sessions), each with independent toggles and color-coded backgrounds for clear visual separation.
Key features:
Fair Value Gap Detection: Highlights bullish and bearish FVGs in real time.
Liquidity Sweep Alerts: Marks potential liquidity sweep events for both highs and lows.
Session Kill Zones: Toggle each Kill Zone (London, New York, Asia) independently; background color changes only in enabled zones.
Trade Signal Visualization: Plots entry, stop loss, and take profit levels based on FVG and sweep logic, with a user-defined stop loss buffer.
Customizable Display: Easily enable or disable FVGs, sweeps, trade levels, and each Kill Zone to suit your strategy.
This tool is ideal for ICT-based traders who want a clear, automated view of FVGs, sweeps, and session activity, with full control over which sessions and signals are displayed.

DWMY Opens (for aggr. charts) by Koenigsegg🟣 DWMY Opens (for Aggregated Charts) by Koenigsegg
Revolutionary compatibility with aggregated charts – This indicator represents a significant breakthrough in displaying Daily, Weekly, Monthly, and Yearly opening levels on aggregated chart types where traditional DWMY indicators have historically failed to function properly.
Complete aggregated chart support – Unlike previous Daily Weekly Monthly Yearly Opens indicators that experienced severe limitations when pulling data from non-standard chart types, this version is specifically engineered to work flawlessly with aggregated charts, range bars, Renko charts, Point & Figure charts, and all other non-time-based chart constructions.
Persistent horizontal reference lines – The indicator draws four distinct horizontal lines representing the opening prices of the current Daily, Weekly, Monthly, and Yearly periods, extending these levels forward into future bars to provide clear reference points for key support and resistance analysis.
Advanced customization capabilities – Features comprehensive user controls including custom label naming for each timeframe, adjustable line colors with independent color selection for Daily, Weekly, Monthly, and Yearly levels, configurable line width settings, and variable label font sizes ranging from tiny to huge.
Dynamic label positioning system – Implements a sophisticated label placement mechanism with configurable tick offset positioning and fixed end-bars-ahead projection, ensuring labels remain visible and properly positioned regardless of chart zoom level or timeframe.
Intelligent period detection logic – Utilizes advanced Pine Script time change detection algorithms specifically optimized for aggregated charts, accurately identifying new Daily, Weekly, Monthly, and Yearly periods even when traditional time-based functions fail on non-standard chart types.
Performance-optimized architecture – Built with efficient persistent variable storage using the var keyword, minimizing computational overhead while maintaining real-time updates across all timeframe levels simultaneously.
Professional visual presentation – Delivers clean, uncluttered chart visualization with strategically positioned labels that clearly identify each timeframe level without interfering with price action analysis.
Universal market compatibility – Functions seamlessly across all asset classes including stocks, forex, cryptocurrencies, commodities, and indices, adapting automatically to different tick sizes and price scales through syminfo.mintick integration.
Pine Script v6 foundation – Leverages the latest Pine Script version 6 capabilities, ensuring optimal performance, stability, and compatibility with current and future TradingView platform updates.
This indicator solves a critical limitation that has long plagued traders using aggregated chart types, finally enabling reliable access to essential Daily, Weekly, Monthly, and Yearly opening levels that serve as fundamental support and resistance zones in technical analysis. The breakthrough lies in its ability to maintain accurate period detection and level plotting regardless of the underlying chart construction methodology.
🟣 How It Works
Automatic period detection – The indicator continuously monitors for time changes across four distinct timeframes using ta.change(time()) functions for Daily and Weekly periods, month transitions for Monthly levels, and year changes for Yearly opens, ensuring precise identification of new period beginnings.
Real-time level updates – When a new period is detected, the indicator captures the opening price at that exact moment and immediately establishes a horizontal line from that bar extending forward to a configurable number of bars ahead, creating persistent reference levels.
Dynamic line management – Each timeframe maintains its own dedicated line object and label, with the indicator continuously updating the endpoint coordinates and label positions as new bars form, ensuring the levels always project the specified distance into the future.
Intelligent label placement – Labels are positioned at the end of each line with automatic vertical offset based on the symbol’s minimum tick size, preventing overlap with price action while maintaining clear identification of each timeframe level.
🟣 Pro Tips for Optimal Usage
Multi-timeframe confluence – Look for areas where multiple DWMY levels converge within close proximity, as these zones typically act as stronger support or resistance levels due to increased market participant attention at these psychological price points.
Breakout confirmation strategy – When price breaks above or below a significant DWMY level with strong volume, the broken level often transforms into support (if broken upward) or resistance (if broken downward), providing excellent entry and exit reference points.
Range trading opportunities – On ranging markets, use Daily and Weekly opens as potential reversal zones, especially when price approaches these levels during low-volume periods or near session opens when institutional activity increases.
Timeframe alignment technique – For swing trading, prioritize trades that align with the direction of the break from Weekly or Monthly opens, while using Daily opens for precise entry timing and position management.
Chart type optimization – This indicator excels on Renko, Range, and Point & Figure charts where traditional time-based DWMY indicators fail, making it invaluable for traders who prefer these aggregated chart types for cleaner price action analysis.
Important Disclaimer:
This indicator is provided for educational and informational purposes only. It is not financial advice, investment advice, or a recommendation to buy or sell any financial instrument. All trading involves risk, and past performance does not guarantee future results. Please conduct your own research and consult with a qualified financial advisor before making any trading decisions. The author is not responsible for any losses incurred from using this indicator.

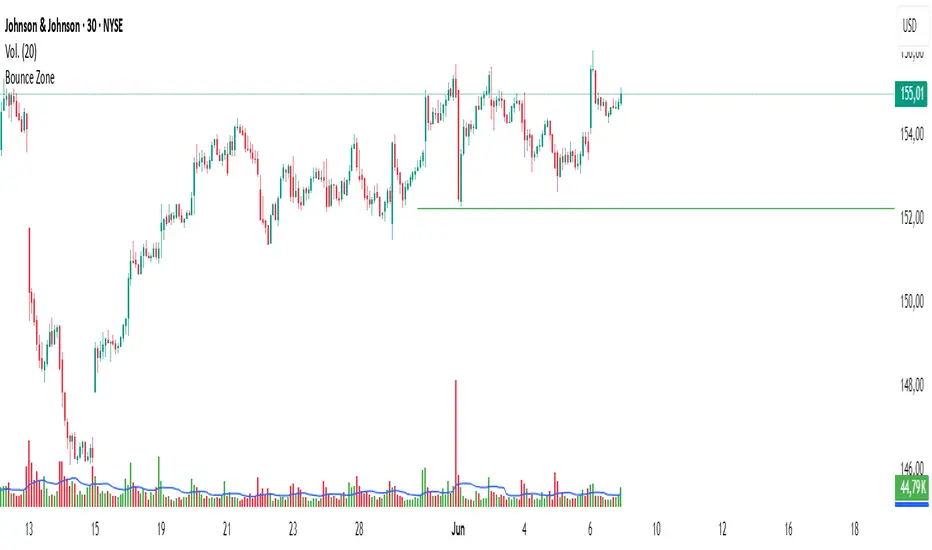
Bounce Zone📘 Bounce Zone – Indicator Description
The "Bounce Zone" indicator is a custom tool designed to highlight potential reversal zones on the chart based on volume exhaustion and price structure. It identifies sequences of candles with low volume activity and marks key price levels that could act as "bounce zones", where price is likely to react.
🔍 How It Works
Volume Analysis:
The indicator calculates a Simple Moving Average (SMA) of volume (default: 20 periods).
It looks for at least 6 consecutive candles (configurable) where the volume is below this volume SMA.
Color Consistency:
The candles must all be of the same color:
Green candles (bullish) for potential downward bounce zones.
Red candles (bearish) for potential upward bounce zones.
Zone Detection:
When a valid sequence is found:
For green candles: it draws a horizontal line at the low of the last red candle before the sequence.
For red candles: it draws a horizontal line at the high of the last green candle before the sequence.
Bounce Tracking:
Each horizontal line remains on the chart until it is touched twice by price (high or low depending on direction).
After two touches, the line is automatically removed, indicating the zone has fulfilled its purpose.
📈 Use Cases
Identify areas of price exhaustion after strong directional pushes.
Spot liquidity zones where institutions might step in.
Combine with candlestick confirmation for reversal trades.
Useful in both trending and range-bound markets for entry or exit signals.
⚙️ Parameters
min_consecutive: Minimum number of consecutive low-volume candles of the same color (default: 6).
vol_ma_len: Length of the volume moving average (default: 20).
🧠 Notes
The indicator does not repaint and is based purely on historical candle and volume structure.
Designed for manual strategy confirmation or support for algorithmic setups.
HTF 3rd Weekly High/LowThis indicator plots horizontal lines for the high and low of a selected past weekly candle, allowing traders to visualize higher time frame (HTF) structure on lower time frame charts (e.g., 1H, 4H, etc.).
Features:
Custom Weekly Range Selection: Use the dropdown to choose which weekly candle to reference — from the current week (0) to up to five weeks back.
Clean Horizontal Lines: High and low levels of the selected week are drawn as persistent horizontal lines.
Automatic Text Labels: Labels like Week-3H and Week-3L are shown on the right side of the chart, matching the week selected.
Customization:
Line colors
Line width and style (solid, dotted, dashed)
Text label offset
Automatic Refresh: Levels and labels are redrawn at the start of each new week to stay current with your selection.

Volume Point of Control with Fib Based Profile🍀Description:
This indicator is a comprehensive volume profile analysis tool designed to identify key price levels based on trading activity within user-defined timeframes. It plots the Point of Control (POC), Value Area High (VAH), and Value Area Low (VAL), along with dynamically calculated Fibonacci levels derived from the developing period's range. It offers extensive customization for both historical and developing levels.
🍀Core Features:
Volume Profiling (POC, VAH, VAL):
Calculates and plots the POC (price level with the highest volume), VAH, and VAL for a selected timeframe (e.g., Daily, Weekly).
The Value Area percentage is configurable. 70% is common on normal volume profiles, but this script allows you to configure multiple % levels via the fib levels. I recommend using 2 versions of this indicator on a chart, one has Value Area at 1 (100% - high and low of lookback) and the second is a specified VA area (i.e. 70%) like in the chart snapshot above. See examples at the bottom.
Historical Levels:
Plots POC, VAH, and VAL from previous completed periods.
Optionally displays only "Unbroken" levels – historical levels that price has not yet revisited, which can act as stronger magnets or resistance/support.
The user can manage the number of historical lines displayed to prevent chart clutter.
Developing Levels:
Shows the POC, VAH, and VAL as they form in real-time during the current, incomplete period. This provides insight into intraday/intra-period value migration.
Dynamic Fibonacci Levels:
Calculates and plots Fibonacci retracement/extension levels based dynamically on the range between the developing POC and the developing VAH/VAL.
Offers 8 configurable % levels above and below POC that can be toggled on/off.
Visual Customization:
Extensive options for colors, line styles, and widths for all plotted levels.
Optional gradient fill for the Value Area that visualizes current price distance from POC - option to invert the colors as well.
Labels for developing levels and Fibonacci levels for easy identification.
🍀Characteristics:
Volume-Driven: Levels are derived from actual trading volume, reflecting areas of high participation and price agreement/disagreement.
Timeframe Specific: The results are entirely dependent on the chosen profile timeframe.
Dynamic & Static Elements: Developing levels and Fibs update live, while historical levels remain fixed once their period closes.
Lagging (Historical) & Potentially Leading: Historical levels are based on the past, but are often respected by future price action. Developing levels show current dynamics.
🍀How to Use It:
Identifying Support & Resistance: Historical and developing POCs, VAHs, and VALs are often key areas where price may react. Unbroken levels are particularly noteworthy.
Market Context & Sentiment: Trading above the POC suggests bullish strength/acceptance of higher prices, while trading below suggests bearishness/acceptance of lower prices.
Entry/Exit Zones: Interactions with these levels (rejections, breakouts, tests) can provide potential entry or exit signals, especially when confirming with other analysis methods.
Dynamic Targets: The Fibonacci levels calculated from the developing POC-VA range offer potential intraday/intra-period price targets or areas of interest.
Understanding Value Migration: Observing the movement of the developing POC/VAH/VAL throughout the period reveals where value is currently being established.
🍀Potential Drawbacks:
Input Sensitivity: The choice of timeframe, Value Area percentage, and volume resolution heavily influences the generated levels. Experimentation is needed for optimal settings per instrument/market. (I've found that Range Charts can provide very accurate volume levels on TV since the time element is removed. This helps to refine the accuracy of price levels with high volume.)
Volume Data Dependency: Requires accurate volume data. May be less reliable on instruments with sparse or questionable volume reporting.
Chart Clutter: Enabling all features simultaneously can make the chart busy. Utilize the line management inputs and toggle features as needed.
Not a Standalone Strategy: This indicator provides context and key levels. It should be used alongside other technical analysis tools and price action reading for robust decision-making.
Developing Level Fluctuation: Developing POC/VA/Fib levels can shift considerably, especially early in a new period, before settling down as more volume accumulates and time passes.
🍀Recommendations/Examples:
I recommend have this indicator on your chart twice, one has the VA set at 1 (100%) and has the fib levels plotted. The second has the VA set to 0.7 (70%) to highlight the defined VA.
Here is an example with 3 on a chart. VA of 100%, VA of 80%, and VA of 20%
