Custom P&L Tool (EUR/USD)This is a visual profit and loss calculator designed for EUR/USD traders. It acts like the Long/Short Position tool but provides real-time P&L values based on your selected:
Trade direction (Long or Short)
Entry price, Take Profit, and Stop Loss
Lot size (with preset scaling from 0.01 to 10 lots)
Quản lý danh mục đầu tư
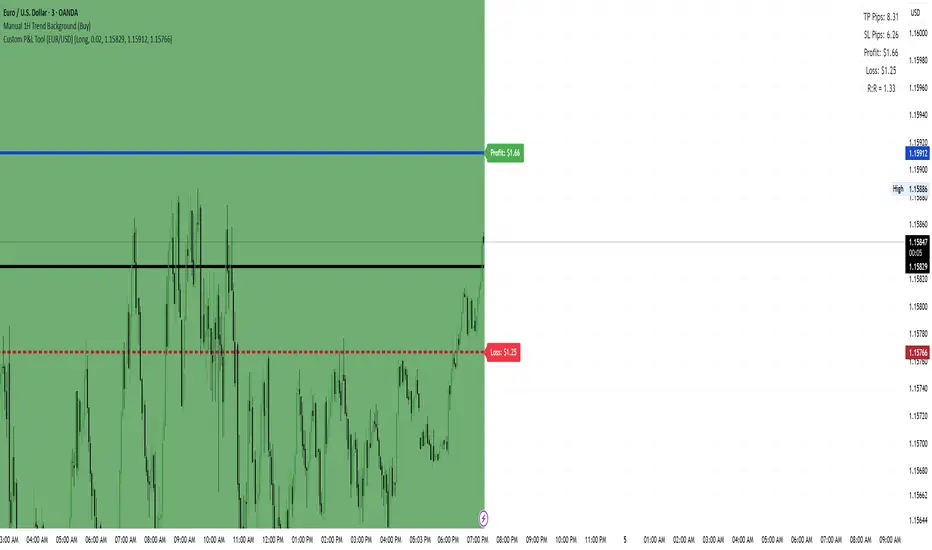
Custom P&L Tool (EUR/USD)This tool lets you visually calculate potential Profit & Loss, Risk:Reward, and pip distances for a trade based on your:
Entry price
Stop Loss (SL)
Take Profit (TP)
Lot size (0.01 up to 10 lots)
Trade direction (Long or Short)
🔹 Automatically shows horizontal lines for Entry, TP, and SL
🔹 Displays a live P&L table with:
TP pips
SL pips
Estimated profit/loss in USD
Risk:Reward ratio

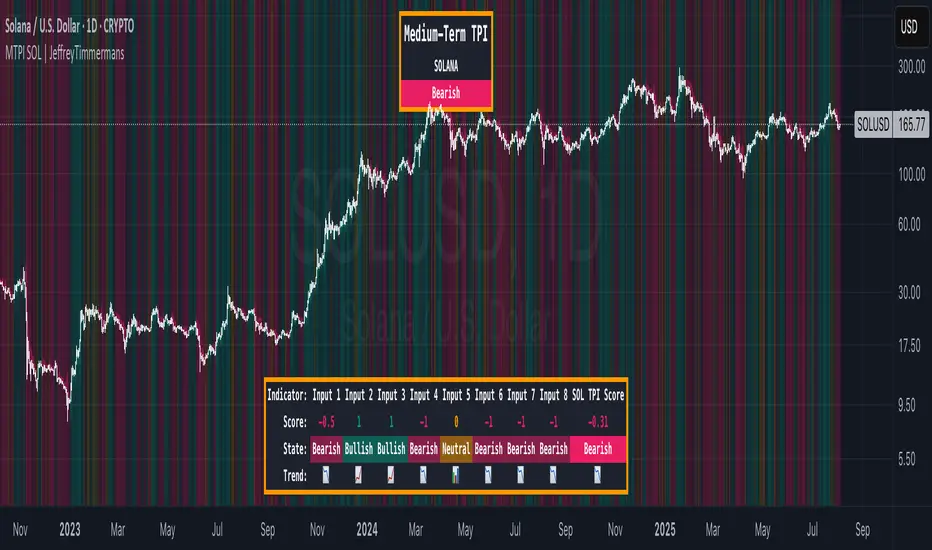
MTPI SOL | JeffreyTimmermansMedium-Term Trend Probability Indicator
The "Medium-Term Trend Probability Indicator" on SOL (Solana) is a custom-built tool designed to analyze Solana (SOL) from a medium-term perspective. Unlike short-term indicators that react quickly to intraday volatility or long-term models that focus on macro cycles, the MTPI is optimized to detect medium-term market trends—capturing key turning points and momentum shifts that unfold over multiple weeks.
This version of the MTPI is applied to SOL, making it a Solana-specific trend-following tool with particular sensitivity to its price behavior and structural dynamics.
Key Features
Medium-Term Focus:
Built to monitor price action over several weeks to months, the MTPI filters out short-term noise while remaining responsive to meaningful trend changes.
8 Input Signals:
The MTPI aggregates 8 carefully selected trend-following inputs, each tuned to reflect mid-cycle behavior in SOL’s price movements.
Market Regimes:
The MTPI classifies market behavior into one of three clear regimes:
Bullish → Momentum and structure align to support a continued uptrend
Bearish → Majority of signals point to trend deterioration or downside momentum
Neutral → Mixed signals, often during consolidation or early transition phases
Visual Background:
The background color shifts dynamically to reflect the active regime—making it easy to visually interpret the prevailing market condition.
Comprehensive Dashboard:
The lower panel displays:
The state of each individual input (Bullish, Bearish, Neutral)
The numerical MTPI Score (average of all 8 signals)
The final Trend Classification (Bullish / Bearish / Neutral)
How It Works
Input Analysis:
Each of the 8 inputs outputs a score based on its internal signal:
+1 = Bullish condition
-1 = Bearish condition
0 = Neutral / indecisive
Score Calculation:
The MTPI Score is calculated as the average of all 8 input signals:
Score > +0.1 = Bullish regime
Score < -0.1 = Bearish regime
Score between -0.1 and +0.1 = Neutral regime
Background Coloring:
Color-coded backgrounds instantly reflect the current trend classification based on the MTPI Score, helping traders stay aligned with the market direction at all times.
Use Cases
Mid-Term Positioning:
Identify strong trend phases on SOL with reduced noise and increased directional clarity.
Confirmation Layer:
Use MTPI as a mid-term confirmation tool alongside short-term setups or long-term macro models (like LTPI).
Rotation or Transition Detection:
Spot key moments when SOL transitions from expansion to contraction phases (and vice versa).
Dynamic Alerts:
Bullish Signal: MTPI Score crosses above +0.1
Bearish Signal: MTPI Score crosses below -0.1
Neutral Zone: MTPI Score enters between -0.1 and +0.1
Conclusion
The Medium-Term Trend Probability Indicator (MTPI – SOL) provides a powerful framework for identifying trend phases on Solana with mid-term relevance. By combining 8 intelligent inputs into a single score and market classification, it offers clarity in times of uncertainty and confidence in times of momentum. Whether used alone or as part of a broader multi-timeframe strategy, the MTPI helps refine entries, exits, and macro alignment in the dynamic world of Solana trading.
SAFE Leverage x50Description:
Safe Leverage x50 is an indicator designed to help traders choose prudent, realistic, and dynamic leverage, adapted to the timeframe and volatility of the asset they are trading.
Based on rigorous statistical and practical observation, this indicator does not propose fixed rules, but rather provides a visual estimate of the maximum leverage a typical trade can tolerate without being liquidated, based on the current candle's movement range. At the same time, it automatically suggests a more conservative leverage (by default, half of the maximum) for more controlled risk management.

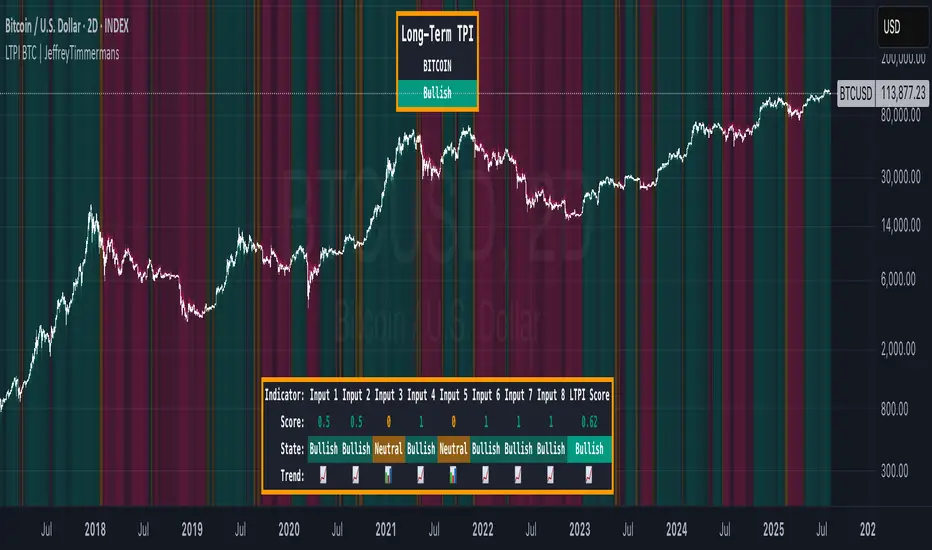
LTPI BTC | JeffreyTimmermansLong-Term Trend Probability Indicator
The "Long-Term Trend Probability Indicator" on BTC is a custom-built tool designed to analyze BTC from a long-term perspective. Unlike short-term indicators that react to price volatility, LTPI focuses on major trend shifts on BTC, and therefore across the entire crypto market, helping to identify major trend shifts early.
This version of the LTPI is applied to BTC, making it a BTC specific trend following tool, but very broad (crypto wise), because BTC is the biggest asset.
Key Features
Long-Term Focus:
Designed for macro market analysis with less sensitivity to short-term noise.
8 Input Signals:
Combines 8 carefully selected inputs (trend following indicators) into a single score that reflects the overall market condition.
Market Regimes:
Classifies the BTC trend into:
Bullish: Strong uptrend, expansion phase
Bearish: Strong downtrend, contraction phase
Neutral: Transitional or uncertain
Visual Background:
Background colors clearly display which regime is active.
Comprehensive Dashboard:
The panel at the bottom shows each input’s state, the composite LTPI score, and the resulting market trend.
How It Works
Inputs Analysis:
Each of the 8 inputs outputs one of three states:
+1 (Bullish)
-1 (Bearish)
0 (Neutral)
Score Calculation:
The total score is the sum of all 8 input signals divided by 8.
Score > 0.1 = Bullish
Score < -0.1 = Bearish
Between -0.1 and 0.1 = Neutral
Background Coloring:
Background colors dynamically adjust to reflect the long-term market regime.
Use Cases
Long-Term Positioning:
Identify periods of global expansion or contraction to position yourself accordingly.
Macro Confirmation:
Use LTPI in combination with medium-term (MTPI) and short-term tools for multi-timeframe confirmation.
Market Timing:
Alerts when LTPI crosses key thresholds help highlight the start of major bullish or bearish phases.
Dynamic Alerts:
Bullish Entry: LTPI score crosses above 0.1
Bearish Entry: LTPI score crosses below -0.1
Neutral Zone: Score moves back between -0.1 and 0.1
Conclusion
The Long-Term Trend Probability Indicator (LTPI – BTC) is a powerful tool for identifying long-term market phases across the entire crypto ecosystem. By focusing on long term trends and combining 8 inputs into a single probability score, it provides a clear macro trend perspective for strategic decision-making.
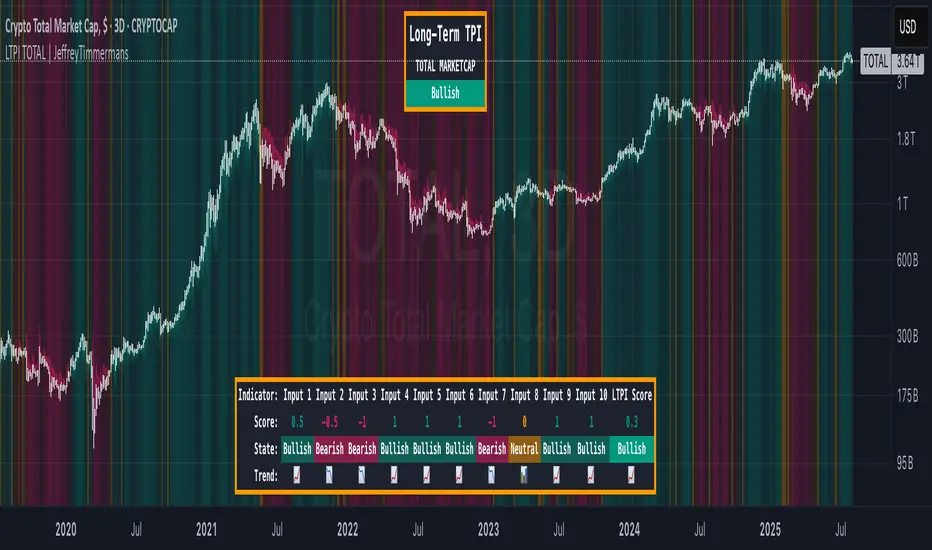
LTPI TOTAL | JeffreyTimmermansLong-Term Trend Probability Indicator
The "Long-Term Trend Probability Indicator" on TOTAL is a custom-built tool designed to analyze the global crypto market (TOTAL) from a long-term perspective. Unlike short-term indicators that react to price volatility, LTPI focuses on major trend shifts across the entire crypto market, helping to identify major trend shifts early.
This version of the LTPI is applied to the TOTAL market cap, making it a broad trend following tool.
Key Features
Long-Term Focus:
Designed for macro market analysis with less sensitivity to short-term noise.
10 Input Signals:
Combines 10 carefully selected inputs (trend following indicators) into a single score that reflects the overall market condition.
Market Regimes:
Classifies the TOTAL market into:
Bullish: Strong uptrend, expansion phase
Bearish: Strong downtrend, contraction phase
Neutral: Transitional or uncertain
Visual Background:
Background colors clearly display which regime is active.
Comprehensive Dashboard:
The panel at the bottom shows each input’s state, the composite LTPI score, and the resulting market trend.
How It Works
Inputs Analysis:
Each of the 10 inputs outputs one of three states:
+1 (Bullish)
-1 (Bearish)
0 (Neutral)
Score Calculation:
The total score is the sum of all 10 input signals divided by 10.
Score > 0.1 = Bullish
Score < -0.1 = Bearish
Between -0.1 and 0.1 = Neutral
Background Coloring:
Background colors dynamically adjust to reflect the long-term market regime.
Use Cases
Long-Term Positioning:
Identify periods of global expansion or contraction to position yourself accordingly.
Macro Confirmation:
Use LTPI in combination with medium-term (MTPI) and short-term tools for multi-timeframe confirmation.
Market Timing:
Alerts when LTPI crosses key thresholds help highlight the start of major bullish or bearish phases.
Dynamic Alerts:
Bullish Entry: LTPI score crosses above 0.1
Bearish Entry: LTPI score crosses below -0.1
Neutral Zone: Score moves back between -0.1 and 0.1
Conclusion
The Long-Term Trend Probability Indicator (LTPI – TOTAL) is a powerful tool for identifying long-term market phases across the entire crypto ecosystem. By focusing on long term trends and combining 10 inputs into a single probability score, it provides a clear macro perspective for strategic decision-making.
RISK MANAGEMENT CALCULATOR V3📊 RISK MANAGEMENT CALCULATOR – Lot Size, Profit & R:R Tool
This script is designed to help traders instantly calculate lot size, expected profit, and risk/reward ratio based on their trade plan.
✅ Features:
Input your Risk Amount ($), Entry, Stop Loss, and up to 3 Take Profits
Calculates:
✅ Lot Size based on risk
✅ Split profits per TP level (equally weighted)
✅ Total Profit & Risk/Reward (R:R)
Displays everything in a clean bottom-right table
Optimized for both:
🖥️ Desktop mode (larger layout)
📱 Mobile mode (toggle compact view)
💡 How to Use:
Enter your planned Entry, Stop Loss, and Risk Amount
Set any TP1, TP2, or TP3 prices (set TP to 0 if not used)
The system will auto-compute your ideal lot size and show estimated profits
🔧 Parameters:
Risk Amount ($) – how much you’re willing to lose
Entry Price – your trade entry
Stop Loss Price – your SL level
Take Profit 1/2/3 – optional TP targets
Pip Value – profit/loss per point for 1 standard lot
📱 Mobile Mode – compact the table for small screens
🔐 Notes:
No trades are executed – this is a risk planning tool only
Designed for all markets (forex, gold, indices, crypto)
TP profits are equally split (e.g. 2 TP = 50% / 50%)
RISK MANAGEMENT CALCULATOR📊 RISK MANAGEMENT CALCULATOR – Lot Size, Profit & R:R Tool
This script is designed to help traders instantly calculate lot size, expected profit, and risk/reward ratio based on their trade plan.
✅ Features:
Input your Risk Amount ($), Entry, Stop Loss, and up to 3 Take Profits
Calculates:
✅ Lot Size based on risk
✅ Split profits per TP level (equally weighted)
✅ Total Profit & Risk/Reward (R:R)
Displays everything in a clean bottom-right table
Optimized for both:
🖥️ Desktop mode (larger layout)
📱 Mobile mode (toggle compact view)
💡 How to Use:
Enter your planned Entry, Stop Loss, and Risk Amount
Set any TP1, TP2, or TP3 prices (set TP to 0 if not used)
The system will auto-compute your ideal lot size and show estimated profits
🔧 Parameters:
Risk Amount ($) – how much you’re willing to lose
Entry Price – your trade entry
Stop Loss Price – your SL level
Take Profit 1/2/3 – optional TP targets
Pip Value – profit/loss per point for 1 standard lot
📱 Mobile Mode – compact the table for small screens
🔐 Notes:
No trades are executed – this is a risk planning tool only
Designed for all markets (forex, gold, indices, crypto)
TP profits are equally split (e.g. 2 TP = 50% / 50%)
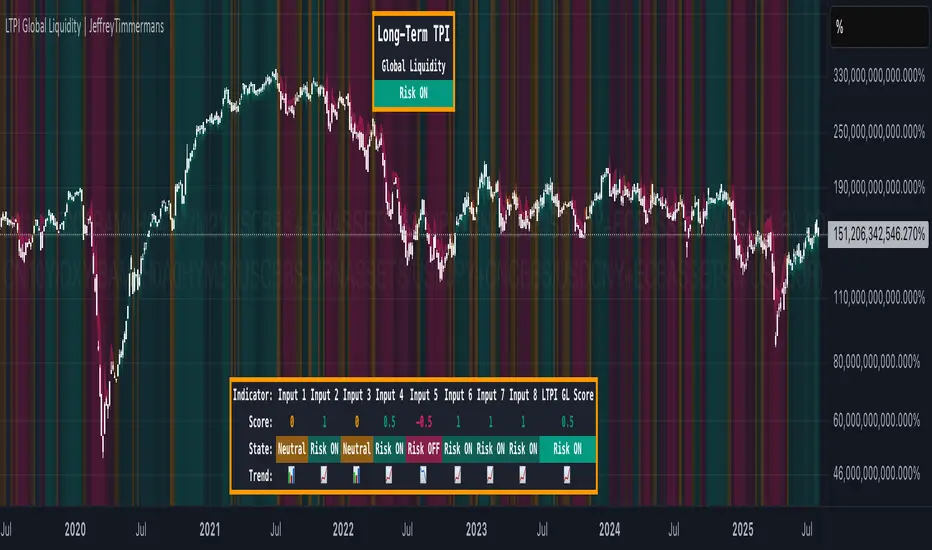
LTPI Global Liquidity | JeffreyTimmermansLong-Term Probability Indicator (LTPI)
The "Long-Term Probability Indicator (LTPI)" on a generic liquidity ticker is a custom-built analytical tool designed to evaluate market conditions over a long-term horizon, with a strong focus on global liquidity trends. By combining six carefully selected input signals into a single probability score, this indicator helps traders and analysts identify prevailing long-term market states: Bullish, Bearish, or Neutral.
Where short-term systems/timeframes react quickly to price fluctuations, LTPI smooths out noise and focuses on the bigger picture, allowing for informed strategic decision-making rather than short-term speculation.
Key Features
Multi-Input Aggregation:
Uses six independent inputs, each based on long-term liquidity and macro-related data, to generate a composite market probability score.
Long-Term Focus:
Prioritizes medium-to-long-term trends, ignoring smaller fluctuations that often mislead traders in volatile markets.
Simplified Market States:
Classifies the global market into three primary states:
Bullish: Favorable liquidity and conditions for long-term risk-taking.
Bearish: Tightening liquidity and conditions that require caution.
Neutral: Transitional phases or uncertain conditions.
Background Coloring:
Visual cues on the chart help identify which regime is active at a glance.
Global Liquidity Perspective:
Designed for use on a generic liquidity ticker, based on M2 money supply, to track macroeconomic liquidity flows and risk appetite.
Dashboard Display:
A compact on-screen table summarizes all six inputs, their states, and the resulting LTPI score.
Dynamic Alerts:
Real-time alerts signal when the LTPI shifts from one regime to another.
Inputs & Settings
LTPI Inputs:
Input Sources (6): Each input is a carefully chosen trend following indicator.
Weighting: Each input contributes equally to the final score.
Score Calculation:
Bullish = +1
Bearish = -1
Neutral = 0
Color Settings:
Strong Bullish: Bright Green
Weak Bullish: Light Green
Neutral: Gray/Orange
Weak Bearish: Light Red
Strong Bearish: Bright Red
(Colors can be customized.)
Calculation Process
Collect Data:
Six long-term inputs are evaluated at each bar.
Scoring:
Each input’s state contributes +1 (bullish), -1 (bearish), or around 0 (neutral).
Aggregate Probability:
The LTPI Score is calculated as the sum of all six scores divided by 6, resulting in a value between -1 and +1.
Market Classification:
Score > 0.1: Bullish regime
Score < -0.1: Bearish regime
-0.1 ≤ Score ≤ 0.1: Neutral
Background Coloring:
Background colors are applied to highlight the current regime.
How to Use LTPI
Strategic Positioning:
Bullish: Favor holding or adding to long-term positions.
Bearish: Reduce risk, protect capital.
Neutral: Wait for confirmation before making significant moves.
Confirmation Tool:
LTPI works best when combined with shorter-term indicators like MTPI or trend-following tools to confirm alignment across multiple timeframes.
Dynamic Alerts:
Bullish Regime Entry: When the LTPI Score crosses above 0.1.
Bearish Regime Entry: When the LTPI Score crosses below -0.1.
Neutral Zone: When the score moves back between -0.1 and 0.1.
These alerts help identify significant macro-driven shifts in market conditions.
Conclusion
The Long-Term Probability Indicator (LTPI) is an advanced, liquidity-focused tool for identifying macro-driven market phases. By consolidating six inputs into a single probability score and presenting the results visually, LTPI helps long-term investors and analysts stay aligned with global liquidity trends and avoid being distracted by short-term volatility.
ATR % Line from LoD/HoDATR % Line Trading Indicator - Entry Filter Tool
This Pine Script creates a sophisticated ATR (Average True Range) percentage-based entry filter indicator for TradingView that helps traders avoid buying overextended stocks and identify optimal entry zones based on volatility.
Core Functionality - Entry Discipline
The script calculates a maximum entry threshold by taking a percentage of the Average True Range (ATR) and projecting it from the current day's low. This creates a dynamic "no-buy zone" that adapts to market volatility, helping traders avoid purchasing stocks that have already moved too far from their daily base.
Key Calculation:
Measures the ATR over a specified period (default: 14 bars)
Takes a user-defined percentage of that ATR (default: 25%)
Projects this distance from the day's low to establish a maximum entry threshold
Entry Rule: Avoid buying when price exceeds this ATR% level from the daily low or high.
Visual Features
Entry Threshold Line:
Draws a horizontal line at the calculated maximum entry level
Line extends forward for clear visualization of the "no-buy zone"
Red zones above this line indicate overextended conditions
Fully customizable appearance with color, width, and style options
Smart Entry Alerts:
Optional labels show the ATR percentage threshold and exact price level
Visual confirmation when stocks are trading in acceptable entry zones vs. extended areas
Real-Time Monitoring Table:
Displays current distance from daily low as ATR percentage
Shows whether current price is in "safe entry zone" or "extended territory"
Customizable display options for clean chart analysis
Practical Applications for Entry Management
Avoiding Extended Entries:
Primary Use: Don't initiate long positions when price is more than X% ATR from the daily low
Prevents buying stocks that have already made their daily move
Reduces risk of buying at temporary tops within the trading session
Entry Zone Identification:
Price trading below the ATR% line = potential entry opportunity
Price trading above the ATR% line = wait for pullback or skip the trade
Combines volatility analysis with momentum discipline
Risk Management Benefits:
Improved Entry Timing: Enter closer to daily support levels
Better Risk/Reward: Shorter distance to stop loss (daily low)
Reduced Chasing: Systematic approach prevents FOMO-driven entries
Volatility Awareness: Higher volatility stocks get wider acceptable entry ranges
Configuration for Entry Filtering
Key Settings for Entry Management:
ATR Percentage: Set your maximum acceptable extension (15-30% common for day trading)
Reference Point: Use "Low" to measure extension from daily base
Line Style: Make highly visible to clearly see entry threshold
Alert Integration: Visual confirmation of entry-friendly zones
Typical Usage Scenarios:
Conservative Entries: 15-20% ATR from daily low
Moderate Extensions: 25-35% ATR for stronger momentum plays
Aggressive Setups: 40%+ ATR for breakout situations (use with caution)
Entry Strategy Integration
Pre-Market Planning:
Set ATR% threshold based on stock's typical volatility
Identify key levels where entries become unfavorable
Plan alternative entry strategies for extended stocks
Intraday Execution:
Monitor real-time ATR% extension from daily low
Avoid new long positions when threshold is exceeded
Wait for pullbacks to re-enter acceptable entry zones
This tool transforms volatility analysis into practical entry discipline, helping traders maintain consistent entry standards and avoid the costly mistake of chasing overextended stocks. By respecting ATR-based extension limits, traders can improve their entry timing and overall trade profitability.

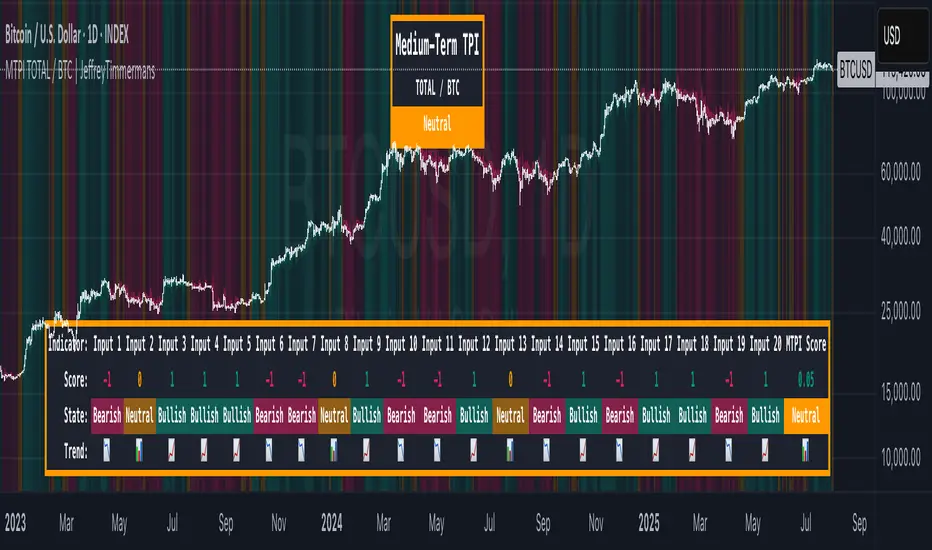
MTPI TOTAL / BTC | JeffreyTimmermansMedium-Term Probability Indicator (MTPI)
The "Medium-Term Probability Indicator (MTPI)" is a multi-factor model designed to evaluate the medium-term state of a market. By aggregating signals from 20 underlying inputs, it generates a composite score that classifies the market as Bullish, Bearish, or Neutral. This helps traders understand the prevailing market regime and adapt strategies accordingly.
Key Features
Multi-Input Scoring: Combines up to 20 individual inputs (indicators, conditions, or models) into a single probability-based score.
Composite Market State: Translates raw input signals into three states: Bullish, Bearish, or Neutral.
Dynamic Background Coloring: Uses color-coded background shading to visually separate bullish, bearish, and neutral phases.
MTPI Score: Calculates a final numeric score (ranging from -1 to +1) to quantify the market’s directional bias.
Dashboard Display: Shows all input signals, their individual states, and the aggregated MTPI score at a glance.
Medium-Term Focus: Helps identify prevailing conditions that last from several weeks to several months.
Inputs & Settings
MTPI Settings:
Input Signals (1 to 20): Default: Predefined conditions. Each input evaluates the market from a unique perspective (trend, momentum, volatility, etc.).
Composite Score Calculation: Default weighting is equal across all inputs.
Color Settings:
Bullish: Bright green background
Neutral: Gray/orange background
Bearish: Bright red background
These colors can be customized as desired.
Calculation Process
Signal Aggregation:
Each input generates a state:
1 to 0.1 = Bullish
0.1 to -0.1 = Neutral
-0.1 to -1 = Bearish
Scoring:
The MTPI aggregates these values and calculates an average score.
Classification:
Bullish: Score > 0
Bearish: Score < 0
Neutral: Score ≈ 0
Visualization:
Background Coloring: Highlights the dominant phase on the chart.
Dashboard: Displays individual input states, the total MTPI score, and the resulting classification.
How to Use the MTPI
Identifying Market Regimes:
Bullish: Majority of inputs align positively. Favor long positions or trend-following strategies.
Bearish: Majority of inputs align negatively. Favor short positions or defensive strategies.
Neutral: Mixed signals. Caution or range-bound strategies may be preferable.
Transition Detection:
Changes in background color or the MTPI dashboard (score flipping from positive to negative, or vice versa) indicate potential regime shifts.
Dynamic Dashboard:
Score: Displays the net sum of all input signals (normalized).
State: Provides the classification (Bullish, Bearish, Neutral).
Trend: Visual cues for each input showing the current contribution to the MTPI.
Conclusion
The Medium-Term Probability Indicator (MTPI) consolidates multiple signals into a single, intuitive visualization that helps traders quickly assess the medium-term market environment. Its combination of a multi-input dashboard, composite scoring, and background coloring makes it a powerful decision-support tool.
This script is developed by Jeffrey Timmermans and is designed to complement other analysis methods.
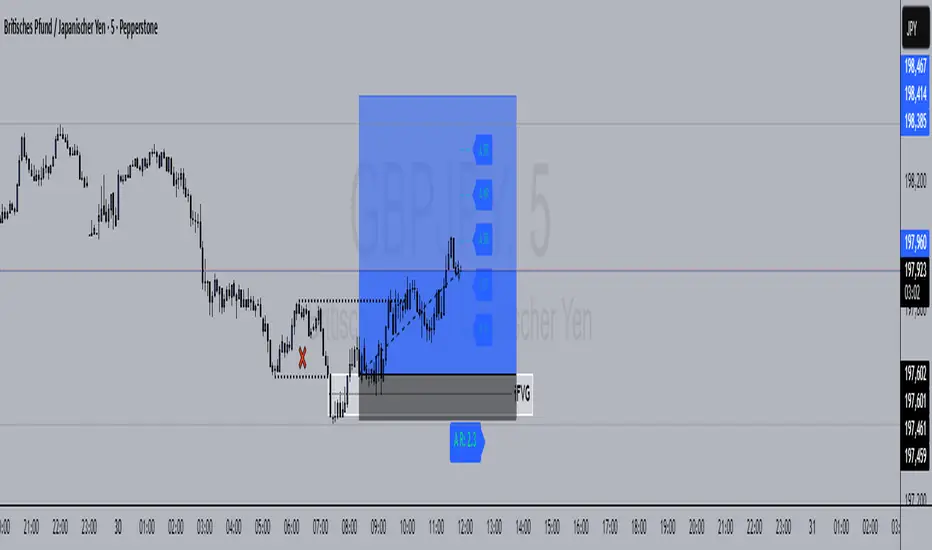
R Manager PRO++ – Multi-Setup Risk/Reward ToolDescription
The R Manager PRO++ V1.3d is an advanced risk/reward management tool designed for traders who want to visually plan, track, and manage multiple trade setups directly on their charts.
This script allows you to plot up to three independent setups (A, B, and C) simultaneously. For each setup, you can manually input your Entry and Stop Loss levels, and the tool will automatically calculate and display R-multiple levels (1R to 5R), providing a clear overview of your potential profit targets.
Key Features
Multi-Setup Management (A, B, C)
Track up to three separate trades at the same time, each with individual colors and controls.
Manual Entry & Stop Loss Input
Enter your trade levels manually for flexible usage across any market or strategy.
Automatic R-Multiple Calculation (1R to 5R)
The indicator automatically draws lines and labels for 1R to 5R targets based on your risk distance.
Live R Display
Real-time calculation of your current R multiple, updating with every price move.
Custom Symbol Selection
Link each setup to a specific symbol (e.g., EURUSD, XAUUSD, NAS100) to manage multiple markets without clutter.
Reset Function
One-click reset button to quickly clear individual setups.
Alerts for Reached R-Levels
Receive alerts when price reaches each R level (1R to 5R) to monitor trades without constant chart-watching.
How to Use
- Select Entry and Stop Loss levels manually in the input panel.
- Choose the symbol for each setup (supports Forex, Indices, Gold).
- Enable or disable setups individually with the Activate checkbox.
- Optional: Use the Reset button to clear a setup quickly.
- Monitor R-multiples visually and via alerts as price evolves.
Suitable For
- Swing traders
- Day traders
- Risk-based trading strategies (R-multiples)
- Multi-market portfolio management

2 Asset Optimal PortfolioThis script calculates and plots either the Sharpe Ratio or Sortino Ratio for a two-asset portfolio using historical price data, allowing users to analyse how different allocations affect portfolio performance over a specified lookback period.
Features:
Determine the weights of 2 assets and how they affect the the Sharpe or Sortino ratio.
Adjust timeframe to suit your personal investment timeframe.
User Inputs:
1. Asset 1 and Asset 2: Choose any two symbols to evaluate (default is BTCUSD for both).
2. Look Back Length: Number of past bars (days) to use for calculations (default is 365).
3. Source: Price source for returns (default is close).
4. Ratio: Select which ratio to plot — Sharpe or Sortino.
5. % of Asset 1: Portfolio weight (from 0 to 1) for Asset 1.

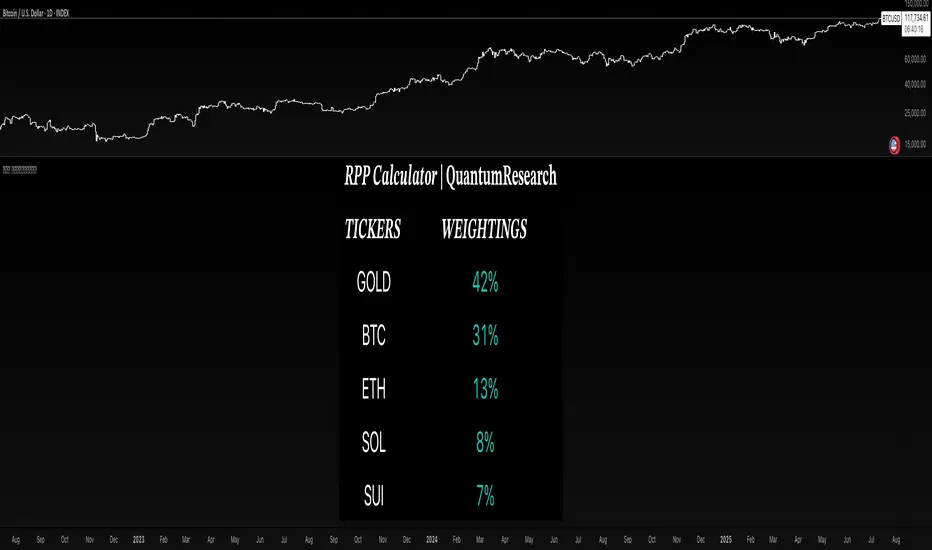
Risk Parity Calculator | QuantumResearch📊 Risk Parity Calculator | QuantumResearch
The Risk Parity Calculator by QuantumResearch is a dynamic asset allocation tool designed to help traders and portfolio managers distribute risk equally across multiple assets based on their relative volatility.
This script implements a simplified risk parity methodology, where allocation weights are inversely proportional to the recent volatility of each asset. The goal is to construct a portfolio in which each asset contributes equally to overall risk, rather than allocating by notional value or market cap.
🧠 How It Works
The indicator allows you to select up to 5 different assets (crypto, forex, indices, or commodities) and computes the following:
Logarithmic Return Volatility:
Uses log returns to calculate historical standard deviation over a custom period (default 14 bars).
Inverse Volatility Weighting:
Each asset’s weight is determined by 1 / volatility. Lower volatility assets receive higher weights.
Normalization:
All inverse volatility values are summed, and each is divided by that sum to generate the final weight (∑weights = 1).
Visual Output:
The results are shown in a custom table displaying:
Asset Tickers
Their respective portfolio weightings
Color-coded visuals to quickly assess risk-balanced contributions
This method favors diversification and seeks to reduce concentration risk by avoiding overexposure to more volatile assets like BTC or SOL, unless their volatility drops.
⚙️ Key Features
🔢 Supports 5 Custom Assets
Easily choose any combination of assets to construct your portfolio.
⚖️ Equalized Risk Contribution
Allocations scale automatically to reduce overexposure to high-volatility instruments.
🎨 Color-Coded Table
Visualizes relative weights, with color cues based on magnitude.
🔧 Adjustable Lookback
Modify the length used to compute volatility, giving you control over sensitivity.
🖥️ Flexible Table Position & Font Size
Fully customizable to match your layout preferences.
💡 How to Use It
Select your 5 assets using the input panel.
Set the length to control the volatility calculation window.
Observe the table output showing current risk-parity weights.
Use this to rebalance your portfolio, or validate your current exposure.
This is especially useful for portfolio reallocation, ETF modeling, or any strategy seeking risk-balanced diversification.
🛑 Disclaimer
This tool provides a simplified view of risk parity allocation and does not include cross-asset correlations or covariance matrix modeling. It is not a financial recommendation. Past performance and calculated weights do not guarantee future outcomes. Always apply proper risk management and conduct your own analysis.
ICT Smart Money Trading Suite [SwissAlgo]ICT/Smart Money Trading Suite - Technical Analysis Indicator
----------------------------------------------------------
OVERVIEW
The ICT/Smart Money Trading Suite is a technical analysis indicator that implements concepts from Inner Circle Trader (ICT) methodology and Smart Money Concepts (SMC).
ICT methodology was developed by Michael J. Huddleston (ICT) and focuses on understanding Institutional market behavior.
Smart Money Concepts builds upon these ideas to analyze how large Financial Institutions and/or Market Makers seem to operate in the markets.
This indicator combines multiple analytical tools into a single package for market structure analysis, imbalance detection, and the observation of institutional order flow.
----------------------------------------------------------
CORE COMPONENTS
Market Structure Analysis:
- External Structure : Major swing highs and lows that define broader price movement (these are the most significant structural points that institutions reference for their positioning and typically require substantial volume and momentum to break)
- Internal Structure : Shorter-term pivots showing micro-trend developments within the External Structure (these internal pivot highs and lows often represent areas where retail traders may be positioned on the wrong side of the market as they frequently form just before major structural breaks or trend continuations, creating liquidity that institutions can utilize)
- Structural Breakout Detection : Identification of structure breaks and potential trend changes ( 'Change of Character' which occurs when the External Structure shifts from bullish to bearish bias or vice-versa indicating a potential major trend reversal, and 'Break of Structure' which happens when price decisively takes out previous significant highs in a bearish trend or previous significant lows in a bullish trend confirming trend continuation or acceleration)
- EMA Cloud : Dynamic support and resistance zones with trend context (additional reference point)
Imbalance Zone Detection:
Fair Value Gaps (FVGs):
Price inefficiencies that occur between candles when sudden price moves create gaps in price delivery
Typically formed when the low of a bullish candle is higher than the high of the candle two periods prior, or when the high of a bearish candle is lower than the low of the candle two periods prior
These gaps represent areas where price moved too quickly without adequate two-way auction process
Institutions may return to fill these inefficiencies at a later time for proper price discovery
The theory suggests that all price ranges should eventually be traded through to complete the auction process
Gaps are automatically removed from the chart when price fully retraces back through the inefficient area
Order Blocks (OBs):
Specific candles that occur immediately before significant market moves and represent institutional decision points
Identified as the last opposing candle before a strong directional move (final bearish candle before major bullish move or final bullish candle before major bearish move)
These candles contain the orders and liquidity that institutions used as a foundation for their market manipulation
Represent areas where large institutional players positioned themselves to move the market significantly
Price may return to these levels to collect additional liquidity or test institutional resolve
The candle's full range (high to low) is considered the active zone where institutional interest may remain
Vector Candle Recovery:
Zones created by high-activity candles that demonstrate unusually large range and volume characteristics
These candles are interpreted as manipulative price pushes designed to hunt liquidity and trigger stop losses
Often used by institutions to induce retail traders into poor positions before reversing direction
Recovery zones represent the full range of these vector candles where price may retrace
The concept assumes that extreme moves often get partially retraced as the market corrects from artificial price displacement
Zones are invalidated when a significant portion of the vector candle range is retraced (typically 50% or more)
Support & Resistance:
Key price zones based on historical price reactions and pivot clustering analysis
Calculated through algorithmic identification of areas where price has repeatedly found buyers (support) or sellers (resistance)
Strength is determined by the number of times price has reacted from these levels and the volume of activity at these zones
Represent psychological and algorithmic reference points where institutional systems are likely to place orders
Create areas of increased probability for price reactions due to concentration of pending orders and decision-making activity
Zones are color-coded based on current price position: green for support (price above), red for resistance (price below), yellow for neutral (price within)
Liquidity Analysis:
- Liquidity Pools : Areas above or below key levels where stop orders may cluster
- Kill Zones : Time-based periods associated with increased market activity
- Daily/Weekly/Monthly Price Levels : Key institutional reference points (price highs/lows)
Vector Candles/Price Manipulation:
Advanced algorithm identifying statistically significant candles using volume delta analysis, range statistics, and persistence scoring.
----------------------------------------------------------
VISUAL INTERPRETATION - DETAILED GUIDE
MARKET STRUCTURE
External Structure (Thick Lines):
- Green thick lines: Major support levels (external lows) that define bullish structure
- Red thick lines: Major resistance levels (external highs) that define bearish structure
- These lines represent significant swing points that institutions may reference
- Lines extend from the swing point and update as the structure evolves
Internal Structure (Thin Lines):
- Green thin lines: Minor support levels showing internal market structure
- Red thin lines: Minor resistance levels showing internal market structure
- More frequent updates than external structure, showing micro-trend changes
Structure Markers:
- Small triangles with "H": External pivot highs (major resistance points)
- Small triangles with "L": External pivot lows (major support points)
- Small dots: Internal pivot points (minor structure without text)
- Markers appear with a 20-bar delay to confirm pivot validity
HIGHS/LOWS LEVELS
Daily Levels (Green Dashed Lines):
- Horizontal dashed lines marking the previous day's high and low
- Updates at the start of each new trading day
- Gradient effect shows historical importance (newer = more opaque)
- Acts as institutional reference points for intraday trading
Weekly Levels (White Dashed Lines):
- Horizontal dashed lines marking the previous week's high and low
- Updates at the start of each new trading week
- Typically more significant than daily levels for swing trading
- Often respected by institutional algorithms
Monthly Levels (Orange Dashed Lines):
- Horizontal dashed lines marking the previous month's high and low
- Updates at the start of each new trading month
- Highest significance levels for long-term institutional positioning
- Major psychological and algorithmic reference points
VECTOR CANDLES
Candle Body Coloring System:
- Lime Green Bodies: Ultra-bullish vector candles (Z-score ≥ 3.0)
- Blue Bodies: Abnormal bullish vector candles (Z-score 2.0-2.99)
- Bright Red Bodies: Ultra-bearish vector candles (Z-score ≥ 3.0)
- Purple Bodies: Abnormal bearish vector candles (Z-score 2.0-2.99)
- Faded Green/Red: Normal market activity candles
Vector Identification Criteria:
- Statistical significance based on range and volume delta
- Persistence scoring (how much directional pressure remained)
- ATR-based absolute detection (candles >2x ATR automatically qualify)
- These candles often precede significant market moves or reversals
EMA CLOUD
Purple Cloud Visualization:
- Central line: 50-period EMA (blue line)
- Upper boundary: EMA + dynamic standard deviation band
- Lower boundary: EMA - dynamic standard deviation band
- Cloud fill: Purple semi-transparent area between boundaries
Interpretation:
- Price above cloud: Bullish bias context
- Price below cloud: Bearish bias context
- Price within cloud: Neutral/transitional zone
- Cloud thickness adapts to market volatility automatically
KILL ZONES
Background Highlighting:
- Yellow background tint during active kill zone periods
- London Session: 08:00-11:00 (UTC+1 time)
- NY Open: 13:00-16:00 (UTC+1 time)
- NY Close: 19:00-21:00 (UTC+1 time)
- Times automatically adjust to the chart timezone
Purpose:
- Highlights periods of typically increased institutional activity
- Times when liquidity hunting and manipulation often occur
- Periods when significant directional moves frequently begin
IMBALANCE ZONES - DETAILED BREAKDOWN
Fair Value Gaps (FVGs):
- Green boxes: Bullish FVGs (gap between bear candle high and bull candle low)
- Red boxes: Bearish FVGs (gap between bull candle high and bear candle low)
- Gray dotted lines: Midpoint of each gap (50% retracement level)
- Text label: "Fair Value Gap" in top-right corner
- Auto-removal: Boxes disappear when the price fills the gap
Order Blocks (OBs):
- Green boxes: Bullish order blocks (demand zones from the last bear candle before bullish vector)
- Red boxes: Bearish order blocks (supply zones from the last bull candle before the bearish vector)
- Gray dotted lines: Midpoint of each order block
- Text label: "OB" in top-right corner
- Invalidation: Boxes removed when price breaks below (bull OB) or above (bear OB)
Vector Candles Recovery Zones:
- Green boxes: Recovery zones after bullish vector candles
- Red boxes: Recovery zones after bearish vector candles
- Gray dotted lines: Midpoint of the vector candle range
- Text label: "Vector Recovery" on the right side
- These mark the full range of significant vector candles where retracements may occur
Support & Resistance Zones:
- Green boxes: Support zones (price currently above the zone)
- Red boxes: Resistance zones (price currently below the zone)
- Yellow boxes: Neutral zones (price within the zone)
- Text labels: "Support", "Resistance", or "Support/Resistance"
- Based on historical pivot clustering and strength analysis
Liquidity Pools:
- Green boxes: Bullish liquidity pools (below recent lows where buy stops cluster)
- Red boxes: Bearish liquidity pools (above recent highs where sell stops cluster)
- Gray dotted lines: Key liquidity level within the pool
- Text label: "Liquidity Pool" on the right side
- Zones where institutional players may hunt stop losses before reversing
----------------------------------------------------------
CALCULATION METHODOLOGY
Vector Candle Algorithm:
- Statistical Analysis using 48-bar lookback period
- Z-score thresholds: 2.0 (abnormal), 3.0 (ultra)
- ATR-based significance filtering
- Volume Delta Integration with lower timeframe analysis
- Persistence scoring based on directional pressure sustainability
- Combined scoring system (delta + range)
- Absolute Vector Detection for candles exceeding 2x ATR
Market Structure Parameters:
- Swing Size: 20-period pivot detection
- Breakout Threshold: 3 consecutive breaks for structure confirmation
- EMA Length: 50-period with dynamic cloud sizing
Fair Value Gap Detection:
- Auto Threshold: Dynamic gap sizing based on asset volatility
- Manual Threshold: User-defined minimum gap percentage
- Mitigation Logic: Automatic removal when price fills gaps
----------------------------------------------------------
TARGET USERS
This indicator is designed for traders who:
- Study Inner Circle Trader concepts
- Apply Smart Money Concepts in their analysis
- Focus on market structure and institutional behavior
- Seek confluence-based trading approaches
- Use higher timeframe bias for decision making
Experience Level: Intermediate to Advanced
Requires understanding of market structure concepts and institutional trading theory.
Recommended Timeframes:
- Analysis: 4H, Daily for market structure context
- Execution: 1H, 15min for entry timing
- Lower timeframes: With higher timeframe alignment
----------------------------------------------------------
CUSTOMIZATION OPTIONS
Display Controls:
- Master toggle for all imbalance zones
- Individual controls for each concept type
- Market structure line visibility
- Kill zone highlighting
- EMA cloud display
Visual Settings:
- Automatic light/dark mode color adaptation
- Adjustable zone transparency levels
- Extension distance controls
- Descriptive text labels
Technical Parameters:
- Vector candle sensitivity thresholds
- Historical analysis lookback periods
- Maximum zone display limits
- Zone invalidation conditions
----------------------------------------------------------
EDUCATIONAL BACKGROUND
Inner Circle Trader (ICT): A trading methodology developed by Michael J. Huddleston that focuses on understanding how institutional traders and market makers operate. The approach emphasizes market structure, liquidity concepts, and timing based on institutional behavior patterns.
Smart Money Concepts (SMC): An evolution of ICT principles that analyzes how large financial institutions move markets. These concepts include order blocks, fair value gaps, liquidity hunting, and market structure shifts.
Both methodologies are based on the premise that understanding institutional trading behavior can provide insights into market direction and timing.
----------------------------------------------------------
IMPORTANT DISCLAIMERS
This indicator is provided for educational and analytical purposes only. It is not financial advice and does not guarantee trading results.
Trading involves substantial risk of loss. Past performance does not indicate future results. Users should thoroughly understand the underlying concepts before applying them to live trading.
The effectiveness of these analytical methods may vary across different market conditions, timeframes, and instruments. Proper risk management and additional analysis are essential.
This indicator is a tool for market analysis, not a complete trading system. Success requires understanding of market principles, risk management, and continuous learning.
Always test analytical approaches thoroughly using historical data and demo accounts before implementing with real capital.

Assets Correlation AnalyzerAssets Correlation Analyzer
---------------------------------------------
What is it?
The Assets Correlation Analyzer is a technical indicator that measures and visualizes the statistical relationship between any two financial assets (a 'Base Asset' vs. a 'Comparison Asset', example Gold vs. SPY or Nasdaq vs. Bitcoin). The indicator calculates dynamic correlation tracking using statistical methods, confidence intervals, and category-wide analysis capabilities.
---------------------------------------------
Why was it built? / Potential Benefits
This indicator was developed to help analyze inter-asset relationships in portfolio management and trading strategies. The indicator can be used for:
Risk Assessment: Identify when assets begin moving together
Diversification Analysis: Monitor portfolio component relationships
Pairs Trading: Identify when correlated assets diverge
Market Analysis: Recognize shifts in market conditions through correlation patterns
Asset Analysis: Support decision-making based on correlation dynamics
Hedging Analysis: Identify relationships between different instruments
---------------------------------------------
How it Works
The indicator employs established statistical methods to calculate rolling correlations between two selected assets:
Data Collection: Retrieves price data for both selected assets using TradingView's security function
Returns Calculation: Computes logarithmic or simple returns based on user preference
Outlier Filtering: Optionally removes extreme price movements (beyond 2.5 standard deviations) to improve accuracy
Correlation Computation: Calculates either Pearson or Spearman rank correlation over the specified period
Signal Generation: Applies smoothing and generates a signal line (EMA) for momentum detection
Confidence Assessment: Evaluates data quality and provides confidence metrics
---------------------------------------------
How to Read the Oscillator
Main Correlation Line
Values Range: -1.0 to +1.0
+1.0: Perfect positive correlation (assets move identically)
+0.7 to +0.99: Strong positive correlation
+0.3 to +0.69: Moderate positive correlation
-0.3 to +0.29: Weak/No significant correlation
-0.69 to -0.31: Moderate negative correlation
-0.99 to -0.7: Strong negative correlation
-1.0: Perfect negative correlation (assets move oppositely)
Color Coding System
Green shades: Positive correlation levels, with brighter green indicating stronger positive correlation
Red shades: Negative correlation levels, with brighter red indicating stronger negative correlation
Gray: Insufficient data or transitional periods
The color intensity reflects both correlation strength and momentum relative to the signal line.
Signal Line (Gray)
The EMA-based signal line helps identify momentum changes:
Correlation above signal: Positive momentum in correlation
Correlation below signal: Negative momentum in correlation
Crossovers: Potential turning points in the relationship
Background Fills
Gradient fills provide a quick visual assessment of correlation strength, with intensity indicating the degree of correlation.
---------------------------------------------
Correlation Calculation Methods and Options
Calculation Methods
Spearman Rank Correlation (Default)
Uses ranked values rather than raw prices
Less sensitive to outliers and non-linear relationships
Suitable for volatile or non-normally distributed assets
Pearson Correlation (Traditional)
Standard linear correlation method
More sensitive to outliers
Suitable for assets with normal distribution patterns
---------------------------------------------
Customization Options
Correlation Period (7-500 bars): Determines the lookback window for calculation
Signal Line Period (1-200 bars): Controls the smoothing of the signal line
Outlier Removal: Automatically filters extreme price movements
Return Type: Choose between logarithmic (recommended) or simple returns
Smoothing Period: Reduces noise in correlation readings
---------------------------------------------
Asset Categories
The indicator includes 80+ pre-configured assets across multiple categories:
Metals: Gold, Silver, Copper, Platinum, Palladium, Nickel, Zinc, Aluminum
Energy: WTI/Brent Crude, Natural Gas, Uranium
Agriculture: Corn, Soybeans, Wheat, Coffee
ETFs: Major indices, sector, geographic, and specialty ETFs
Bonds: Government and corporate bond instruments
Financial: Currency pairs, treasury yields, volatility indices
Cryptocurrencies: Major digital assets and market cap indices
Real Estate: REITs and real estate focused instruments
---------------------------------------------
For Whom This Indicator Is Designed
Intended Users
Portfolio Managers: Asset allocation and risk assessment
Quantitative Traders: Correlation-based strategy development
Risk Analysts: Correlation monitoring and analysis
Institutional Investors: Diversification analysis
Active Traders: Pairs trading and arbitrage analysis
Skill Level
Intermediate to Advanced: Requires understanding of correlation concepts and statistical interpretation
Experience with Statistics: Users should be familiar with correlation analysis concepts
---------------------------------------------
Information Tables
Main Analysis Table
Displays current correlation value, data confidence percentage, and selected asset information.
Category Correlation Table
Shows correlation strength between the selected 'Base Asset' (in the chart, Gold) and all assets in the comparison asset's category.
---------------------------------------------
Alert Conditions
Four built-in alert types:
Strong Stable Positive Correlation: Triggers when correlation exceeds +0.8 with low volatility
Strong Stable Negative Correlation: Triggers when correlation falls below -0.8 with low volatility
Bullish Correlation Momentum: Signals when correlation crosses above the signal line
Bearish Correlation Momentum: Signals when correlation crosses below the signal line
---------------------------------------------
Usage Notes
Longer periods (30-50 bars) provide more stable analysis
Shorter periods (10-20 bars) provide more responsive signals
Monitor confidence levels - correlations with <75% confidence should be interpreted cautiously
Correlations tend to increase during market stress periods
Should be used in conjunction with other analysis tools
---------------------------------------------
Important Disclaimer
This indicator is for educational and informational purposes only. It should not be considered as financial advice or a recommendation to buy, sell, or hold any financial instrument. Past correlation patterns do not guarantee future relationships between assets. Users should conduct their own research and consider consulting with a qualified financial advisor before making investment decisions. Trading and investing involve substantial risk of loss, and correlation analysis cannot eliminate these risks. The accuracy of correlation calculations depends on data quality and market conditions, which can change rapidly.

Bitcoin Basket [100Zabaan]🟢🟢 Bitcoin Basket 🟢🟢
🟡 Overview
This indicator is a long-term analytical tool for Bitcoin investment, designed by drawing inspiration from historical halving cycles, historical peak growths and deepest declines, and the overall price growth trend. The main goal of this indicator is to provide a strategic perspective to investors so they can better identify key market phases, such as periods of major selling and major buying of Bitcoin.
🟡 This tool visually compares two scenarios:
Hold Strategy : The strategy of buying and holding Bitcoin from the time of investment until today ( Bitcoin Holding Strategy ).
Active Investment Strategy : An active investment strategy that cautiously buys and sells based on market cycle-driven signals ( Active Bitcoin Trading Strategy ).
This comparison helps you make more informed decisions regarding your long-term capital management.
🟡 Key Features of the Indicator
Performance Comparison : Displays the current value of your investment based on two strategies:
Bitcoin Holding Strategy : If you had invested an amount on your chosen date, how much Bitcoin (equivalent to how many dollars) would you have today.
Active Bitcoin Trading Strategy : How your capital would have grown if you had traded based on the indicator's buy and sell signals.
Also, in the status line section, you can see your asset amount (in USD) at each candle and compare the two strategies.
Identification of Buy and Sell Periods : Using colored boxes (red and green), it identifies time periods that have historically been suitable for selling or buying.
Identification of Suitable Price Ranges in Buy and Sell Periods : With a horizontal line within the red boxes, it informs us that prices above this line may be worth selling. With a horizontal line within the green boxes, it informs us that prices below this line may be worth buying.
Halving Display: Shows the exact time of each halving along with the block reward for each block produced during that halving.
Display of Maximum Drawdown During the Investment Period: In the provided table, you can see the maximum loss incurred in each of the two strategies during your hypothetical investment period, on what date this occurred, and what your capital was before and after in each of the two scenarios.
Display of Buy and Sell Suggestions: You can also see the suggested amount of Bitcoin to buy and sell at what prices, based on your investment amount.
Alarm: This indicator usually provides an alarm one or more days before the start of a selling period, notifying you that a sell signal will be issued soon.
Customization Options: In this indicator, you can customize your investment date and amount. You can also determine the display of label text (including price and buy/sell amount) and its size. This indicator also supports the Persian language.
🟡 How it Works and Signal Issuance Mechanism
This indicator uses three main methods for calculations:
Deceleration of Overall Price Growth : This indicator has found that the price of Bitcoin grows and fluctuates around an overall axis, and the intensity of this upward axis's growth gradually decreases.
Halving Impact : This indicator has found that the price of Bitcoin has grown from approximately one year before a halving and this growth continues for at least one year after the halving. It has also found that the price experiences a sharp one-year decline in the range between two halvings. Consequently, time-wise, based on halving, it displays a selling period (as a red box) on the chart. Considering the Bitcoin price growth explained in the previous point, it draws a line in the middle of the red box, identifying prices above that line as a suitable selling area. The inverse of this process is considered for buying.
Historical Peak Growths and Deepest Declines : This indicator analyzes Bitcoin's historical peak growths and deepest declines. Based on this, when declines are relatively large compared to what has occurred in the past, it issues the first buy suggestion. If the price decline continues, it sequentially issues the second and finally the third buy suggestion. The inverse of this process is followed for issuing sell suggestions.
🟡 Usage Guide
Add the indicator to your chart
Go to the indicator's settings section
In the Inputs tab, you can adjust the following values:
Set the initial investment amount in USD
Set the investment start date, from which calculations will begin
Set the language for displaying information on the chart, which is English by default
Display or hide labels for price and buy/sell volume on candles
The indicator will automatically display the results on the chart and in its information panel
🟡 Important Notes and Limitations
Compatibility : This indicator is specifically designed for the BTCUSD pair. To access the maximum historical data, you must use the INDEX broker chart and the Daily timeframe ; otherwise, the indicator will display a warning message.
Long-Term Tool : This indicator is a macro analysis tool. Its signals are rarely issued and are designed to capture large trends spanning several months or years. This tool is by no means suitable for day trading or scalping.
Non-Repainting : Buy and sell signals become definitive after the daily candle closes and do not change in the past. This feature increases the validity of backtests.
Note Regarding the Source Code : The core logic of this indicator, especially the proprietary formulas used, is the result of personal research and development. To preserve this unique methodology and ensure its integrity for future developments, this version is released as closed-source. However, we have made every effort to fully and transparently describe the indicator's logic and operational process in the explanations.
🔴 Disclaimer
This indicator is provided solely for educational, informational, and analytical purposes and should under no circumstances be considered financial advice or a definitive signal for buying and selling. Past market performance is by no means a guarantee of future results. All investment and trading activities involve risk, and the user is solely responsible for any profits or losses. Please conduct your own research and consult with a financial advisor before making any financial decisions.
🔴 Developers: Mr. Mohammad sanaei, Mrs. Hamideh Azari
⭐️⭐️ Feel free to share your feedback in the comments ⭐️⭐️
این اندیکاتور ابزاری تحلیلی و بلندمدت برای سرمایهگذاری در بیتکوین است که با الهام از چرخههای تاریخی هاوینگ، بیشترین رشد و افت ها تاریخی و روند کلی رشد قیمت طراحی شده است.
هدف اصلی این اندیکاتور، ارائه یک دیدگاه استراتژیک به سرمایهگذاران است تا بتوانند فازهای کلیدی بازار مانند دورههای فروش عمده و خرید عمده بیت کوین را بهتر شناسایی کنند.
🔴 توسعه دهندگان: محمد ثنائی، حمیده آذری
⭐️⭐️ لطفاً نظرات خود را در کامنتها با ما در میان بگذارید; از خواندن بازخوردهای شما خوشحال میشویم. ⭐️⭐️

RS Alpha α | viResearchRS Alpha α | viResearch
Conceptual Foundation and Strategy Innovation
RS Alpha α is a dynamic, multi-asset crypto allocation engine designed for precision rotation among trending major assets. Grounded in intra-asset relative strength and enhanced by real-time trend classification, this model moves beyond static filters—adapting allocations to prevailing momentum and volatility regimes.
The strategy is purpose-built to extract tactical alpha in high-beta environments while minimizing whipsaw and drawdowns during uncertain conditions. It achieves this via a systematic, multi-layer filter stack: statistical ranking, trend validation, and risk-adjusted performance scoring.
Technical Architecture and Signal Composition
Relative Strength Matrix:
Assets are scored using a comprehensive 7x7 ratio matrix comparing each asset’s relative momentum against all others. Each row contributes to a cumulative trend score, identifying the top-performing names based on cross-asset strength.
Trend Filters (Multi-Timeframe Adaptive):
Each candidate must pass intra-trend classification (12H, 8H, 4H) and optionally a macro trend regime filter using a user-defined market benchmark (e.g., BTC or ETH on 1D).
Beta & Alpha Filter:
Assets are further screened using custom beta and alpha calculations versus a benchmark. When enabled, only assets showing above-median beta and alpha values are retained.
Optional Risk Ratios:
Sharpe, Sortino, and Omega ratio filters are included (opt-in) for forward testing purposes. These risk metrics refine selection in volatile regimes but are not required for core functionality.
Equity Engine & Allocation Logic:
A real-time system equity curve grows based on rate of change (ROC) from allocated assets, with support for:
100% single asset allocation
50/50 equal split if scores match closely
80/20 weighted allocation based on dominance
Performance Tracking and Alerts
System Equity Visualization: Real-time equity plotted using dynamic coloring tied to the primary asset allocation.
Drawdown Table: Tracks max equity drawdown since a user-defined start date.
Dominant Asset Panel: Displays current allocation format (100%, 80/20, or 50/50) and scoreboard of all considered assets.
Allocation Alerts: Sends alerts when asset rotation occurs, with clear breakdowns of new weightings and symbol changes.
Timeframe Guard: Warns users if running on anything other than the recommended 1D timeframe.
Customization and UX Enhancements
Asset Inclusion Toggle: Easily exclude assets from rotation by changing their input to "USDT".
Background Overlay (Optional): Background color highlights the dominant asset dynamically, with adjustable transparency.
User Switches for All Visual Modules: Toggle individual elements such as alerts, drawdown, dominant tables, or error messages.
Use Case and Target Audience
This tool is ideal for:
Active crypto portfolio managers seeking structured, rule-based asset rotation
Tactical traders who value adaptability and clarity in allocation shifts
Swing traders operating within medium to high-beta environments
It thrives particularly during bull trends, sector rotations, or when paired with macro regime filters like market confidence signals.
Summary
RS Alpha α provides a comprehensive, data-driven framework for crypto asset rotation. It combines statistical rigor with real-time responsiveness, offering high customization and strong risk awareness. Designed for professionals and advanced retail traders alike, it’s both a decision-support tool and a visual performance dashboard.
⚠️ Always validate any strategy with proper backtesting and forward tracking. While RS Alpha α provides robust signal logic, it is one component in a larger portfolio and risk management process.

Screener - Moving Average / ATR Breakout Signal [ARTech]Screener - Moving Average / ATR Breakout Signal
This indicator features a powerful multi-symbol screener that scans up to 40 user-defined symbols in real time for Moving Average (MA) and ATR breakout signals. Users can customize the list of symbols, select the asset class (e.g., Crypto, Stocks, Forex). The screener detects trend-following signals based on price crossing a chosen MA type and length, enhanced by optional ATR-based volatility filters and breakout thresholds to improve signal accuracy. Signals can be displayed on the chart via labels, tooltips, or a compact signal table, allowing traders to monitor multiple markets simultaneously without switching charts. The list of symbols generating signals can also be tracked with customizable alerts, enabling traders to receive real-time notifications for long and short breakout signals directly via TradingView alerts.
This indicator is developed based on the concept of Moving Average / ATR Breakout Signal script on TradingView, with enhancements to support multi-symbol scanning.
Key Features
• Multi-Symbol Screener: Scans up to 40 user-defined symbols simultaneously, with automatic separator detection and symbol validation.
• Repaint Prevention: Carefully designed to avoid repaint issues. The script structure and signal logic have been built to ensure reliable behavior, even across multiple symbols and varying chart conditions.
• Flexible Signal Display: Offers chart labels, tooltips, or a compact table to show signals, enabling multi-market monitoring without switching charts.
• Customizable Alerts: Supports alerts for both long and short signals, sending a list of symbols generating signals as real-time notifications.
• Multi-Type Moving Average Support: Choose from several MA types including EMA, SMA, Hull MA, VWMA, RMA, and TEMA, with customizable source and length settings.
• Flexible Signal Logic: Generates signals when price breaks above or below the selected MA, with options for confirmation candles and wick or close based breakout detection.
• ATR-Based Filtering: Utilizes ATR to create dynamic breakout bands around the MA, reducing noise and improving breakout validation.
• Breakout Threshold Filtering: Adds an optional minimum percentage price move before a new opposite signal is allowed, preventing rapid reversals.
Why use this indicator?
• Scans up to 40 symbols at the same time.
• Users can define the symbol list, asset class, and automatically detects the symbol separator; warns if any symbols are invalid
• Detected signals are shown directly on the chart as labels, tooltips, or in a compact table.
• The list of signal-generating symbols can be tracked with alerts — no need to watch the chart constantly.
How to Use
███████ Alerts ███████
🔸 Long / Short
To enable Custom Alerts, select the desired alert type (Long or Short) from the indicator's settings under the "Alerts" section, you can customize messages and enable notifications for Long and Short signals. Then, you need to activate the fx alert() function call option in TradingView’s alert creation dialog.
Alert messages include your custom message followed by a list of symbols currently giving signals, each shown on a new line. For example, if your input message is set to “🟢 Long Signal” and BTCUSD and ETHUSD are signaling, the alert will look like this:
🟢 Long Signal
BTCUSD
ETHUSD
This format helps you clearly see the type of signal and each symbol individually, making real-time monitoring easier.
🔸 Alert Delay (seconds)
This setting adds a delay before alerts are triggered. It helps ensure that signals are based on confirmed bar closures for slight timing differences between symbol data feeds (especially in multi-symbol mode). For example, setting a 30-second delay allows all symbols to finish processing before the alert fires, avoiding early or incomplete signal lists.
For best results, try different delay values to see what works best with your selected timeframe.
███████ Display / Signal ███████
🔸 Display Mode
Choose how the indicator presents signals on your chart. Focus on a single symbol (Chart mode), Scan and display multiple symbols at once (Screener mode), or hide visuals and use only tables or alerts (No mode).
• Chart Mode: Displays signals only for the current chart symbol. Useful for testing and optimizing signal conditions before scanning multiple assets.
• Screener Mode: Activates the screener functionality, showing results for all valid symbols in your list. Signals appear as labels on the chart and are also listed in the signal table for easy tracking.
• No (Table Only): Hides all on-chart visuals (labels, markers). Signals are still processed and can be viewed in tables or used with alerts. This mode is ideal when you're using multiple screeners at once and want to avoid overlapping visuals. Each screener can display its results in separate table positions (e.g., bottom right, top left, etc.), so turning off chart visuals helps keep your workspace clean while still tracking multiple symbol groups efficiently. This way, you can also track more than 40 symbols by using multiple screener instances with different symbol groups and table positions.
🔸 Long
You can independently turn ON or OFF the display of Long signals using the toggle.
🔸 Short
You can independently turn ON or OFF the display of Short signals using the toggle.
███████ Symbols ███████
🔸 Symbols
You can enter up to 40 symbols. Symbols must be written in full format. For example: BINANCE:BTCUSDT, NASDAQ:AAPL, or OANDA:EURUSD. TradingView requires this full format to correctly recognize each symbol. Due to TradingView’s limitations, only the first 40 symbols in your list will be processed
- Separator Rules: Letters (A–Z), numbers (0–9), underscore (_), dot (.), and exclamation mark (!) are allowed within symbol names (e.g., BINANCE:BTCUSDT.P). Therefore, avoid using them as separators. Instead, use comma (,) , semicolon (;) , space , or newline to separate multiple symbols.
- Auto Detection: The indicator automatically detects the separator used in your list. If the format is incorrect or a symbol is invalid, a warning will appear to help you fix it.
🔸 Symbol Filter
When scanning multiple symbols, it's important that they belong to the same market type (Crypto, Stocks, Forex, etc.). Different markets have different trading hours, and mixing them may cause issues.
For example, if your chart is using a stock symbol (like NASDAQ:AAPL) and your symbol list includes crypto symbols (like BINANCE:BTCUSDT), the screener may not work correctly. Since stock markets are not open 24/7, the chart time may fall outside of crypto trading hours — causing crypto signals to fail or not update properly.
To avoid this issue, the indicator includes a Symbol Filter. This lets you filter your symbol list to include only the correct asset type (e.g., only Crypto or only Stocks). By using this filter, you make sure the screener runs under the correct market conditions and avoids signal mismatches.
If you set the filter to None , no filtering will be applied. In this case, you are responsible for making sure all listed symbols match your chart’s market type.
For best results, always use symbols from the same market type as your chart symbol. This ensures that candle open/close times align across all symbols, avoiding timing mismatches. Symbols and the chart must follow the same market hours for accurate and consistent signal generation.
🔸 Show Symbols on Table
This feature helps you quickly review the symbols you've entered. When enabled, a table appears in the bottom-right corner of the chart displaying all symbols from your list along with their market types and statuses
- Green background: Symbol is valid and matches the selected Symbol Filter. It can generate signals.
- Gray background: Symbol is valid but does not match the selected filter. It will not generate signals.
- Red background: Symbol is invalid (e.g., due to incorrect names, delisting, or unsupported by broker).
You don’t need to remove invalid or mismatched symbols, but no signals will be generated for them. This visual check makes it easier to catch symbol issues before relying on the screener output.
███████ Signal Display Style ███████
🔸 Display Method
Choose how signals will be shown visually
• Label: The signal appears as a label on the candle. The label includes all triggering symbols as text.
• Tooltip: An icon (such as 🟢 or 🔴) is shown instead of full text. Hold your mouse pointer on the icon on chart for a few seconds to see a tooltip listing the triggered symbols. This method keeps your chart cleaner and less cluttered.
• None: No visual markers appear on candles. Signals are only visible in the signal table — ideal if you're using multiple indicators and want to avoid chart clutter.
🔸 Symbol Display Format
This setting affects the labels, tooltips, signal table, and alert messages, ensuring consistency across all displays. Select whether you want symbols to appear as:
• EXCHANGE:SYMBOL: BINANCE:BTCUSDT
• SYMBOL: BTCUSDT
🔸 Long Signal Icon
Used only in Tooltip mode, these icons (e.g., 🟢 for Long) appear on bars where signals are detected. Customize it freely to match your style or strategy.
🔸 Short Signal Icon
Used only in Tooltip mode, these icons (e.g., 🔴 for Short) appear on bars where signals are detected. Customize it freely to match your style or strategy.
🔸 Size
Adjust the visual size of labels or tooltips. Smaller sizes help reduce clutter when many signals trigger in close proximity.
███████ Signal Table ███████
This section controls the appearance and behavior of the signal table that displays last detected Long and Short signals for your symbols.
🔸 Show
Enable or disable the signal table display on the chart.
🔸 Highlight Signal Duration (Bars)
When a signal occurs, the corresponding cell in the table is highlighted using the selected Long or Short color for this many bars. This helps visually track recent signals over time. The bar where the signal icon appears is counted as 1.
🔸 Table Size
Choose the size of the table to fit your chart layout and readability preferences.
🔸 Table Position
Select where the table appears on your chart (e.g., top right, middle right, bottom left).
🔸 Title
Customize the table header text. The default is “Recent Signals”.
🔸 Background Color
Set the table’s background color and transparency to match your chart’s theme.
🔸 Long Signal Color
Choose the highlight color used to mark Long signals within the table.
🔸 Short Signal Color
Choose the highlight color used to mark Short signals within the table.
🔸 Text Color
Customize the text color inside the table for better contrast and readability.
🔸 Show Bars Since Signal
Optionally display how many bars have passed since each signal appeared. The bar where the signal occurs counts as 1.
███████ Signal ███████
This is the core component of the signal system. You can customize:
🔸 Moving Average Type
Choose from SMA, EMA, WMA, Hull MA, VWMA, RMA, or TEMA
🔸 Length
Adjust the length to suit your strategy.
🔸 Source
Select which price data (e.g., Close, Open, HL2) is used to calculate the MA.
🔸 Confirm Candles
Defines the number of consecutive candles that must break the selected level to confirm a signal.
– If ATR filter is enabled, this level is the ATR bands.
– If ATR is disabled, the Moving Average line is used.
This helps filter out noise and avoid premature signals.
🔸 Break Type
Specifies how the candle must break the level:
– Close: The candle must close beyond the level.
– Wick: A wick touching or exceeding the level is enough.
Both options generate signals only after the candle has closed.
🔸 Filter
This section provides optional filters to improve signal accuracy.
ATR
When the ATR filter is enabled, signals are generated only if the price breaks above the upper ATR line or below the lower ATR line—calculated by adding or subtracting the ATR multiplied threshold from the moving average—and the breakout must occur for the number of consecutive confirmation candles specified by the user input . This helps reduce false signals during low volatility periods.
• Multiplier: Adjusts the width of ATR bands by multiplying the ATR value.
• Length: Sets the period for ATR calculation.
• Smoothing: Selects the smoothing method applied to the ATR (RMA, SMA, EMA, WMA).
Breakout
When enabled, breakout confirmation requires the price to cross above the upper breakout line or below the lower breakout line by a specified percentage from the last signal price.
• Threshold (%): Defines the minimum percentage price movement required to validate a breakout.
• Show Breakout Levels: Toggle to display or hide breakout threshold area on the chart.

ROC | QuantumResearch🔍 QuantumResearch ROC Screener
The QuantumResearch ROC Screener is an advanced multi-asset momentum analyzer designed to track relative strength across up to 11 user-defined assets using Rate of Change (ROC). This tool helps traders identify outperformers, underperformers, and rotation opportunities in fast-moving markets.
🧠 How It Works
This screener systematically calculates the Rate of Change (ROC) for each selected asset using two perspectives:
Absolute ROC – Measures the momentum of each asset individually over the chosen lookback period.
Relative ROC Matrix – Compares each asset against every other asset (e.g., BTC vs ETH, ETH vs SOL, etc.) using pairwise ROC ratios.
These values are organized into a dynamic heatmap-style table, highlighting which assets exhibit the strongest directional moves and relative strength. The script also includes:
Averages across all relative pairs to rank each asset.
Color-coded visuals to identify bullish (green), bearish (red), and neutral (white) ROC values.
📊 Main Features
🔢 Up to 11 Assets: Choose any combination of crypto, forex, indices, or commodities.
💡 Pairwise Comparison Matrix: Visualizes each asset’s ROC vs every other asset.
📈 Momentum Ranking: Assets are sorted based on their total average ROC score.
🎨 Color-Coded Table: Makes it easy to spot high or low momentum tokens at a glance.
⚙️ Custom ROC Period: Choose the length of the momentum window.
🧩 Flexible Layout: Position the table anywhere on your screen and adjust font size.
✅ How to Use It
Select your favorite 11 assets (e.g., BTC, ETH, SOL, etc.).
Adjust the ROC length to capture short-term or medium-term momentum.
Spot top trending assets.
Identify reversals or breakouts.
Build rotational or relative strength strategies.
⚠️ Important Notes
Momentum is a powerful tool, but context matters — combine ROC readings with your broader strategy (trend, liquidity, valuation).
This screener is not predictive — it reflects past performance over a defined lookback window.
📉 Disclaimer
Past performance is not indicative of future results. This tool is designed to provide data-driven insight, not financial advice. Always conduct your own research and apply proper risk management.

WECAN Magic Indicator ₹ InvestmentScript Name: WECAN Magic Indicator 1
Company: WECAN GROW ACADEMY
Contact: +91 85678 98484
Description:
The WECAN Magic Indicator 1 is a powerful trading tool developed by WECAN GROW ACADEMY. It combines multiple technical analysis components such as EMA trends, MACD signals, and custom logic to generate precise Buy and Sell signals. The script features a clean on-chart display and a chronological table view of past trades, helping traders quickly review performance and market timing. Ideal for intraday and positional trading strategies, this indicator aims to simplify decision-making for both beginners and professionals.
For support or training, contact us at +91 85678 98484.

Ayman Entry Signal – With HTF + Pin Bar
A professional and versatile trading indicator combining classic technical analysis with Smart Money Concepts to detect high-probability entry points.
Designed especially for scalping gold and forex pairs on lower timeframes. Fully customizable to suit any trading style.
✅ Key Features:
EMA Trend Confirmation
Break of Structure (BoS) Detection
Order Block Zone Recognition
Fair Value Gap (FVG) Confirmation
Liquidity Sweep Detection
Pin Bar Candlestick Confirmation
Higher Timeframe Confirmation (HTF EMA + HTF BoS)
🎯 Smart Risk Management:
Automatically calculates Stop Loss (SL) and Take Profit (TP) based on the selected timeframe.
Dynamically adjusts lot size based on account capital and risk percentage.
📈 How It Works:
The indicator triggers a Buy or Sell signal only when a selected set of conditions are met, including:
Trend direction (EMA crossover)
Break of structure
Presence within strong supply/demand zones
Confirmation from higher timeframe
Reversal Pin Bar pattern
🛎 Alerts:
Built-in alert system notifies you instantly when a valid Buy or Sell signal is triggered.
⚙️ Customizable Settings:
Risk Percentage
Capital Size
HTF timeframe
Enable/Disable individual filters (EMA, BoS, OB, FVG, Liquidity, Pin Bar, HTF)
📌 Best Timeframes:
1-min, 5-min, and 15-min – especially during high-volume sessions like London or New York.
🔸 Note:
This is not financial advice. Always backtest and use manual confirmations before live trading.