Simple ATR Volatility Context v1.0This indicator provides a simple visual view of market volatility using ATR expressed as a percentage of price. It is designed to help identify when a market transitions from low-activity (compression) to higher-activity (expansion).
What it does
Calculates ATR as a percentage of price
Highlights the chart when volatility exceeds a user-defined threshold
Helps distinguish between quiet markets and trade-worthy conditions
How to use it
Green background indicates elevated volatility
Neutral / muted background indicates low volatility
Use alongside your own trend, structure, or entry tools
What this is not
Not a buy or sell signal
Not predictive
No performance claims
This tool is intended for market context and awareness, not standalone trading decisions.
Price-action

VORB DJB Trades V1VORB by DJB Trades (Version 1) is a complete intraday framework built around the New York session Opening Range Breakout (ORB), combined with higher-timeframe VWAPs and precise Fair Value Gap mapping.
This tool is designed to give you context, levels and confluence at a glance – no more stacking 5 different indicators on your chart.
🔶 Core ORB Logic (NY Session)
• Uses the 09:30–09:45 NY time 15-minute ORB range.
• Draws an ORB box from high to low during the ORB window.
• Projects clean high/low ORB lines across the session (up to your chosen end time, default 18:00 NY).
• Displays the ORB size in points above the box
• 1 point = 4 ticks (futures-style logic).
This gives an instant sense of how “wide” or “tight” the opening drive was, and how much room you have for trend or mean-reversion plays.
📐 Daily VWAP (Intraday Bias)
• Custom anchor time (default 18:00, NY session close style).
• Plots Daily VWAP plus +/-1 standard deviation bands.
• Full styling controls: colors, line widths, band fill etc.
• You can limit visibility to specific timeframes via dropdown (e.g. only show on 1–5m, or just intraday).
VWAP +/-1 deviation bands gives you intraday bias and “fair value” zones to frame trades around the ORB.
🕒 Higher Timeframe VWAPs (Weekly, Monthly, Yearly)
All three higher-TF VWAPs are calculated the same way (volume-weighted, streaming) but anchored at different structural points:
• Weekly VWAP – resets at the start of each week
• Monthly VWAP – resets at the start of each month
• Yearly VWAP – resets at the start of each year
Each has:
• Main VWAP line
• ±/-1 standard deviation bands
• Independent color / width / band fill settings
• Timeframe visibility controls (“show from TF” & “show up to TF”) so you can do things like:
⁃ Weekly VWAP only from 5m and above
⁃ Monthly on 1h and higher
⁃ Yearly only on Daily/Weekly/Monthly
Use these as higher-timeframe bias references and key dynamic value areas above/below the ORB.
📊 1m FVGs (Outside ORB & VWAP Bands)
For precision entries:
• Detects 1-minute Fair Value Gaps (classic 3-candle pattern):
⁃ Bullish FVG: low > high
⁃ Bearish FVG: high < low
• Only plots FVGs that are:
⁃ Outside the ORB range, and
⁃ Outside the Daily VWAP +/-1 bands
• FVG boxes are auto-extended to the right (4× original width) for clear “liquidity pockets”.
• Separate colors for bullish and bearish FVGs.
This helps you focus only on “clean” imbalances away from the opening chop and mid-range value.
⚙️ Customisation & Use
• Works best on US indices, FX and futures during the NY session.
• Optimised for 1m–15m ORB trading, but higher-TF VWAPs shine on 5m, 15m, 1h and Daily.
• Every visual element (ORB box, lines, VWAPs, bands, FVGs, label text/bg) is fully customisable in the settings.
⚠️ Disclaimer
This script is for educational and informational purposes only.
It does not constitute financial advice or a signal service.
Always test on a demo account and use your own risk management before trading live.

ORACLE v13: The Gamified Market HUDORACLE v13 is not just an indicator; it is a complete Trading HUD (Heads-Up Display) that translates complex market data into an intuitive, video-game-style interface. It turns abstract concepts like "volatility" and "support/resistance" into actionable game mechanics, allowing you to react faster and trade smarter.
⚔️ Key Features:
🛡️ Boss & Shield Mechanics (Support/Resistance):
Automatic detection of key levels visualized as "Bosses" (Resistance) and "Shields" (Support).
HP System: Watch price "damage" these levels in real-time. When "Boss HP" hits zero, a breakout is imminent.
🔮 The Bestiary (Market Conditions):
Instantly identifies the "Enemy Type" you are fighting:
🟢 SLIME: Squeeze zone (low volatility, prepare for a move).
👺 GOBLIN: Chop/Noise (high risk, avoid trading).
🐉 DRAGON: Strong Trend (ride the momentum).
👹 BERSERKER: Extreme Volatility (proceed with caution).
📈 Live Structure Mapping:
Real-time ZigZag overlays with automatic HH/LL/LH/HL labels.
Breakout Flash: Candles flash WHITE instantly when major structure or Boss levels are broken.
🎮 Combat Stats:
Combo Counter: Tracks consecutive directional candles.
Aggro Meter: Visualizes volume intensity.
Loot Drop Rate: innovative metric calculating the probability of a profitable move based on current ATR.
Momentum Bar: RPG-style health bar for trend strength.
Why use ORACLE? Most indicators just draw lines. ORACLE gives you Context. It tells you exactly what kind of market environment you are in so you never bring a knife to a Dragon fight. Perfect for scalpers and day traders who need instant situational awareness.
Settings: Fully customizable Lookback periods, ZigZag sensitivity, and Visual Themes.

VLB Cycle Market ToolThe VLB Dynamic Levels Tool provides a visual framework for observing price structure on XAUUSD.
It displays automatically generated levels based on a rules-based approach, allowing traders to study how price interacts with important reference areas on the chart.
The tool updates dynamically as market structure evolves, reflecting changes in price movement without requiring manual redrawing.
Its purpose is to offer a clear, consistent layout of structural levels that users can incorporate into their own market analysis.
Features:
Automatically displayed structural reference levels
Dynamic recalculation as new highs and lows form
Neutral, non-predictive visual layout
A consistent framework for studying price behavior
This tool does not generate trading signals or provide predictive information.
It simply organizes price structure into visual reference points that may assist users in their independent chart analysis.
Traders remain fully responsible for their own interpretation, timing, and risk management.
The VLB Dynamic Levels Tool is intended for those who prefer a clean and adaptable way to observe XAUUSD structure throughout changing market conditions.

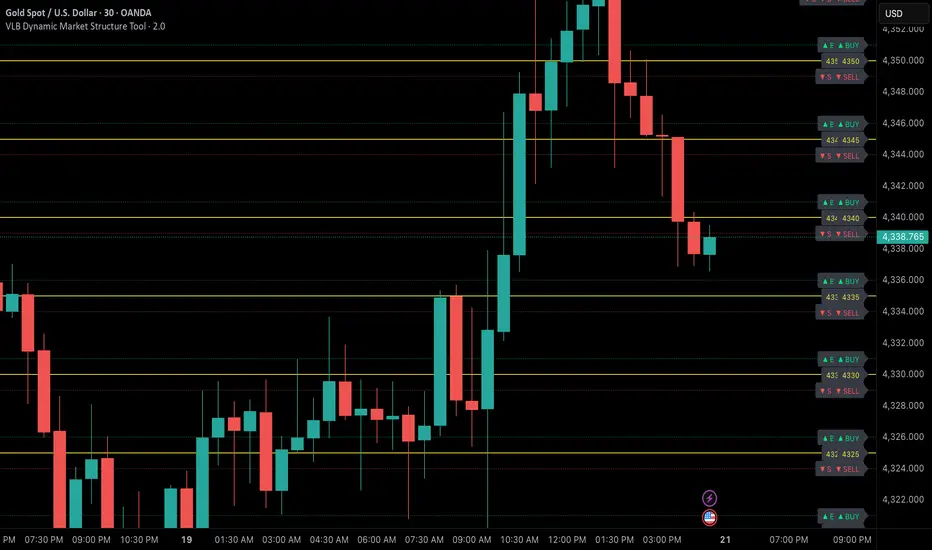
VLB Dynamic Market Structure ToolAdaptive Structural Continuation Framework for XAUUSD
The VLB Dynamic Market Structure Tool is a proprietary, rules-driven market structure framework designed specifically to analyze price continuation behavior in XAUUSD under live market conditions.
This tool does not plot static support and resistance.
Instead, it provides a continuously adapting structural model that reorganizes itself around current price, allowing traders to observe acceptance, rejection, and expansion behavior between key structural zones.
Core Conceptual Foundation
The framework is built on three integrated components that work together as a single methodology:
1. Dynamic Price-Anchored Structural Range
Unlike traditional indicators that rely on fixed historical levels, this tool anchors its entire structural range to live market price.
As price migrates:
Levels that are no longer relevant are automatically removed
New forward-relevant levels are introduced
The framework re-centers itself around active price action
This ensures that the trader is always viewing current, actionable structure, without manual redrawing or chart repositioning.
2. Evenly Spaced Structural Reference Levels
Within the dynamically anchored range, price is organized into consistent structural intervals that frequently act as transition points in XAUUSD price behavior.
These levels serve as objective reference boundaries, allowing traders to:
Compare reactions across identical structural distances
Observe recurring price behavior in a normalized framework
Maintain consistency across different sessions and market conditions
The levels are contextual, not predictive.
3. Post-Break Acceptance & Expansion Zones
The framework distinguishes between:
Initial structural breaks that fail or retrace
Confirmed acceptance beyond a defined offset from the level
Expansion phases as price transitions toward the next structural interval
By visualizing this sequence, the tool allows traders to study continuation behavior only after confirmation, rather than reacting to first-touch or initial breakouts.
Adaptive Behavior (Why This Is Not Static S&R)
A defining feature of the VLB Dynamic Levels Tool is its continuous recalculation and real-time adaptation:
The visible structure evolves with price
The framework moves up or down as market conditions change
Historical clutter is intentionally removed to preserve clarity
The trader’s focus remains on the active trading environment
This adaptive behavior is integral to the methodology and cannot be replicated through manual drawing or static indicators.
Intended Use
This tool is designed for discretionary traders who:
Study market structure, acceptance, and momentum
Prefer confirmation-based continuation frameworks
Value rule-based consistency over subjective interpretation
Combine structural context with their own execution, fundamentals, and risk management
The indicator does not generate automated buy or sell signals and does not execute trades.
Important Disclosures
No performance or outcome is guaranteed
No predictive claims are made
All trading decisions remain the responsibility of the user
Summary
The VLB Dynamic Levels Tool provides a self-adjusting, structurally consistent framework for observing how XAUUSD price transitions between key zones in real time.
Its proprietary value lies in the integration of dynamic price anchoring, structural normalization, and post-break acceptance visualization, offering a methodical way to study continuation behavior in changing market conditions.
QuantFlow Algo: Institutional Trap & ReversalRetail traders often lose money because they chase "breakouts" that are actually Liquidity Traps set by institutional algorithms. This script is designed to solve that problem.
Unlike standard indicators that clutter your chart with lagging moving averages and noisy clouds, the QuantFlow Algo: Institutional Trap & Reversal runs a high-performance Background Algorithm to detect "Smart Money" activity. It keeps your chart 100% clean and only prints a signal when a high-probability reversal structure is confirmed.
How it Works (The Logic):
The script utilizes a proprietary "Dual-Stage Verification" process to filter out false signals:
1. Liquidity Absorption: It detects specific candle geometries (Shadow-Excursion Ratios) where price aggressively breaks a level but fails to sustain momentum, trapping breakout traders.
2. Volumetric Pressure: It validates these traps using a relative volume anomaly detector to ensure institutions are active in the move.
3. Structural Delta: It analyzes the net order-flow bias of the session (Displacement) to ensure the reversal aligns with the immediate market structure.
Key Premium Features:
🛡️ Institutional Trap Detection Engine:
Automatically identifies high-probability "Smart Money" traps where retail traders get caught. Uses a proprietary Volumetric Pressure Algorithm to detect true liquidity grabs.
★ Sniper Confirmation Mode:
Filters out fake signals by waiting for a "Test Candle." The Gold Star (★) appears only when the market successfully retests the level on low volatility, giving you a precise, lower-risk entry.
❌ Auto-Failure Detection:
Stop guessing if a trade is dead. The script automatically marks invalidated setups with a discrete "X" , saving you from holding onto losing trades.
📊 Institutional Flow Verification:
A smart filter that validates signals using real Capital Injection & Order Flow . Includes a "Zero-Flow Mode" for indices like SPX/NDX, ensuring universal compatibility.
🖥️ Multi-Timeframe (MTF) Context Panel:
A built-in "Heads-Up Display" that monitors the 15m, 1H, 4H, and Daily trends simultaneously. It physically blocks counter-trend signals to keep you aligned with the higher timeframe flow.
🧠 Smart Adaptive Baseline (KAMA):
Uses Kaufman’s Adaptive Moving Average to react faster to market crashes than standard lagging indicators, protecting you from "catching a falling knife" during high volatility.
⚡ Two-Stage Signal System:
Stage 1 (Triangle ⚡): Alert Phase – The Trap is detected. Get ready.
Stage 2 (Star ★): Execution Phase – The Setup is confirmed. Enter the trade.
How to Use (Strategy):
This tool is designed as a "Setup Locator" with a built-in failure protocol. We recommend the 2-Phase Verification Method :
1. Wait for the Signal: Look for a Blue ⚡ (Buy Setup) or Orange ⚡ (Sell Setup).
Do not enter yet. This is the "Alert" phase.
2. Automatic Validation: The script scans for the next candle to close with Diminished Volumetric Pressure (Receding Order Flow). When this specific "test" condition occurs, a Gold Star (★) will appear.
3. Execution Protocols:
For a BUY Signal (Blue ⚡):
a. Standard Entry (The Star ★): If the Gold Star appears, wait for price to break the HIGH of that Star Candle. The trap is confirmed. Enter Long .
b. Failure Flip (The "X"): If a Grey "X" appears instead, the Buy Trap has failed. The institutions have let the support break. Go Short immediately (Reversal Trade).
For a SELL Signal (Orange ⚡):
a. Standard Entry (The Star ★): If the Gold Star appears, wait for price to break the LOW of that Star Candle. The trap is confirmed. Enter Short .
b. Failure Flip (The "X"): If a Grey "X" appears instead, the Sell Trap has failed. The institutions have let resistance break. Go Long immediately (Reversal Trade).
Why use the Failure Flip? A failed institutional trap often results in an explosive move in the opposite direction as trapped traders are forced to cover their positions.
4. Stop Loss: Place just above/below the Star Candle or the recent swing high/low.
Why is this Closed-Source?
This script operates on proprietary algorithms for Institutional Order Flow and Adaptive Smoothing . These internal calculations protect the unique logic used to validate setups and ensure a quantitative edge that standard open-source indicators cannot replicate.
Disclaimer: This tool is for educational analysis purposes only. Past performance does not guarantee future results.
💎 Premium Access & Updates:
For exclusive access, setup tutorials, and the complete "Sniper Strategy" guide, please check the link in my TradingView Profile Bio or the Signature below.

BBMA by RWBTradeLabBBMA by RWBTradeLab
A clean, non-repainting BBMA indicator built for traders who combine Bollinger Bands with Linear Weighted Moving Averages and EMA to track volatility expansion, price extremes, and confirmed breakout behavior using closed candles only.
What this indicator does
This script combines Bollinger Bands (20, 2) with Linear Weighted Moving Averages (LWMA) and a 50 EMA to help traders identify high-probability price extension zones and confirmed BBMA break conditions—without repainting.
All calculations and alerts are based strictly on closed candles (no running-bar signals).
Core components
Bollinger Bands
*Period: 20
*Deviations: 2
*Apply to: Close
*Visual shift supported (default 0)
*Clean white band structure for clarity
Linear Weighted Moving Averages (LWMA)
*LW MA 5 Low
*LW MA 10 Low
*LW MA 5 High
*LW MA 10 High
These weighted averages react faster to recent price action and help define dynamic BBMA zones.
Exponential Moving Average
*EMA 50
*Apply to: Close
*Method: Exponential
Used as a higher-timeframe trend and structure reference.
BBMA alert logic (closed candle only)
Lower BBMA Break
Triggered when:
*LW MA 5 Low crosses below the Lower Bollinger Band
*The candle closes below the Lower Bollinger Band
*LW MA 5 Low remains below the Lower Bollinger Band after close
Upper BBMA Break
Triggered when:
*LW MA 5 High crosses above the Upper Bollinger Band
*The candle closes above the Upper Bollinger Band
*LW MA 5 High remains above the Upper Bollinger Band after close
⚠️ No alerts are generated on running candles—only on confirmed bar close.
Visuals on chart
*Bollinger Bands plotted in clean white
*LW MAs color-coded for easy distinction
*EMA 50 plotted in green
*Optional show/hide toggles for BB, LW MAs, and EMA
Alerts
Built-in alerts trigger only on candle close:
*BBMA Lower Break (confirmed)
*BBMA Upper Break (confirmed)
Designed for reliable discretionary trading and automation without repainting issues.
Key settings
*BB Period & Deviations
*LW MA periods (5 & 10, High / Low)
*EMA period
*Visual shift for Bollinger Bands
*Individual visibility toggles
Non-repainting confirmation
All calculations, plots, and alerts are based on confirmed candles only.
No running-bar logic → no repainting.
Disclaimer
This indicator is a technical analysis tool, not financial advice.
Trading involves risk—always use proper risk management and confirm signals with your own analysis.
Creator: RWBTradeLab
If you find this indicator useful, please leave a like ⭐ and share your feedback.

Infinity Algo Dashboard█ OVERVIEW
Infinity Algo Dashboard combines 4 powerful modules into one clean overlay: Multi-Timeframe Analysis, Order Blocks, Market Structure (BOS/CHoCH), and Adaptive Cloud Bands.
Monitor 8 timeframes simultaneously, spot supply/demand zones with volume metrics, track structure shifts in real-time, and assess volatility — all without cluttering your chart.
Includes 16+ built-in alert conditions and 17 color themes.
█ KEY FEATURES
✅ Multi-Timeframe Dashboard (8 TFs) — trend + volatility at a glance
✅ Algorithmic Order Blocks / Supply & Demand Zones with volume analysis
✅ Market Structure Labels (BOS / CHoCH) for regime detection
✅ Adaptive Cloud Bands for dynamic support/resistance
✅ 16+ Built-in Alert Conditions for automation
✅ 17 Color Themes including colorblind-friendly options
✅ Designed for crypto, forex, stocks, indices, and commodities
█ WHAT MAKES THIS INDICATOR DIFFERENT
📊 Multi-Timeframe Analysis
Most MTF dashboards just show moving average direction. This one shows trend state + volatility regime + volatility trend across 8 timeframes simultaneously. Spot alignment instantly.
🧱 Smart Order Blocks
Not just rectangles on a chart. These zones include volume metrics (Buy/Sell split), midlines, break detection, and automatic pruning of invalid zones.
📐 Market Structure That Makes Sense
BOS (Break of Structure) and CHoCH (Change of Character) labels derived from actual swing highs/lows — not arbitrary price levels.
☁️ Adaptive Cloud Bands
Volatility-aware envelope that auto-adjusts its period based on your timeframe. Expands in trending markets, contracts in consolidation.
█ MODULES EXPLAINED
1) Multi-Timeframe Dashboard
Monitors up to 8 user-selected timeframes simultaneously
Trend State: Bullish / Bearish / Overbought / Oversold
Volatility State: High / Low / Normal
Volatility Trend: Rising / Falling / Stable
Two visual styles: Pro Neutral (clean) or Semantic Heatmap (color-coded)
AVG row shows overall market bias across all timeframes
2) Order Blocks / Buy-Sell Zones
Algorithmic detection of swing-based supply/demand zones
Volume Metrics: Total volume + Buy/Sell % split inside each zone
Midline: Key level within the zone for precision entries
Break Labels: "Break Up" / "Break Down" when zones are invalidated
Exit Markers: Signals when price leaves a zone (Close or Wick trigger)
Smart Filtering: Show nearest only, hide overlaps, limit history
3) Market Structure (BOS/CHoCH)
BOS (Break of Structure): Trend continuation signal — confirms momentum
CHoCH (Change of Character): Early reversal warning — first sign of regime shift
Derived from pivot highs/lows using configurable sensitivity
Optional candle coloring based on structure bias
4) Cloud Bands (Adaptive Envelope)
Smoothed, volatility-aware channel (Keltner-style with enhancements)
Auto Mode: Period adjusts automatically based on your chart timeframe
Manual Mode: Set your own period for full control
Dynamic midline for trend bias assessment
Edge dots highlight when price touches band boundaries
Great for identifying breakouts vs. mean-reversion setups
█ USE CASES
📈 Trend Confirmation
Check the MTF Dashboard for alignment. When 6+ timeframes agree (Strong Bullish/Bearish), you have confluence. Use Order Blocks as entry zones in the direction of the trend.
📉 Reversal Hunting
Watch for CHoCH labels — they signal potential regime change before the crowd sees it. Combine with Order Blocks for well-defined reversal entries.
🎯 Precision Entries
Use Order Block midlines as entry targets. When price retraces to the midline of an unbroken zone aligned with higher-TF bias, you have a more selective setup.
⚡ Volatility Assessment
Cloud Bands show you the current volatility regime. Price outside bands = trending (ride it). Price inside bands = consolidation (fade the edges or wait).
🤖 Alert Automation
Set alerts for zone breaks, BOS/CHoCH events, MTF alignment shifts, or cloud breakouts. React to opportunities even when away from the screen.
█ HOW TO USE
Apply to your chart (any timeframe, any market)
Configure your 8 dashboard timeframes (e.g., 1m/5m/15m/1h/4h/1D/1W/1M)
Watch for MTF alignment — strong alignment = cleaner directional bias
Use Order Blocks as "areas of interest" — prefer zones aligned with HTF bias
Monitor BOS/CHoCH for structure shifts — CHoCH = warning, BOS = confirmation
Use Cloud Bands to assess volatility — outside = trending, inside = ranging
Set alerts for the events that matter to your strategy
█ ALERTS
16+ built-in alert conditions:
Order Blocks: Zone breaks, zone entries, zone exits
Market Structure: Bullish/Bearish BOS, Bullish/Bearish CHoCH
MTF Alignment: Strong bullish/bearish (6+), Full alignment (8/8)
MTF Bias Flip: When average bias crosses bullish/bearish threshold
Cloud Events: Breakout up/down, Midband cross up/down
█ WORKS ON
Crypto
Forex
Stocks
Indices
Commodities
█ REALISTIC EXPECTATIONS
Order Blocks are algorithmic approximations — not true order flow data
BOS/CHoCH labels update on confirmed swings — some lag is expected
MTF alignment doesn't guarantee direction — it shows current state
Always combine dashboard insights with your own analysis and risk management
█ LIMITATIONS
Order Blocks are derived from swing behavior + volume — not actual institutional order flow
Zones/labels can update on the realtime candle until the swing is confirmed
Performance may slow with max history on low timeframes — reduce settings if needed
MTF data updates on higher-TF bar closes — slight delay is normal
█ DISCLAIMER
This indicator is provided for educational and informational purposes only and does not constitute financial advice. Trading involves substantial risk of loss, and you are solely responsible for your own trading decisions.

Market State & Candlestick Patterns Made in ChinaIndicator Overview
The Market State & Candlestick Patterns Master (MSCP-Master) is a comprehensive, all-in-one technical analysis indicator that combines real-time market state identification with multiple candlestick pattern recognition. This powerful tool not only identifies classic price action patterns but also adapts their significance based on the current market volatility environment, providing context-aware trading signals for smarter decision-making.
Core Innovation: Adaptive Pattern Recognition
Traditional candlestick pattern indicators work in isolation, often giving false signals in the wrong market conditions. MSCP-Master revolutionizes this approach by:
First assessing market state (Low Volatility/Ranging/High Volatility) through a multi-dimensional scoring system
Then applying different confirmation criteria for each pattern based on the detected market state
Finally providing context-aware signals that are more reliable because they consider the broader market environment
Three-Layer Analysis System
Layer 1: Market State Identification (The Foundation)
Uses four key metrics to calculate a comprehensive market state score:
ATR Relative Volatility: Measures current volatility against historical norms
Bollinger Band Width: Identifies contraction/expansion periods
Amplitude Analysis: Evaluates recent price range activity
Momentum Strength: Assesses directional movement power
Based on the composite score, the market is classified into:
🔵 Low Volatility: Tight ranges, potential for breakout
🟡 Ranging: Normal oscillation within established bounds
🟢 High Volatility: Wide ranges, strong momentum moves
Layer 2: Pattern Recognition With Context Adaptation
Each pattern uses different confirmation logic based on market state:
High Volatility State: Uses SMA-based trend confirmation (Long/Short SMA comparison)
Low Volatility/Ranging States: Uses ATR-adjusted threshold confirmation (dynamic based on current vs. baseline volatility)
This adaptive approach means patterns are only considered valid when they make sense for the current market environment.
Layer 3: Comprehensive Pattern Library
The indicator identifies 10+ critical candlestick patterns:
Engulfing Patterns (Bullish/Bearish) with Harami confirmation requirement
Outside Bars (Bullish/Bearish) with customizable engulfing criteria
False Breakouts (Bullish/Bearish) with sophisticated tracking of "trap" moves
Hammer/Inverted Hammer with ATR-adjusted significance thresholds
Doji Variations (Standard, Dragonfly, Gravestone) with precise mathematical definitions
Three Soldiers Method (Enhanced) with dual absolute/relative strength measurements
Enhanced Three Soldiers Method - Beyond Traditional Interpretation
Unlike traditional "Three White Soldiers/Black Crows" patterns that rely on simple visual recognition, our enhanced version introduces:
Quantifiable Strength Metrics: Each candle must meet customizable thresholds for both absolute price movement (%) and relative efficiency (close-to-open vs. total range)
Two Signal Types: Preparation signals (amber) for early warnings and True signals (green/red) for confirmed breakouts
Breakout Confirmation: "True signals" only trigger when price breaks above/below recent signal cluster extremes
Full Customization: All parameters adjustable to match your trading style and market conditions
Key Features
🎯 Context-Aware Signals: Patterns are validated differently in high vs. low volatility markets
📊 Real-Time Market State: Clear color-coded background shows current market conditions
🔍 Multiple Confirmation Methods: Uses both SMA trend-following and ATR-adjusted threshold approaches
⚙️ Fully Customizable: Every parameter adjustable across all pattern types and market state calculations
📈 Comprehensive Visualization: Color-coded labels, reference lines, and information tables
Strategic Application
Preparation Signals: Use amber "single candle" or "three candle" signals to prepare for potential moves
True Signals: Green/red "True" signals indicate confirmed momentum - ideal for main entries
Market State Alignment: Trade with the market's character - aggressive in high volatility, cautious in low volatility
Pattern Convergence: Look for multiple patterns confirming the same direction for higher probability setups
Parameter Groups (Organized for Easy Customization)
Market State Identification: ATR, Bollinger Band, Amplitude, Momentum parameters
Pattern-Specific Settings: Engulfing, Outside Bars, False Breakouts, Hammer/Doji patterns
Three Soldiers Method: Absolute/Relative strength thresholds, lookback periods
Confirmation Logic: SMA lengths, ATR adjustment factors, sensitivity settings

UIA TrendCompass V1.0UIA TrendCompass v1.0 is a market structure interpretation tool designed to visualize trend states in real time.
The script identifies four structural states based on price behavior and trend continuity:
• T — Trend Start
• E — Trend Extension
• H — Structural High / Low
• X — Trend Exit / Reversal
This indicator is intended for market structure analysis and educational purposes only.
It does NOT provide trading signals, buy/sell recommendations, or investment advice.
All labels are generated based on historical price data and do not predict future market movements.
Users should combine this tool with their own analysis and risk management framework.
This script is provided "as is" with no guarantee of accuracy or performance.

Institutional Trap & Reversal [Premium]Retail traders often lose money because they chase "breakouts" that are actually Liquidity Traps set by institutional algorithms. This script is designed to solve that problem.
Unlike standard indicators that clutter your chart with lagging moving averages and noisy clouds, the Institutional Trap & Reversal runs a high-performance Background Algorithm to detect "Smart Money" activity. It keeps your chart 100% clean and only prints a signal when a high-probability reversal structure is confirmed.
How it Works (The Logic): The script utilizes a proprietary "Dual-Stage Verification" process to filter out false signals:
1. Liquidity Absorption: It detects specific candle geometries (Shadow-Excursion Ratios) where price aggressively breaks a level but fails to sustain momentum, trapping breakout traders.
2. Volumetric Pressure: It validates these traps using a relative volume anomaly detector to ensure institutions are active in the move.
3. Structural Delta: It analyses the net order-flow bias of the session (Displacement) to ensure the reversal aligns with the immediate market structure.
Key Premium Features:
a. Smart Resolution (Auto-Timeframe): The script automatically detects your chart timeframe and syncs with the correct Higher-Timeframe Trend (e.g., 5m Chart $\rightarrow$ 1H Trend). No manual adjustment needed.
b. Adaptive Baseline (KAMA): Uses a "Kaufman Adaptive" neural-smoothing algorithm to dynamically adjust trend filters based on market volatility, reducing noise during choppy conditions.
c. Institutional Visuals: Uses specific colour theory to reduce emotional trading errors:
Blue ⚡ (Demand): Institutional Accumulation Zone.
Orange ⚡ (Supply): Institutional Distribution Zone.
How to Use (Strategy) : This tool is designed as a "Setup Locator" with a built-in failure protocol. We recommend the Volume-Test Entry Method :
1. Wait for the Signal : Look for a Blue ⚡ (Buy Setup) or Orange ⚡ (Sell Setup).
2. Volume Validation (Crucial) : Do not enter immediately. Wait for the next candle to close with Lower Volume . This confirms that immediate pressure has paused.
3. Execution Protocols :
For a BUY Signal (Blue ⚡) :
a. Standard Entry : If price breaks the HIGH of the lower-volume candle, the trap is confirmed. Enter Long .
b. Failure Flip (Reversal) : If price instead breaks the LOW of the lower-volume candle, the Buy Trap has failed. Go Short immediately .
For a SELL Signal (Orange ⚡) :
a. Standard Entry : If price breaks the LOW of the lower-volume candle, the trap is confirmed. Enter Short .
b. Failure Flip (Reversal) : If price instead breaks the HIGH of the lower-volume candle, the Sell Trap has failed. Go Long immediately .
Why use the Failure Flip? A failed institutional trap often results in an explosive move in the opposite direction as trapped traders are forced to cover their positions.
4. Stop Loss : Place above/below the swing high/low of the setup structure.
Why is this Closed-Source? This script contains proprietary calculations for Volume Weighting and Adaptive Smoothing that protect the unique combination of filters used to generate these signals. It provides a professional-grade edge that standard open-source scripts cannot replicate.
Disclaimer: This tool is for educational analysis purposes only. Past performance does not guarantee future results.
Access & Updates: For access details, tutorials, and more information, please check the link in my TradingView Profile Bio or Signature below.

Market Efficiency Ratio [Interakktive]The Market Efficiency Ratio decomposes price movement into two components: net progress vs wasted movement. This tool exposes the underlying math that most traders never see, helping you understand when price is moving efficiently versus chopping sideways.
Unlike simple trend indicators, this shows you WHY price movement matters — not just whether it's up or down, but how much of that movement was useful directional progress versus noisy oscillation.
█ WHAT IT DOES
• Calculates Efficiency Ratio (0–1 or 0–100) measuring directional progress
• Exposes Net Displacement (how far price actually moved)
• Exposes Path Length (total distance price traveled)
• Calculates Chop Cost (wasted movement)
• Visual zones for high/mid/low efficiency states
█ WHAT IT DOES NOT DO
• NO signals, NO entries/exits, NO buy/sell
• NO performance claims
• NO predictions — purely diagnostic
• This is a tool for understanding price behavior
█ HOW IT WORKS
The efficiency ratio answers one question: "Of all the movement price made, how much was useful progress?"
🔹 THE MATH
Over a lookback period of N bars:
Net Displacement = |Close - Close |
Path Length = Σ |Close - Close | for all bars
Efficiency Ratio = Net Displacement / Path Length
🔹 INTERPRETATION
• Efficiency = 1.0 (100%): Price moved in a straight line — every tick was progress
• Efficiency = 0.5 (50%): Half the movement was wasted in back-and-forth chop
• Efficiency = 0.0 (0%): Price ended exactly where it started — all movement was noise
🔹 CHOP COST
This is the "wasted movement" — how much price traveled without making progress:
Chop Cost = Path Length - Net Displacement
Chop % = Chop Cost / Path Length
High chop cost means lots of effort for little result — a warning sign for trend traders.
█ VISUAL GUIDE
Three efficiency zones:
• GREEN (≥70): High efficiency — strong directional movement
• YELLOW (30-70): Mixed efficiency — some progress, some chop
• RED (<30): Low efficiency — mostly noise, little progress
█ INPUTS
Lookback Length (default: 14)
Number of bars to calculate efficiency over. Higher values produce smoother readings but respond slower to changes.
Smoothing Length (default: 5)
EMA smoothing applied to the output. Reduces noise in the efficiency reading.
Apply Smoothing (default: true)
Toggle EMA smoothing on/off.
Scale Mode (default: 0–100)
Display as percentage (0-100) or decimal ratio (0-1).
Show Reference Bands (default: true)
Display the high/low efficiency threshold lines.
Low/High Efficiency Level (default: 30/70)
Thresholds for classifying efficiency zones.
Overlay Effect (default: None)
• None: No overlay
• Background Tint: Subtle chart background color in high/low zones
• Bar Highlight: Color bars during low efficiency periods
Show Data Window Values (default: true)
Export all raw values (Net Displacement, Path Length, Efficiency, Chop Cost, Chop %) to the data window for analysis.
█ USE CASES
This indicator helps traders understand:
• Why some trends are "clean" and others are "messy"
• When price is consolidating vs trending (without using volume)
• The relationship between movement and progress
• Why high-chop environments are difficult to trade
This is the foundational concept behind more advanced regime detection systems.
█ SUITABLE MARKETS
Works on: Stocks, Futures, Forex, Crypto
Timeframes: All timeframes
Note: This is a price-only indicator — no volume required
█ DISCLAIMER
This indicator is for informational and educational purposes only. It does not constitute financial advice. It does not generate trading signals. Past performance does not guarantee future results. Always conduct your own analysis.

Context Bundle | VWAP / EMA / Session HighLow (v6)
📌 0DTE Context Bundle (v6)
**VWAP • EMA Cloud • Session High/Low (NY / London / Asia)
The **0DTE Context Bundle** is a *decision-making overlay*, not a signal spam indicator.
It’s designed to help traders clearly see **value, trend, and liquidity levels** across **New York, London, and Asia sessions** — all in one clean, customizable tool.
Built for **NQ, ES, Gold, and FX pairs**, with a focus on **5–15-minute execution charts**.
---
## 🔹 What This Indicator Shows
### ✅ VWAP + ATR Bands
* Session VWAP (fair value)
* ATR-based extension bands (1x / 2x)
* Helps identify **overextension, mean reversion zones, and trend pullbacks**
### ✅ EMA 9 / 21 Cloud
* Visual trend and momentum filter
* Custom colors + opacity
* Identifies **trend continuation vs chop**
### ✅ Session High / Low Levels
* **New York RTH**
* **London**
* **Asia (midnight-safe)**
* Optional previous session highs/lows
* Adjustable line styles, widths, colors, and extensions
### ✅ Anchored VWAP (Optional)
* Reset by:
* Daily
* NY session start
* London session start
* Asia session start
* Useful for tracking **session-specific value shifts**
---
## 🔹 How Traders Use It
This indicator is meant to answer:
* *Are we trading at value or extension?*
* *Is the market trending or rotating?*
* *Where is liquidity likely sitting right now?*
Common use cases:
* Trend pullbacks into VWAP or EMA cloud
* Reversal setups at session highs/lows
* Session breakout + retest confirmation
* Overnight context for London and Asia sessions
---
## 🔹 Customization & Flexibility
Every component can be toggled and styled:
* Colors, widths, line styles
* Cloud up/down colors + opacity
* Session visibility and extensions
* VWAP band multipliers and ATR length
Members can adapt it to **their own style**, market, and timeframe.
---
## ⚠️ Disclaimer
This indicator is provided for **educational and informational purposes only**.
It does **not** provide financial advice or trade signals.
Always manage risk and confirm entries with your own strategy.

True Three Soldiers Method (TTSM) - Breakout ConfirmationIndicator Overview
True Three Soldiers Method (TTSM) - Made in China is a quantifiable evolution beyond traditional candlestick pattern recognition. It replaces subjective visual analysis with an objective, data-driven momentum system featuring smart breakout confirmation.
Core Innovation: Beyond Traditional Pattern Recognition
Traditional three-soldier patterns merely check for three consecutive bullish/bearish candles. TTSM goes much deeper:
Dual Signal System: It identifies both single-candle and three-candle momentum signals, providing earlier warnings of potential trend changes.
Quantifiable Strength Metrics: Each signal must meet customizable thresholds for both absolute price movement (percentage change) and relative efficiency (close-to-open distance relative to total range).
Breakout Confirmation Logic: The real innovation lies in the "True Signal" mechanism. Preliminary signals are tracked, and only when price breaks above the highest high of recent bullish signals (or below the lowest low of recent bearish signals) does it trigger a confirmed entry signal. This eliminates false breakouts and ensures you're trading with confirmed momentum.
Absolute Strength: Quantifies momentum via percentage price change.
Relative Strength: Measures candlestick efficiency (close-to-open vs. total range).
True Signal Validation: A "True" entry signal triggers only after price confirms momentum by breaking above/below a cluster of recent preliminary signals, filtering out false moves.
Dual-Layer Signal System
Key Features
🔴 Amber Signals (Preparation): Single-candle or three-candle patterns that meet strength criteria. These indicate potential momentum building and can be used for preparation or light positioning.
🟢 Green Signals (True Breakout): Triggered only when price breaks above/below the recent signal cluster extremes. These represent confirmed momentum and are ideal for main entries.
🎚 Fully Customizable: Every parameter—absolute/relative strength thresholds, lookback periods, and average calculations—can be adjusted to match your trading style and market conditions.
📊 Clear Visual Feedback: Color-coded labels and reference lines make signal identification instant and intuitive.
Parameter Customization Guide
All parameters are organized in intuitive groups:
Strength Thresholds: Adjust absolute (%) and relative (%) strength requirements for both long and short signals.
First Signal Thresholds: Special thresholds for when a signal is the first in the lookback period.
Lookback & Averages: Control how many bars are considered for signal tracking and moving averages.
Strategic Application
Preparation Signals: Use amber signals to prepare for potential moves, set alerts, or enter with smaller positions.
True Signals: Green/red "True" signals indicate confirmed momentum—ideal for main entries with proper risk management.
Combination Strategy: Pair TTSM with trend indicators (like Supertrend) for higher probability trades—only take True Signals in the direction of the main trend.

Trend Engine ProTrend Engine Pro — Index Trend & Market Structure Framework
Trend Engine Pro is an advanced, non-repainting market structure indicator designed for index traders who want clarity on trend direction, balance zones, and price behavior—not buy/sell noise.
Built specifically for NIFTY & BANKNIFTY, this tool helps traders stay aligned with the dominant market context using previous-day structure, dynamic trend logic, and equilibrium-based midlines.
What Trend Engine Pro Does
Trend Identification
Determines bullish or bearish bias using previous-day High / Low structure
Uses 78.6% range logic to confirm decisive trend shifts
Visual trend background for instant market context
Key Price Levels
Dynamic structure levels derived from previous sessions
Equilibrium reference level for balance vs imbalance zones
Helps identify acceptance, rejection, and compression areas
Previous Trend Zones
Automatically captures:
Previous uptrend high
Previous downtrend low
Useful for:
Support & resistance mapping
Mean reversion context
Risk planning reference
Master Trend Midline
Midpoint of the last completed trend range
Acts as a higher-timeframe directional filter
Helps avoid counter-trend bias
Running Trend Midline
Continuously updates during an active trend
Shows trend strength, balance, and momentum health
Ideal for pullback & continuation evaluation
Option Context (Index Only)
Optional option seller reference level derived from structure extremes
Rounded strike logic for planning context
For analytical reference only, not trade execution
Optional Option P/L Table
Manual option & hedge symbol selection
Displays:
Entry price
Live price
Running P/L
Max trade P/L with timestamp
Disabled by default
Alerts Included
Bullish trend shift alert
Bearish trend shift alert
(Alerts are informational and based on confirmed structure changes)
Who This Indicator Is For
NIFTY & BANKNIFTY traders
Intraday & positional traders
Option sellers seeking market context
Traders who prefer structure over signals
Users who value non-repainting logic
What Trend Engine Pro Does NOT Do
No buy/sell signals
No automated trading
No profit guarantees
No repainting
Disclaimer
This indicator is for educational and analytical purposes only.
It does not provide trading or investment advice.
I am not a SEBI registered investment advisor.
Trading involves risk. Use this tool at your own discretion.
Best Usage Tip
Trend Engine Pro works best when used to:
Align trades with dominant trend
Avoid trades near equilibrium zones
Combine with your own entry and risk management logic

QM Level Detector by RWBTradeLabQM Level Detector by RWBTradeLab
A clean, non-repainting QM level detector built for traders who track structure shifts and level-break sequences using confirmed candles only.
What this indicator does
This script detects and marks QM Levels based on a strict, rule-based sequence using closed candles only (no running-bar signals).
It identifies two types of QM:
Buy QM
A Buy QM is confirmed when the following sequence completes in order:
* V Level is detected.
* That V Level is broken down by a red candle close below the V Level price.
* After that breakdown, the most recent A Level (formed before the breakdown) is identified.
* When that A Level is later broken out by a green candle close above the A Level price, the original V Level becomes a Buy QM Level .
Sell QM
A Sell QM is confirmed when the opposite sequence completes in order:
* A Level is detected.
* That A Level is broken out by a green candle close above the A Level price.
* After that breakout, the most recent V Level (formed before the breakout) is identified.
* When that V Level is later broken down by a red candle close below the V Level price, the original A Level becomes a Sell QM Level .
Visuals on chart
* A horizontal ray (right-extended) is drawn at the confirmed QM price level.
* Label distance is adjustable via Text Offset (ticks).
Alerts
Built-in alerts trigger only on candle close when a QM is confirmed:
* Buy QM
* Sell QM
Each alert is designed for reliable automation without repainting.
Key settings
* Candle Length (closed candles): Scans the last N closed bars (running candle excluded).
* Buy QM / Sell QM toggles: Show or hide each type.
* Text toggle: Show or hide labels.
* QM Line Color and Text Offset (ticks) customization.
Non-repainting confirmation
All detection, marking, and alerts are based on confirmed candles only.
No running-bar conditions → no repainting .
Disclaimer
This indicator is a level-detection tool, not financial advice. Trading involves risk—always use proper risk management and confirm signals with your own analysis.
Creator: RWBTradeLab
If you find this useful, please leave a like ⭐ and share your feedback.

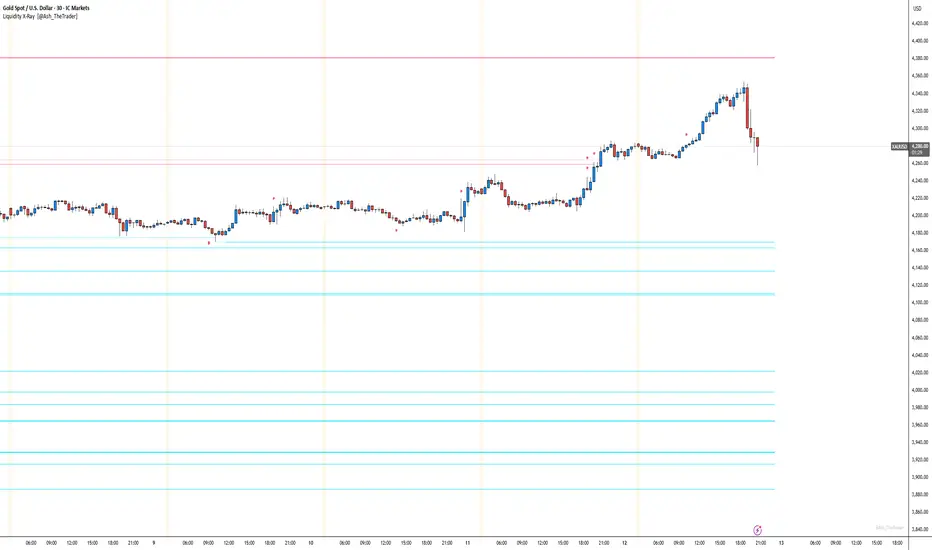
See Where The Banks Are Hunting: Liquidity X-Ray[@Ash_TheTrader]# 🛑 Stop Being "Liquidity." Start Seeing the Trap.
### Introducing: **Liquidity X-Ray **
How many times have you placed your stop-loss just below a perfect support level, only to watch a single candle wick down, trigger your stop, and immediately reverse toward your original target?
You weren't unlucky. You were targeted.
Welcome to the world of Smart Money Concepts (SMC). In the institutional game, your stop loss isn't protection—it's fuel. The market makers need liquidity to fill huge orders, and they find it clustered at obvious swing highs and lows.
I developed the **Liquidity X-Ray** to stop guessing where these traps are laid. This isn't just another support and resistance tool; it’s a dynamic, living heatmap of market psychology.
---
### 🧠 The Philosophy: The "Time-Decay" Algorithm
Standard indicators draw static lines that clutter your chart. The **Liquidity X-Ray** is different. It understands that *time* is a crucial factor in building liquidity pressure.
I have engineered a unique **Time-Decay Intensity** feature into this script. It visualizes the density of resting orders based on how long a level has remained untouched.
#### The Visual Language:
* **👻 The Ghosts (New Zones):** When a new swing high or low forms, a faint, transparent zone appears. It’s watching.
* **💡 The Neon Traps (Mature Zones):** As time passes and price fails to revisit that level, the zone solidifies. It becomes brighter, more opaque, and intensely neon. **This is your signal.** A bright neon zone means a massive pile of retail stop-losses has accumulated there. The Banks *need* to visit it.
* **💥 The Sweep Explosion:** When price finally pushes into a mature zone, the script detects the "Liquidity Grab." The box flashes bright white, cuts off immediately, and prints a **💥 LIQ GRAB** label on your chart. The trap has been sprung.
---
### ⚙️ Key Features & Cyberpunk Aesthetics
This tool is designed to look incredible on dark charts while providing institutional-grade data.
* **Dynamic Buyside/Sellside Heatmaps:** Clear visual distinction between where shorts are trapped (Neon Red/Pink) and where longs are trapped (Neon Cyan).
* **Smart Memory Management:** The script intelligently manages old zones to ensure your chart *never* lags, regardless of the timeframe.
* **Volume Filtering (Optional):** You can choose to only plot zones formed on high-volume pivot points, ensuring you are only watching significant market structures.
* **Instant Alerts:** Set alerts for the "Sweep Explosion" so you never miss a major reversal setup.
---
### 🎯 How to Trade the X-Ray
**Do NOT trade the breakout of these zones.** These are traps.
1. **Identify the Target:** Look for the oldest, brightest, most solid neon zones on your timeframe (H1 and H4 are powerful).
2. **Wait for the Hunt:** Be patient. Let price aggressively move toward the zone.
3. **The Explosion:** Wait for the candle to wick into the zone and trigger the **💥 LIQ GRAB** visual.
4. **The Reversal Entry:** Once the liquidity is taken, look for lower timeframe confirmation (like a Change of Character or engulfing candle) in the *opposite* direction. You are now trading *with* the smart money recovery, not *against* their stop hunt.
---
### Author's Note
Trading is about information asymmetry. The institutions have seen your stops for decades. It’s time you started seeing where they are hunting.
Trade smart, stay safe.
— **@Ash_TheTrader**
SnR Key Level Detector by RWBTradeLabSnR Key Level Detector by RWBTradeLab
A clean, non-repainting key level detector built for price action traders who want clear, fixed Support/Resistance reference levels with breakout upgrades and alerts.
What this indicator does
This script automatically detects and draws 6 types of SnR key levels using CLOSED candles only (no running-candle logic):
1. Base Key Levels (from 2-candle sequences)
* A Level: Green → Red (Level = 1st Green candle Close)
* V Level: Red → Green (Level = 1st Red candle Close)
* Bullish Gap Level: Green → Green (Level = 1st Green candle Close)
* Bearish Gap Level: Red → Red (Level = 1st Red candle Close)
2. Breakout Upgrade Levels
* RBS (Resistance → Support): When a Green candle CLOSE breaks above an A Level or Bearish Gap Level
* SBR (Support → Resistance): When a Red candle CLOSE breaks below a V Level or Bullish Gap Level
Visuals on chart
* Each detected level is drawn as a horizontal Ray extended to the right.
* Optional text labels are placed above/below the level based on the level type.
* Adjustable “Label Offset (ticks)” to keep labels cleaner on the chart.
Alerts (bar-close only)
Built-in alerts trigger only when a candle is CONFIRMED:
* A Level
* V Level
* Bullish Gap
* Bearish Gap
* SBR
* RBS
Each alert includes price and time in the message.
Key settings
* Candle Length (closed candles): Scans last N closed candles (running candle excluded).
* On/Off toggles: Enable/disable each level type and text labels individually.
* Label Offset (ticks): Controls the label distance from the level line.
Non-repainting confirmation
All levels and alerts are calculated on confirmed bars only.
No repainting, no running-bar signals.
Best use
Works on any market and timeframe. For higher reliability, combine with:
* Higher timeframe structure
* Supply & Demand zones
* Trend context and liquidity sweeps
Disclaimer:
This indicator is a level-detection tool, not financial advice. Trading involves risk; always use proper risk management and confirm levels with your own analysis.
Creator: RWBTradeLab
If you find this useful, please leave a like ⭐ and share your feedback.

FVG vertical Created by Alphaomega18
🎯 What is an FVG (Fair Value Gap)?
A Fair Value Gap is a price imbalance created by a mismatch between buyers and sellers, formed by 3 consecutive candles where:
Bullish FVG: The low of the current candle is above the high of the candle 2 periods ago
Bearish FVG: The high of the current candle is below the low of the candle 2 periods ago
⚙️ Indicator Settings
Display Group:
Show Bullish vertical FVG: Display bullish vertical FVGs (green) ✅
Show Bearish vertical FVG: Display bearish vertical FVGs (red) ✅
Box Extension (bars): Zone extension duration (1-50 bars, default: 10)
Show Labels: Display labels with gap size 🏷️
Remove When Filled: Automatically remove filled zones ✅
📊 Visual Elements
FVG Zones:
🟢 Green = Bullish vertical FVG (potential support zone)
🔴 Red = Bearish vertical FVG (potential resistance zone)
Labels:
Show gap size in points
Positioned at the beginning of each zone
Dashboard (top right corner):
Real-time count of active FVGs
🟢 = Number of bullish vertical FVGs
🔴 = Number of bearish vertical FVGs
Candle Coloring:
Light green background = Candle forming a bullish vertical FVG
Light red background = Candle forming a bearish vertical FVG
🎯 How to Use the Indicator
1. Installation:
Open TradingView
Click "Indicators" at the top of the chart
Search for "FVG Clean" or paste the code in the Pine Editor
2. Trading Strategies:
Support/Resistance:
Bullish vertical FVGs act as support zones
Bearish vertical FVGs act as resistance zones
Price tends to return to "fill" these gaps
Position Entries:
Long: Wait for a return to a bullish vertical FVG + confirmation
Short: Wait for a return to a bearish vertical FVG + confirmation
Position Management:
Place stops below/above FVGs
Use FVGs as price targets
A filled FVG loses its validity
🔔 Alerts
The indicator includes 2 configurable alert types:
Bullish vertical FVG: Triggers when a new bullish vertical FVG forms
Bearish vertical FVG: Triggers when a new bearish vertical FVG forms
To configure: Right-click on chart → "Add Alert" → Select desired alert
💡 Usage Tips
✅ Do:
Combine with other indicators (volume, momentum)
Wait for confirmation before entering
Use across multiple timeframes
Respect your risk management
❌ Don't:
Trade solely on FVGs without confirmation
Ignore the overall market trend
Overload your chart with too many zones
🔧 Parameter Optimization
Scalping (1-5min):
Box Extension: 5-10 bars
Remove When Filled: Enabled
Day Trading (15min-1H):
Box Extension: 10-20 bars
Remove When Filled: Enabled
Swing Trading (4H-Daily):
Box Extension: 20-50 bars
Remove When Filled: As preferred
📈 Performance
Maximum 100 FVGs of each type in memory
Automatic removal of oldest ones
Optimized to not slow down your chart
Compatible with all markets and timeframes

Engulfing Failed Zone Detector by RWBTradeLabEngulfing Failed Zone Detector by RWBTradeLab
A clean, non-repainting tool that focuses on one thing only: showing where strong engulfing patterns failed and the market broke through their base.
What this indicator does
This script automatically scans for confirmed engulfing patterns (Regular & E-Regular) and then tracks where those structures are invalidated.
It highlights two types of failure zones:
1. Buy Engulfing Failed
* A bullish engulfing pattern forms (Regular or E-Regular).
* Later, a bearish candle closes below the base low of that engulfing.
* The zone from the base candle to the failure candle is marked as Buy EG Failed .
2. Sell Engulfing Failed
* A bearish engulfing pattern forms (Regular or E-Regular).
* Later, a bullish candle closes above the base high of that engulfing.
* The zone from the base candle to the failure candle is marked as Sell EG Failed .
Only the first clear failure after each engulfing is drawn, keeping the chart clean and readable.
Visuals on chart
1. A rectangle (box) is drawn from the engulfing base candle to the failure candle.
2. Labels are placed automatically:
* Buy EG Failed (below the zone)
* Sell EG Failed (above the zone)
3. Label distance from the zone is controlled by Text Offset from Box (%).
4. Separate color controls for:
* Buy Engulfing Failed Box Color
* Sell Engulfing Failed Box Color
The label style matches Engulfing Detector by RWBTradeLab for a consistent visual experience.
Alerts
Built-in alerts trigger only on confirmed bar close when a new failure completes:
* Buy EG Failed
* Sell EG Failed
Each alert message includes:
* Brand prefix: RWBTradeLab
* Price
* Time
* Ticker
Perfect for linking with bots, webhooks or alert-based trade management.
Key settings
Candle Length (closed candles)
* Defines how many recent confirmed candles are scanned (the live bar is excluded).
Display toggles
* Buy Engulfing Failed
* Sell Engulfing Failed
* Text
Turn each element ON/OFF to control how much information you want on the chart.
Text Offset from Box (%)
* Controls how far the label is placed from the failed zone, with a safe minimum to keep labels clear and readable.
Non-repainting confirmation
* All detection and alerts are based on closed candles only.
* No signals from the running candle, no repaint tricks.
* Once a failure zone appears, it stays fixed.
Best use
Failed engulfing zones can reveal:
* Broken demand/supply zones
* Liquidity grabs where “smart money” flushed traders out
* Strong momentum shifts after a failed reversal attempt
* Levels where continuation or clean retests often occur
Works on any symbol and timeframe. For best results, combine with:
* Higher timeframe structure
* Key support/resistance or supply/demand mapping
* Your own confirmation tools and risk management
Disclaimer
This indicator is a technical pattern-detection tool, not financial advice. Trading involves risk. Always confirm signals with your own analysis and use proper risk management.
Creator: RWBTradeLab
If this script adds value to your trading, please leave a ⭐ and share your feedback.

Engulfing Overlap Zone Detector by RWBTradeLabEngulfing Overlap Zone Detector by RWBTradeLab
A focused, non-repainting tool that detects high-value “overlap zones” formed when one engulfing pattern fails and the opposite side immediately takes control.
What this indicator does
Instead of showing every engulfing pattern, this script filters out noise and highlights only Engulfing Overlap Zones:
1. It internally detects both:
* Regular Engulfing (R EG)
* E-Regular Engulfing (ER EG)
2. It then checks for engulfing failure:
* A Sell EG fails when a bullish candle closes above its base high.
* A Buy EG fails when a bearish candle closes below its base low.
3. After the failure, it looks for an opposite-side engulfing confirmation.
4. When the failed zone and the new opposite engulfing zone overlap, the script marks that region as a Buy EG Overlap or Sell EG Overlap zone.
Only these premium, overlap-based structures are shown on the chart.
Visuals on chart
1. Two stacked rectangles are drawn for each overlap setup:
* The failed engulfing zone
* The opposite confirming engulfing zone
2. Clean labels appear at the edge of the overlap:
* Buy EG Overlap (bullish zone)
* Sell EG Overlap (bearish zone)
3. Text distance from the zone is adjustable via Text Offset from Box (%).
4. Separate color controls for:
* Buy Engulfing Overlap Box
* Sell Engulfing Overlap Box
Alerts
Built-in alerts trigger only on confirmed bar close when a new overlap setup completes:
*Buy EG Overlap
*Sell EG Overlap
Each alert message includes price, time and ticker, prefixed with RWBTradeLab for easier filtering and automation.
Key settings
1. Candle Length (closed candles) – Defines how many recent confirmed candles are scanned (current bar is excluded).
2.Display toggles – Turn ON/OFF:
* Buy Engulfing Overlap
* Sell Engulfing Overlap
* Text labels
3. Text Offset from Box (%) – Controls how far the label is placed from the overlap zone, with a safe minimum to keep labels readable.
Non-repainting logic
* All calculations use closed candles only .
* No running-bar signals, no repaint tricks.
* The zones and alerts reflect stable, confirmed structures.
Best use
This indicator is designed to help you spot:
* Liquidity grabs and fake outs followed by real reversals
* Strong continuation zones after a failed attempt by the opposite side
* High-quality reaction areas for entries, pullbacks and retests
Works on any symbol or timeframe. For best results, combine with:
* Higher-timeframe market structure
* Key support/resistance or supply/demand zones
* Your own trade management and confirmation rules
Disclaimer
This script is a technical pattern-detection tool, not financial advice. Trading involves risk. Always use proper risk management and confirm signals with your own analysis.
Creator: RWBTradeLab
If this indicator helps your trading, please leave a ⭐ and share your feedback.

Alson Chew PAM EXE and Mother BarIndicators for strategies taught by Alson Chew's Price Action Manipulation (PAM) course
Two functions.
First it identifies EXE bars (Pin, Mark, Icecream bars).
Second it identifies Mother bars and draws an extension line for 6 bars.
Applicable to all time frames and can customise how many signals to show.
To be used in conjunction with trading strategies like
- 20 SMA, 50 SMA, 200 SMA FS formation
- Force Bottom, Force Top FS formation
- UR1 and DR1 using EXE Bar

Double Whammy Stop‑Run IndicatorThis indicator simulates the institutional "Double Whammy" order flow setup—for order flow traders—using standard Price Action and Volume analysis.
Since TradingView does not provide native access to Level 3 data (Stop Orders and Iceberg Orders), this script uses a proprietary algorithm to create a "proxy" for these events using relative volume anomalies, candle body strength, and market structure breaks.
The Concept
The "Double Whammy" is a reversal pattern that relies on the interaction between trapped retail traders and institutional absorption. It occurs in two specific phases:
The Stop Run (The Trap): Price aggressively breaks a significant recent High or Low on high volume. This represents retail stop-losses being triggered or breakout traders getting trapped.
The Absorption (The Whammy): Instead of continuing in the direction of the breakout, price is immediately absorbed by "Iceberg" orders (limit orders) and reverses with high intensity.
How It Works (The Logic)
This script identifies these two phases using the following logic:
1. Identifying the Stop-Run Proxy
The script monitors for a specific set of conditions to identify a potential trap:
Market Structure: The price must make a new High or Low based on the user-defined Lookback period (default 50 bars).
Volume Spike: The bar must have a volume significantly higher than the average (defined by the Volume Multiplier), suggesting a capitulation or stop-cascade.
Candle Strength: The bar must be a strong trend bar (large body relative to wicks) to mimic the look of a breakout.
2. Identifying the Absorption
Once a Stop-Run is detected, the script opens a "Window of Opportunity" (shaded background). For a valid signal to generate, a reversal must occur within Max Bars (default 3):
Reversal: A candle of the opposite color must appear.
Engulfing Logic: The reversal candle must close back inside the range (below the High of a bullish trap, or above the Low of a bearish trap).
Momentum: The reversal candle must also show significant volume and body strength.
Visual Guide
Background Shading (Green/Red): Indicates a Stop-Run has just occurred. This is a warning zone. Do not trade yet.
"DW" Label (Double Whammy): An immediate reversal occurred on the very next bar after the stop run.
"DDW" Label (Delayed Double Whammy): The reversal occurred 2 or 3 bars later, but still within the valid window.
Settings
Lookback Bars: The range used to determine significant Support/Resistance levels (Default: 50).
Max Bars to Absorption: How many bars the market has to reverse before the setup is considered invalid (Default: 3).
Volume Multiplier: How much larger current volume must be compared to the SMA to qualify as a "Stop Run" (Default: 1.5x).
Body/Range Ratio: Filters out Doji candles or weak moves. Higher numbers require stronger candles.
Disclaimer
This tool is intended for educational purposes and to assist in identifying high-volatility reversal zones. It uses price and volume proxies to estimate order flow events and does not track actual Level 3 limit orders. Always combine this indicator with your own risk management and market analysis.
Use Arrow Up and Arrow Down to select a turn, Enter to jump to it, and Escape to return to the chat.
