Stock Scanner - 38 AssetsPullback Scanner and Trading Strategy:
The Scanner's Purpose:
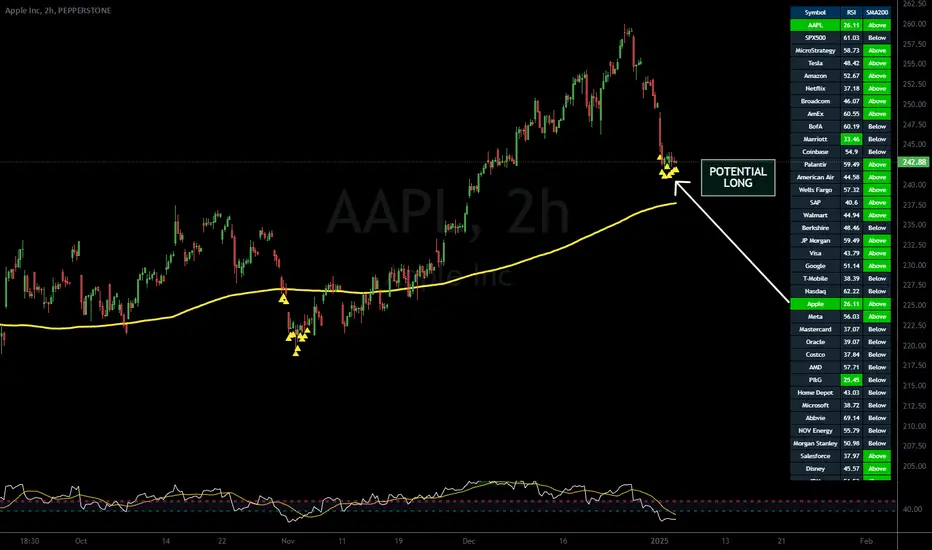
This tool helps identify stocks and futures from a set-list that are in a strong uptrend (above 200 SMA) but experiencing a temporary pullback (RSI below 38), creating potential buying opportunities.
Load 38 Favourite Stocks. They need to be bullish ie: Trading usually above 200 SMA. A drop down switch lets you choose which group. You can find suitable stocks using the filter at FINVIZ:
use on 4hr Timeframes and Above
You must use this on at least the 4hr timeframe, otherwise the 200SMA is not truly placed correctly and a valid trade depends upon the price action being ABOVE the 200SMA.
finviz.com
Key Components:
200 Simple Moving Average (SMA)
Acts as a trend filter
Price above 200 SMA indicates a long-term uptrend
Helps avoid trading against the main trend
Relative Strength Index (RSI)
Set to 38 as the oversold threshold
Identifies temporary weakness in strong trends
Acts as the pullback confirmation. You could add an RSI indicator to the chart for monitoring.
Visual Signals:
Green row: Indicates both conditions are met (price > 200 SMA and RSI < 38)
Yellow triangle: Appears at price bottom when RSI drops below 38
Yellow 200 SMA line: Shows the trend direction and potential support
Trade Setup:
First Requirement: Price must be trading above the 200 SMA
Second Requirement: Wait for RSI to drop below 38
Entry Trigger: When both conditions align (row turns green)
Risk Management: Set stop loss below recent swing low
Exit: When RSI moves above 53 or price crosses below 200 SMA
The scanner monitors multiple instruments simultaneously, allowing traders to identify setups across different markets without manually checking each chart. When a row turns green, that instrument deserves closer attention for potential trade setup.
Example Trade:
Looking at the chart of Apple (AAPL), the yellow triangles show where RSI dropped below 38 while price remained above the rising 200 SMA, providing multiple long entry opportunities in an established uptrend. Actually Apple may be better with RSI below 26.
If you use ctrader, I have made a cbot version of this to automatically take trades on the ctrader platform: eg: XAUUSD i.postimg.cc
Pullbackbuy
Follow the Trend - Trade PullbacksKindly follow the rules stated below for entry, exit and stop loss. Not every Buy / Sell signal will be profitable.
Timeframe of the chart acts as current timeframe. You need to choose 2 more as middle and higher timeframes.
This indicator is based on candlesticks, ATR and CCI indicators and the logic provides buy / sell signals at the pullbacks of the trend depicted by higher timeframe, that must be respected throughout.
Enter the long / short trade respectively when the indicator gives buy / sell signal after price has gone below the green / above the red line for higher timeframe.
Stop loss shall be low / high of recent swing. Exit when the price closes below / above the middle timeframe, to be used as trailing target.
Use it for any instrument for any timeframe of your choice.
For example, check the shared chart. It is a 1 min intraday, but the indicator can be used for short or long term positional trades as well.
Enter long at 14102, with stop loss 14077. Trailing target is achieved at 14156 giving a Risk:Reward ratio of 1:2.
Another Buy signal is observed around same level and uptrend continues till day end, again for a Risk:Reward ratio of approx. 1:2.
Rules to follow for Long trades -
Enter long position at Buy signal given after price has moved below green line of higher timeframe.
Exit the position when price closes below orange / blue line of middle timeframe.
Stop loss must be at low of recent swing, appearing just before the Buy signal.
Rules to follow for Short trades -
Enter short position at Sell signal given after price has moved above red line of higher timeframe.
Exit the position when price closes above orange / blue line of middle timeframe.
Stop loss must be at high of recent swing, appearing just before the Sell signal.

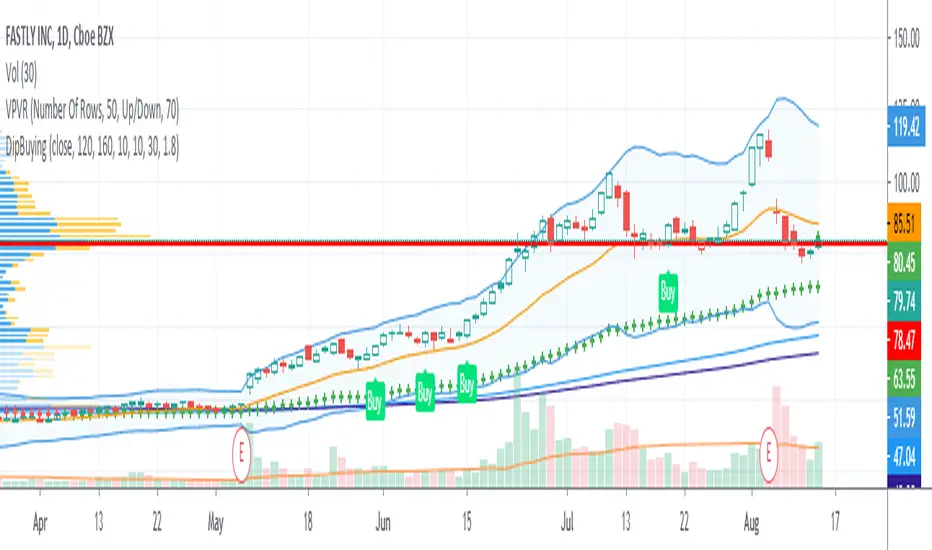
Nerd Dip Buying for StocksThis script is intended to generate BUY signals during pullbacks in stocks which are in the midst of mid to long-term uptrends. The ideal timeframe is Daily.
Signals should be acted upon at or near the close, or at open next bar.
I use 2 simple moving averages (SMA1 and SMA2) to determine whether the stock is currently in an uptrend. The default parameters are:
SMA1 = 120
SMA2 = 160
Buy signals are only produced when SMA1 is above SMA2.
As an additional filter I also use the Adaptive Moving Average (AMA) developed by Perry Kaufman. The settings are (10, 10, 30). Buy signals are allowed only when the bar closes above the AMA.
Lastly, the Buy signal itself is computed utilizing the Greatest Swing Value, a concept pioneered by Larry Williams in his book Long-Term Secrets To Short-Term Trading . You can control how often BUY signals appear by tweaking the parameter GSV Buy Factor . The smaller the number, the more often BUY signals appear. By default,
GSV Buy Factor = 1.8
This indicator has been developed with stocks trading in mind only, in particular US stocks. Feel free to apply it to other markets or asset classes and let me know the results. Thank you very much.
Cumulative Delta (Zeiierman)█ Overview
Cumulative Delta (Zeiierman) transforms raw volume and price data into a continuous buying and selling pressure narrative. Instead of treating volume as a static total, it accumulates the net delta (buying vs. selling activity) bar by bar, revealing whether real demand is supporting or contradicting price movement. This tool bridges microstructure-based order flow concepts with high-level market trend modeling, offering a refined look beneath traditional candles.
The indicator visualizes cumulative trade imbalance over time, layering it with adaptive confirmation lines, impulse recognition, and trend filtration. The result is a refined map of volume–price interaction that identifies hidden strength, fading momentum, or early accumulation before visible reversals occur.
This tool is designed for multi-context use — intraday scalping, swing confirmations, or structural bias analysis — offering a precise view of participation flow beneath price behavior.
⚪ Why This One Is Unique
Unlike conventional delta indicators, this version incorporates adaptive smoothing, multi-source delta modeling, and contextual confirmation layers that dynamically adjust based on both volume and price displacement. Its framework is powered by a volume re-normalization algorithm, combined with multi-dimensional weighted mapping between price flow, volume imbalance, and trend inertia.
█ Main feature: Cumulative Delta Candle
The Cumulative Delta Candles visualize how each bar’s internal buying vs. selling pressure builds over time. They represent volume-weighted displacement vectors of market aggression — when buyers dominate, the delta accumulates upward; when sellers dominate, the cumulative curve decays. Signal and confirmation overlays transform this raw delta motion into a structured view of market conviction, helping traders identify early inflows, exhaustion points, or continuation pressure.
█ How to Use
⚪ Trend Following
The Cumulative Delta is an effective tool for identifying who controls the market trend. When delta candles remain above the midline, buyers are in control. Conversely, when delta candles stay below the midline, sellers dominate.
Strong trends are identified when delta candles consistently cluster near the upper or lower levels, indicating sustained directional pressure in that trend’s favor.
⚪ Fading Momentum
The delta can also be used to detect waning momentum. If delta candles are above the midline but turn red with a declining slope, it signals that the current bullish move is losing strength.
If delta candles are below the midline but turn green with an upward slope, it suggests that bearish momentum is weakening.
⚪ Pullback Trading
To identify pullbacks, combine the overall trend of the Cumulative Delta candles with the Signal Line. Set the Signal Line length to 2 to create a fast-reacting delta line suitable for pullback detection.
Bullish Pullback
When the Cumulative Delta remains above the midline or near the upper level, and the Signal Line briefly dips below the midline or touches the lower level before sharply reversing upward, it signals a bullish pullback within an ongoing uptrend — a potential buy opportunity.
Bearish Pullback
When the Cumulative Delta stays below the midline or near the lower level, and the Signal Line briefly rises above the midline or touches the upper level before sharply turning downward, it indicates a bearish pullback within a downtrend — a potential sell opportunity.
⚪ Momentum Trading
Impulse Dots highlight sudden bursts of momentum in either direction.
When they appear around key breakout levels, they may signal the start of a strong move or breakout. However, if impulses appear after an extended trend, they often indicate potential exhaustion or reversal.
Always evaluate impulse signals within the broader market context to confirm their validity.
⚪ Up-Tick and Down-Tick Signals
The Up-Tick Signal confirms a possible shift or strengthening in bullish order flow. It frequently appears near local swing lows, suggesting increased buying pressure.
The Down-Tick Signal confirms potential bearish order flow. It often forms around local swing highs, signaling growing selling pressure.
⚪ Volume Signals
Volume Signals are derived from delta activity to help traders identify volume-based trend entries. They occur only in confirmed trends and serve as trend continuation triggers.
Bullish Volume Signal: When triggered, enter at candle close and use the built-in trailing stop to manage risk. Exit the trade when the Signal Line crosses below the midline again.
Bearish Volume Signal: When triggered, enter at candle close and use the trailing stop to follow the move downward. Exit the trade when the Signal Line crosses above the midline again.
█ How It Works
⚪ Delta Accumulation
Each candle’s internal buy/sell pressure is estimated using a price–volume ratio model. The resulting delta is accumulated over time to form the Cumulative Delta Curve, showing whether buyers or sellers are in sustained control. Users can select Estimated, Volume Data, or Enhanced modes to align the delta calculation with their preferred market source.
Calculation: Applies Cumulative Delta Integration — a continuous summation of signed volume over time with conditional price weighting. This produces a running measure of net buying or selling activity that evolves dynamically with market flow.
⚪ Signal & Confirmation Lines
The Signal Line reacts faster, acting as a short-term direction probe. The Confirmation Line lags slightly, validating the persistence of the delta trend. Crossovers between these lines frequently precede structural price rotations.
Calculation: Implements Multi-Phase Weighted Moving Functions, layering WMA/EMA structures to control smoothness and minimize phase lag between the fast and slow components.
⚪ Impulse & Momentum Bursts
The Impulse Engine detects statistically significant bursts in delta energy — high-magnitude expansions that often precede breakouts or reversals.
Each impulse is colored according to directional bias, helping visualize moments of strong conviction or exhaustion.
Calculation: Uses Impulse Response Functions, nonlinear filters that measure delta acceleration (Δ²δ/Δt²) to isolate momentum shifts and highlight transient bursts in order flow intensity.
⚪ Trend Layer & Filter
A built-in trend filtration algorithm ensures that bullish and bearish signals only appear when aligned with the dominant trend. The Trend Tolerance setting controls how much short-term noise the filter allows before declaring a trend change — effectively balancing agility vs. stability.
Calculation: Applies Trend Vector Regression, estimating directional slope and deviation using log-based least squares modeling to extract the dominant directional vector from noisy flow data.
⚪ VWAP–EMD Trend Core
The main trend estimation engine fuses Volume-Weighted Average Price (VWAP) logic with an Empirical Mode Decomposition (EMD) smoother, creating a non-linear, adaptive response curve. This enhances directional clarity while preserving microstructural sensitivity to shifts in flow balance.
Calculation: Constructs a VWAP–EMD Composite Curve, merging volumetric centroids with intrinsic mode decomposition for adaptive mean tracking and dynamic equilibrium modeling.
⚪ Trailing Stop & Risk Structure
Once a volume-based entry signal appears, a dynamic trailing stop is automatically drawn. It adapts to volatility and follows price movement, helping visualize optimal exit zones, stop hits, and locked profit regions.
█ Any Alert Function Call
The Any Alert Function Call system transforms the indicator into a programmable alert engine:
Combine multiple triggers (Crossover, Trend Flip, Impulse, Tick, TSL Hit, Volume Signal).
Detect slope, midline, or same-direction confirmations.
Customize messages with placeholders like {{ticker}}, {{close}}, {{volume}}, and {{time}}.
Build complex conditional alerts — such as Bull Volume Signal → TSL Hit — without editing the code.
-----------------
Disclaimer
The content provided in my scripts, indicators, ideas, algorithms, and systems is for educational and informational purposes only. It does not constitute financial advice, investment recommendations, or a solicitation to buy or sell any financial instruments. I will not accept liability for any loss or damage, including without limitation any loss of profit, which may arise directly or indirectly from the use of or reliance on such information.
All investments involve risk, and the past performance of a security, industry, sector, market, financial product, trading strategy, backtest, or individual's trading does not guarantee future results or returns. Investors are fully responsible for any investment decisions they make. Such decisions should be based solely on an evaluation of their financial circumstances, investment objectives, risk tolerance, and liquidity needs.
Tập lệnh trả phí

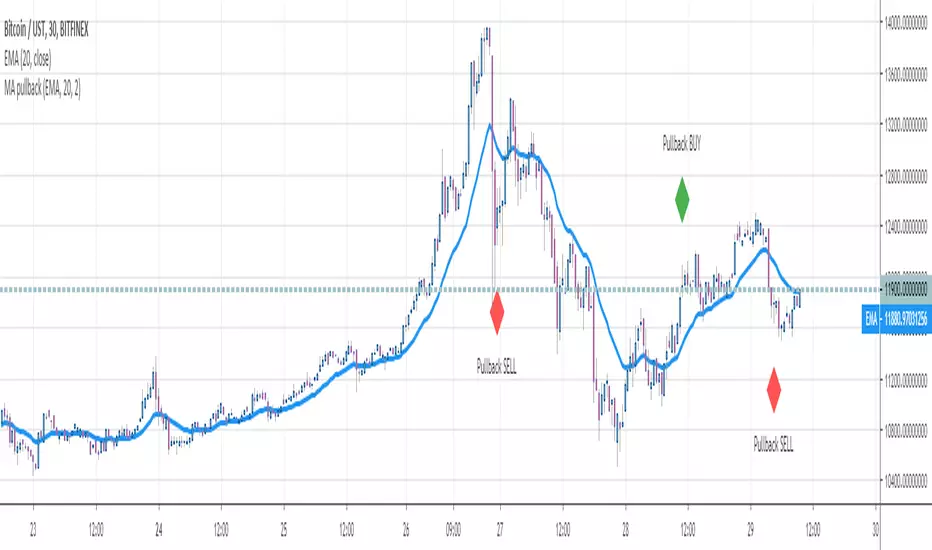
MA pullbackHello traders
This is a script to detect a pullback on a all standard types of moving averages
You'll have the option to define two parameters a bit specific :
Pullback percentage : if you want the pullback to be defined in percentage. Example: I want to capture pullbacks 3% away from my EMA 20
Buffer : Secruty margin for the pullback. You might not want an exact physical touch on the pullback but to let for instance a few pips/USD margin between the price and moving average
If you'd like the pullback to be "price has to touch the moving average", please set the buffer parameter to 0
Enjoy
Dave
Sizing GuideThis indicator helps you defining your max sizing, depending on the max $$$ amount you're willing to risk against a specific exponential moving average (or VWAP, default is the 13ema).
You can define your max risk amount and your max allowed sizing. The indicator would suggest the best sizing in order to risk only up to the amount you are comfortable with on a potential trade.
Moreover, the column bar would turn yellow/red if the divergence is above a certain threshold (default are yellow > 1.50% and red > 2.75%, green otherwise).

Pullback Trading [Fhenry0331]The indicator is taken from Alexander Elders "Triple Screen System," minus using the Weekly MACD as a filter/trend. I believe waiting for the force index and the weekly MACD histogram to line-up is uber conservative and a trader will miss too many signals (In my opinion).
The indicator is for a pullback trader. A trader that waits for a trend to develop then enters on a pullback.
The indicator defines an uptrend start: as the 13 ema crossing above the 26 ema. It defines a downtrend start: as the 13 ema crossing below the 26 ema.
The pullback in an uptrend: 13 ema is above the 26 ema. Elders-Force-Index is below the zero line. Price low has crossed below the 13 ema (one can also say price closes below the 13 ema if they so wish).
The pullback in a downtrend: 13 ema is below the 26 ema. Elders-Force-Index is above the zero line. Price high has also crossed above the 13 ema.
Please note that the pullback signals do not necessitate an automatic buy or sell (the instrument can be still pulling back deeper and not ready to resume it's trend.) One should place orders above (long) or below (short) bars with the pullback signals. Do so on signals until orders are filled.
Although the indicator is meant for pullbacks one can make an aggressive entry at the onset of a crossover of ema's.
For clarity background colors has been added to the indicator.
works well on daily time frame. Also look at intraday (5) minute time frame on trending stocks (news, earnings, volume, etc.)
Keep It Simple.
Enjoy!
