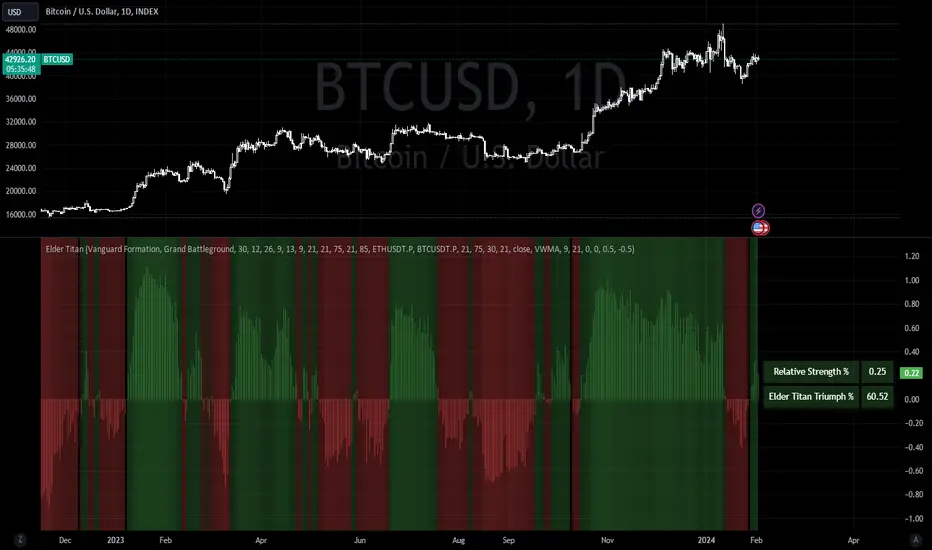
Elder Titan TrendMasterIntroducing the Elder Titan TrendMaster – a battle-tested indicator that harnesses the power of Omega, Sortino, Sharpe, Z-Score, Volume, Sentiment, and Relative Strength, all forged into a single, formidable TPI component. Each element, normalized and ranging from -1 to 1, converges to create the indomitable Elder Titan Score – a beacon in the turbulent seas of trading.
This warrior of indicators is no mere follower; it leads the charge as a discerning oscillator, working to predict market shifts with unparalleled precision. Three overbought signals, armed with the prowess of Volume RSI, Sentiment RSI, and Relative Strength RSI, stand guard against market tops, sounding the alarm when danger looms.
But that's not all – the Elder Titan TrendMaster wields a volume-weighted MACD as an oscillator, adding a potent layer to its arsenal. This oscillator doesn't just observe, it calculates, amalgamating diverse elements to bestow upon you a trend probability rating – a weapon of choice for the discerning trader.
In the heat of battle, the Elder Titan doesn't forget its roots. It unveils the Relative Strength in a table format, an invaluable tool for warriors seeking the strongest trends among different assets.
Fear not the complexity of markets; embrace the simplicity of the Elder Titan TrendMaster – your trusted ally in the relentless quest for trading supremacy.
Technical Summary:
Indicator Name: Elder Titan TrendMaster
Purpose: The indicator combines various technical indicators to generate an overall score, representing the prevailing market trend. It includes elements like Volume Weighted MACD, Relative Strength, RSI, Volume RSI, Sentiment RSI, Sentiment Zone, Volume Trending, and risk metrics such as Sharpe Ratio, Sortino Ratio, Omega Ratio, and Z-Score.
Key Components:
1. MACD (Volume Weighted): Utilizes the Volume Weighted Moving Average (VWMA) to calculate the MACD, providing insights into trend direction and momentum.
2. Elder Impulse: Determines trend strength based on EMA crossovers and MACD histogram analysis.
3. Relative Strength (%): Measures the strength of the current trend based on the percentage difference between short-term and long-term EMAs.
4. RSI (Relative Strength Index): Identifies potential overbought or oversold conditions in the market.
5. Volume RSI: Analyzes the RSI of cumulative volume to assess buying/selling pressure.
6. Sentiment RSI: Combines RSI analysis of two different assets (e.g., ETH and BTC) to gauge market sentiment.
7. Sentiment Zone: Uses Exponential Moving Averages (EMA) to determine the prevailing sentiment in the market.
8. Volume Trending: Compares short-term and long-term volume moving averages to assess overall volume trend.
9. Risk Metrics: Calculates Sharpe Ratio, Sortino Ratio, Omega Ratio, and Z-Score to evaluate risk-adjusted returns.
Buy/Sell Conditions:
• Buy: When the aggregated score is greater than 0.
• Sell: When the aggregated score is less than 0.
Visualization:
• The indicator is plotted as an oscillator with color-coded bars indicating the prevailing trend (green for bullish, red for bearish).
• Additional visual cues, such as background colors and a table, provide insights into Relative Strength, and Win Rate (Elder Titan Triumph %).
Win Rate Calculation:
• The win rate is calculated based on the number of winning trades and total trades, considering buy and sell conditions.
Parameters and Settings:
• Adjustable parameters include lookback periods, MACD settings, EMAs, RSI lengths, Sentiment RSI settings, Sentiment Zone parameters, Volume Trending settings, and risk metric lookback periods.
Usage: The indicator aims to assist traders in identifying potential trend reversals, evaluating market sentiment, and managing risk through various technical indicators and risk metrics.
Disclaimer: Users should thoroughly understand and test the indicator before using it in live trading. It's essential to adapt the parameters to specific market conditions and trading preferences.
This technical summary provides an overview of the Elder Titan TrendMaster indicator and its key features. Adjustments may be needed based on individual trading strategies and preferences.
So sánh Sức mạnh tương đối
Saay RS NavigatorDescription:
The Saay RS Navigator is a comprehensive indicator designed to measure and visualize the Relative Strength (RS) of a stock or security against a benchmark across multiple time frames. This tool plots three distinct RS lines representing Short Term, Medium Term, and Long Term perspectives, each customizable in length and color to suit various trading strategies and preferences.
Functionality:
1. Short Term RS (Green Line): Offers a rapid view of the stock's strength, ideal for identifying short-term trends or quick market reactions. The default period is set to 10 days.
2. Medium Term RS (Blue Line): Balances between short-sighted and long-term views, reflecting medium-term market momentum and trends. The default period is set to 55 days.
3. Long Term RS (Yellow Line): Provides insights into the overarching market trend, helping users understand long-term strength and directional bias. The default reference time is set to 16 June 2023.
4. Zero Line (Red Line): Acts as a baseline for comparison, aiding in the visual distinction of strength or weakness relative to the benchmark.
Each line's color and period can be tailored to individual trading needs, allowing for a personalized analysis experience. By understanding a stock's strength against a benchmark across different periods, traders can make more informed decisions about entry and exit points, trend following, or potential reversals. The Saay RS Navigator is a versatile tool for traders who want to enhance their market analysis with multi-timeframe insights, providing a clearer picture of relative performance and helping to identify key trends and reversals. Whether you're a short-term trader or a long-term investor, this indicator can add depth to your technical analysis arsenal.

Multi Period Relative StrengthMulti Period Relative Strength Indicator
This indicator is meticulously designed around the fundamental concept of relative strength, providing a powerful tool to assess an instrument's performance against peers or a benchmark index within the same asset class. Tailored for short-term swing trend analysis, it equips traders with the insights needed to make informed decisions based on prevailing relative strength dynamics.
More about Relative Strength: www.investopedia.com
Key Features:
Dual Period Analysis:
The indicator conducts a dual-period analysis, scrutinizing relative strength across two distinct period—a fast period and a slow period. This approach allows for a comprehensive evaluation of relative strength dynamics.
Visualization:
Slow RS is visually depicted as a green cloud above the zero line showing relative strength or a red cloud below it showing relative weakness. This visual representation aids in assessing the underlying instrument's performance against its peer over the past 3 months (slow period).
Fast RS is visually presented as green bars above the zero line showing relative strength or red bars below it showing weakness. This visual cue helps evaluate the performance of the underlying instrument against its peer over the last week (fast period).
Positive Relative Strength:
When both the fast and slow periods exhibit positive values, it signifies sustained strength in the current instrument over both the past 3 months and the last week.
Divergence Evaluation:
A positive fast period coupled with a negative slow period signals a robust relative strength trend over the past 3 months, but with a recent decline in the last week. Traders may consider adjusting positions, such as reducing or exiting, in response to this divergence.
Strength Building Scenario:
Conversely, a negative fast period paired with a positive slow period indicates relative weakness over the past 3 months, coupled with an increasing trend in the last week. This scenario may present an opportunity to gradually build positions, particularly if the 3-month relative strength turns positive.
Strategic Decision Points:
Traders can leverage these signals strategically to manage portfolios, adjusting positions based on the nuanced interplay between short-term and longer-term relative strength trends.
Risk Mitigation Strategies:
By interpreting the indicator signals, traders can implement effective risk mitigation strategies, including position downsizing, exits, gradual position building, or short covering. These actions align with the prevailing relative strength dynamics.
In summary, the Multi Period Relative Strength Indicator offers a nuanced and actionable perspective on an instrument's relative strength. By examining both short-term and 3-month trends, traders can make well-informed decisions to optimize their trading strategies and portfolio management.

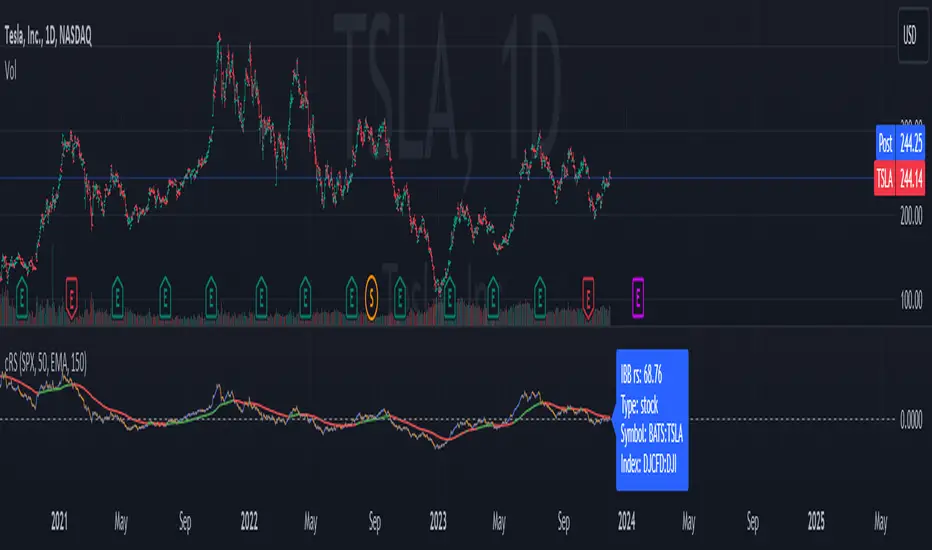
Comparative Relative Strength AutoselectComparative Relative Strength (CRS) is a relative momentum indicator, used to compare a security against an index, or against another security. The comparison is used to show the relative performance to each other.
This script is a Quality of Life improvement, which attempts to match the base symbol to its relevant index on the local stock exchange. Thus automagically selecting the best and most relevant comparative symbol.
Features:
*optional comparative symbol override, in case your favourite index is not included in this script, or you want to force it to function as as a traditional cRS script without the autoselect feature.
* optional moving average crossover line
* optional absolute momentum calculation, calculating the excess return of the basesymbol and comparativesymbol against its own simple moving average.
Sector relative strength and correlation by KaschkoThis script provides a quick overview of the relative strength and correlation of the symbols in a sector by showing a line chart of the close prices on a percent scale with all symbols starting at zero at the left side of the chart. It allows a great deal of flexibility in the configuration of the sectors and symbols in it. The standard preset sectors cover the most important futures markets and their symbols.
However, up to ten sectors with up to ten symbols each can be freely configured. Each sector is defined by a single line that has the following format:
Sector name:Symbol suffix:List of comma separated symbols
For example, the first predefined sector is defined as follows.
Energies:1!:CL,HO,NG,RB
1. The name of the sector is "Energies"
2. The suffix is "1!", i.e., to each symbol in the list "1!" is appended to get the continous future for the given symbol root. When using stock, forex or other symbols, simply leave the suffix empty.
3. The list of comma separated symbols is "CL,HO,NG,RB", i.e. crude oil, heating oil, natural gas and gasoline. As the suffix is "1!", the actual symbols whose prices are shown are "CL1!","HO1!","NG1!" and "RB1!"
You can choose to use settlement-as-close and back-adjusted contracts. The sector can also be determined automatically ("Auto-select"). In this case, it is determined to which sector the symbol currently displayed in the main chart belongs and the script displays it in the context of the other symbols in the sector.
By selecting a suitable chart time frame and time range, you can quickly determine which symbols in the sector are stronger or weaker and which are more or less strongly correlated.
The following symbols are best suited for a quick trial, as the sectors are preset for these:
CL1!,ES1!,6A1!,6B1!,6c1!,6E1!,6J1!,6M1!,6N1!,6S1!,GC1!,GF1!,HE1!,HG1!,HO1!,LBR1!,LE1!,NG1!,NQ1!,PA1!,PL1!,RB1!,SI1!,YM1!,ZB1!,ZC1!,ZF1!,ZL1!,ZM1!,ZN1!,ZO1!,ZR1!,ZS1!,ZT1!,ZW1!,CC1!,CT1!,DX1!,KC1!,OJ1!,SB1!,RTY1!
You can also use the script to compare any symbols (e.g. different shares) with each other. Preferably use the "Custom" sector for this.

TEWY - Magic Momentum IndicatorMy goal is to equip every trader and investor with the essential tools necessary to confidently navigate the complexities of the financial markets, enabling them to consistently identify opportunities and maintain a position of strength on the winning side of their trades. This indicator stands as a potent tool, offering the capability to effectively assess longer-term momentum trends.
Allow me to provide some context regarding the genesis of this indicator. By keenly observing the pattern of momentum loss preceding each trend reversal, coupled with the notable decrease in the rate of price change, I've formulated this indicator. This design is rooted in the understanding that these dynamics hold key insights into the market's shifting trends.
So, I've developed this indicator with the purpose of granting you the ability to select and construct optional combinations of up to two comparable symbols. Through this, you gain a comprehensive and insightful perspective on the ever-evolving dynamics of the market.
This indicator acts like an oscillator and momentum line serves as a key determinant. When the line is positioned above 0, it signifies a positive momentum; conversely, if it rests below 0, it indicates a sideways to negative trend. This mechanism offers a clear and intuitive means of gauging prevailing market conditions.
Should you have any inquiries or require further clarification regarding this indicator, please do not hesitate to reach out to me via direct message. I am here to provide you with the necessary guidance and support to ensure your experience with this tool is both seamless and enriching. Your understanding and satisfaction remain my utmost priority.
By TEWY - Trade Easy With Yogesh
I am Yogesh

RedK Relative Strength Ribbon: RS Ribbon and RS ChartsRedK Relative Strength Ribbon (RedK RS_Ribbon) is TA tool that plots the Relative Strength of the current chart symbol against another symbol, or an index of choice. It enables us to see when a stock is gaining strength (or weakness) relative to (an index that represents) the market, and when it hits new highs or lows of that relative strength, which may lead to better trading decisions.
I searched TV for existing RS indicators but didn't find what I really wanted, so I put this together and added some additional features for my own use. It started as a simple RS line with new x-weeks Hi/Lo markers, then evolved into what you see here in v1.0 with the ability to plot a full RS chart in regular or HA candle types. Hope this will be useful to some other growth traders here on TV.
What is Relative Strength (RS)
------------------------------------
(RS is a comprehensive concept in TA, below is a quick summary - please research further if it's not already a familiar topic)
Relative Strength (RS) is a technical concept / indicator used mainly by growth / swing / momentum traders to compare the performance of one security or asset against another. RS measures the price performance of a specific security relative to a benchmark, such as an index or another asset. It's not to be confused with the famous Relative Strength Index (RSI) technical indicator
For example, In the context of comparing a stock's relative strength to the SPY (S&P 500) index, the relative strength calculation involves dividing the stock's price or price-related value (e.g., close price) by the corresponding value of the SPY index. The resulting ratio (and its trend over time) indicates the relative performance of the stock compared to the index.
Traders and investors use relative strength analysis to identify securities that have been showing relative strength or weakness compared to a benchmark, which can help in making investment decisions or identifying the "market leaders" and potential trading opportunities.
There are so many books and documentation about the RS concept and its importance to identify market leaders, especially when recovering from a bear market - if you're interested in the concept, please search more about it and review some of that literature. There's also a more detailed definition of Relative Strength in this article on Invstopedia
RedK RS_Ribbon features and options
---------------------------------------------------
The indicator settings provide many options and features - see the settings box below
- Change / choose base symbol
The default is to use SPY as the base symbol - so we're comparing the chart's symbol to a proxy of the S&P 500 - Some traders may prefer to use the QQQ - or other index or ETF that acts as a proxy for the industry / sector / market they are trading
- RS Calculation / RS line
we use the simple form of the RS calculation,
RS = closing price of current chart symbol / closing price of the base symbol (default is SPY) * 100
some RS documentation will use the Rate of Change (RoC) - but that's not what we're using here.
- The RS_Ribbon
* Once the RS line is plotted, it made sense to add couple of moving averages to it, to make it easier to observe the trend of the RS and the changes in that trend as you can see in the sample chart on top.
* The RS_Ribbon is made up of a fast and slow moving averages and will change color (green / red) based on detected trend RS direction - the 2 MA types and lengths can be changed until you get the setup that provides the best view for you of the RS trend over time. My preferred settings are used as defaults here.
- Identifying New (x)Week Hi/Lo RS Values
* Most traders would be interested when the calculated RS hits a new 52-week high or low value.
* There are cases where we may want to see when a new RS Hi/Lo has been hit for a different period - for example, a quarter (13 weeks)
* the number of weeks can be changed as well as adjusting the numbers of trading days per week (if needed for certain symbols/exchanges)
- Working with Different Timeframes
* Now these "markers" will only be available in the daily and weekly timeframes and there is a good reason for that, it's not the fact that i'm lazy :) and that enabling this in timeframes lower than 1D would have been some heavy lifting, but the reality is that with RS, we're really interested if a "day's close" hits a new RS high or low value against the moving window of x weeks (and the weeks close also) - if you think of this more, at lower TF, RS can hit a lower value that never end up registering on the daily closing and that causes a lot of visual confusion. So i took the "cleaner way out" of that issue.
* note that you can choose a different timeframe for the RS_Ribbon than the chart - if you do, please make sure the chart is at a lower timeframe than the indicator's - (and in that case remember to hide the candles because they won't make much sense)
i wanted to leverage TV's built-in multi-Timeframe (MTF) support with the caveat that using the indicator at lower TF with a chart at a higher TF (example chart at 1Wk and indicator at 1D) will show inaccurate results. If this sounds confusing, keep the indicator TF same as the chart.
the example here shows a 2-Hr chart against 1D RS_Ribbon
- Using RS Charts and RS Candles
* Beside the ability to plot the RS "closing" value with the RS line, the indicator provides the ability to show a "full" RS Chart with candles that represent the relative values of open, high, low. and close against the base symbol.
* the RS Charts can be used for regular chart analysis, for example, we can identify common chart patterns like Cup & Handle, VCP, Head & Shoulder..etc using these charts .. which can provide some edge over the price charts
* for the Heikin Ashi fans, I added the ability to choose classic or HA candles for the chart. note you have to enable the option to show the RS candles first before you choose the option to switch to HA.
The chart below shows a side-by-side comparison on the 2 RS chart types
Closing remarks
-----------------------
* RS is a good way to identify market/sector leaders (who will usually recover from a bear market before others) - and enable us to see the strength that comes from the broader makrket versus the one that comes from the stock's own performance and identify good trading opportunities
* I'll continue to update this work and alerts will come in next version - but wanted to check initial reaction and value
* as usual, if you decide to use this in your chart analysis, it's necessary to combine with other momentum, trend, ...etc indicators and do not make trading decision only based on the signales from a single indicator

Market Smith IndicatorsMarket Smith has a collection of tools that are useful for identifying stocks. On their charts they have a 21/50/200 day moving averages, high and low pivot points, a relative strength line, and a relative strength rating. This script contains indicators for the following:
21/50/200 Day Moving Averages
High and Low pivot points
A Relative Strength line
A Relative Strength rating
21/50/200 Day Moving Averages
The 21/50/200 Day moving averages are simple moving averages. They are visible in any chart increment but to use them properly you need to set you charts to be by day. Labels will appear on the right of the lines to show that they are representative of 21/50/200 day moving averages.
High and Low pivot points
The High and Low pivot points are green for high pivot points and red for low points. They are show in the Market Smith style with the numbers simply above the pivot points.
Relative Strength line
The Relative Strength line is a line that shows the strength of the stock compared to the S&P 500. In this case we utilize the SPX ticker to compare the stock to. This line is almost identical to the Market Smith tool and is an excellent tool to determine how a stock is doing compared to the market. When movements in the stock and shown with sideways trending of the RS line that means that the stock is following the market. When a stock is outperforming the market the RS line will follow.
Relative Strength rating
Thank you to ©Fred6724 for the RS Rating inspiration. They wrote excellent open source code for a RS Rating comparable to Market Smith. As the RS Rating in Market Smith is not open source it is difficult to know exactly how it is being calculated. After simplifying Fred's code and building upon a few ideas I had I compared the RS Rating to multiple Market Smith Ratings. The rating is close but often off by multiple points. If there is anyone who has a better idea on how to get this rating or how to improve on the code please send me a PM or fork this project. This rating is a good indicator to see how a certain stock compares to other stocks in the market. In Market Smith they are able to utilize their database to compare it to all other stocks. Since we do not have access to the same tools we are only able to compare it to the percentage of stocks above the 200, 150, 100, 50, and 20 day moving average.
Using these tools together are a small fraction what make people like Bill O'neill and Jim Roppel so successful. I plan on updating the RS Rating as I continue to work on this project so if there is anyone who has ideas then please send me a PM. Ultimately the goal of this project is to have a solution that is identical to Market Smith.

[TTI] NDR 63-Day QQQ-QQEW ROC% SpreadWelcome to the NDR 63-Day QQQ-QQEW ROC% Spread script! This script is a powerful tool that calculates and visualizes the 63-day Rate of Change (ROC%) spread between the QQQ and QQEW tickers. This script is based on the research conducted by Ned Davis Research (NDR), a renowned name in the field of investment strategy.
⚙️ Key Features:
👉Rate of Change Calculation: The script calculates the 63-day Rate of Change (ROC%) for both QQQ and QQEW tickers. The ROC% is a momentum oscillator that measures the percentage price change over a given time period.
👉Spread Calculation: The script calculates the spread between the ROC% of QQQ and QQEW. This spread can be used to identify potential trading opportunities.
👉Visual Representation: The script plots the spread on the chart, providing a visual representation of the ROC% spread. This can help traders to easily identify trends and patterns.
👉Warning Lines: The script includes warning lines at +600 and -600 levels. These lines can be used as potential thresholds for trading decisions.
Usage:
To use this script, simply add it to your TradingView chart. The script will automatically calculate the ROC% for QQQ and QQEW and plot the spread on the chart. You can use this information to inform your trading decisions.
🚨 Disclaimer:
This script is provided for educational purposes only and is not intended as investment advice. Trading involves risk and is not suitable for all investors. Please consult with a financial advisor before making any investment decisions.
🎖️ Credits:
This script is based on the research conducted by Ned Davis Research (NDR). All credit for the underlying methodology and concept goes to NDR.

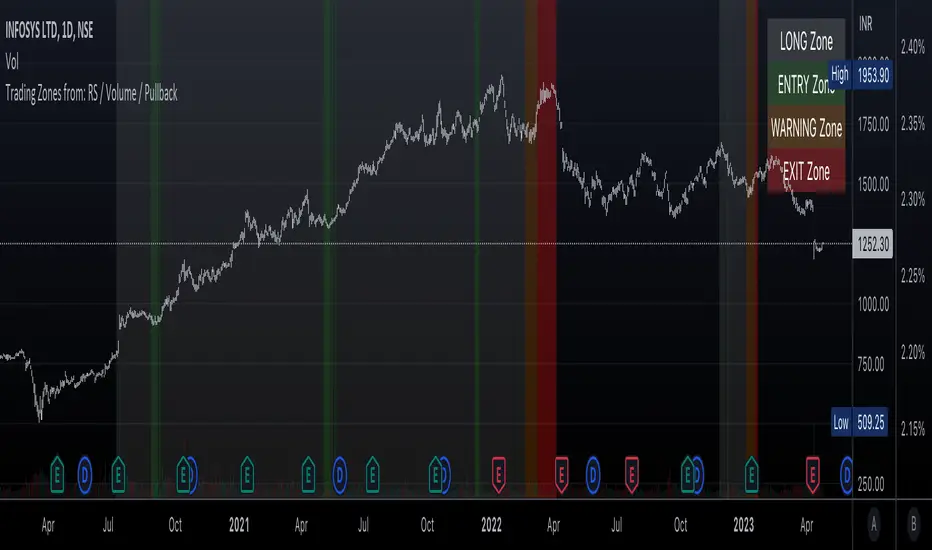
Trading Zones based on RS / Volume / PullbackThis is an Indicator which identifies different Trading Zones on the chart.
This should be Primarily used for Long Trades.
Trading Zones: and the Reasoning behind them
Long Zone -> One can do a Potential Entry (Buy) when this Zone is identified, but one could also wait for 'Entry Zone' (explained next) for a better Risk/Reward Trade.
Long Zones are identified with the help of Relative Strength and by an Intermediate Top in price.
Entry Zone -> This can be a better Risk/Reward zone to enter positions within the Long Zone.
Entry Zone is identified by a Pullback in Price & Volume contraction after the Long Zone is activated
Warning Zone -> One needs to be careful in this zone, no need to panic, Script will now try to find an Exit when Price Retraces towards Highs.
Warning Zone identifies weakness in the Price using Relative Strength of the current Stock (w.r.t. the Reference Symbol configured) and the severity of Pullback in Price.
Exit Zone -> are found only after transitioning to Warning Zone, this is a Zone which helps in minimising losses after a trade has gone into losses. Exit Zone is identified by making sure a local peak forms in Warning Zone. However, there are instances when Exit Zone detection can get prolonged when a local price peak is not formed soon enough. So one needs to be careful and use other strategies for exit.
------------------------------------------------------------------------------------
What is different in this Script:
The Script uses Relative Strength in combination with Pullback in Price from Highs in a Novel way.
Over-trading is avoided by ignoring Sideways price movements, using Relative Strength.
Only Trending Upward movement is detected and traded.
How to use this Indicator:
Use these 'Trading Zones' only as a reference so it can minimise your time in screening stocks.
Preferred Settings for using the Indicator:
Stick to 1-Day candles
Keep Relative Symbol as "Nifty" for Indian Stocks.
For US stocks, we can use "SPX" as the Relative Symbol.
//----------------
FEW EXAMPLES:
//----------------
ASIANPAINT
TATAMOTORS
TITAN
ITC
DIVISLAB
MARUTI
---------------------------------------------
Feedback is welcome.
NOMMO AUTOMATE🖖 Hi all!
Check out my NOMMO AUTOMATE indicator for trend detection, trend change points, hedging opposite trend impulses.
What the script do:
☑️ Detecting local and global trends and trend change points, detecting opposite to current trend impulses.
How the script do it:
☑️ The indicator compares RSI indicators on chosen by user Trend TF1 and Trend TF2 and marks trend change points.
☑️ The indicator compares different length HMA indicators on chosen by user Hedge TF to detect opposite to current trend impulses.
How to use it:
☑️ There are 4 states in the indicator: Long, Short, Flat, Hedge, marked by corresponding (adjustable) color zones, where Long = uptrend, Short = downtrend, Flat = sideways movement, Hedge = possible impulse in the opposite trend direction.
☑️ Select Trend TF1 and Trend TF2 and RSI length to determine the trend, depending on how a big picture you want to see, the more major TF you choose the more global picture of the trend change you get.
☑️ Select Hedge TF to determine the possible impulses opposite to the current trend (does not work in detected Flat movement).
☑️ For each trading pair you need to try individual settings, the default settings I use for BTC swing trading, to reduce the noise level of hedging put Hedge TF the same as the smaller Trend TF.
☑️ Try different settings, experiment and you will find the most suitable settings for your trading pair.
How magic works:
☑️ RSI Trend TF1 > 50 + RSI Trend TF2 > 50 = Long
☑️ RSI Trend TF1 > 50 + RSI Trend TF2 < 50 = Flat
☑️ RSI Trend TF1 < 50 + RSI Trend TF2 > 50 = Flat
☑️ RSI Trend TF1 < 50 + RSI Trend TF2 < 50 = Short
☑️ Long + Hedge TF (HMA 10 < HMA 70 < HMA 200) = Hedge
☑️ Short + Hedge TF (HMA 10 > HMA 70 > HMA 200) = Hedge
For example:
☑️ Try Trend TF1 = 1D, Trend TF2 = 1D and Hedge TF = 1D, with RSI period = 21, to check mid-term trend on BTCUSD
May the trade force be with you.

Market Relative Candle Ratio ComparatorIntroducing the Market Relative Candle Ratio Comparator, a visually captivating script that eases the way you compare two financial assets, such as cryptocurrencies and market indices. Leveraging a distinctive calculation method based on percentage changes and their averages, this tool presents a crystal-clear view of how your chosen assets perform in relation to each other, both for individual candles and over a range of previous candles.
Tailoring the script to your preferences is a walk in the park, as it allows you to easily adjust input symbols, moving average lengths, and other parameters to match your analytical approach. The visually arresting column chart it creates employs vivid red and green colors to underscore the differences between the two assets on each candle. Simultaneously, the lower-opacity columns depict the accumulated differences over a specified lookback period. This vibrant blend of colors and opacities results in a dynamic visual experience, enabling you to better grasp market trends relative to each other.
The reverse bool input is a handy feature that lets you invert the effect of the input symbol (DXY by default) in the comparison. When you set the reverse input to true, the script multiplies the calculated DXY percentage change by -1, effectively reversing the comparison. This is particularly useful when examining assets with an inverse relationship or when you'd like to analyze the input symbol's impact in the opposite direction.
For instance, if the input symbol represents a market index that generally moves in the opposite direction of the selected cryptocurrency, enabling the reverse input will help you better visualize and understand the relationship between the two assets by inverting the input symbol's effect on the comparison.
In the accompanying chart, you can observe the comparison of Bitcoin's movement relative to the Dollar, Gold, Bonds, and the S&P 500. The indicator reveals that in the last day, Bitcoin outperformed Bonds, Gold, and the Dollar but not the S&P 500!

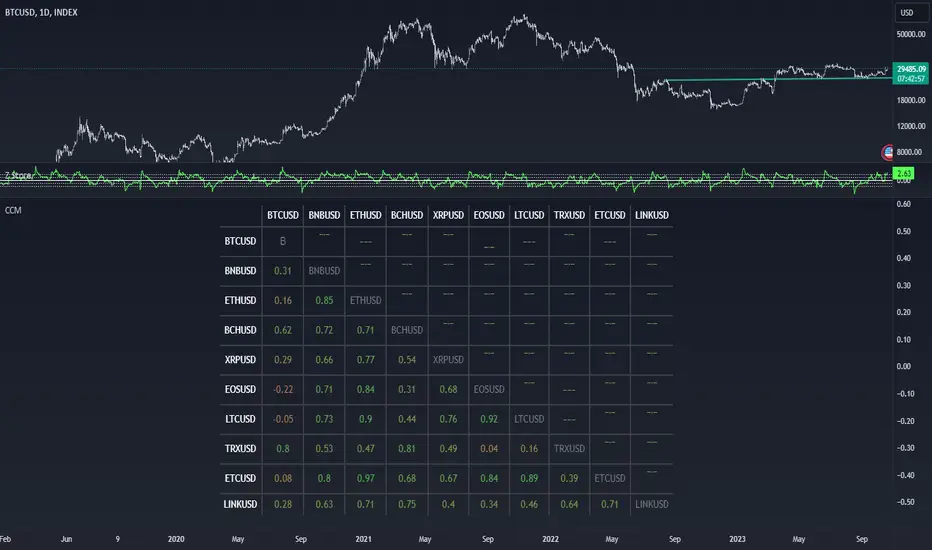
Correlation Crypto MatrixReturns a (top 10 by default) coins matrix correlation between various user-selected symbols
Correlation matrices can be useful to see the linear relationship between various symbols, this is an important tool for analyze market.
Alert with matrix. You can send it to the sheets
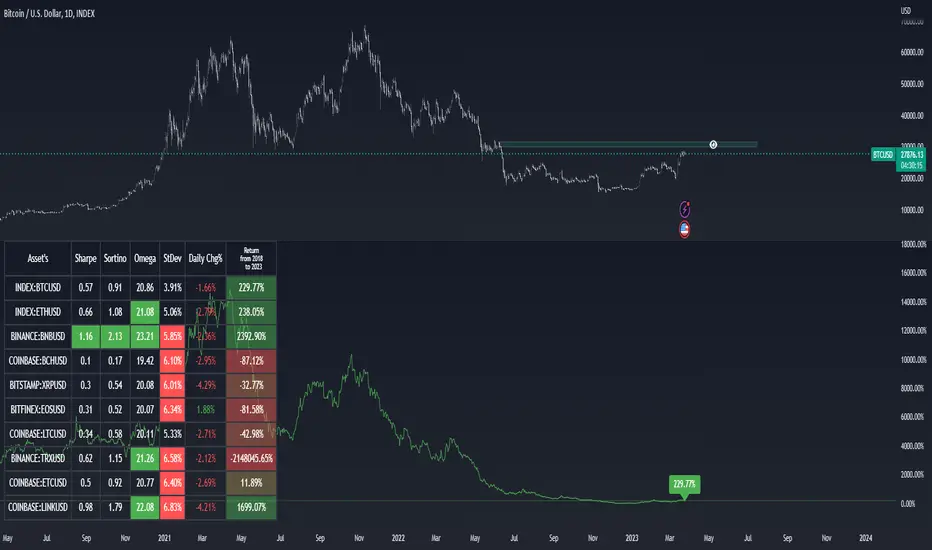
Asset Selection Indicator by [VanHelsing]Asset Selection Indicator
This is a table what will help you to see what asset's are optimal to use in your portfolio or strategies.
By different metrics what are ploted on a table you will see how each individual asset performe compare to other
Sharpe, sortino, omega ratio's are very valueble metriscs in bulding portfolio and now you can easly see them without difficult calculations.
Do you want to know return of asset for 3, 5, 2 years? You are welcome to choose in settings whatever period you want, the same for other metrics
Below is instruction how to use this indicator:
(Explanation of Settings for a period of data)
(Asset selection by Sharpe, Omega, Sortino, StDev)
(How to plot Equity)
And a nice bonus is an alert!
(you can send it to a spreadsheet like I explained in other my indicator "Stock Correlation Table")
Industry SRS-ARS StrengthThis script show the Relative strength of the script vs selected Industry.
Simply us the Compare Index drop down list to select the Industry you want to compare your symbol with and it will plot a line chart.
The index of the industries have been created based on the highest to lowest Market Cap of the first 10 companies from that industry.
You also have option to choose Static RS period and Adaptive RS date.
####Please note that some industry index may not show a full length back data and the reason may be some companies from that Index may have been listed recently.
I Do it this way.
Step 1 : Check the custom industry index outperformance to the benchmark
Step 2 : Search the companies from that industry. Screener.in is a useful site for this search.
Step 3: Plot this indicator on TradingView and compare the performance of the stock to is industry Index.
This way you can find the best sector/industry outperforming the benchmarck index and then you can short list the outperforming companies from that industry.

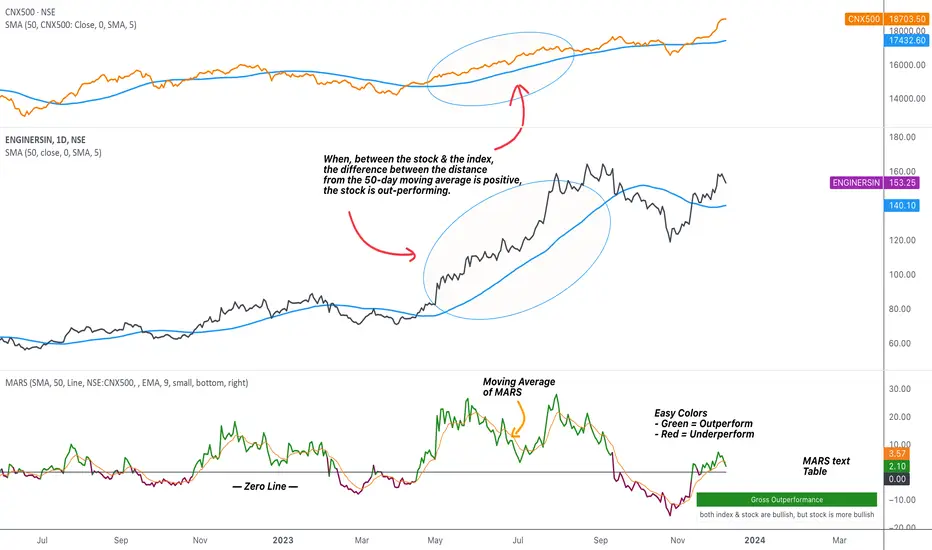
MARS - Moving Average Relative StrengthThe original idea from this script is from the script " Percentage Relative Strength " by dman103 . The original script compared a symbol to an index by their everyday percentage change. The symbol percentage was subtracted from percentage change of the index, & the results were then smoothed by moving averages.
Instead of daily percentage changes, this script directly calculates relative strength via a moving average. We call this simpler approach as MARS (Moving Average Relative Strength) .
MARS compares a symbol to the index by making use of the price's distance from a moving average. By default, we compare the distance from the 50-day simple moving average of the stock vs that of the index. Both the type & the length of the moving average is customisable.
Background color indicates the index being above or below its moving average.
Blue background: index is above its moving average
Pink background: index is below its moving average
The histogram indicates whether the stock is under-performing or out-performing the index.
Up-bars : stock is out-performing the index i.e. between the stock & the index, the difference between the distance to/from the 50-day moving average is a positive value.
Down-bars : stock is under-performing the index i.e. between the stock & the index, the difference between the distance to/from the 50-day moving average is a negative value.
The color of the histogram indicates the type of out-performance or under-performance. There can be a total of 6 such colors:
Relative out-performance : both index & stock are bearish, but stock is less bearish. The script prints light green up-bars on a pink background.
Gross out-performance : both index & stock are bullish, but stock is more bullish. The script prints green up-bars on a blue background.
Absolute out-performance : index is bearish, but stock is bullish! The script prints blue up-bars on a pink background.
Relative under-performance : both index & stock are bullish, but stock is less bullish. The script prints light red bars on a blue background.
Gross under-performance : both index & stock are bearish, but stock is more bearish. The script prints dark red bars on a pink background.
Absolute under-performance : index is bullish, but stock is bearish! The script prints black down-bars on a blue background.
Additional customisation options:
Paint bars option changes the bar colors to mirror the histogram colors.
Easy colors option just changes the histogram colors to either blue or pink, indicating out-performance or under-performance, respectively. This is when the trader does not wish to demarcate between the above-mentioned 6 conditions.
Minervini Pullback Strategy_Trend-Template QualifierGeneral Description and Unique Features of this Script
Introducing the ultimate trend-following (long-only) strategy that offers a unique feature you won't find anywhere else!
1. Our script/strategy utilizes Mark Minervini's Trend-Template as a qualifier for identifying stocks and other financial securities in confirmed uptrends. Mark Minervini, a 3x US Investment Champion, developed the Trend-Template, which covers eight different and independent characteristics that can be adjusted and optimized in this trend-following strategy to ensure the best results. The strategy will only trigger buy-signals in case the optimized qualifiers are being met.
2. Our strategy is based on supply/demand balance in the market, making it timeless and effective across all timeframes. Whether you're day trading using 1- or 5-min charts or swing-trading using daily charts, this strategy can be applied and works very well.
3. We also incorporate technical indicators such as RSI and MACD to identify low-risk pullback entries in the context of confirmed uptrends. By doing so, the risk profile of this strategy and drawdowns are being reduced to an absolute minimum, giving you peace of mind while trading.
Minervini’s Trend-Template and the ‘Stage-Analysis’ of the Markets
This strategy is a so-called 'long-only' strategy. This means that we only take long positions, short positions are not considered.
The best market environment for such strategies are periods of stable upward trends in the so-called stage 2 - uptrend.
In stable upward trends, we increase our market exposure and risk.
In sideways markets and downward trends or bear markets, we reduce our exposure very quickly or go 100% to cash and wait for the markets to recover and improve. This allows us to avoid major losses and drawdowns.
This simple rule gives us a significant advantage over most undisciplined traders and amateurs!
'The Trend is your Friend'. This is a very old but true quote.
What's behind it???
• 98% of stocks made their biggest gains in a Phase 2 upward trend.
• If a stock is in a stable uptrend, this is evidence that larger institutions are buying the stock sustainably.
• By focusing on stocks that are in a stable uptrend, the chances of profit are significantly increased.
• In a stable uptrend, investors know exactly what to expect from further price developments. This makes it possible to locate low-risk entry points.
The goal is not to buy at the lowest price – the goal is to buy at the right price!
Each stock goes through the same maturity cycle – it starts at stage 1 and ends at stage 4
Stage 1 – Neglect Phase – Consolidation
Stage 2 – Progressive Phase – Accumulation
Stage 3 – Topping Phase – Distribution
Stage 4 – Downtrend – Capitulation
This strategy focuses on identifying stocks in confirmed stage 2 uptrends. This in itself gives us an advantage over long-term investors and less professional traders.
By focusing on stocks in a stage 2 uptrend, we avoid losses in downtrends (stage 4) or less profitable consolidation phases (stages 1 and 3). We are fully invested and put our money to work for us, and we are fully invested when stocks are in their stage 2 uptrends.
But how can we use technical chart analysis to find stocks that are in a stable stage 2 uptrend?
Mark Minervini has developed the so-called 'trend template' for this purpose. This is an essential part of our JS-TechTrading pullback strategy. For our watchlists, only those individual values that meet the tough requirements of Minervini's trend template are eligible.
The Trend Template
• 200d MA increasing over a period of at least 1 month, better 4-5 months or longer
• 150d MA above 200d MA
• 50d MA above 150d MA and 200d MA
• Course above 50d MA, 150d MA and 200d MA
• Ideally, the 50d MA is increasing over at least 1 month
• Price at least 25% above the 52w low
• Price within 25% of 52w high
• High relative strength according to IBD.
We have developed an algorythm (for TradingView) that uses Minervini’s trend template as a qualifier. This means that the strategy only generates trading signals in case the selected elements of the trend template are being met. The user is fully flexible to adjust the requirements of this Trend-Template qualifier:
This strategy is normally applied to the daily chart ideal for selecting individual stocks for trend-following strategies. Nevertheless, Minervini’s principles are timeless and this alogrithmic strategy with the Trend-Template qualifier can also be applied to any other timframe.
The qualifier #9 (RS-Ratings) can be modified and optimized in the strategy’s settings to fit your individual needs.
In general, it should be noted that ideally all 8/8 trend template criteria are met. Stocks or other securities that meet only some of these 8 criteria can also be very promising candidates for this strategy, provided that backtesting yields good results.
The Pullback Strategy
For the JS-TechTrading pullback strategy, only stocks and other financial instruments that meet the selected criteria of Mark Minervini's trend template are considered. If not, the strategy will not generate any signals.
Further prerequisites for generating a buy signal is that the individual value is in a short-term oversold state (RSI).
When the selling pressure is over and the continuation of the uptrend can be confirmed by the MACD after reaching a price low, a buy signal is issued by the pullback strategy.
Stop-loss limits and profit targets can be set variably.
Relative Strength Index (RSI)
The Relative Strength Index (RSI) is a technical indicator developed by Welles Wilder in 1978. The RSI is used to perform a market value analysis and identify the strength of a trend as well as overbought and oversold conditions. The indicator is calculated on a scale from 0 to 100 and shows how much an asset has risen or fallen relative to its own price in recent periods.
The RSI is calculated as the ratio of average profits to average losses over a certain period of time. A high value of the RSI indicates an overbought situation, while a low value indicates an oversold situation. Typically, a value > 70 is considered an overbought threshold and a value < 30 is considered an oversold threshold. A value above 70 signals that a single value may be overvalued and a decrease in price is likely , while a value below 30 signals that a single value may be undervalued and an increase in price is likely.
For example, let's say you're watching a stock XYZ. After a prolonged falling movement, the RSI value of this stock has fallen to 26. This means that the stock is oversold and that it is time for a potential recovery. Therefore, a trader might decide to buy this stock in the hope that it will rise again soon.
Moving Average Convergence Divergence (MACD)
The MACD (Moving Average Convergence Divergence) is a technical indicator used in both short-term and long-term trading strategies. The indicator was developed by Gerald Appel and is one of the most well-known indicators for the stock market.
The MACD consists of two lines calculated by the difference between two moving averages. The first line is a fast moving average that targets a short period of time. The second line is a slow moving average that targets a longer period of time. In addition, a trigger line is calculated, which consists of another moving average of the MACD line.
The MACD line is the difference between the fast and slow moving average.
The greater the difference between the two lines, the more likely a subsequent price increase. The lower the difference, the more likely a subsequent price drop is.
If the MACD line crosses upwards over the trigger line, this is a buy signal that signals a potential price increase. If the MACD line crosses down below the trigger line, this is a sell signal that signals a potential price weakening.
This strategy is applicable to all timeframes and the relevant parameters for the underlying indicators (RSI and MACD) can be adjusted and optimized as needed.
Backtesting
Backtesting give outstanding results on all timeframes and drawdowns can be reduced to a minimum level. Swing-Traders (daily charts) will see that the strategy does not give any buy signals during market corrections and bear markets.
Settings for backtesting are:
- Period from Jan 2000 until now
- Starting capital 100k USD
- Position size = 25% of equity
- 0.01% commission = USD 2.50.- per Trade
Other comments
• This strategy has been designed to identify the most promising, highest probability entries and trades for each stock or other financial security.
• The trend-template qualifier is highly selective and filters out the most promising swing-trading entries. As a result, you will normally only find a single-digit number of trades for each stock or other financial security per year in case you apply this strategy for the daily charts. Shorter timeframes will result in a higher number of trades / year.
• As a result, traders need to apply this strategy for a full watchlist rather than just one financial security.

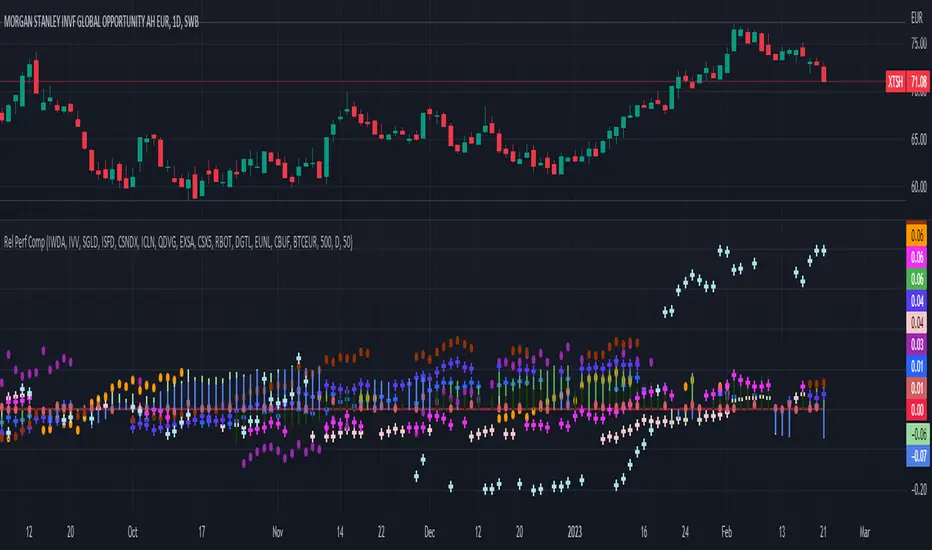
Relative Performance Comparison among different sectorsThis script shows how money is moving among different sectors using relative-strength of the corresponding sector-specific largest ETFs against MSCI World. Trend and current value of Relative-strength can be used to determine the sector in which you should make your investment at this point, considering the movement in markets.
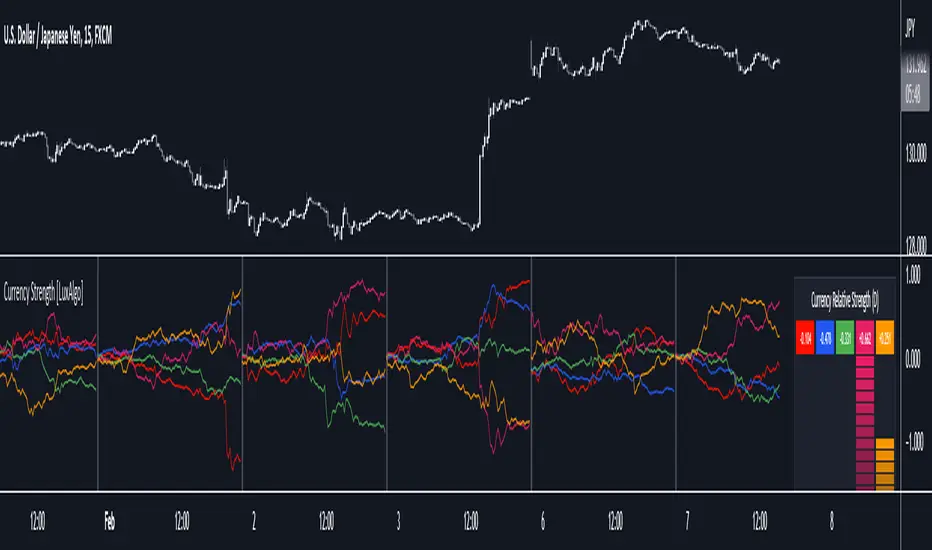
Currency Strength [LuxAlgo]The Currency Strength indicator displays the historical relative strength of 5 user selected currencies over a user selected period of time. Users can also display relative strength of currencies as a scatter plot, further informing on the evolution of currency strength.
🔶 SETTINGS
Display: Determines the type of data displayed by the indicator. By default, the trailing relative strength of currencies is displayed, with the other option displaying the scatter plot.
Timeframe: Timeframe period used to calculate currency relative strength.
🔹 Meter
Show Strength Meter: Displays the currency strength meter on the indicator panel.
Strength Meter Resolution: Resolution of the currency strength meter, higher resolutions allow to observe smaller difference in strength.
Location: Location of the currency strength meter on the indicator pane.
Size: Size of the currency strength meter.
🔹 Relative Strength Scatter Graph
Scatter Graph Resolution: Horizontal and vertical width of the scatter plot (in bars). Higher values allow a more precise position on the X axis.
🔶 USAGE
Measuring the relative strength of a currency allows users to assess the relative performance of a currency against a basket of other currencies.
The term "strength" can convey various interpretations depending on the indicator. Here "strength" is interpreted as an indicator of performance, with stronger currencies having greater performances over the selected period (positive changes of higher magnitude).
The Currency Strength indicator allows users to analyze the relative strength of currencies over a user selected period - the returned results will reset periodically and will accumulate afterward.
The above chart shows the hourly relative strength of various currencies on the 1min TF.
🔹 Scatter Graph
The scatter graph displays the relative strength of a currency over its value during the previous period. This not only allows users to see if a currency is strong... but also if it's getting stronger compared to the previous period.
In order to quickly interpret results, the graph is divided into four areas. A currency (displayed as a point) being in a specific area returns the following information:
Strong(Green): Currency has a positive relative strength (bullish) and is greater than its value over the previous period.
Improving (Yellow): Currency has a negative relative strength (bearish) and is greater than its value over the previous period.
Weakening (Aqua): Currency has a positive relative strength (bullish) and is lower than its value over the previous period.
Weak (Red): Currency has a negative relative strength (bearish) and is lower than its value over the previous period.
🔶 DETAILS
There is a wide variety of methods for the calculation of a currency's relative strength. The primary focus of the indicator is on the meter as well as the relative strength scatter graph. The currency strength calculation can be considered more basic.
Given two currencies, B (base) and Q (quote), the proposed indicator calculation process is as follows:
Exchange rate BQ(t) over time t is obtained, a rising value of BQ(t) means that a unit of B is now worth a higher amount of Q , highlighting strength of B over Q on that precise variation.
The individual relative strength over time IRS(t) is obtained as the percentage relatively close to the open difference of BQ(t) , that is:
IRS(t) = / open(t) * 100
Normalizing the close to open difference allows for the various currencies' relative strengths to approximately share the same scale.
The above operation is performed n times over a space of n currencies O( n ) . The obtained individual relative strengths for one specific currency are then added together, forming the final composite relative strength ( CRS ) of that currency:
CRS (t) = IRS (t) + IRS (t) + ... + IRS (t)
The cumulative sum of CRS(t) over the user selected period is then obtained.
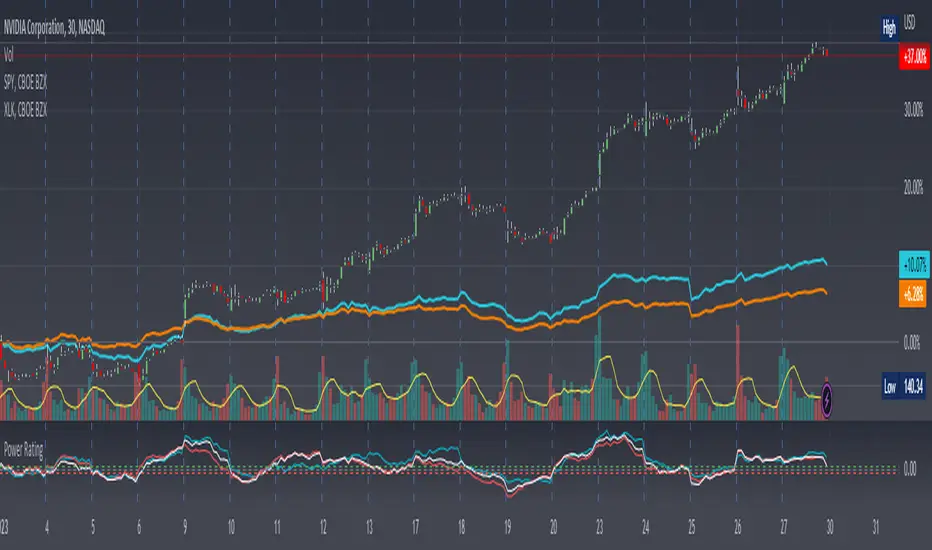
Stock Relative Strength Power IndexAs always, this is not financial advice and use at your own risk. Trading is risky and can cost you significant sums of money if you are not careful. Make sure you always have a proper entry and exit plan that includes defining your risk before you enter a trade.
This idea recently came out of some discussions I stumbled across in a trading group I am a part of regarding Relative Strength and Relative Weakness (shortened to RS and RW from here on out). The whole mechanism behind this trading system is to filter out underperforming securities relative to the current market direction to be in only the strongest or weakest stocks when the market is currently experiencing a bullish or bearish cycle. The idea behind this is there is no point in parking your money into a stock that is treading water or even going down if the market is making strong moves upwards. At that point, you are at worst losing money, and at best trading equal to the index/ETF, in which case the argument is why are you not just trading the index/ETF instead? RS or RW will filter out these sector laggards and allow you to position yourself into strong (or the strongest) stocks at any given time to help improve portfolio performance. Further, not only does it protect your position should the market shift against you briefly, it also often sees exceptional performance in the same cycle. For example, if $SPY makes a 5% move over the course of a month, a stock with RS/RW may make a 10% move, or more, allowing you to see increased profit potential.
RS/RW is based on the idea of performance, that is the raw percent change of a security over a given time period relative to a benchmark. This benchmark is often the S&P500 (ES/SPX/SPY and their derivatives). I have to stress that this is not beta, which measures the volatility of a stock over a given period (i.e. if $SPY moves $1, $NVDA will often move $1.74). This is a measurement of the market (i.e. $SPY) has moved 1% over the course of a day, $NVDA has moved 8% over the course of the day. This is very often used as a signal of institutional interest as apart from some very unique moments, retail traders cannot and will not provide enough market pressure to move a market outside of a stock's normal trading range, nor will they outperform the sector or market as a whole consistently over time without some big money to make them move. The problem with running strict performance analysis (i.e. % change from period T ago to period T + n at present) is that while it gives us a baseline of how much the stock has moved, it doesn't overall mean much. For instance, if a $100 stock has moved 5% today, but has been experiencing a period of increased volatility and it's Average True Range (ATR) (the amount a stock will move over X number of periods, on average) is $7, performance seems impressive but is actually generally fairly weak to what the stock has been doing recently. Conversely, if we take a second stock, this time worth $20, and it too has moved 5% in one day but has an ATR of only $0.25, that stock has made an exceptional move and we want to be part of that.
Here, I have created an indicator called the Stock Relative Strength Power Index. This takes the stock's rate of change (ROC) (the % move it has made over X number of periods), the stock's normalized ATR (the ATR represented as a percentage instead of a raw value), and compares these to one another to get the "Power Rating": a representation of the true strength of a stock over X number of periods. The indicator does two things. First, the raw ROC is divided by the stock's normalized ATR to assess whether the stock is moving outside of its normal range of variation or not. Second, since we are interested in trading only stocks with exceptional RS/RW to the market, I have also applied this same calculation to the S&P500 ($SPY) and the various SPDR sector indexes. These comparisons allow for a rapid and accurate assessment of the true strength of a stock at any given time on any given time frame. To cycle back above to our examples, the $100 stock has a Power Rating of only 0.71 (i.e. it is trading less than its current average), while our $20 stock has a Power Rating of 5. If we then compare these to both the market as a whole and the sector that the stock is a part of, we get a much clearer indication of the true buying or selling pressure imposed on the stock at any given time.
Use:
The indicator has 3 lines. The blue line is the security of interest, the red line is the market baseline (i.e. the sector ETF $SPY), and the white line is the sector index. I have given an example above on the semiconductor/tech stock $NVDA on a 30min timeframe. You can see that since the start of 2023, $NVDA has generally been strong to the market and its own sector since the blue line is greater than both the red and white lines over many days. This would have provided some nice day trading opportunities, or even some nice short term swing trades. The values themselves are generally meaningless outside of either the 1 or -1 value lines. All that matters is that the current ticker is surpassing both the market and the sector while being > 1.0 for a long trade or less than -1.0 for a short trade. However, I must stress this indicator gives no trade signals on its own, it is purely a confirmation indicator. An example of a trade would be if you had a trade signal given by either an indicator or by price action suggesting to buy some $NVDA for a trade to the upside, the Power Rating indicator would confirm this by showing if $NVDA was actually showing true strength by being both greater than 1 (the cutoff for it surpassing its ATR) and being above both the red and white lines. Further, you can see $NVDA has been stronger than the market when using the comparison function as well, but the has fluxed in and out of strength intraday when using the actual indicator vs. the static performance ratio chart (plotted as line graphs on the chart).
I have made it possible to change the colour of the plots and the line levels. The adjustment of the line levels gives the trader the flexibility to change their target breakout level (i.e. only trading stocks that have a Power Rating > 2, for example, meaning they are trading at least 2X their normal trading range). The third security comparison is flexible and can be used to compare to the sector ETF (initial intention) or it can be used to compare to other tickers within the same sector, for example. The trader should select the appropriate ETF for the given security of interest to avoid false confirmation if they want to use an ETF as their third input. The proper sector should be readily available on most online websites and accessible in a matter of seconds meaning that the delay is minimal, at worst. If a trader wishes to add additional functionality, such as a crypto trader using BTCUSD as the benchmark instead of $SPY, I encourage them to copy and paste this script and modify as needed since I have made this open source.
This indicator works on all timeframes. The lookback period can be changed, so a day trader who may use a 5min chart (and use a period of 12 to get the hourly Power Rating) will find this equally useful as someone who may be a core trader who wants to look at the performance over the course of years and may use a 60 period on a monthly chart.
Happy trading and I hope this helps!
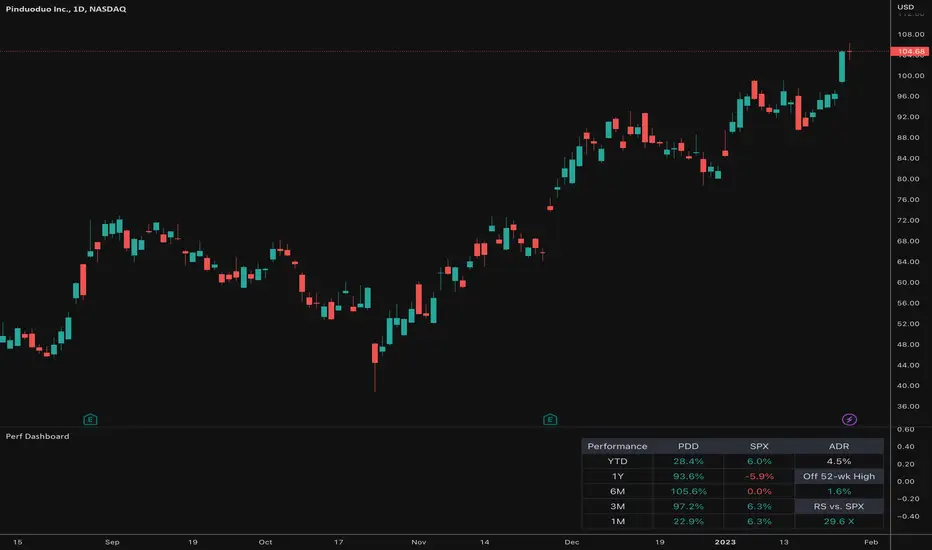
Relative Performance Dashboard v. 2This is a smaller and cleaner version of my previous Relative Performance table. It looks at the rate of change over 1M, 3M, 6M, 1YR & YTD and displays those for the current chart's ticker vs. an index/ticker of your choosing (SPX is default). I also have some fields for the ADR of the displayed chart, how far away the displayed chart is from 52-week highs, and a single number that compares the average relative strength of the displayed chart vs. the index. The way this average calculates is customizable by the user.
I like using this table next to an Earnings/Sales/Volume table that already exists by another user in the same pane and I designed this one so it can look just like that one to give a great view of the both fundamental and technical strength of your ticker in the same pane.
Keeping fundamental data independent from performance data allows you to still be able to see performance on things without fundamental data (i.e. ETFs, Indices, Crypto, etc.) as any script that uses fundamental data will not display when a chart that does not have fundamental data is displayed.
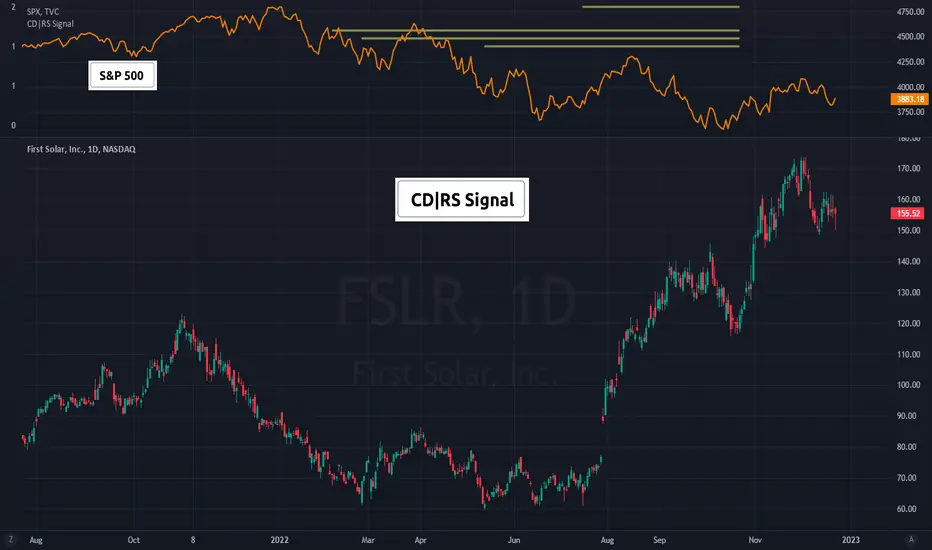
(CD|RS Signal) Caruso Divergence Relative Strength SignalCD|RS Signal allows for plotting horizontal bars to isolate periods where a security is forming a positive divergence from its benchmark, therefore, producing positive Relative strength when accounting for the security's volatility.
Investors can set how many 'pivots' or lows back to use when making an analysis. CD|RS Signal has an algorithm to identify pats market lows and automatically line them up with a stock's low around the same period of time. This allows for divergence analysis across many past lows and helps to isolate positive price divergences that are not so clear in choppy sideways trading action. CD|RS Signal helps an investor to identify when a security does not make a lower low vs a benchmark that has made a lower low over a similar period.
To help visualize the meaning behind the indicator, CD|RS Signal can be plotted in a separate pane, ideally over the benchmark itself. Traditionally the S&P500 is used for US stock analysis. By overlaying CD|RS Signal over the S&P 500, investors can more easily view which S&P 500 lows the stock is currently showing a positive divergence with.
This indicator allows you to select both your benchmark for comparing against as investors may prefer a commodity crypto currency or another stock. As well, users cans elect as far back to make the analysis by selecting the pivot lookback (how many prior ‘pivots’ or ‘market lows’ back to compare against).
In addition, to perform the historical study, investors can turn on historical HLs in the settings enabling all past CD|RS signals to show. This helps an investor to visualize how this has functioned on a security in the past.
(CA|RS Signal) Caruso Adaptive Relative Strength Signal CA|RS Signal is a new approach to relative strength analysis that incorporates a security’s volatility and correlation to a benchmark when performing RS analysis. Traditional RS methods compare the performance between two securities to identify which is outperforming on a percentage basis. although this is effective in many situations, some stocks are inherently less volatile and will not outperform a benchmark on a percentage basis. Accounting for a security's volatility and correlation to its benchmark through BETA allows for a more effective method to conduct RS analysis.
In order to build a tool that provides a robust signal, CA|RS Signal is a composite of RS from different time frames. The strongest trends have a security displaying RS across all timeframes measured. CA|RS Signal displays whether RS is identified along with how many internal components are currently identifying RS. This is helpful as a trend may progress from 3 components identifying RS down to only one as it wekas - providing early warning to an investor that RS is present but deteriorating.
CA|RS Signal is also adaptable to any time frame.
CA|RS Signal allows an investor to select which security will act as a benchmark. Traditionally, the S&P 500 is the benchmark for US stocks. International investors can select their local index of choice. Not equity investors can select a commodity, crypto token, or FX basket to get a different RS analysis.
