Margyntrade Indicator V2.5Margyntrade is an automatic support-resistance indicator. Calculations are instantaneous and do not reflect past candlesticks. A separate support-resistance point is determined for each currency pair.Chỉ báo Pine Script®của Margyntrade11
Dynamic Support & Resistance V6The Dynamic Support & Resistance V6 is a lightweight, high-performance indicator designed to automatically identify and plot key market levels based on pivot price action. Instead of static lines, this script uses a dynamic array-based system. It tracks the most recent significant levels where price is likely to react. The script utilizes the ta.pivothigh and ta.pivotlow functions to detect structural turning points. Once a pivot is confirmed (based on your chosen lookback period). Draws an Extended Level: A line is projected from the pivot point to the current bar. Dynamic Management: It uses a FIFO (First-In-First-Out) logic to ensure only the most relevant maxLevels are displayed on your chart, keeping your workspace clean. Real-time Updates: Lines and labels automatically shift with each new bar to maintain a constant "right-edge" perspective. Key Features Customizable Pivot Lookback: Adjust the sensitivity to find minor intraday levels or major swing levels. Visual Price Labels: Optional price tags for quick reference on key zones. Support/Resistance Differentiation: Color-coded levels (defaulting to Green for Support and Red for Resistance). Optimized for Version 6: Built using the latest Pine Script™ v6 standards for better performance. How to Use Look for candles closing beyond the Resistance (Red) or Support (Green) lines. Use these levels as potential zones for "fakeouts" or rejections in confluence with your other entry triggers. Excellent for identifying logical Take Profit (TP) or Stop Loss (SL) zones based on recent market structure. Chỉ báo Pine Script®của gradsgold78
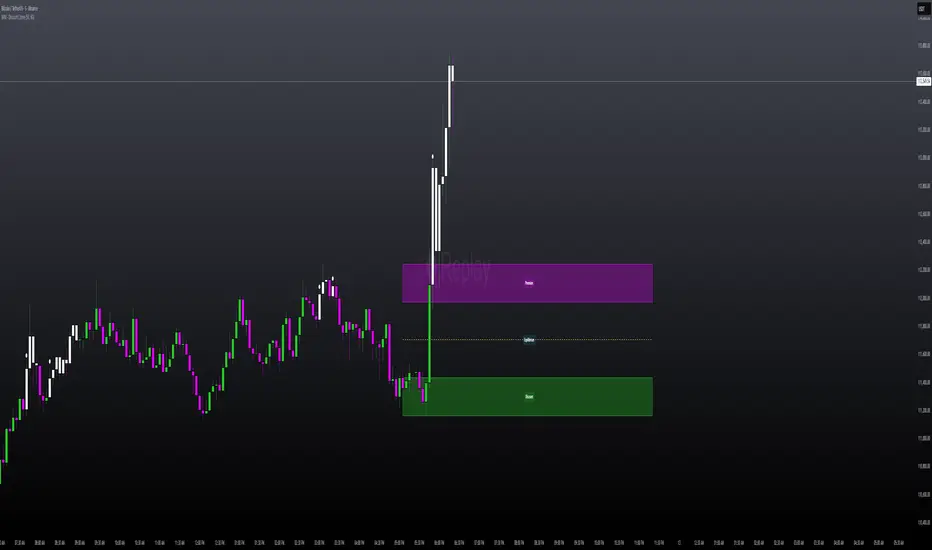
Reverse/Bounce LiteReverse/Bounce Indicator Lite (EN) Indicator shows expected price rebound/reverse positions. Calculations starts at first tick of every new bar/candlestick. In settings you can set range for calculations, text on label, label color and text color. Alerts working only on 15M timeframe or less. Feel free to contact me and leave comments when you have questions or suggestions. (RU) Индикатор показывает ожидаемые места отскока/разворота цены. Расчеты начинаются с первого тика каждой новой свечи/бара. В настройках вы можете задать диапазон для расчетов, текст на метке, цвет метки и цвет текста. Оповещения работают только на таймфрейме 15 минут или меньше. По вопросам и предложениям обращайтесь пишите в личные сообщения или оставляйте комментарии. Chỉ báo Pine Script®của NG-Trade4
Support & Resistance Rejection LevelsSupport & Resistance Rejection Levels This indicator automatically identifies and draws key support and resistance levels based on multiple price rejections at swing highs and lows. Key Features: Detects levels where price has been rejected multiple times Highlights the most recent support and resistance levels with customizable colors Shows historical levels in a different style for context Displays rejection count on each level (e.g., "S: 3×" means 3 touches) Fully customizable appearance: colors, line styles, thickness, and opacity Adjustable filters: minimum rejections required and maximum levels displayed Settings: Adjust swing lookback period to control sensitivity Set zone threshold to group nearby price touches Filter weak levels by requiring minimum rejections Customize line and label appearance for easy visual identificationChỉ báo Pine Script®của jayburn018
Automated Support / Resistance LinesAutomatic Support & Resistance Levels This indicator automatically identifies and draws key support and resistance levels based on multiple price rejections at swing highs and lows. Key Features: Detects levels where price has been rejected multiple times Highlights the most recent support and resistance levels with customizable colors Shows historical levels in a different style for context Displays rejection count on each level (e.g., "S: 3×" means 3 touches) Fully customizable appearance: colors, line styles, thickness, and opacity Adjustable filters: minimum rejections required and maximum levels displayed Settings: Adjust swing lookback period to control sensitivity Set zone threshold to group nearby price touches Filter weak levels by requiring minimum rejections Customize line and label appearance for easy visual identificationChỉ báo Pine Script®của jayburn01Cập nhật 16
Pivot Levels [BigBeluga]🔵 OVERVIEW The Pivot Levels indicator automatically detects and draws key market pivot levels across multiple sensitivity settings. Each pivot level represents a significant local high or low in price structure, acting as potential zones of support and resistance. Traders can visualize short-, medium-, and long-term pivot layers simultaneously, helping to identify where price may react, reverse, or break out. 🔵 CONCEPTS Different pivot lengths provide multi-length sensitivity on the same timeframe — shorter lengths detect local micro-swings, while longer lengths capture broader swing structure within the current chart. ATR-based color logic marks active, bullish, or bearish pivot zones dynamically. Lines can extend to the right or both sides to track reactions over time. 🔵 FEATURES Detects up to four custom pivot levels simultaneously. Each pivot level has independent settings for length , style , and extension mode . Auto-colors each pivot as support (green), resistance (orange), or active zone (blue). Displays dual-width line layers: a solid base and a transparent overlay for visual depth. Dynamic price labels show exact pivot levels for clarity. Fully customizable line styles: dashed (--), solid (-), or dotted (..). Extends lines to the right for future reaction tracking or both directions for structure alignment. 🔵 HOW TO USE Enable or disable pivot levels (1–4) to control how many layers of structure you want visible. Use shorter pivot lengths for intraday turning points and longer ones for macro structure. Watch for multiple pivot lines clustering in the same region — these often mark strong reversal zones. Observe color changes: green = support, orange = resistance, blue = active neutral zone. Combine with price action or volume analysis to confirm reactions near major pivots. 🔵 CONCLUSION The Pivot Levels indicator provides a clean, multi-layered visualization of market structure. By tracking pivots of varying lengths, traders can easily identify overlapping support and resistance regions, gauge breakout strength, and align trades with the dominant structural zones visible across multiple time horizons. Chỉ báo Pine Script®của BigBelugaCập nhật 1111 3.5 K
Confirmed Pivots + MACD Signals (with BOS Lines)Confirmed Pivots + MACD Signals This indicator combines confirmed swing highs/lows (pivots) with MACD-based momentum signals to highlight key reversal and continuation points on the chart. Core Logic Confirmed Pivots: The script identifies swing highs and lows using the user-defined pivot confirmation length. Once a structure is broken beyond the last pivot, that level becomes a confirmed support (CL) or resistance (CH) line. These levels are plotted as dashed horizontal rays and labeled directly on the chart. MACD Integration: The classic MACD crossover/under logic is used: Bullish Crossover: MACD line crosses above the Signal line. Bearish Crossunder: MACD line crosses below the Signal line. Signal Filtering by Proximity: A Proximity Zone (%) defines how close price must be to an active support or resistance to trigger a signal. Buy Signal: When price is within the support zone and a bullish MACD crossover occurs. Sell Signal: When price is within the resistance zone and a bearish MACD crossunder occurs. Inputs Pivot Confirmation Length: Bars used to confirm swing points. MACD Fast/Slow/Signal Lengths: Standard MACD settings. Proximity Zone (%): Defines zone width (e.g., 1% around active level). Output Labels: "CH" (Confirmed High) and "CL" (Confirmed Low) with color-coded dashed lines. Signals: "BUY" and "SELL" markers appear when both pivot and MACD conditions align. Tips Works best on higher timeframes (H1 and above). Combine with price action or trend filters for confirmation. Use proximity percentage according to volatility (e.g., smaller % for low-vol assets). ⚠️ Disclaimer: This script is provided for educational and informational purposes only. It does not constitute financial or investment advice, and the author is not responsible for any financial losses that may occur from its use. Always perform your own analysis and use this indicator together with other technical and risk management tools before making trading decisions. --------------------------------------------------------------------------------------------- سقف و کف تاییدشده + سیگنالهای MACD این اندیکاتور ترکیبی از شناسایی سقفها و کفهای تاییدشده (Pivot High/Low) به همراه سیگنالهای مومنتوم MACD است که نقاط برگشت یا ادامهی روند را روی چارت مشخص میکند. 🔹 منطق عملکرد تایید سقف و کفها: ابتدا سقف و کفهای محلی بر اساس تعداد کندلهای تنظیمشده شناسایی میشوند. وقتی ساختار قیمتی از آخرین سقف یا کف عبور کند، آن سطح به عنوان حمایت یا مقاومت تاییدشده در نظر گرفته شده و با برچسبهای “CL” (کف تاییدشده) و “CH” (سقف تاییدشده) و خطوط نقطهچین رسم میشود. ادغام با MACD: از منطق کلاسیک کراساور/کراسآندر MACD استفاده شده است: کراس صعودی: عبور خط MACD از بالای خط سیگنال. کراس نزولی: عبور خط MACD از زیر خط سیگنال. فیلتر سیگنال با ناحیه مجاور: با استفاده از درصد ناحیه مجاور (Proximity Zone %)، فقط زمانی سیگنال صادر میشود که قیمت نزدیک حمایت یا مقاومت فعال باشد. سیگنال خرید: وقتی قیمت در ناحیهی حمایت و همزمان MACD صعودی شود. سیگنال فروش: وقتی قیمت در ناحیهی مقاومت و همزمان MACD نزولی شود. تنظیمات ورودی طول تأیید پیوتها تنظیمات MACD (Fast, Slow, Signal) درصد ناحیه مجاور برای فعال شدن سیگنالها خروجیها برچسبهای “CL” و “CH” برای سطوح تاییدشده نشانگرهای “BUY” و “SELL” در محل صدور سیگنال نکات کاربردی بهترین عملکرد در تایمفریمهای بالاتر (۱ ساعته به بالا) برای دقت بیشتر، آن را با فیلتر روند یا پرایساکشن ترکیب کنید درصد ناحیه مجاور را با توجه به نوسانات دارایی تنظیم کنیدChỉ báo Pine Script®của farcominvestment158
MILLION MEN - Discount Zone BreakoutsWhat it is MILLION MEN — Discount Zone Breakouts (Lite & Stable) highlights a structure-based trading range from the latest confirmed swing high/low, renders Premium/Equilibrium/Discount zones, and raises one-shot breakout signals when price closes outside the range. It focuses on stable visuals and simple breakout logic suitable for intraday and swing trading. How it works (high-level) Confirmed swings: Uses ta.pivothigh/ta.pivotlow with auto or manual pivot length. Range & zones: From the swing range, the tool derives Premium (top 25%), Equilibrium (50%), and Discount (bottom 25%). Anchoring: Left edge is locked at the bar where the pivot confirms; the right edge can extend N bars. One-shot breakouts: Up breakout: first close > swingHigh (resets on new range). Down breakout: first close < swingLow (resets on new range). Optional on-close only mode to avoid intrabar noise. Clean UI: Optional zone boxes, dashed equilibrium line, mid-labels (“Premium / Equilibrium / Discount”), and minimal candle coloring by regime. How to use Treat Discount as value area in bullish contexts and Premium as distribution area in bearish contexts. Breakout dots (up/down) mark regime shifts beyond the current range; confirm with your higher-TF bias, volume, or momentum. Tune pivot length and forward extension to your timeframe (e.g., smaller for scalping, larger for swings). Originality & value Unlike generic S/R overlays, this lite tool prioritizes confirmed swing structure with a fixed anchor, clear 25/50/75 zone mapping, and one-shot breakout logic to prevent repetitive signals until a new range forms. The emphasis is on stability + readability, making it a dependable building block in multi-indicator workflows. Limitations & transparency Breakouts on strong trends can retest or fail; always add confirmation (structure/volume). Pivots confirm with delay equal to pivot length—this reduces repaint and is intentional. Non-standard bar types are not supported for signal logic. This indicator provides analysis, not financial advice. Arabic يعرض السكربت آخر مدى مؤكد من قمّة/قاع ويرسم مناطق Premium / Equilibrium / Discount، ويعطي إشارة اختراق لمرة واحدة عند إغلاق السعر فوق القمّة أو تحت القاع. الفكرة بسيطة وثابتة بصريًا، وتصلح للإنترادي والسوينغ. يُفضّل تأكيد الاختراق بهيكل أعلى إطار أو فوليوم/مومنتُم. تذكير: تأكيد القمم/القيعان متأخر بحسب طول البيفوت لتفادي إعادة الرسم.Chỉ báo Pine Script®của MILLION_MEN65
Round Number Levels ProRound Number Levels Pro is a powerful support and resistance indicator that automatically plots psychological price levels on your chart. What it does: - Displays major round number levels (100, 200, 300, etc.) with prominent lines - Shows mid-level lines (50, 150, 250, etc.) for additional reference points - All lines extend across the entire chart for maximum visibility - Automatically adjusts levels based on current price action Key Features: - Customizable Font Sizes - Large text for main levels, normal for mid-levels - Clean Black Styling - Professional appearance that works on any chart background - Flexible Line Styles - Choose solid, dashed, or dotted lines for main and mid levels - Adjustable Parameters - Control number of levels, rounding increments, and label positioning - Full Chart Extension - Lines extend both directions for complete price reference Perfect for: - Day traders looking for key psychological support/resistance levels - Swing traders identifying major price zones - Any trader who uses round numbers as decision points How to use: Simply add to your chart and the indicator will automatically plot relevant round number levels. Customize the settings to match your trading style and timeframe. These psychological levels are where many traders make decisions, often creating natural support and resistance zones in the market.Chỉ báo Pine Script®của TurzalukCập nhật 146
Major Support and Resistance Price LevelsThis indicator is to be used to automatically plot Major Support and Resistance Price Levels. This is not a TREND support/resistance identifier. This is strictly for auto-plotting historically important price levels. I would suggest adjusting the support/resistance filter before adjusting the sensistivity levels as I've testing out the setting quite a bit, but as always, do what works best for your chart. If there is an input that you would like to have me add, let me know and I'll see what I can do. Things to Consider: Currently this works best on the 4H through 3D chart for Identifying major price levels; however lower timeframes do still work. Because of the large swings that can be typical when coming from Afterhours trading into Market hours, timeframes under 2H can create some false positives. This is obviously not as much of an issue on crypto or forex. I will be working on allowing lower or higher timeframes with this indicator in order to circumvent the need to jump back to other timeframes and reference them if they are under that 2h threshold. Future Updates: Plotting different timeframe's results on a lower or higher timeframe. Chỉ báo Pine Script®của ILikuhTheTradeCập nhật 76
Price Close ProbabilityThe Price Close Probability Indicator is designed to help traders estimate the likelihood of price closing above or below specified levels within a given bar. By placing two levels on your chart, you can quickly gauge the probability of the current price bar closing above or below these levels in real-time. Key Features: Dynamic Probability Calculation: The indicator continuously updates the probability of price closing above or below your set levels as the current bar progresses, providing you with timely insights as the bar approaches its close. Customizable Standard Deviation : Adjust the length of the Standard Deviation used in the calculations to tailor the probability estimates to your preferred settings. User-Friendly Probability Table : A clean, easy-to-read table displays the calculated probabilities, helping you make informed trading decisions at a glance. Assumptions and Considerations: While the indicator assumes that returns are normally distributed, which may not fully reflect reality, it still offers a valuable approximation of the probabilities for price movement within the current bar. Future Enhancements (Coming Soon): Multi-Bar Probability: Calculate probabilities across multiple bars to enhance your forecasting capabilities. Additional Levels: Set more than two levels for a broader analysis of price movements. Refined Distribution Modeling: Improve the accuracy of probability calculations by adjusting for more realistic return distributions. Disclaimer Please remember that past performance may not be indicative of future results. Due to various factors, including changing market conditions, the strategy may no longer perform as well as in historical backtesting. This post and the script don’t provide any financial advice.Chỉ báo Pine Script®của QuantNomad657
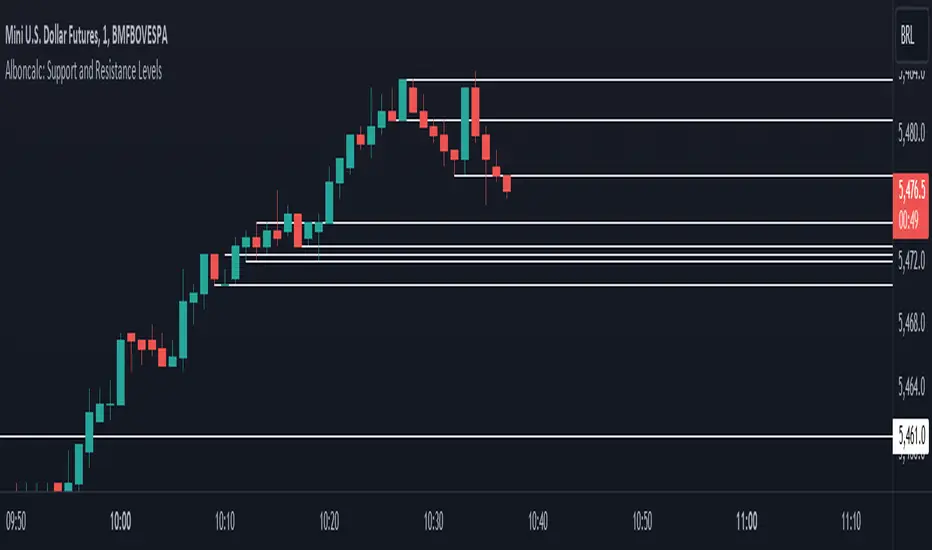
Alboncalc: Support and Resistance LevelsAlboncalc: Support and Resistance Levels Description: Alboncalc is an innovative TradingView indicator that identifies significant support and resistance levels based on patterns where two candles form equal highs and/or lows. This indicator automatically plots these critical levels on the chart, providing traders with clear visual cues of potential price reversal or consolidation points. Originality and Usefulness: Alboncalc stands out for its ability to detect specific candle patterns that indicate support and resistance, setting it apart from traditional support and resistance indicators. This specific method of price action analysis offers a unique and refined perspective for traders, adding value to the body of knowledge within the TradingView community. How It Works: Alboncalc analyzes historical prices to identify where two consecutive candles achieve equal highs or lows. When these conditions are met, the indicator automatically plots a support or resistance line on the chart. These levels are dynamically updated, ensuring that traders always have the most relevant and accurate information. How to Use: Installation: Add Alboncalc to your chart on TradingView. Interpretation: Observe the plotted support and resistance lines. These lines indicate potential reversal or consolidation points. Application: Use these levels to confirm breakout points or identify areas of price exhaustion. The clear visualization of technical levels helps enhance your trading strategies. Underlying Concepts: Alboncalc is based on price action analysis, focusing on specific candle patterns that signal important technical levels. The formation of two candles with equal highs or lows indicates a temporary balance between buyers and sellers, suggesting potential price direction changes.Chỉ báo Pine Script®của Alexandre_Saldanha_11112
Malaysian SnR LevelsThis indicator can be used to display support and resistance levels in accordance with Malaysian SnR , in which Support and Resistance are not areas in a chart but clear levels of a line chart. The term line chart refers the current chart in Tradingview as type Line (not Candles) with it's peaks and valleys. There are 3 different horizontal levels in Malaysian SnR: A-Level: This level is located at the peak of this line chart. It is named so because this peak has the shape of the letter A. V-Level: Level at the valley of a line chart, which reminds of the letter V. The A- and V-Levels are formed for the current chart / timeframe and you can define with the parameter Bars Lookback how many candles will be taken into account for adding the levels. Gap level: This level is located at the Close/Open gap between two candles of the same color. The period for these levels is also defined by the option Bars Lookback . The levels are shown as horizontal lines and mark Support when they are below the current price and Resistance when they are above it. What makes the indicator so special is that conventional support and resistance indicators only use ranges, but Malaysian SnR uses clear and accurate levels at the peaks and valleys (and gaps), which can be of the state Fresh or Unfresh . But what does this state mean and how is it displayed in this indicator? A level is designated as fresh if it has either not yet been tested, i.e. it has not been touched by a wick. If a level was no longer fresh, it can become fresh again if it is crossed by the body of a candle. If it is then touched by a wick again afterwards, it is considered unfresh (tested) again. If a level is fresh, the theory of Malaysian SnR assumes that there is a greater probability that the price will react at that level and move in the opposite direction because this fresh Support / Resistance level is more significant than an unfresh level. The indicator is calculating this state and displays the levels then in a different way. Fresh levels are displayed as solid lines, unfresh levels are displayed as dashed lines. It is also possible to hide unfresh levels, so that only the fresh levels are visible in the chart. The Fresh -state of a level would be very hard to see without it the indicator: If the script would just display all the levels that can be found for the Bars Lookback period, the chart woulkd still be full of levels. To filter this and display the most relevant levels, you can use the options Levels above/below price (number of levels) so that only the levels are displayed that are the closest ones to the current price. Parameters of the indicator Line Color: Line color of the levels Line Width: Thickness of the levels Display gap levels: Should the Gap-Levels be displayed or not Display fresh levels only: Should unfresh / tested levels be hidden in the chart Bars Lookback: Number of bars lookback period at which levels will be added to the chart Levels Above Price: Number of levels that should be displayed above the price. It will be the closest levels to the price that can be found. Levels Below Price: Number of levels that should be displayed below the price. It will be the closest levels to the price that can be found. Timeframe Limit: Indicator will only be visible for this timeframe and above. How to trade with Malaysian SnR levels? One way to trade with these levels is for instance to wait on a higher timeframe like the Daily til price is reaching a fresh level. At this point a trader could switch to a lower timeframe to check if price is reacting at this level, which is when price is moving into the opposite direction. So reaching a level of Support and then see price moving to the upside on a lower timeframe can be used as a buy signal - on the other hand if price is reaching a level of Resistance and then moving away from it to the downside on a lower timeframe, this can be used as a sell signal.Chỉ báo Pine Script®của trading-guideCập nhật 173173 2 K
Targets For Many Indicators [LuxAlgo]The Targets For Many Indicators is a useful utility tool able to display targets for many built-in indicators as well as external indicators. Targets can be set for specific user-set conditions between two series of values, with the script being able to display targets for two different user-set conditions. Alerts are included for the occurrence of a new target as well as for reached targets. 🔶 USAGE Targets can help users determine the price limit where the price might start deviating from an indication given by one or multiple indicators. In the context of trading, targets can help secure profits/reduce losses of a trade, as such this tool can be useful to evaluate/determine user take profits/stop losses. Due to these essentially being horizontal levels, they can also serve as potential support/resistances, with breakouts potentially confirming new trends. In the above example, we set targets 3 ATR's away from the closing price when the price crosses over the script built-in SuperTrend indicator using ATR period 10 and factor 3. Using "Long Position Target" allows setting a target above the price, disabling this setting will place targets below the price. Users might be interested in obtaining new targets once one is reached, this can be done by enabling "New Target When Reached" in the target logic setting section, resulting in more frequent targets. Lastly, users can restrict new target creation until current ones are reached. This can result in fewer and longer-term targets, with a higher reach rate. 🔹 Dashboard A dashboard is displayed on the top right of the chart, displaying the amount, reach rate of targets 1/2, and total amount. This dashboard can be useful to evaluate the selected target distances relative to the selected conditions, with a higher reach rate suggesting the distance of the targets from the price allows them to be reached. 🔶 DETAILS 🔹 Indicators Besides 'External' sources, each source can be set at 1 of the following Build-In Indicators : ACCDIST : Accumulation/distribution index ATR : Average True Range BB (Middle, Upper or Lower): Bollinger Bands CCI : Commodity Channel Index CMO : Chande Momentum Oscillator COG : Center Of Gravity DC (High, Mid or Low): Donchian Channels DEMA : Double Exponential Moving Average EMA : Exponentially weighted Moving Average HMA : Hull Moving Average III : Intraday Intensity Index KC (Middle, Upper or Lower): Keltner Channels LINREG : Linear regression curve MACD (macd, signal or histogram): Moving Average Convergence/Divergence MEDIAN : median of the series MFI : Money Flow Index MODE : the mode of the series MOM : Momentum NVI : Negative Volume Index OBV : On Balance Volume PVI : Positive Volume Index PVT : Price-Volume Trend RMA : Relative Moving Average ROC : Rate Of Change RSI : Relative Strength Index SMA : Simple Moving Average STOCH : Stochastic Supertrend TEMA : Triple EMA or Triple Exponential Moving Average VWAP : Volume Weighted Average Price VWMA : Volume-Weighted Moving Average WAD : Williams Accumulation/Distribution WMA : Weighted Moving Average WVAD : Williams Variable Accumulation/Distribution %R : Williams %R Each indicator is provided with a link to the Reference Manual or to the Build-In Indicators page. The latter contains more information about each indicator. Note that when "Show Source Values" is enabled, only values that can be logically found around the price will be shown. For example, Supertrend , SMA , EMA , BB , ... will be made visible. Values like RSI , OBV , %R , ... will not be visible since they will deviate too much from the price. 🔹 Interaction with settings This publication contains input fields, where you can enter the necessary inputs per indicator. Some indicators need only 1 value, others 2 or 3. When several input values are needed, you need to separate them with a comma. You can use 0 to 4 spaces between without a problem. Even an extra comma doesn't give issues. The red colored help text will guide you further along (Only when Target is enabled) Some examples that work without issues: Some examples that work with issues: As mentioned, the errors won't be visible when the concerning target is disabled 🔶 SETTINGS Show Target Labels: Display target labels on the chart. Candle Coloring: Apply candle coloring based on the most recent active target. Target 1 and Target 2 use the same settings below: Enable Target: Display the targets on the chart. Long Position Target: Display targets above the price a user selected condition is true. If disabled will display the targets below the price. New Target Condition: Conditional operator used to compare "Source A" and "Source B", options include CrossOver, CrossUnder, Cross, and Equal. 🔹 Sources Source A: Source A input series, can be an indicator or external source. External: External source if 'External" is selected in "Source A". Settings: Settings of the selected indicator in "Source A", entered settings of indicators requiring multiple ones must be comma separated, for example, "10, 3". Source B: Source B input series, can be an indicator or external source. External: External source if 'External" is selected in "Source B". Settings: Settings of the selected indicator in "Source B", entered settings of indicators requiring multiple ones must be comma separated, for example, "10, 3". Source B Value: User-defined numerical value if "value" is selected in "Source B". Show Source Values: Display "Source A" and "Source B" on the chart. 🔹 Logic Wait Until Reached: When enabled will not create a new target until an existing one is reached. New Target When Reached: Will create a new target when an existing one is reached. Evaluate Wicks: Will use high/low prices to determine if a target is reached. Unselecting this setting will use the closing price. Target Distance From Price: Controls the distance of a target from the price. Can be determined in currencies/points, percentages, ATR multiples, ticks, or using multiple of external values. External Distance Value: External distance value when "External Value" is selected in "Target Distance From Price".Chỉ báo Pine Script®của LuxAlgo1010 6.4 K
buy/sell signals with Support/Resistance (InvestYourAsset) 📣The present indicator is a MACD based buy/sell signals indicator with support and resistance, that can be used to identify potential buy and sell signals in a security's price. 📣It is based on the MACD (Moving Average Convergence Divergence) indicator, which is a momentum indicator that shows the relationship between two moving averages of a security's price. 📣 The indicator also plots support and resistance levels, which can be used to confirm buy and sell signals. The support and resistance can also be used as a stoploss for existing position. 👉 To use the indicator, simply add it to your trading chart. The indicator will plot three sections: 📈 Price and Signals: This section plots the security's price and the MACD buy and sell signals. 📈 MACD Oscillator: This section plots the MACD oscillator, which is a histogram that shows the difference between the two moving averages. 📈 Moving Averages: This section plots the two moving averages that the MACD oscillator is based on. 📈 Support and Resistance: This section plots support and resistance levels, which are calculated based on the security's recent price action. 👉 To identify buy and sell signals, you can look for the following: 📈 Buy signal: When shorter Moving Average crosses over longer Moving Average. 📈 Sell signal: When shorter moving average crosses under longer moving average. 📈 You can also look for divergences between the MACD oscillator and the security's price. A divergence occurs when the MACD oscillator is moving in one direction, but the security's price is moving in the opposite direction. Divergences can be a sign of a potential trend reversal. 👉 To confirm buy and sell signals, you can look for support and resistance levels take a look at below snapshot. If a buy signal occurs at a support level, it is a stronger signal than if it occurs at a random price level. Similarly, if a sell signal occurs at a resistance level, it is a stronger signal than if it occurs at a random price level. ⚡ Here is a example of how to use the indicator to identify buy signal: ☑ Add the indicator to your trading chart. ☑Look for a buy signal when short MA crosses over Long MA. ☑Look for the buy signal to occur at a support level. ☑Enter a long position at the next candle. ☑Place a stop loss order below the support level. ☑Take profit when the MACD line crosses below the signal line, or when the security reaches a resistance level. ⚡ Here is an example of how to use the indicator to identify a sell signal: ☑Add the indicator to your trading chart. ☑Look for a sell signal, when shorter moving average crosses under longer moving average. ☑Look for the sell signal to occur at a resistance level. ☑Enter a short position at the next candle. ☑Place a stop loss order above the resistance level. ☑Take profit when the MACD line crosses above the signal line, or when the security reaches a support level. ✅Things to consider while using the indicator: 📈Look for buy signals in an uptrend and sell signals in a downtrend. This will increase the likelihood of your trades being successful. 📈Place your stop losses below the previous swing low or support for buy signals and above the previous swing high or resistance for sell signals. This will help to limit your losses if the trade goes against you. 📈Consider taking profits at key resistance and support levels. This will help you to lock in your profits and avoid giving them back to the market. Follow us for timely updates regarding indicators that we may publish in future and give it a like if you appreciate the indicator.Chỉ báo Pine Script®của InvestyourAsset1010 3.6 K
Histogram-based price zonesThis indicator provides a new approach to creating price zones that can be used as support and resistance. The approach does not use pivot points or Fibonacci levels. Instead, it uses the frequency of occurence of local maxima and minima to determine zones of interest where price often changed direction. The algorithm is as follows: - Gather price data from the last Lookback trading periods - Calculate rolling minima and rolling maxima along the price points with window size Window size - Build a histogram from the rolling extrema which are binned into different zones. The number of bins and therefore the width of a zone can be adjusted with the parameter Zone width factor - Select only the top fullest bins. The number of bins selected for plotting can be controlled with Zone multiplier The result are a number of boxes that appear on the chart which mark levels of interest to watch for. You can combine multiple instances of this indicator on different settings to find zones that are very relevant. Shown as an example is the Nasdaq 100 futures ( NQ1! ) on the D timeframe with levels built from the last 100 periods with default settings. The boxes are the only output of the indicator, no signals are created.Chỉ báo Pine Script®của jhmnk8922237
Monthly Range Support & Resistance [QuantVue]The Monthly Range Support & Resistance Levels is an advanced analytical tool designed to assess monthly price movements and provide potential support and resistance levels. This tool examines the average monthly price fluctuations over the past 7 months (default), and creates support and resistance levels based on the opening price. The indicator also considers a standard deviation multiplier. This enables traders and investors to identify potential price zones. The support and resistance levels are dynamically updated every month. Users can also choose to view previous daily levels as well. Customizable settings for this tool include: -Averaging Period: Adjust the number of months to calculate the average monthly range. -Standard Deviation Multiplier: Modify the standard deviation multiplier to fine-tune the sensitivity of the support and resistance levels. A higher multiplier will result in wider levels, accommodating higher price fluctuations. -Toggle Support & Resistance Prices: Easily switch on or off the display of support and resistance price levels. -Show Monthly Open Line: Display the monthly opening price as a reference point on the chart. -Show Previous Levels: Choose whether to display past daily support and resistance levels. Note: this indicator works on a 1 hour timeframe or higher Give this indicator a BOOST and COMMENT your thoughts! We hope you enjoy. Cheers!Chỉ báo Pine Script®của QuantVue55342
Support/ResistanceUse this code to stop support and resistance This can be used with the momentum indicators that I have to see if we are likely to breakout or get rejected Indicator Settings: The indicator is titled "Support/Resistance | Breaks & Bounces" and is set to overlay on the price chart. max_lines_count is set to 500, indicating the maximum number of support/resistance lines that can be plotted. User Input: The script allows users to customize the pivot method, sensitivity, and line width through input variables. point_method determines whether the pivot calculation is based on "Candle Wicks" or "Candle Body". left_bars represents the number of bars to the left used to identify pivot highs/lows. right_bars is set equal to left_bars. line_width controls the width of the support/resistance lines. Global Variables and Arrays: The script declares several variables and arrays to store information related to support and resistance levels, breakouts, and bounces. high_source and low_source are calculated based on the selected pivot method. fixed_pivot_high and fixed_pivot_low store the pivot highs and lows using the chosen sensitivity. Variables and arrays are initialized for tracking support/resistance lines, breakout triggers, and bounce triggers. Main Operation: The main operation occurs when barstate.isconfirmed is true, indicating that a new bar has formed and its data is final. The script iterates through the support/resistance lines to update their end points (x2) to the current bar. For each support/resistance line, it checks if a breakout or bounce event has occurred based on the current and previous bar's price levels. If a breakout or bounce event is detected, the corresponding trigger variables (red_breakout_trigger, red_rejection_trigger, green_breakout_trigger, green_rejection_trigger) are set to true. The script also checks for changes in the pivot highs and lows and updates the support/resistance lines accordingly. If a change is detected, it clears the existing lines, breakout, and bounce arrays and adds new lines for the updated pivot levels.Chỉ báo Pine Script®của IkkeOmar55350
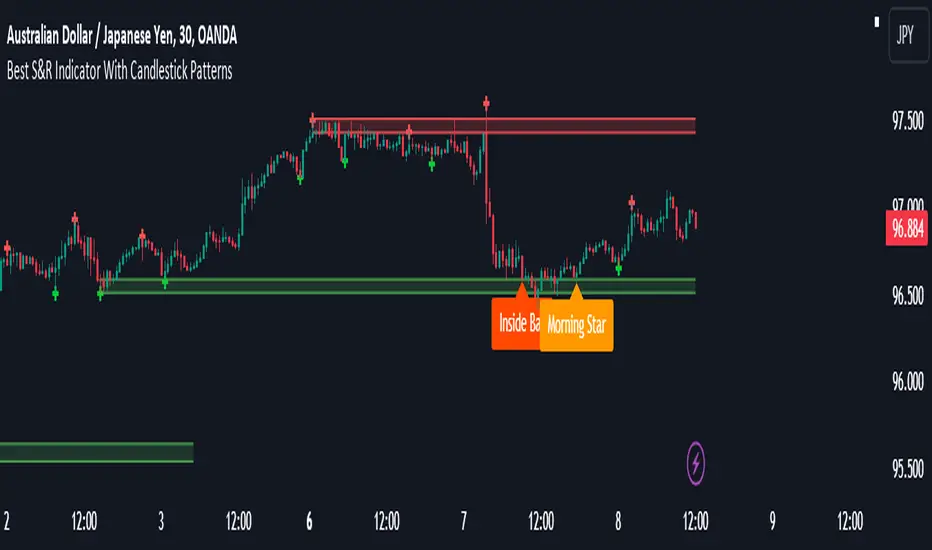
Best Support And Resistance Indicator V1 [ForexBee]This Indicator Identifies and draws the support and resistance Zones On the Chart 🔶Overview The support and resistance indicator is a technical indicator that will plot the support zone and resistance zone on the candlestick chart. It determines the price touches to find the strong support resistance zones. The support and resistance indicator is the most basic technical analysis in trading. Instead of drawing zones manually, this indicator can save you time by plotting zones automatically. 🔶Working There are specific characteristics of a valid support and resistance zone. Price always bounces upward from the support zone while it bounces downward from the resistance zone. On the other hand, when a breakout of the support or resistance zone happens, the price trends toward the breakout. 🔶Valid support zone When the price touches a zone two to three times and bounces in a bullish direction, it is a good support zone. The main point is that you should always find the bounces in clear price swings. The touches or bounces of the price must not be in the form of a choppy market. Price always moves in the form of swings or waves. 🔶Valid resistance zone When the price touches a zone two to three times with a bounce in a bearish direction, then a valid resistance zone forms. Here the price bounces must be in the form of swings or waves. You must avoid a choppy market. So the support and resistance zone indicator finds these parameters on the chart and draws only valid zones. 🔶Settings of indicator There are two inputs available in the indicator. Number of bars for swing The number of bars for the swing bars represents the size of the swing for a valid support or resistance touch. This parameter helps to filter the ranging price. the default value is 10. Number of Tests for valid support and resistance In this indicator, the number of pivots represents the support or resistance touches. so if you select the number 3, the indicator will only draw a zone with three touches. 🔶Features There are the following features that this indicator identifies automatically, so you don’t need to do manual work. Identify the valid support and resistance zones Add the confluence of swings or waves during zone identification Choppy market filter We are also adding the feature of a candlestick pattern at the zone, which will be added in the next update. Chỉ báo Pine Script®của ForexBeeCập nhật 1010 4 K
Weekly Range Support & Resistance Levels [QuantVue]Weekly Range Support & Resistance Levels Description: The Weekly Range Support & Resistance Levels analyzes weekly ranges and takes the average range of the last 30 weeks (default setting). It also takes the average +/- a standard deviation, and creates support & resistance levels/zones based on the weekly opening price. The levels will update each week, and previous weekly levels can be toggled on or off. Settings: 🔹Averaging Period 🔹Standard Deviation Multiplier 🔹Toggle Support & Resistance Prices 🔹Show Weekly Open Line 🔹Show Previous Levels Don't hesitate to reach out with any questions or concerns. We hope you enjoy! Cheers.Chỉ báo Pine Script®của QuantVueCập nhật 77604
Support Resistance Classification (VR) [LuxAlgo]The Support Resistance Classification (VR) indicator shows SR levels on any chart's visible range using higher time-frame data (HTF). Levels are classified 1 through 10 based on their strength, with lower values indicating stronger support/resistance levels. This indicator uses visible range functionality, whereas if you adjust your chart to show previous price data, the indicator may show new levels. 🔶 USAGE Certain indicators on higher timeframes can provide longer term support/resistance levels on lower timeframes. Users can use the provided levels on a chart visible range and use them as reference for future support/resistance levels. The classification algorithm measures the strength of a support/resistance level using the entire chart visible range and is in a range of 1 to 10, with higher values indicating a weaker support/resistance. Supports/resistances highlighted by the indicator can be used for future applications by marking them on the chart (quickly done with alt + h). 🔶 DETAILS All calculations are based on what you see on the Visible Chart, as such changing the chart will recalculate the indicator. Since only Swings which are not broken are included, every break would exclude that swing. Therefore, even when 'value' is chosen at Settings ('Value'), breaks are always calculated on the entire line. 🔶 SETTINGS Fade: After x breaks the line becomes invisible Value: value: • SMA, upper/lower: the breaks are triggered on the moving average itself • Fibonacci Pivot Point levels, Previous High, Previous Low: only last HTF values can be used for breaks • Swings (see SWING SETTINGS) line: • SMA, upper/lower: the breaks are triggered on the entire line, based on its latest value • Fibonacci Pivot Point Levels, Previous High, Previous Low: breaks are triggered on the entire line, based on its latest value • Swings (see SWING SETTINGS) 🔹 Swing Settings Swings are always calculated at current timeframe, setting a HTF is not applicable on Swings. Left/Right: for Swing calculation ( pivothigh , pivotlow ) Show: enables you to see the pivot points 🔹 Set N°: The concerning number TYPE: • SMA (Simple Moving Average) • Previous High/Low • Upper/Lower ( Bollinger Bands ) • Pivot Point levels : "Fibonacci" LENGTH: sets the 'Number of bars', needed for calculations (applicable for SMA, upper/lower) MULT: sets the 'Standard deviation factor' (only applicable for upper/lower - BB) HTF: sets 'Higher Time Frame' (applicable for SMA, upper/lower, Previous High/Low, Fibonacci) 🔹 Show Values You can make up to 5 values visible (if you want to check/verify), except for Swings (see SWING SETTINGS) To do so, enable (A -> E), and choose the N° you want to see. This also is a useful tool if you're not sure which value you want to set.Chỉ báo Pine Script®của LuxAlgo2020 5.4 K
Psychological levels (Bank levels) PsychoLevels v3 - TartigradiaPsychological levels (Bank levels) plots the closest "round" price levels above and below current price, based on neuroscience research of how humans intuitively calculate in logarithms. Psychological levels, also called bank levels, are "round" price numbers, by truncating after the nth leftmost digits, around which price often experience resistance or support, because traders and investors tend to set orders around these round numbers. The calculation done here is fully automatic and dynamic, contrary to other similar scripts, this one uses a mathematical calculation that extracts the 1, 2 or 3 leftmost digits and calculate the previous and next level by incrementing/decrementing these digits. This means it works for any symbol under any price range. This approach is based on neuroscience research, which found that human brains intuitively approximate numbers on a logarithmic scale, adults and children alike, and similarly to macaques, for more info see Numerical Cognition , Weber-Fechner Law , Zipf law . For example, if price is at 0.0421, the next major price level is 0.05 and medium one is 0.043. For another asset currently priced at 19354, the next and previous major price levels are 20000 and 10000 respectively, and the next/previous medium levels are 20000 and 19000, and the next/previous weak levels are 19400 and 19300. IMPORTANT: Please enable "Scale price chart only" in the chart's scale's options, as otherwise major levels may make the chart's scale very small and hard to read. How it works At any time, there are 3 levels of strength (1 leftmost digit, 2 leftmost digits, 3 leftmost digits) represented by different sizes, and 3 directional levels for each of these strengths (level above, level below, and half-level) represented by different colors and positions, around current price. Indeed, contrary to other similar price levels scripts, we do not plot ALL price levels at all times, because otherwise the chart becomes wayyy too cluttered, and also it's highly processing intensive to plot so many lines. So we here use a dynamical approach: we plot only the relevant levels, the closest ones according to current price. Hence, when a level disappears, it does not mean that it does not exist anymore, but simply that we are not drawing it right now because it is not pertinent for the current price movement (ie, too far away). Breakouts can be detected in two different ways depending on if SMA is set to a value higher than 1 or not: if SMA == 1, then there is no smoothing, so the levels adapt instantaneously to the current price, so to detect breakout, you should refer to the levels at the previous tick and whether they were broken by current tick's price; if SMA > 1, then there is some smoothing, and so the levels will stay in-place even if there is a breakout, so it's easier to spot breakouts without having to look at the previous ticks, but on the other hand you won't see the new levels for the new price range until after a few more ticks for the smoothing window to adapt. Hence, by default, smoothing is disabled, so that you can see the currently pertinent levels at all time, even right after or during a breakout. By default, the strong above level is in green, strong below level is in red, medium above level is in blue, medium below level is in yellow, and weak levels aren't displayed but can be. Half levels are also displayed, in a darker color. Strong levels are increments of the first leftmost digit (eg, 10000 to 20000), medium levels are increments of the second leftmost digit (eg, 19000 to 20000), and weak levels of the third leftmost digit (eg, 19100 to 19200). Instead of plotting all the psychological levels all at once as a grid, which makes the chart unintelligible, here the levels adapt dynamically around the current price, so that they show the above/below/half levels relatively to the current price. Indeed, "half-levels" are also displayed (eg, medium level can also display 19500 instead of only 19000 or 20000). This was made because otherwise the gap between two levels was too big, especially for the strongest levels (eg, there was no major level between 20000 and 30000, but with a half-step we also get a half-level at 25000, and empirically price tends to respect these half levels - I also tried quarter levels but empirically the results were not good). In addition to this hard-coded half-level, you can also create more subdivisions (eg, quarter levels) by setting the simple moving average to a value higher than 1. The script can be made to run on the daily timeframe whatever the current chart's timeframe is, to reduce the variability in levels, to make it less noisy than intraday price movement. But by default, the chart resolution is used, because I empirically found that the levels found with this indicator work on all time resolutions quite well. The step can be adjusted to increase the gap between levels, eg, if you want to display one every 2 levels then input step = 2 (eg, 22000, 24000, 26000, etc), or if you want to display quarter levels, input 0.25 (eg, 22000, 22250, 22500, etc). The default values should fit most use cases and cover most psychological levels. How to read Focust first on bigger dotted levels, they are stronger and more likely to cause a rebound or a major event or price to stay at this level. Remember that it's not enough to just look at levels, the context is important, because levels have various effects depending on current price movement: if price is above a level, the level is a support on which price can rebound; if price is below a level, the level is a resistance on which price can rebound (or break); and finally sometimes price also stays hovering around a level for some time. Levels closer to 9 are less weaker, and levels closer to 0 are stronger, according to Zipf law. This is now reflected since v3 in the transparency, levels that are closer to 9 will be more transparent. The switch in color for the same level illustrates how a level switches from being a support to a resistance and inversely. Eg, if a major level turns from green to red, then it changed from being a resistance (above) to a support (below). As is well known in trading, longer standing levels are stronger. This indicator provides a direct illustration: in practice, the number of consecutive dots on the same line influences the strength of the level: the longer the chain of dots, the more you can expect this price level to be significant. The length does not mean the level will necessarily hold, but that other traders are likely to monitor if it holds, and if not then price will break down. Hence, longer levels are good spots to place stop losses, or to enter trades depending on your strategy. In general, a single dot is not enough to consider a level significant, but 2 or more is a good enough level, and 10+ is a strong level. Intuitively, this makes sense, and is what pro traders do: the longer a level is tested, the stronger it is. This indicator can visually represent this intuition and allows to use it as a more systematic trading signal. Motivation I initially made the first version of the PsychoLevels indicator mainly to train with PineScript, but I found it surprisingly accurate to define levels that are respected by price movements. So I guess it can be useful for new traders and experienced traders alike, as it's easy to forget that psychological levels can often be as strong if not stronger than technical levels. It can also be used to quickly screen other minor assets for trading opportunities. For example, a hybrid strategy would be to manually define levels on BTCUSD but using this script to automatically define levels in crypto altcoins and quickly screen them for a trade opportunity that can be greater than with BTCUSD but with the same trend. Personally, although initially I did not believe an automated tool would work well for this purpose, I could now empirically verify that it is quite reliable for the purpose of detecting levels, and so I use it all the time to find the levels automatically and help me monitor them like a hawk, so that I only have to draw uber major levels, the ones that last between cycles and that are hard to autodetect, but otherwise all daily/weekly levels are usually covered. However, trendlines must still be drawn manually or with another indicator (but note that up to now I have found none that worked well enough), as PsychoLevels only draws levels (ie, horizontal lines, not oblique ones!). Differences with the previous version PsychoLevels v2 price levels now have a transparency according to their importance for the human brain: numbers closer to 9 are weaker, and numbers closer to 0 are stronger and represent a major psychological threshold (eg, that's why prices marked as $9.99 sell better than $10.00). This option can be disabled to get the exact same behavior as v2. modularized and typed code PsychoLevels v2 can be found here: Chỉ báo Pine Script®của tartigradiaCập nhật 1313681
The Perfect Support & ResistanceSupport & Resistance drawn based on overbought & oversold RSI . where the overbought acts as resistance and oversold acts as support. It has 2 levels (for support and resistance - i call them level_n_high or level_n_low) for each lookback period. it checks the highest pivot and the lowest pivot based on the lookback period then we compare if rsi is higher than the highest pivot or the lowest pivot and we also check if rsi is overbought or oversold and if the statement is true, then we assign the high to the variable level_n_high or level_n_low. n being the number of levels. in total there are 5 levels with both high & low for 5 lookback periods. This is basically how the code works. these levels can be accessed at any timeframe. the defaults are 5m and 30m. RSI settings: (default) ------------------- length - 14 source - close overbought - 70 oversold - 30 lookback settings: (default) --------------------- lookback_0 - 200 lookback_1 - 100 lookback_2 - 50 lookback_3 - 20 lookback_4 - 10 Timeframe Settings: (default) ------------------- htf1 - 5m htf2 - 30m Enjoy!Chỉ báo Pine Script®của Yidu_A_S_O_T_L_J_C11494