Day trading volume based levels by VhatkarThis script identifies dynamic support and resistance levels based on volume and price action analysis. It uses a unique algorithm that combines volume force calculations with pivot points to determine key levels where price is likely to react.
Originality and Usefulness :
Innovative Volume Force Calculation : The script calculates upforce and downforce based on volume and price movement, providing a novel insight into buying and selling pressure. Unlike traditional volume indicators, this approach offers a more nuanced understanding of market dynamics.
Dynamic Pivot Points : Pivot points are dynamically adjusted based on volume force and highest high calculations, unlike conventional static pivot points. This makes the levels more responsive to real-time market conditions, offering traders a competitive edge.
Adaptive Target Levels : The script sets target and stop prices for both long and short positions, with adjustable percentages based on the chosen timeframe. This feature is particularly useful for day traders looking for precise entry and exit points.
Unique Timeframe Adjustments : The script includes specific adjustments for different timeframes (e.g., 15m, 30m, 60m), optimizing the support and resistance levels for day trading strategies. This adaptability is not commonly found in existing open-source scripts.
Volume-Weighted Adjustments : The integration of VWAP (Volume-Weighted Average Price) into the volume force calculation adds an extra layer of accuracy, helping traders make more informed decisions.
Comprehensive Visual Representation : The script offers clear visual plots of entry, target, and stop levels, along with color-coded fill areas that indicate different target zones. This visual clarity enhances user experience and decision-making.
Unique Features Compared to Open-Source Scripts :
Advanced Volume Force Algorithm : While many open-source scripts rely solely on price action or basic volume indicators, this script integrates a sophisticated volume force algorithm. This unique approach allows traders to identify more accurate support and resistance levels based on real market activity.
Dynamic and Adaptive Pivot Points : Unlike traditional open-source scripts that use static pivot points, this script dynamically adjusts pivot points based on the highest high and volume force. This dynamic adjustment provides a more precise and adaptable analysis suitable for various market conditions.
Integrated VWAP Calculation : Incorporating VWAP into volume force calculations adds an extra dimension of accuracy, allowing for more reliable trading signals. This feature differentiates the script from simpler open-source alternatives that may not include such advanced calculations.
How to Use :
Apply the Script : Add the "Vhatkar Dynamic S/R Levels" script to your chart. Make sure your chart has volume data as the script relies on volume calculations.
Select Timeframe : The script is designed for day trading timeframes such as 5m, 15m, and 30m. Ensure you are using one of these timeframes for optimal performance.
Adjust Parameters :
Target Lines : Set the number of target lines using the SLRange input. Increase the count if fewer lines are visible or decrease if too many lines are cluttering the chart.
Interpreting Signals :
Long Entries : When the close price is above the pivot point, the script plots potential long entry points and target levels (TP1, TP2, TP3) as well as a stop-loss level.
Short Entries : When the close price is below the pivot point, the script plots potential short entry points and target levels (TP1, TP2, TP3) as well as a stop-loss level.
Visual Aids : Use the color-coded fill areas to quickly identify target zones and stop levels.
Trade Management : Utilize the plotted entry, target, and stop levels to manage your trades. Adjust your trading strategy based on the levels provided by the script.
Usage :
Designed for day trading on timeframes such as 5m, 15m, and 30m.
Provides clear visual plots of entry, target, and stop levels.
Offers flexibility with adjustable parameters to suit different trading styles.
Riskreward

Wolf DCA CalculatorThe Wolf DCA Calculator is a powerful and flexible indicator tailored for traders employing the Dollar Cost Averaging (DCA) strategy. This tool is invaluable for planning and visualizing multiple entry points for both long and short positions. It also provides a comprehensive analysis of potential profit and loss based on user-defined parameters, including leverage.
Features
Entry Price: Define the initial entry price for your trade.
Total Lot Size: Specify the total number of lots you intend to trade.
Percentage Difference: Set the fixed percentage difference between each DCA point.
Long Position: Toggle to switch between long and short positions.
Stop Loss Price: Set the price level at which you plan to exit the trade to minimize losses.
Take Profit Price: Set the price level at which you plan to exit the trade to secure profits.
Leverage: Apply leverage to your trade, which multiplies the potential profit and loss.
Number of DCA Points: Specify the number of DCA points to strategically plan your entries.
How to Use
1. Add the Indicator to Your Chart:
Search for "Wolf DCA Calculator" in the TradingView public library and add it to your chart.
2. Configure Inputs:
Entry Price: Set your initial trade entry price.
Total Lot Size: Enter the total number of lots you plan to trade.
Percentage Difference: Adjust this to set the interval between each DCA point.
Long Position: Use this toggle to choose between a long or short position.
Stop Loss Price: Input the price level at which you plan to exit the trade to minimize losses.
Take Profit Price: Input the price level at which you plan to exit the trade to secure profits.
Leverage: Set the leverage you are using for the trade.
Number of DCA Points: Specify the number of DCA points to plan your entries.
3. Analyze the Chart:
The indicator plots the DCA points on the chart using a stepline style for clear visualization.
It calculates the average entry point and displays the potential profit and loss based on the specified leverage.
Labels are added for each DCA point, showing the entry price and the lots allocated.
Horizontal lines mark the Stop Loss and Take Profit levels, with corresponding labels showing potential loss and profit.
Benefits
Visual Planning: Easily visualize multiple entry points and understand how they affect your average entry price.
Risk Management: Clearly see your Stop Loss and Take Profit levels and their impact on your trade.
Customizable: Adapt the indicator to your specific strategy with a wide range of customizable parameters.

Trailing Management (Zeiierman)█ Overview
The Trailing Management (Zeiierman) indicator is designed for traders who seek an automated and dynamic approach to managing trailing stops. It helps traders make systematic decisions regarding when to enter and exit trades based on the calculated risk-reward ratio. By providing a clear visual representation of trailing stop levels and risk-reward metrics, the indicator is an essential tool for both novice and experienced traders aiming to enhance their trading discipline.
The Trailing Management (Zeiierman) indicator integrates a Break-Even Curve feature to enhance its utility in trailing stop management and risk-reward optimization. The Break-Even Curve illuminates the precise point at which a trade neither gains nor loses value, offering clarity on the risk-reward landscape. Furthermore, this precise point is calculated based on the required win rate and the risk/reward ratio. This calculation aids traders in understanding the type of strategy they need to employ at any given time to be profitable. In other words, traders can, at any given point, assess the kind of strategy they need to utilize to make money, depending on the price's position within the risk/reward box.
█ How It Works
The indicator operates by computing the highest high and the lowest low over a user-defined period and then applying this information to determine optimal trailing stop levels for both long and short positions.
Directional Bias:
It establishes the direction of the market trend by comparing the index of the highest high and the lowest low within the lookback period.
Bullish
Bearish
Trailing Stop Adjustment:
The trailing stops are adjusted using one of three methods: an automatic calculation based on the median of recent peak differences, pivot points, or a fixed percentage defined by the user.
The Break-Even Curve:
The Break-Even Curve, along with the risk/reward ratio, is determined through the trailing method. This approach utilizes the current closing price as a hypothetical entry point for trades. All calculations, including those for the curve, are based on this current closing price, ensuring real-time accuracy and relevance. As market conditions fluctuate, the curve dynamically adjusts, offering traders a visual benchmark that signifies the break-even point. This real-time adjustment provides traders with an invaluable tool, allowing them to visually track how shifts in the market could impact the point at which their trades neither gain nor lose value.
Example:
Let's say the price is at the midpoint of the risk/reward box; this means that the risk/reward ratio should be 1:1, and the minimum win rate is 50% to break even.
In this example, we can see that the price is near the stop-loss level. If you are about to take a trade in this area and would respect your stop, you only need to have a minimum win rate of 11% to earn money, given the risk/reward ratio, assuming that you hold the trade to the target.
In other words, traders can, at any given point, assess the kind of strategy they need to employ to make money based on the price's position within the risk/reward box.
█ How to Use
Market Bias:
When using the Auto Bias feature, the indicator calculates the underlying market bias and displays it as either bullish or bearish. This helps traders align their trades with the underlying market trend.
Risk Management:
By observing the plotted trailing stops and the risk-reward ratios, traders can make strategic decisions to enter or exit positions, effectively managing the risk.
Strategy selection:
The Break-Even Curve is a powerful tool for managing risk, allowing traders to visualize the relationship between their trailing stops and the market's price movements. By understanding where the break-even point lies, traders can adjust their strategies to either lock in profits or cut losses.
Based on the plotted risk/reward box and the location of the price within this box, traders can easily see the win rate required by their strategy to make money in the long run, given the risk/reward ratio.
Consider this example: The market is bullish, as indicated by the bias, and the indicator suggests looking into long trades. The price is near the top of the risk/reward box, which means entering the market right now carries a huge risk, and the potential reward is very low. To take this trade, traders must have a strategy with a win rate of at least 90%.
█ Settings
Trailing Method:
Auto: The indicator calculates the trailing stop dynamically based on market conditions.
Pivot: The trailing stop is adjusted to the highest high (long positions) or lowest low (short positions) identified within a specified lookback period. This method uses the pivotal points of the market to set the trailing stop.
Percentage: The trailing stop is set at a fixed percentage away from the peak high or low.
Trailing Size (prd):
This setting defines the lookback period for the highest high and lowest low, which affects the sensitivity of the trailing stop to price movements.
Percentage Step (perc):
If the 'Percentage' method is selected, this setting determines the fixed percentage for the trailing stop distance.
Set Bias (bias):
Allows users to set a market bias which can be Bullish, Bearish, or Auto, affecting how the trailing stop is adjusted in relation to the market trend.
-----------------
Disclaimer
The information contained in my Scripts/Indicators/Ideas/Algos/Systems does not constitute financial advice or a solicitation to buy or sell any securities of any type. I will not accept liability for any loss or damage, including without limitation any loss of profit, which may arise directly or indirectly from the use of or reliance on such information.
All investments involve risk, and the past performance of a security, industry, sector, market, financial product, trading strategy, backtest, or individual's trading does not guarantee future results or returns. Investors are fully responsible for any investment decisions they make. Such decisions should be based solely on an evaluation of their financial circumstances, investment objectives, risk tolerance, and liquidity needs.
My Scripts/Indicators/Ideas/Algos/Systems are only for educational purposes!

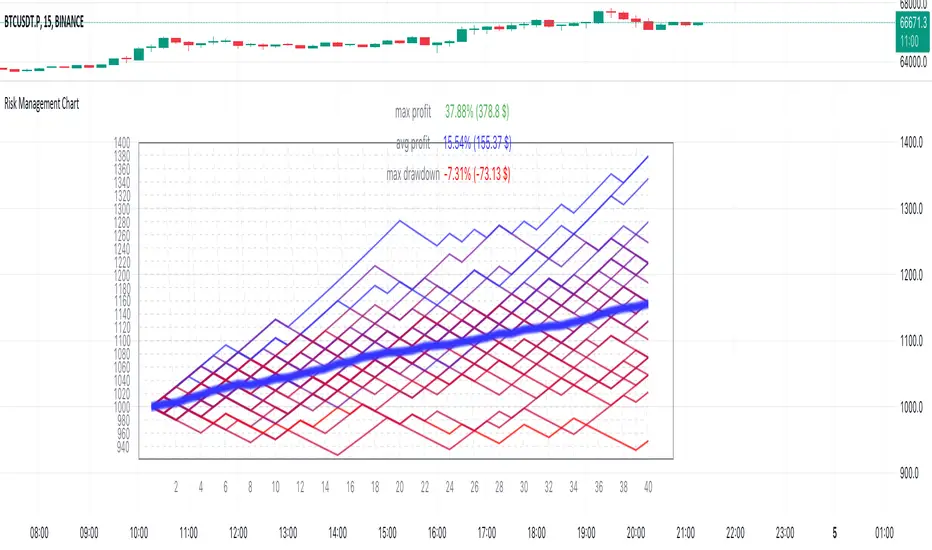
Risk Management Chart█ OVERVIEW
Risk Management Chart allows you to calculate and visualize equity and risk depend on your risk-reward statistics which you can set at the settings.
This script generates random trades and variants of each trade based on your settings of win/loss percent and shows it on the chart as different polyline and also shows thick line which is average of all trades.
It allows you to visualize and possible to analyze probability of your risk management. Be using different settings you can adjust and change your risk management for better profit in future.
It uses compound interest for each trade.
Each variant of trade is shown as a polyline with color from gradient depended on it last profit.
Also I made blurred lines for better visualization with function :
poly(_arr, _col, _t, _tr) =>
for t = 1 to _t
polyline.new(_arr, false, false, xloc.bar_index, color.new(_col, 0 + t * _tr), line_width = t)
█ HOW TO USE
Just add it to the cart and expand the window.
█ SETTINGS
Start Equity $ - Amount of money to start with (your equity for trades)
Win Probability % - Percent of your win / loss trades
Risk/Reward Ratio - How many profit you will get for each risk(depends on risk per trade %)
Number of Trades - How many trades will be generated for each variant of random trading
Number of variants(lines) - How many variants will be generated for each trade
Risk per Trade % -risk % of current equity for each trade
If you have any ask it at comments.
Hope it will be useful.
ATR Bands with Optional Risk/Reward Colors█ OVERVIEW
This indicator projects ATR bands and, optionally, colors them based on a risk/reward advantage for those who trade breakouts/breakdowns using moving averages as partial or full exit points.
█ DEFINITIONS
► True Range
The True Range is a measure of the volatility of a financial asset and is defined as the maximum difference among one of the following values:
- The high of the current period minus the low of the current period.
- The absolute value of the high of the current period minus the closing price of the previous period.
- The absolute value of the low of the current period minus the closing price of the previous period.
► Average True Range
The Average True Range was developed by J. Welles Wilder Jr. and was introduced in his 1978 book titled "New Concepts in Technical Trading Systems". It is calculated as an average of the true range values over a certain number of periods (usually 14) and is commonly used to measure volatility and set stop-loss and profit targets (1).
For example, if you are looking at a daily chart and you want to calculate the 14-day ATR, you would take the True Range of the previous 14 days, calculate their average, and this would be the ATR for that day. The process is then repeated every day to obtain a series of ATR values over time.
The ATR can be smoothed using different methods, such as the Simple Moving Average (SMA), the Exponential Moving Average (EMA), or others, depending on the user's preferences or analysis needs.
► ATR Bands
The ATR bands are created by adding or subtracting the ATR from a reference point (usually the closing price). This process generates bands around the central point that expand and contract based on market volatility, allowing traders to assess dynamic support and resistance levels and to adapt their trading strategies to current market conditions.
█ INDICATOR
► ATR Bands
The indicator provides all the essential parameters for calculating the ATR: period length, time frame, smoothing method, and multiplier.
It is then possible to choose the reference point from which to create the bands. The most commonly used reference points are Open, High, Low, and Close, but you can also choose the commonly used candle averages: HL2, HLC3, HLCC4, OHLC4. Among these, there is also a less common "OC2", which represents the average of the candle body. Additionally, two parameters have been specifically created for this indicator: Open/Close and High/Low.
With the "Open/Close" parameter, the upper band is calculated from the higher value between Open and Close, while the lower one is calculated from the lower value between Open and Close. In the case of bullish candles, therefore, the Close value is taken as the starting point for the upper band and the Open value for the lower one; conversely, in bearish candles, the Open value is used for the upper band and the Close value for the lower band. This setting can be useful for precautionally generating broader bands when trading with candlesticks like hammers or inverted hammers.
The "High/Low" parameter calculates the upper band starting from the High and the lower band starting from the Low. Among all the available options, this one allows drawing the widest bands.
Other possible options to improve the drawing of ATR bands, aligning them with the price action, are:
• Doji Smoothing: When the current candle is a doji (having the same Open and Close price), the bands assume the values they had on the previous candle. This can be useful to avoid steep fluctuations of the bands themselves.
• Extend to High/Low: Extends the bands to the High or Low values when they exceed the value of the band.
• Round Last Cent: Expands the upper band by one cent if the price ends with x.x9, and the lower band if the price ends with x.x1. This function only works when the asset's tick is 0.01.
► Risk/Reward Advantage
The indicator optionally colors the ATR bands after setting a breakpoint, one or two risk/reward ratios, and a series of moving averages. This function allows you to know in advance whether entering a trade can provide an advantage over the risk. The band is colored when the ratio between the distance from the break point to the band and the distance from the break point to the first available moving average reaches at least the set ratio value. It is possible to set two colorings, one for a minimum risk/reward ratio and one for an optimal risk/reward ratio.
The break point can be chosen between High/Low (High in case of breakout, Low in case of breakdown) or Open/Close (on breakouts, Close with bullish candles or Open with bearish candles; on breakdowns, Close with bearish candles or Open with bullish candles).
It is possible to choose up to 10 moving averages of various types, including the VWAP with the Anchor Period (2).
Depending on the "Price to MA" setting, the bands can be individually or simultaneously colored.
By selecting "Single Direction," the risk/reward calculation is performed only when all moving averages are above or below the break point, resulting in only one band being colored at a time. For this reason, when the break point is in between the moving averages, the calculation is not executed. This setting can be useful for strategies involving price movement from a level towards a series of specific moving averages (for example, in reversals starting from a certain level towards the VWAP with possible partial take profits on some previous moving averages, or simply in trend following towards one or more moving averages).
Choosing "Both Directions" the risk/reward ratio is calculated based on the first available moving averages both above and below the price. This setting is useful for those who operate in range bound markets or simply take advantage of movements between moving averages.
█ NOTE
This script may not be suitable for scalping strategies that require immediate entries due to the inability to know the ATR of a candle in advance until its closure. Once the candle is closed, you should have time to place a stop or stop-limit order, so your strategy should not anticipate an immediate start with the next candle. Even more conveniently, if your strategy involves an entry on a pullback, you can place a limit order at the breakout level.
(1) www.tradingview.com
(2) For convenience, the code for the Anchor Period has been entirely copied from the VWAP code provided by TradingView.

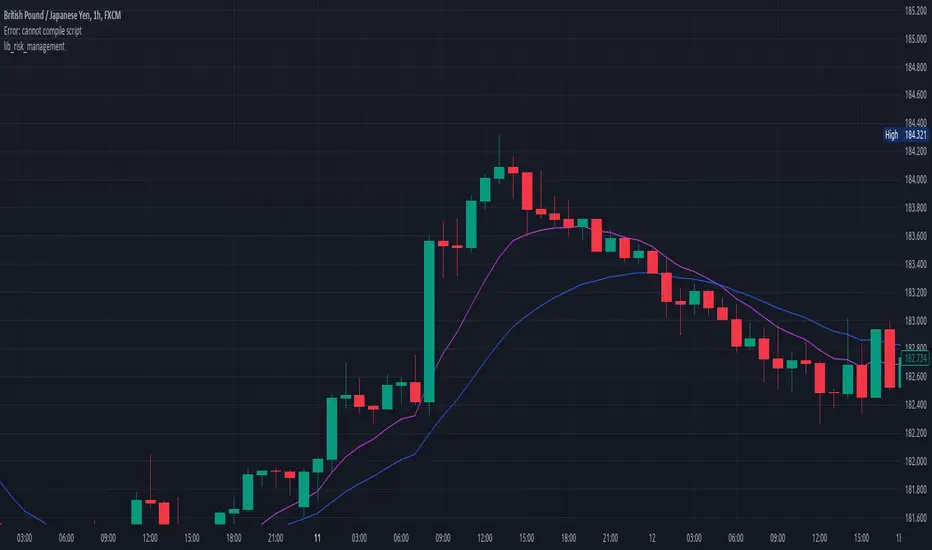
lib_risk_managementLibrary "lib_risk_management"
a lib to help with dynamic position sizing
position_size(risk, account_balance, entry_price, sl_price)
calculate the position size required to meet the account size based risk given when the stop loss is triggered
Parameters:
risk (float) : percentage of account balance to risk (1-100)
account_balance (float) : account balance in instrument currency
entry_price (float) : entry price
sl_price (float) : stop loss price
Returns: the position size in instrument currency that will loose the given risk percentage of the account balance when a stop loss is triggered
account_balance(to_currency, live)
converts the (current(default)/initial) account balance to the given currency at the daily rate
Parameters:
to_currency (simple string) The currency in which the account balance is to be converted. Possible values: a three-letter string with the currency code in the ISO 4217 format (e.g. "USD"), or one of the built-in variables that return currency codes, like syminfo.currency or currency.USD.
live (bool) converts the current account balance (strategy.equity) (default:true) or otherwise the initial capital (strategy.initial_capital)
Returns: the (current/initial) account balance converted to the given currency with at the current daily rate
Curved Management (Zeiierman)█ Overview
The Curved Management (Zeiierman) is a trade management indicator tailored for traders looking to visualize their entry, stop loss, and take profit levels. Unique in its design, this indicator doesn't just display lines; it offers rounded or curved visualizations, setting it apart from conventional tools.
█ How It Works
At its core, this indicator leverages the power of the Average True Range (ATR), a metric for volatility, to establish logical stop-loss levels based on recent price action. By incorporating the ATR, the tool dynamically adapts to the market's changing volatility. What sets it apart is the unique curved visualization. Instead of the usual straight lines representing entry/sl levels, users can choose between rounded and straight edges for their take profit and stop loss levels. This aesthetic tweak gives the chart a cleaner look and offers a more intuitive understanding of risk management.
█ How to Apply the Indicator
Upon initially loading the indicator, a label appears that reads, "Set the 'xy' time and price for 'Curved Management (Zeiierman).'" This prompts you to click on the chart at your entry point. After selecting your entry point on the chart, the indicator will load. Ensure you adjust the trend direction in the settings panel based on whether you took a long or short position.
█ How to Use
Use the tool to manage your active position.
Long Entry
Short Entry
█ Settings
The indicator comes packed with various settings allowing customization:
Trade Direction
Decide the direction of the trade (long/short).
Reward multiplier
Sets the ratio for take profit relative to stop loss. Increasing this value will set your take profit further from the entry, and decreasing it will bring it closer.
Risk multiplier
Multiplier for calculating stop loss based on the ATR value. Increasing this makes your stop loss further from the entry, while decreasing brings it closer.
█ Related Free Scripts
Trade & Risk Management Tool
-----------------
Disclaimer
The information contained in my Scripts/Indicators/Ideas/Algos/Systems does not constitute financial advice or a solicitation to buy or sell any securities of any type. I will not accept liability for any loss or damage, including without limitation any loss of profit, which may arise directly or indirectly from the use of or reliance on such information.
All investments involve risk, and the past performance of a security, industry, sector, market, financial product, trading strategy, backtest, or individual's trading does not guarantee future results or returns. Investors are fully responsible for any investment decisions they make. Such decisions should be based solely on an evaluation of their financial circumstances, investment objectives, risk tolerance, and liquidity needs.
My Scripts/Indicators/Ideas/Algos/Systems are only for educational purposes!

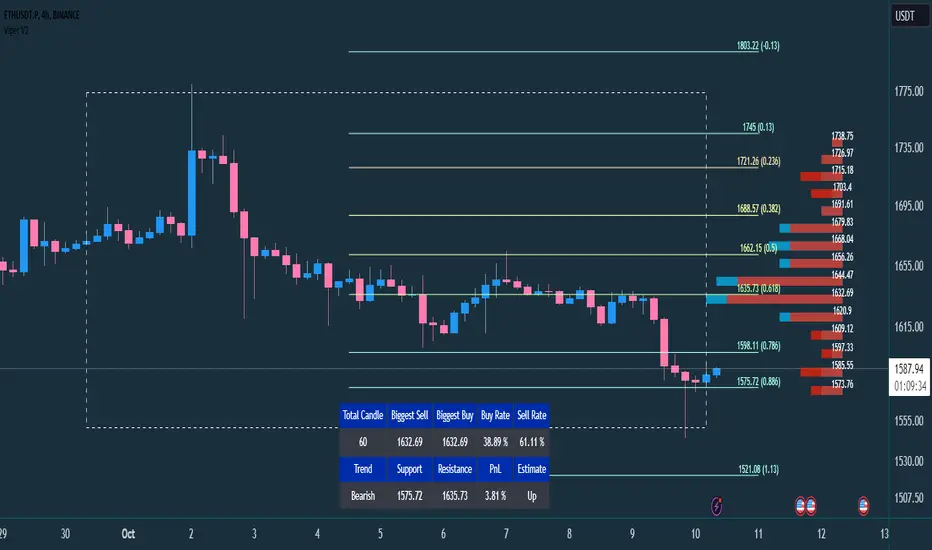
VIPER DOPING - A Volume Profile to estimate trend probabilityDESCRIPTION :
VIPER DOPING uses volume analysis to help trader to understand trading keys below:
Support and Resistance
Profit and Loss
Estimate candle direction
Trend
Biggest Buy and Sell on level prices
HOW TO USE:
The volume bar will have buy and sell colors, by default the buy color is blue and the sell is red. The size of bar is important matter, the biggest bar size means that price level has strong volume or transaction and the smallest bar size indicates the lowest transaction or volume. How to read it?
The bar above the candle is the resistance
The bar below the candle is the support
If you want long the market, find the biggest or bigger support, which is below the candle
If you want short the market, find the biggest or bigger resistance which is above the candle
Trading style and the maximum range (total candle), default is 60. This setup to analyze volumes in specific candle range. Please check the following recommendation based on trading style:
Scalping: 30 - 60 candles, recommendation timeframe: 5m - 1h
Day Trading: 50 - 120 candles, recommendation timeframe: 30m - 4h
Swing Trading: 100- 240 candles, recommendation timeframe: 1h- 3D
The white box is to visualize trading area by total candle. Every line has the meaning:
The left line is the start candle
The right line is the end candle
The top line is the highest price of volume profile
The bottom line is the lowest price of volume profile
The fibonacci line will help you to confirm and compare of supports and resistances with the volume profile lines.
The TABLE CELLS
it contains information to help trader to understand the recent situation of market and to take strategy of trading:
Total Candle : the maximum candles are used to analyze the volume from previous active candle
Biggest Sell : the horizontal price area which has the largest of sell volume of the last total candle
Biggest Buy : the horizontal price area which has the largest of buy volume of the last total candle
Buy Rate : the ratio of buy and sell volume of the last total candle
Support: the closest price to be the support from the active candle, auto changed if support to be invalid
Resistance : the closest price to be the resistance from the active candle, auto changed if support to be invalid
PnL : the percentage profit if you trade using the support and resistance prices and it can be used for Risk Management. Wisely the risk is 50% of the profit, example if the profit 1% the your risk should be 0.5% from entry.
Estimate : to analize the next direction of candle or target, it will be changed automatically by volume condition.
CONFIGURATION:
Table Position : You can change the table position to top or bottom, to left, right or center
Calculation : You can include the active candle in volume calculation or you can choose the behind active candle. If you use active candle, there could be possible repainting.
The volume profile configuration is about appearance configuration, to setup the thickness, colors, position.
The fibonacci configuration is about appearance configuration, to setup the thickness, extend lines, label styles.
Risk Reward Optimiser [ChartPrime]█ CONCEPTS
In modern day strategy optimization there are few options when it comes to optimizing a risk reward ratio. Users frequently need to experiment and go through countless permutations in order to tweak, adjust and find optimal in their data.
Therefore we have created the Risk Reward Optimizer.
The Risk Reward Optimizer is a technical tool designed to provide traders with comprehensive insights into their trading strategies.
It offers a range of features and functionalities aimed at enhancing traders' decision-making process.
With a focus on comprehensive data, it is there to help traders quickly and efficiently locate Risk Reward optimums for inbuilt of custom strategies.
█ Internal and external Signals:
The script can optimize risk to reward ratio for any type of signals
You can utilize the following :
🔸Internal signals ➞ We have included a number of common indicators into the optimizer such as:
▫️ Aroon
▫️ AO (Awesome Oscillator)
▫️ RSI (Relative Strength Index)
▫️ MACD (Moving Average Convergence Divergence)
▫️ SuperTrend
▫️ Stochastic RSI
▫️ Stochastic
▫️ Moving averages
All these indicators have 3 conditions to generate signals :
Crossover
High Than
Less Than
🔸External signal
▫️ by incorporating your own indicators into the analysis. This flexibility enables you to tailor your strategy to your preferences.
◽️ How to link your signal with the optimizer:
In order to be able to analysis your signal we need to read it and to do so we would need to PLOT your signal with a defined value
plot( YOUR LONG Condition ? 100 : 0 , display = display.data_window)
█ Customizable Risk to Reward Ratios:
This tool allows you to test seven different customizable risk to reward ratios , helping you determine the most suitable risk-reward balance for your trading strategy. This data-driven approach takes the guesswork out of setting stop-loss and take-profit levels.
█ Comprehensive Data Analysis:
The tool provides a table displaying key metrics, including:
Total trades
Wins
Losses
Profit factor
Win rate
Profit and loss (PNL)
This data is essential for refining your trading strategy.
🔸 It includes a tooltip for each risk to reward ratio which gives data for the:
Most Profitable Trade USD value
Most Profitable Trade % value
Most Profitable Trade Bar Index
Most Profitable Trade Time (When it occurred)
Position and size is adjustable
█ Visual insights with histograms:
Visualize your trading performance with histograms displaying each risk to reward ratio trade space, showing total trades, wins, losses, and the ratio of profitable trades.
This visual representation helps you understand the strengths and weaknesses of your strategy.
It offers tooltips for each RR ratio with the average win and loss percentages for further analysis.
█ Dynamic Highlighting:
A drop-down menu allows you to highlight the maximum values of critical metrics such as:
Profit factor
Win rate
PNL
for quick identification of successful setups.
█ Stop Loss Flexibility:
You can adjust stop-loss levels using three different calculation methods:
ATR
Pivot
VWAP
This allows you to align risk-reward ratios with your preferred risk tolerance.
█ Chart Integration:
Visualize your trades directly on your price chart, with each trade displayed in a distinct color for easy tracking.
When your take-profit (TP) level is reached , the tool labels the corresponding risk-reward ratio for that specific TP, simplifying trade management.
█ Detailed Tooltips:
Tooltips provide deeper insights into your trading performance. They include information about the most profitable trade, such as the time it occurred, the bar index, and the percentage gain. Histogram tooltips also offer average win and loss percentages for further analysis.
█ Settings:
█ Code:
In summary, the Risk Reward Optimizer is a data-driven tool that offers traders the ability to optimize their risk-reward ratios, refine their strategies, and gain a deeper understanding of their trading performance. Whether you're a day trader, swing trader, or investor, this tool can help you make informed decisions and improve your trading outcomes.

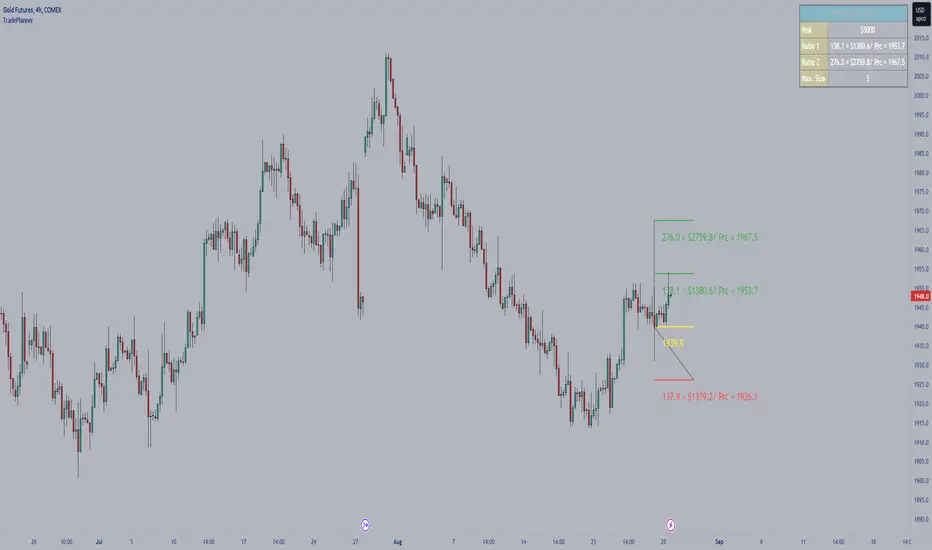
TradePlannerTradePlanner is trade planning tool which helps to map out your trade plan by displaying an entry line, a stop line, and multiple target lines (up to 5 targets) right on the chart. Each line can be configured to display the distance from the entry in terms of both number of ticks as well as the profit/loss in currency terms. An on-screen table quantifies and summarizes the entire trade plan information plus it calculates and displays the maximum lot size given the specified amount of risk you want to take per trade, which is totally customizable, all of which takes the guesswork out of trade planning.
Support & Resistance AI (K means/median) [ThinkLogicAI]█ OVERVIEW
K-means is a clustering algorithm commonly used in machine learning to group data points into distinct clusters based on their similarities. While K-means is not typically used directly for identifying support and resistance levels in financial markets, it can serve as a tool in a broader analysis approach.
Support and resistance levels are price levels in financial markets where the price tends to react or reverse. Support is a level where the price tends to stop falling and might start to rise, while resistance is a level where the price tends to stop rising and might start to fall. Traders and analysts often look for these levels as they can provide insights into potential price movements and trading opportunities.
█ BACKGROUND
The K-means algorithm has been around since the late 1950s, making it more than six decades old. The algorithm was introduced by Stuart Lloyd in his 1957 research paper "Least squares quantization in PCM" for telecommunications applications. However, it wasn't widely known or recognized until James MacQueen's 1967 paper "Some Methods for Classification and Analysis of Multivariate Observations," where he formalized the algorithm and referred to it as the "K-means" clustering method.
So, while K-means has been around for a considerable amount of time, it continues to be a widely used and influential algorithm in the fields of machine learning, data analysis, and pattern recognition due to its simplicity and effectiveness in clustering tasks.
█ COMPARE AND CONTRAST SUPPORT AND RESISTANCE METHODS
1) K-means Approach:
Cluster Formation: After applying the K-means algorithm to historical price change data and visualizing the resulting clusters, traders can identify distinct regions on the price chart where clusters are formed. Each cluster represents a group of similar price change patterns.
Cluster Analysis: Analyze the clusters to identify areas where clusters tend to form. These areas might correspond to regions of price behavior that repeat over time and could be indicative of support and resistance levels.
Potential Support and Resistance Levels: Based on the identified areas of cluster formation, traders can consider these regions as potential support and resistance levels. A cluster forming at a specific price level could suggest that this level has been historically significant, causing similar price behavior in the past.
Cluster Standard Deviation: In addition to looking at the means (centroids) of the clusters, traders can also calculate the standard deviation of price changes within each cluster. Standard deviation is a measure of the dispersion or volatility of data points around the mean. A higher standard deviation indicates greater price volatility within a cluster.
Low Standard Deviation: If a cluster has a low standard deviation, it suggests that prices within that cluster are relatively stable and less likely to exhibit sudden and large price movements. Traders might consider placing tighter stop-loss orders for trades within these clusters.
High Standard Deviation: Conversely, if a cluster has a high standard deviation, it indicates greater price volatility within that cluster. Traders might opt for wider stop-loss orders to allow for potential price fluctuations without getting stopped out prematurely.
Cluster Density: Each data point is assigned to a cluster so a cluster that is more dense will act more like gravity and
2) Traditional Approach:
Trendlines: Draw trendlines connecting significant highs or lows on a price chart to identify potential support and resistance levels.
Chart Patterns: Identify chart patterns like double tops, double bottoms, head and shoulders, and triangles that often indicate potential reversal points.
Moving Averages: Use moving averages to identify levels where the price might find support or resistance based on the average price over a specific period.
Psychological Levels: Identify round numbers or levels that traders often pay attention to, which can act as support and resistance.
Previous Highs and Lows: Identify significant previous price highs and lows that might act as support or resistance.
The key difference lies in the approach and the foundation of these methods. Traditional methods are based on well-established principles of technical analysis and market psychology, while the K-means approach involves clustering price behavior without necessarily incorporating market sentiment or specific price patterns.
It's important to note that while the K-means approach might provide an interesting way to analyze price data, it should be used cautiously and in conjunction with other traditional methods. Financial markets are influenced by a wide range of factors beyond just price behavior, and the effectiveness of any method for identifying support and resistance levels should be thoroughly tested and validated. Additionally, developments in trading strategies and analysis techniques could have occurred since my last update.
█ K MEANS ALGORITHM
The algorithm for K means is as follows:
Initialize cluster centers
assign data to clusters based on minimum distance
calculate cluster center by taking the average or median of the clusters
repeat steps 1-3 until cluster centers stop moving
█ LIMITATIONS OF K MEANS
There are 3 main limitations of this algorithm:
Sensitive to Initializations: K-means is sensitive to the initial placement of centroids. Different initializations can lead to different cluster assignments and final results.
Assumption of Equal Sizes and Variances: K-means assumes that clusters have roughly equal sizes and spherical shapes. This may not hold true for all types of data. It can struggle with identifying clusters with uneven densities, sizes, or shapes.
Impact of Outliers: K-means is sensitive to outliers, as a single outlier can significantly affect the position of cluster centroids. Outliers can lead to the creation of spurious clusters or distortion of the true cluster structure.
█ LIMITATIONS IN APPLICATION OF K MEANS IN TRADING
Trading data often exhibits characteristics that can pose challenges when applying indicators and analysis techniques. Here's how the limitations of outliers, varying scales, and unequal variance can impact the use of indicators in trading:
Outliers are data points that significantly deviate from the rest of the dataset. In trading, outliers can represent extreme price movements caused by rare events, news, or market anomalies. Outliers can have a significant impact on trading indicators and analyses:
Indicator Distortion: Outliers can skew the calculations of indicators, leading to misleading signals. For instance, a single extreme price spike could cause indicators like moving averages or RSI (Relative Strength Index) to give false signals.
Risk Management: Outliers can lead to overly aggressive trading decisions if not properly accounted for. Ignoring outliers might result in unexpected losses or missed opportunities to adjust trading strategies.
Different Scales: Trading data often includes multiple indicators with varying units and scales. For example, prices are typically in dollars, volume in units traded, and oscillators have their own scale. Mixing indicators with different scales can complicate analysis:
Normalization: Indicators on different scales need to be normalized or standardized to ensure they contribute equally to the analysis. Failure to do so can lead to one indicator dominating the analysis due to its larger magnitude.
Comparability: Without normalization, it's challenging to directly compare the significance of indicators. Some indicators might have a larger numerical range and could overshadow others.
Unequal Variance: Unequal variance in trading data refers to the fact that some indicators might exhibit higher volatility than others. This can impact the interpretation of signals and the performance of trading strategies:
Volatility Adjustment: When combining indicators with varying volatility, it's essential to adjust for their relative volatilities. Failure to do so might lead to overemphasizing or underestimating the importance of certain indicators in the trading strategy.
Risk Assessment: Unequal variance can impact risk assessment. Indicators with higher volatility might lead to riskier trading decisions if not properly taken into account.
█ APPLICATION OF THIS INDICATOR
This indicator can be used in 2 ways:
1) Make a directional trade:
If a trader thinks price will go higher or lower and price is within a cluster zone, The trader can take a position and place a stop on the 1 sd band around the cluster. As one can see below, the trader can go long the green arrow and place a stop on the one standard deviation mark for that cluster below it at the red arrow. using this we can calculate a risk to reward ratio.
Calculating risk to reward: targeting a risk reward ratio of 2:1, the trader could clearly make that given that the next resistance area above that in the orange cluster exceeds this risk reward ratio.
2) Take a reversal Trade:
We can use cluster centers (support and resistance levels) to go in the opposite direction that price is currently moving in hopes of price forming a pivot and reversing off this level.
Similar to the directional trade, we can use the standard deviation of the cluster to place a stop just in case we are wrong.
In this example below we can see that shorting on the red arrow and placing a stop at the one standard deviation above this cluster would give us a profitable trade with minimal risk.
Using the cluster density table in the upper right informs the trader just how dense the cluster is. Higher density clusters will give a higher likelihood of a pivot forming at these levels and price being rejected and switching direction with a larger move.
█ FEATURES & SETTINGS
General Settings:
Number of clusters: The user can select from 3 to five clusters. A good rule of thumb is that if you are trading intraday, less is more (Think 3 rather than 5). For daily 4 to 5 clusters is good.
Cluster Method: To get around the outlier limitation of k means clustering, The median was added. This gives the user the ability to choose either k means or k median clustering. K means is the preferred method if the user things there are no large outliers, and if there appears to be large outliers or it is assumed there are then K medians is preferred.
Bars back To train on: This will be the amount of bars to include in the clustering. This number is important so that the user includes bars that are recent but not so far back that they are out of the scope of where price can be. For example the last 2 years we have been in a range on the sp500 so 505 days in this setting would be more relevant than say looking back 5 years ago because price would have to move far to get there.
Show SD Bands: Select this to show the 1 standard deviation bands around the support and resistance level or unselect this to just show the support and resistance level by itself.
Features:
Besides the support and resistance levels and standard deviation bands, this indicator gives a table in the upper right hand corner to show the density of each cluster (support and resistance level) and is color coded to the cluster line on the chart. Higher density clusters mean price has been there previously more than lower density clusters and could mean a higher likelihood of a reversal when price reaches these areas.
█ WORKS CITED
Victor Sim, "Using K-means Clustering to Create Support and Resistance", 2020, towardsdatascience.com
Chris Piech, "K means", stanford.edu
█ ACKNOLWEDGMENTS
@jdehorty- Thanks for the publish template. It made organizing my thoughts and work alot easier.

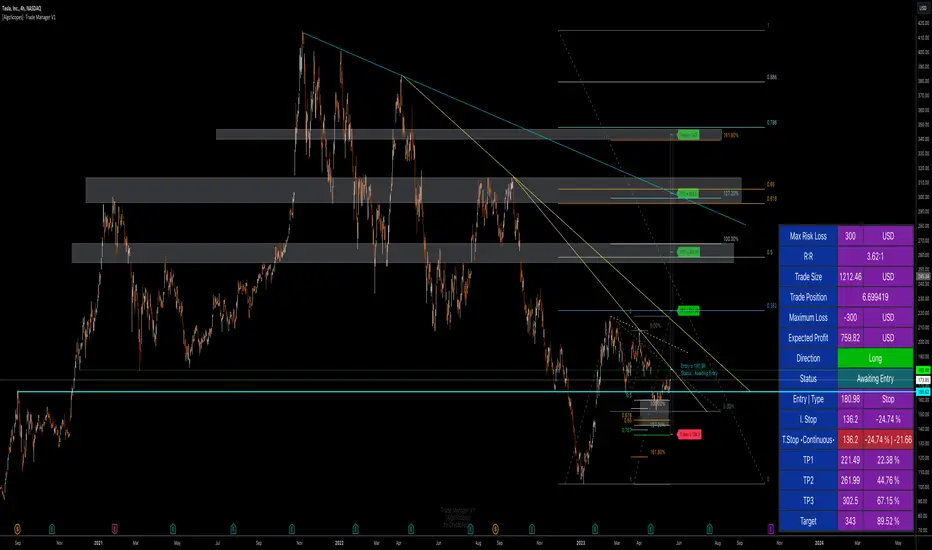
Trade Manager & Position Size Tool & PnL Tracker [AlgoScopes] V1Position size tool, leverage calculator, trade tracker, money management, trade presentation, risk reward management, margin position, live profit and loss, that's all in this one Trade Manager indicator.
The idea for this indicator comes from two years ago when I was helping a friend who, at the request of 15-20 members from our telegram group, wanted to create a paid group and share our ideas for trade with them (it started as an experiment for just a month or two and ended with 15 months with over 500 trading ideas and signals, with a complete TA chart). If I had time to create this indicator back then for members, it would have been much easier for them to be able to understand and follow the trade idea that was presented through a classic chart, with all the things that a TA must have:
Entry (as well as the reason for entry),
Stop (where the idea for the trade is no longer valid),
Target (with the reason why it is the target for that trade),
Take profits (taking part of the profit on the way to the target).
The majority of members still did not understand how much position to trade, what is the possible profit or loss, if the margin trade is how much leverage to use, in one word “money management”. The most important rule that every trader must follow is "Plan your trade and trade your plan". Learn money management and you are halfway there to becoming a successful trader. It is only after all that, you learn to use some of the "holy grail" indicators. When you have mastered those first two rules, find and master your favorite indicator or trading style (the most important thing is to stick to those two rules). The margin | leverage is also included in the script, for which there are so many dilemmas, arguments and discussions. (that many who still do not understand margin, would trade that it is not passionate if it is controlled). Too much for an introduction, especially since this indicator has so much to explain.
Most importantly, this is an invite-only indicator, and there are so many free indicators on tradingview that can also serve you very well. As far as I know, all exchanges have a calculator tool to calculate the possible profit and loss for each trade you plan to take.
*This indicator is not recommended for scalping on a 1min chart because the script, as you will see, is very complex, so the loading time is longer than with simpler indicators.
💠 ABOUT THE SCRIPT
This script is made to help manage trade. In this one indicator you have the possibility to do technical analysis, calculation for trade (four types: account size risk, trade investment, maximum to lose or position size), monitor 'PnL' (profit and loss in real time) do the calculation in the second, maybe local currency, and set an alert (from entry to any other change in trade). As the script is made for general use, some slight differences are possible for real time 'PnL' or 'ROI'. Always do a test before you start trading with larger amounts. The script is recommended for intra day trading and above. The script is not recommended for scalping on the 1min chart
💎 PROCESS TO ADD SCRIPT TO CHART
Possible trade on break example trade
As this script is invite-only, to add it to the chart you need to click on Indicators and find it under the 'Invite-Only' section. When you add the script to the chart (as it is interactive), you will be asked to do 4 steps.
🔸 'SET TRADE TIME'
Click on the chart where the last vertical bar is.
If you are already in the trade, then find the bar|time where the trade started
(you want to follow trade or trade presentation)
🔸 1) 'SET ENTRY'
Click on the horizontal level where you want to place the Entry
🔸 2) 'SET STOP'
Click on the horizontal level where you want to set the Stop
🔸 3) 'SET TARGET
Click on the horizontal level where you want to place the Target
💎 CONFIRM INPUTS
After you have done those 4 steps, a popup will appear with the relevant inputs for the trade.
You will see that some inputs are already filled (done in those 4 steps before, Entry, Stop and Target). You can correct them if you want (you will sometimes notice a longer 'space decimal' for the trade ticker, but this will not affect the calculator or other parts of the script). You can do the rest of the inputs for trade or finish it later when the script is loaded on the chart (it is recommended to fill in 'Trade Type' and 'Amount'. Don't forget to click on the "Apply" button to load the script on the chart.
💎 INDICATOR LOADED ON CHART
• When the indicator is loaded on the chart (regardless of whether it is a new trade or a trade that has already started), the following items are displayed by default:
🔸 ' Trade Table ' shows all relevant information for the trade
🔸 ' Trade Box ' with lines for Entry, Stop and Target (Take Profits if enabled)
🔸 ' Trade Box Labels ' with relevant data
• The Entry label is also the trade status label, and if the trade is not active, by default it is the Entry color
If the trade is active or when a new trade reached Entry, several new things are noticeable:
• Entry|Status label as well as status row in table will change color as well as 'Entry Reached' text
• Several extra columns relative to trade will be added to the Entry|Status label
• 3 new columns will also appear on the Trade Table (Live PnL, Live min PnL and Live ROI)
• If Trail Stop is enabled, the label will change the text to T.Stop and change color depending on whether it is in loss or profit.
• If Trail Stop is enabled, inside Trade Box trail line it will follow price action inside the box, while the label will always be fixed at the initial level
• A vertical colored line will appear on the right side of the Trade Box (depending on whether the trade is in profit or loss) which shows as in the Trade Table like Live PnL
⚪ SETTINGS
💎 Trade Account Setup
🔸 ‘Trade Type’
• 'Account Capital' or portfolio (with combination '% Capital Risk')
• 'Investment' (how much you want to invest in the trade)
• 'Risk To Lose' (how much you want to risk losing)
• 'Position Size' (exact position size, units|share for trade)
🔸 ‘Account Type’
• If the account is in another currency or you want to see possible profit | loss in local currency
• Around 150 world and local currencies supported by ICE exchange
🔸 ‘Amount’
• Amount for ‘Trade Type’
🔸 ‘% Capital Risk’
• Only for ‘Account Capital’ trade type
(i.e. 10.000 account capital with ‘% Capital Risk’ 4 is 10.000 x 4% = maximum loss 400)
🔸 ‘Leverage’
• Enable|Disable for margin trade i size of leverage (maximum 125x)
(be sure to study how and when to use margin trade through the tutorial, because margin trade can be very dangerous. If you have not perfected margin trade, there is a great possibility of losing most or even all of your account capital).
💎 TRADE ENTRY & TARGET & STOP & T.STOP & DATE | TIME
🔸 ‘Trade Date & Time’
🔸 ‘Entry’
🔸 ‘Stop’
🔸 ‘Target’
• (all was set in the previous step but can be correct/adjusted if needed)
🔸 ‘Market Entry’
• Enabled will move Entry on that bar close
🔸 ‘Liquidation’ (enabled by default)
• Show ‘Warning’ if trade Stop is close or invalid (trade will hit liquidation before reached Stop level)
🔸 ‘Trailing Type’ (4 trailing stop type)
• ‘Disabled’ (Stop will stay the entire time at the initial stop level)
• ‘Continuous’ (I.Stop follow price by distance or percent when price reached Trail start level)
• ‘Stepped’ (I.Stop moves to previous level when price reached Trail start level)
• ‘Breakeven’ (I.Stop moves to Entry when price reached Trail start level)*
* (least one Take Profit enabled)
🔸 ‘Trailing Active’ (Entry, TP1, TP2 and TP3)
• Trailing stop starts level if ‘Trailing Type’ is enabled
🔸 ‘Trailing by’ (distance or percent)
• ‘Distance’ (T.Stop will follow price action by distance)
• ‘Percent’ (T.Stop will follow price action by percent)
(this is a good example to see the difference between trailing by initial distance and initial percentage)
🔸 ‘T.Stop Distance & Percent’ (initial distance and percent for table trade only)
• Useful for bot or exchange
🔸 ‘Stop, T.Stop, Target and TP’s in PIP’s’
• Distance in PIP’s
💎 TAKE PROFIT
🔸 ‘Split Target’ (enabled by default to three take profits (TP) with auto split)
🔸 ‘Number of Take Profits’ (up to three take profits)
🔸 ‘Type’ (auto or manual)
• For manual type fill all prices to preferred level. TP percent (TP1%, TP2% and TP3% ) and Target% is how much profit you want to take on a specific level.
• PLEASE NOTE sum of all enabled ‘TP’ and targets = 100 (e.g. two TP and sets TP1% to 25 and TP2% to 35, then Target% should be 40% i.e. 25 + 35 + 40 = 100)
💎 TRADE BOX & LINES
🔸 ‘Target Line’ (color for target line and trade table ‘direction’)
🔸 ‘Stop Line’ (color for initial line and trail line)
🔸 ‘Entry Line’ (color for entry line and label & table status)
🔸 ‘To Trade Time’ (‘trade box’ left vertical line)
• By default is set to trade date and time
• Unchecked will be moved to the last bar (live time)
🔸 ‘Extended Left’ (extend Entry, Stop, Target and TP’s lines to left)
• To check for possible support|resistance
🔸 ‘Size’ (Entry, Stop, Target and TP’s lines size)
🔸 ‘PnL Box Size’ (line size for vertical box lines)
🔸 ‘Offset’ (right vertical line offset from last bar)
🔸 ‘PnL Box Color’ (right vertical line and trail fill color)
• Color changes for profit & loss
🔸 ‘Box Line Color’ (box base color)
💎 LABELS
🔸 ‘Stop & Target Labels’ (enable|disable stop and target labels)
• By default is set to small (tiny, small, normal, large, huge and auto option)
• Disabled will move all information on Entry|Status label
🔸 ‘Offset’ (label offset from trade box)
🔸 ‘Target Label’ (label color for target and all enabled tp’s)
🔸 ‘Stop Label’ (label color for initial stop and enabled trailing stop)
🔸 ‘Label Text’ (color for label text)
🔸 ‘Status Label Color’ (label table entry|status color when trade is not active)
🔸 ‘PnL’ (entry|status color for profit and loss)
🔸 ‘Size’ (by default set to normal, option tiny, small, normal, large, huge and auto)
🔸 ‘Risk to Reward’ (show risk to reward on labels)
🔸 ‘Extra Info’ (by default disabled, show extra related info for trade on labels)
• Useful if Trade Table disabled
🔸 ‘Close Trade Stats’ (by default disabled, show all info when trade is closed)
• By default is white text color for close trade stats label
💎 ALERTS
🔸 ‘Failed Trade’ (alert if price reached Stop before is active, reached Entry)
• Useful if trade need adjustment but it can also be left as it is
and alert is just warning
🔸 ‘New & Update Alert’ (alert when price reached Entry or change status to enabled Take Profits)
🔸 ‘Trade Closure Alert’ (alert when trade closed, reached Stop, Target or enabled Trail Stop)
• Alert can be in modified or default preset jSon format as well as in plain text format
• Place holders for creating alerts are :
{type}, {symbol}, {exchange}, {ticker}, {base}, {quote}, {timeframe}, {price}, {direction}, {entry}, {stop}, {tstop}, {tp1}, {tp2}, {tp3}, {target}, {tstopstatus}, {status}, {result}
* {type} placeholder is set to ‘Trade Active’, ‘Trade Update’ and ‘Trade Closed’
💎 TABLE DISPLAY
🔸 ‘Trade Table’ (enable|disable trade table)
🔸 ‘Position’ (by default set to bottom right with option bottom, middle and top with left, center and right)
🔸 ‘Size’ (by default set to normal, option tiny, small, normal, large, huge and auto)
🔸 ‘Full Table’ (by default enabled, disabled show small table without some info*)
* check picture for reference
🔸 ‘Presentation’ (by default disabled, hide all info related to PnL in trade currency)
• Useful if trade shared for presentation, hidden trade fiat|currency info)
🔸 ‘Header’ (color for trade table first row)
🔸 ‘Stats’ (color for trade table statistics row)
🔸 ‘Text’ (color for trade table text)
🔸 ‘Error’ (color for all errors if is made when trade is setup)
• Color for errors is for trade table and trade labels
🔸 ‘Fiat Price’ (by default enabled, show info for second fiat*
* if trade is in crypto and ‘quoted’ currency is not stable coin, like ETHBTC, or ‘Account Type’ is set to different currency
🔸 ‘Live Fiat Price’ (if ‘quoted’ currency enabled will show live exchange conversion)
🔸 ‘All Errors’ (enabled by default, show all error if trade setup is wrong)
• When error shows on trade, disabled this to see what|where is error
• Check below for more details
🔸 ‘Tool Tip (chart)’ (enabled show all tooltip on chart)
• Check below for more details
• When you are familiar with indicator, disable popup tooltip
💎 TOOLTIP
All possible tooltips have been added for easier understanding, especially for traders who are just learning how to place a trade. (when you perfect this indicator, you can turn off the tooltip in settings, and you can also normally use the lite version of this indicator, which does not contain all these futures)
🔸 ' Settings Tooltips’
🔸 ‘Chart Tooltips’
🔸 ‘Table Tooltips’
🔴 ERRORS
When you setup trade, not only a novice in trading, but also experienced traders can make a mistake and for this reason all possible errors are included in the indicator which will be shown on the chart by changing the color of the labels as well as on the trade table and in most of the cases and error text.
If the tooltip is enabled in the settings, you can see the reason for the error as well as the solution.
Here are some examples of possible errors.
Stay safe
PLAN YOUR TRADE AND TRADE YOUR PLAN
Risk Management GO8686: Stop Loss, Position Size & TargetFull Name: Risk Management GO8686: Stop Loss, Position Size & Target
What this indicator provides:
A dashboard to calculate Stop Loss, Position Size and Target, where users can customize Risk Management parameters in the setting.
Position Size: calculated from "initialCapital", "Leverage", "Max Loss", "feeMaker", "feeTaker".
Stop Loss Price: using pivots, default length is set to 3, with an extra ATR value controlled by "'Multiplier OF Extra ATR".
Target: calculated from entry price, risk reward, distance between entry and stop loss, fees
What the indicator does Not provides:
entries of positions: The Long/Short entries displayed are just MACD signal crossing zero, users can apply their own entry logic, by modifying ready2L / ready2S variables.
What the indicator does Not guarantee:
the integrity, timeliness, accuracy, and comprehensiveness of the data, calculation method, calculation results, etc.
Two types labels:
1. Automated labels: they are displayed when MACD signal crossing zero, use "Display History Labels" to toggle display or not.
2. Setup Manually label: located at the right side of the latest bar, to display results when users setup manually
The settings of the indicator:
"Toggle to Reload",
"InitialCapital", "Leverage", "Max Loss % per trade", "feeMaker", "feeTaker",
4 length inputs for Pivot, "Multiplier of Extra ATR for stop loss",
"Toggle To setup manually", "Toggle between Long / Short", "Entry Price, set manually", "Stop Loss Price, set manually", "Risk-Reward Ratio"
"Display History Labels"
---------- Disclaimer ----------
Before using or requesting access to the indicator, customers/users acknowledge that they have read and accepted that the indicator, any associated contents on all social medias and any communication with the indicator author, including but not limited to: product and service details, signals, alerts, data, calculation methods, calculation results, user manual, tutorials, ideas, videos, chats, messages, emails, blogs, tweets, etc. are provided solely for educational purpose and Not as financial advice. Customers/users understand and agree to use the aforementioned indicator and information at their own risk.
---------- Updates ----------
The latest updates override the previous content.
To activate a update, if it does not load as expected: close the indicator, save the chart, clear browser caches, restart the browser, reload the chart and apply the indicator to the chart.

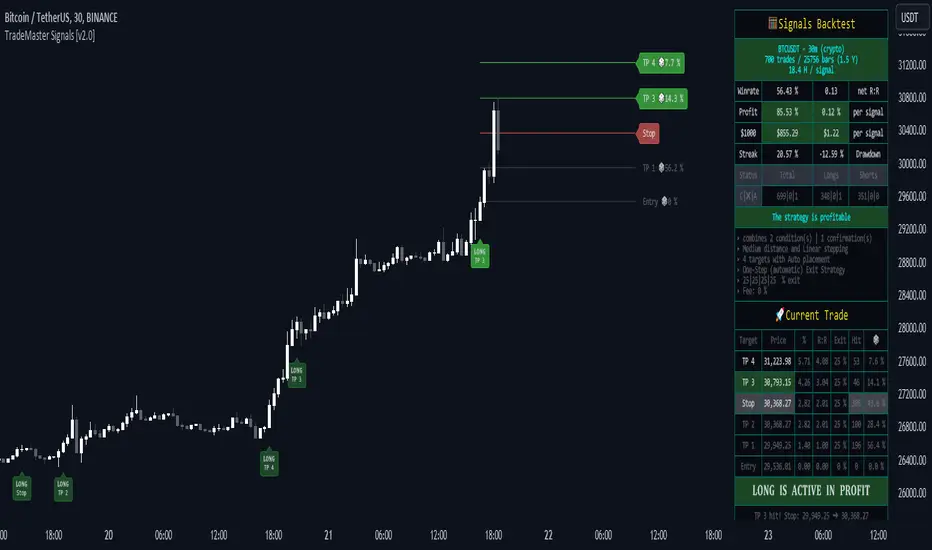
TradeMaster SignalsTrading effectively requires a range of techniques, experience, and expertise. From technical analysis to market fundamentals, traders must navigate multiple factors, including market sentiment and economic conditions. However, traders often find themselves overwhelmed by market noise, making it challenging to filter out distractions and make informed decisions. To address this, we present a powerful indicator package designed to assist traders on their journey to success.
The TradeMaster indicator package encompasses a variety of trading strategies, including the SMC (Supply, Demand, and Price Action) approach, along with many other techniques. By leveraging concepts such as price action trading, support and resistance analysis, supply and demand dynamics, these indicators can empower traders to analyze entry and exit positions with precision. Unlike other forms of technical analysis that produce values or plots based on historical price data, Price Action brings you the facts straight from the source - the current price movements.
The indicator package consists of three powerful indicators that can be used individually or together to maximize trading effectiveness.
⭐ About the Signals Indicator
This indicator offers a unique opportunity for traders to design their own personalized trading strategy. It has a built-in backtesting system, which allows you to thoroughly analyze the performance of your strategy before implementing it in live trading. With the ability to customize and test your strategy using historical data, the Signals indicator empowers you to make data-driven decisions and refine your trading approach.
👉 How does it work?
The Signals indicator provides users with the ability to select trigger conditions and further narrow them down using confirmations.
Conditions are quantitative factors that influence the generation of signals on the chart and in the backtest table. You can enable multiple conditions to create a comprehensive set of criteria for signal generation.
Confirmations, on the other hand, are qualitative factors that selectively filter out conditions based on their alignment with the chosen confirmations. This helps refine the signals and provide more targeted trading opportunities. Multiple confirmations can be enabled to further enhance the precision of the signals.
A well-balanced strategy in the Signals indicator involves carefully selecting a combination of conditions and confirmations to generate accurate trading signals. Finding the right balance between them is crucial for consistent and profitable trading.
To offer even more flexibility, the Signals indicator includes two powerful main functions:
Target Placement System: This feature allows you to set up to 6 targets with a stop loss level and partial exit percentages. You can choose between automatic target creation or manual customization, giving you control over your profit targets.
Exit Strategy: With this feature, you can define your preferred trailing stop strategy, allowing you to implement a systematic approach to exiting trades. By setting appropriate trailing stop levels, you can limit potential losses, while the system secures profits by automatically closing positions partially when certain price targets are reached. This may help you to maintain discipline in your trading and optimize your risk-reward ratio.
With over 30 unique conditions, 10 confirmations, and the deep Target Placement and Exit Strategy systems, the Signals indicator offers a vast array of possibilities. In fact, there are potentially millions of different strategy outputs available for each ticker. Despite its complexity, the script remains lightweight and fast, ensuring smooth performance.
The Signals Backtest table provides a comprehensive overview of your strategy's performance. You can track your current position with all the necessary details, allowing you to monitor your trades effectively and make informed decisions based on the backtest results.
⚠️ WARNING!
Backtest results do not guarantee future performance. Strategies tested on synthetic data may not accurately represent real-world results. Testing should be conducted on charts that reflect actual closing prices.
The indicator displays buy/sell signals intended to support traders' analysis. There are numerous possibilities and combinations available to create your own unique strategies, whether trading with or against the trend or capturing oversold bounces. These are just a few of the many options! Our indicator can easily be tailored to fit your trading strategy.
The settings that influence the signal-generating algorithm play a crucial role in effectively utilizing the signals. We provide users with the flexibility to modify the settings to align with their trading style, while also offering simple adjustment methods using various techniques.
Each method for modifying the signal settings has been designed to meet specific user needs. It is important to understand that one method is not necessarily more accurate than another.
It is essential to understand that signal indications generally serve as trend confirmations, rather than direct entry and exit points. Focusing on the easy use of signal settings and utilizing other functionalities in our toolkit will likely be a better decision than attempting to find the "holy grail" of optimized signal settings and solely relying on following the signals.
⭐ Conclusion
We hold the view that the true path to success is the synergy between the trader and the tool, contrary to the common belief that the tool itself is the sole determinant of profitability. The actual scenario is more nuanced than such an oversimplification. Our aim is to offer useful features that meet the needs of the 21st century and that we actually use.
🛑 Risk Notice:
Everything provided by trademasterindicator – from scripts, tools, and articles to educational materials – is intended solely for educational and informational purposes. Past performance does not assure future returns.
Risk to Reward - FIXED SL BacktesterDon't know how to code? No problem! TradingView is an excellent platform for you. ✅ ✅
If you have an indicator that you want to backtest using a risk-to-reward ratio or fixed take profit/stop loss levels, then the Risk to Reward - FIXED SL Backtester script is the perfect solution for you.
introducing Risk to Reward - FIXED SL Backtester Script which will allow you to test any indicator / Signal with RR or Fixed SL system
How does it work ?!
Once you connect the script to your indicator, it will analyze your entry points and perform calculations based on them. It will then open trades for you according to the specified inputs in the script settings.
HOW TO CONNECT IT to your indicator?
simply open your indicator code and add the below line of code to it
plot(Signal ? 100 : 0,"Signal",display = display.data_window)
Replace Signal with the long condition from your own indicator. You can also modify the value 100 to any number you prefer. After that, open the settings.
Once the script is connected to your indicator, you can choose from two options:
Risk To Reward Ratio System
Fixed TP/ SL System
🔸if you select the Risk to Reward System ⤵️
The Risk-to-Reward System requires the calculation of a stop loss. That's why I have included three different types of stop-loss calculations for you to choose from:
ATR Based SL
Pivot Low SL
VWAP Based SL
Your stop loss and take profit levels will be automatically calculated based on the selected stop loss method and your risk-to-reward ratio.
You can also adjust their values to match your desired risk level. The trades will be displayed on the chart.
with the ability to change their values to match your risk.
once this is done, trades will be displayed on the chart
🔸if you select the Fixed system ⤵️
You have 2 inputs, which are FIXED TP & Fixed SL
input the values you want, and trades will be on your chart...
I have also added a Breakeven feature for you.
with this Breakeven feature the trade will not just move SL to Entry ?! NO NO, it will place it above entry by a % you input yourself, so you always win! 🚀
Here is an example
Enjoy, and have fun, if you have any questions do not hesitate to ask

Forex Risk CalculatorForex Risk Calculator 's logical is bring the differential between Entry price and Stoploss price, your acceptable risk and your account size to calculate the loss size first then convert to the 'Lot size' and have another feature like auto scale static target calculate by your loss size with RRR (Risk Reward Ratio). Give you to get easier to manage your orders.
Key Features:
📈 Real-time Risk Assessment: Enter the amount you are willing to risk, and Forex Risk Calculator will calculate the appropriate position size for your trade in real-time.
🎯 Target Lines and Static Target Prices based on RRR: Set your desired Risk-Reward Ratio (RRR), and let Forex Risk Calculator auto-generate target prices according to your RRR. Additionally, place target lines to visualize the expected profit if the price hits that line.
⚙️ Customizable Parameters: Adjust risk percentage, RRR, and other parameters to tailor the tool to your trading strategy.
👁️ User-Friendly Interface: Forex Risk Calculator features an easy-to-use and intuitive interface for both beginners and seasoned traders.
Usage:
Step 1: Place your entry price
Step 2: Place your stoploss price
Step 3: Place your target price
Step 4: Confirm your account detail
Step 5: Bring the 'Lot size' to use
Parameter:
Initial account size
Risk percent
Entry price
Stop price
Target price
Show your target price
Show static target prices
Number of your static target prices
Table position
Text size
Background color
Text color
Border color
Output:
Chart
Entry price line
Stop loss price line (loss in USD)
Target price line (profit in USD)
Table
Account size
Risk percent
Entry price
Stoploss price
Lot size
Risk ManagementLibrary "RiskManagement"
This library keeps your money in check, and is used for testing and later on webhook-applications too. It has four volatility functions and two of them can be used to calculate a Stop-Loss, like Average True Range. It also can calculate Position Size, and the Risk Reward Ratio. But those calculations don't take leverage into account.
position_size(portfolio, risk, entry, stop_loss, use_leverage, qty_as_integer)
This function calculates the definite amount of contracts/shares/units you should use to buy or sell. This value can used by `strategy.entry(qty)` for example.
Parameters:
portfolio (float) : This is the total amount of the currency you own, and is also used by strategy.initial_capital, for example. The amount is needed to calculate the maximum risk you are willing to take per trade.
risk (float) : This is the percentage of your Portfolio you willing to loose on a single trade. Possible values are between 0.1 and 100%. Same usecase with strategy(default_qty_type=strategy.percent_of_equity,default_qty_value=100), except its calculation the risk only.
entry (float) : This is the limit-/market-price for the investment. In other words: The price per contract/share/unit you willing to buy or sell.
stop_loss (float) : This is the limit-/market-price when to exit the trade, to minimize your losses.
use_leverage (bool) : This value is optional. When not used or when set to false then this function will let you invest your portfolio at max.
qty_as_integer (bool) : This value is optional. When set to true this function will return a value used with integers. The largest integer less than or equal to the given number. Because some Broker/Exchanges let you trade hole contracts/shares/units only.
Returns: float
position_size_currency(portfolio, risk, entry, stop_loss)
This function calculates the definite amount of currency you should use when going long or short.
Parameters:
portfolio (float) : This is the total amount of the currency you own, and is also used by strategy.initial_capital, for example. The amount is needed to calculate the maximum risk you are willing to take per trade.
risk (float) : This is the percentage of your Portfolio you willing to loose on a single trade. For example: 1 is 100% and 0,01 is 1%. Default amount is 0.02 (2%).
entry (float) : This is the limit-/market-price for the current investment. In other words: The price per contract/share/units you willing to buy or sell.
stop_loss (float) : This is the limit-/market-price when to exit the trade, to minimize your losses.
Returns: float
rrr(entry, stop_loss, take_profit)
This function calculates the Risk Reward Ratio. Common values are between 1.5 and 2.0 and you should not go lower except for very few special cases.
Parameters:
entry (float) : This is the limit-/market-price for the investment. In other words: The price per contract/share/unit you willing to buy or sell.
stop_loss (float) : This is the limit-/market-price when to exit the trade, to minimize your losses.
take_profit (float) : This is the limit-/market-price when to take profits.
Returns: float
change_in_price(length)
This function calculates the difference between price now and close price of the candle 'n' bars before that. If prices are very volatile but closed where they began, then this method would show zero volatility. Over many calculations, this method returns a reasonable measure of volatility, but will always be lower than those using the highs and lows.
Parameters:
length (int) : The length is needed to determine how many candles/bars back should take into account.
Returns: float
maximum_price_fluctuation(length)
This function measures volatility over most recent candles, which could be used as an estimate of risk. It may also be effective as the basis for a stop-loss or take-profit, like the ATR but it ignores the frequency of directional changes within the time interval. In other words: The difference between the highest high and lowest low over 'n' bars.
Parameters:
length (int) : The length is needed to determine how many candles/bars back should take into account.
Returns: float
absolute_price_changes(length)
This function measures volatility over most recent close prices. This is excellent for comparing volatility. It includes both frequency and magnitude. In other words: Sum of differences between second to last close price and last close price as absolute value for 'n' bars.
Parameters:
length (int) : The length is needed to determine how many candles/bars back should take into account.
Returns: float
annualized_volatility(length)
This function measures volatility over most recent close prices. Its the standard deviation of close over the past 'n' periods, times the square root of the number of periods in a year.
Parameters:
length (int) : The length is needed to determine how many candles/bars back should take into account.
Returns: float
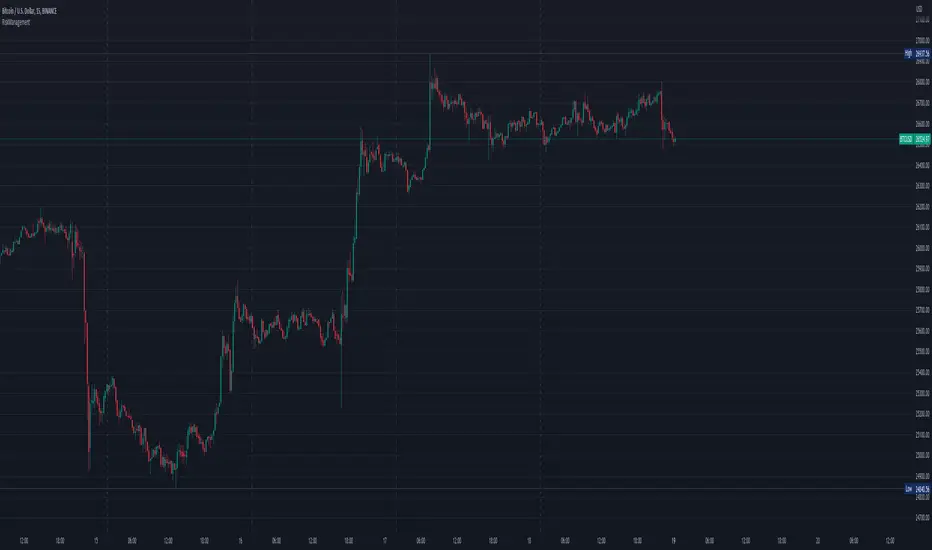
Crypto Risk CalculatorCrypto Risk Calculator 's logical is bring the differential between Entry price and Stoploss price, your acceptable risk and your account size to calculate the loss size first then convert to the 'Amount coins' and have another feature like auto scale static target calculate by your loss size with RRR (Risk Reward Ratio). Give you to get easier to manage your orders. *** Create to use for Cryptocurrencies Future market ***
Key Features:
📈 Real-time Risk Assessment: Enter the amount you are willing to risk, and Crypto Risk Calculator will calculate the appropriate position size for your futures trade in real-time.
🎯 Target Lines and Static Target Prices based on RRR: Set your desired Risk-Reward Ratio (RRR), and let Crypto Risk Calculator auto-generate target prices according to your RRR. Additionally, place target lines to visualize the expected profit if the price hits that line.
⚙️ Customizable Parameters: Adjust risk percentage, RRR, and other parameters to tailor the tool to your trading strategy.
👁️ User-Friendly Interface: Crypto Risk Calculator features an easy-to-use and intuitive interface for both beginners and seasoned traders.
Usage:
Step 1: Place your entry price
Step 2: Place your stop loss price
Step 3: Place your target price
Step 4: Confirm your account detail
Step 5: Bring the 'Amount coins' to use
Parameter:
Initial account size
Risk percent
Leverage
Entry price
Stop price
Target price
Show your target price
Show static target prices
Number of your static target prices
Table position
Text size
Background color
Text color
Border color
Data output:
Chart
Entry price line
Stop loss price line (loss in base unit currency)
Target price line (profit in base unit currency)
Table
Account size
Risk percent
Leverage
Margin
Entry price
Stoploss price
Amounts coin

Risk-Adjusted Return OscillatorThe Risk-Adjusted Return Oscillator (RAR) is designed to aid traders in predicting future price action by analysing the risk-adjusted performance of an asset. This oscillator is displayed directly on the price chart, unlike other oscillators.
By considering the risk-return relationship, the indicator helps identify periods of overvaluation or undervaluation, allowing traders to anticipate potential price reversals or trend accelerations.
HOW TO USE
The Risk-Adjusted Return Oscillator analyses the risk-adjusted performance of an asset to detect price reversals and accelerations. Here's how to interpret its signals:
Ranging Market:
Overbought Signal: When the RAR curve reaches the overbought level (upper red line), it suggests a potential reversal signal. It indicates that the asset may be overvalued, and a price correction or trend reversal could occur.
Oversold Signal: When the RAR curve reaches the oversold level (lower red line), it indicates a potential reversal signal. It suggests that the asset may be undervalued, and a price correction or trend reversal could take place.
Trending Market:
Overbought Signal: In a trending market, an overbought signal (RAR curve reaching upper red line) suggests trend acceleration. It indicates that the existing trend is gaining strength, and buying pressure is increasing.
Oversold Signal: In a trending market, an oversold signal (RAR curve reaching lower red line) also signifies trend acceleration. It suggests that the prevailing trend is intensifying, and selling pressure is increasing.
Thus, it's important to consider the market context when interpreting overbought and oversold signals. In ranging markets, these signals act as potential reversal points. However, in trending markets, they indicate trend acceleration, reinforcing the current price direction.
SETTINGS
Period Length: Adjust the number of bars used to calculate returns and standard deviation.
Smoothing: Define the smoothing period for the RAR curve.
Show Overbought/Oversold Signals: Choose whether to display triangular shapes for overbought and oversold conditions.

Take profit and Stop Loss ATR HL [Tcs] | ALGOThis indicator helps traders set stop loss and take profit levels based on either ATR or High-Low range.
The indicator calculates stop loss and take profit levels for both long and short positions, based on the user's input of ATR length, ATR smoothing method, and multiplier levels for each level. It’s possible to set 3 levels of take profit, for both long and short trades.
The indicator also includes the option to show or hide levels, bands, and labels for the calculated stop loss and take profit levels.
Additionally, the indicator has a function to calculate the user's risk based on their account balance, risk percentage, and broker fees.
Overall, this indicator can be helpful for traders who use stop loss and take profit levels in their trading strategies and want a visual representation of those levels on their charts.
Please note that this indicator is for educational purposes only and should not be used for trading without further testing and analysis.

Pinescript Risk Reward boxes + Custom 'Time Elapsed' MarkersUsing Pinescript to create custom Risk Reward Ratio (RRR) boxes with custom vertical time markers to help traders stay mindful of how long they've been in a trade.
//Usage:
-Add indicator to chart and you'll be prompted to click three times:
-- 1: Choose time (clicking last bar will mark entry as current candle's open).
-- 2: Click BOX TOP of RRR box on chart (long or short is toggled later).
-- 3: Click BOX BOTTOM of RRR box on chart (long or short is toggled later).
- then toggle Long or short in the dialog box.
-toggle on/off vertical time line markers (as reminder of how long you've been sat in your trade).
-User input choice of time line marker spacings (in minutes).
//Notes:
-Percentage reward and percentage risk are displayed in each of the risk reward boxes. Risk-Reward ratio is also displayed in the upper box.
-Bars to extend the RRR box to the right is also a custom user input.
-Note the 'entry' of the trade will always be the open of the candle you click on (the first click on loading the indicator).
-You can drag the vertical entry time and the horizontal box-top and box-bottom times dynamically, as you like, as trade progresses.
//Use-Case:
-I wanted a RRR box which gave me custom vertical time markers to keep me mindful of overstaying my welcome in a trade that likely was running out of steam and wasn't likely to go my way. Forcing me to stay nimble. I have found in daytrading that if a trade doesn't go your way promptly, it's often not a good one to hold.
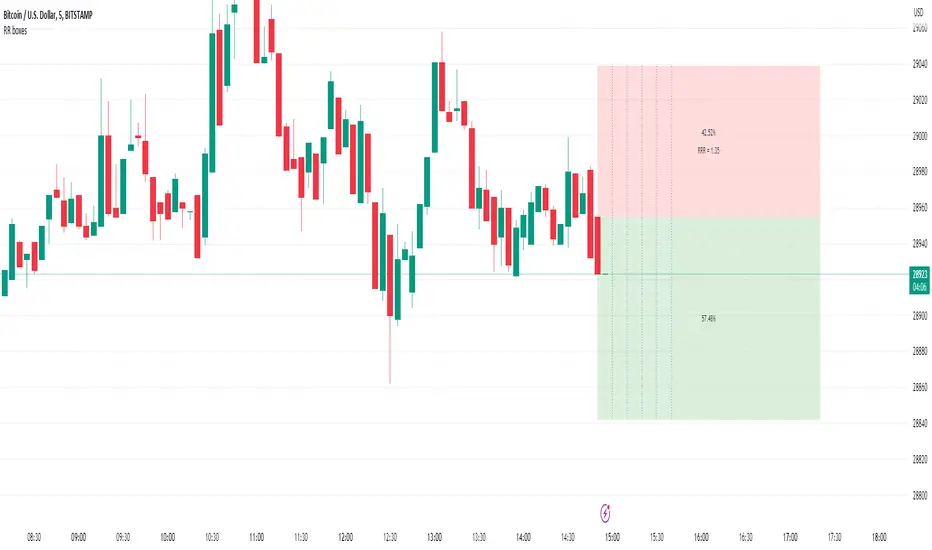
Risk Reward Calculator [lovealgotrading]
OVERVIEW:
This Risk Reward Calculator strategy can help you maximize your RR value with help of algorithmic trading.
INDICATOR:
I wanted to setup my trades more easier with this indicator, I didn't want to calculate everytime before orders, with help this indicator we can calculate R:R value, avarage price, stoploss price, take-profit price, order prices, all position cost and more ...
Our strategy is a risk revard calculation indicator that is made easy to use by using visualized lines and panels, and also has algorithmic trading support.
With the help of this indicator, we can quickly and easily calculate our risk reward values and enter the positions.
If we want to ensure that our balance grows regularly while trading in the stock market, we need to manage the risks and rewards otherwise we may fall below our initial balance at the end of the day, even if we seem to be winning.
What is the Risk-Reward value ?
This value is a value that shows how many times the amount of risk we take when entering the position is successful, we will earn.
- For example, you risked $100 while entering the trade, so if your trade stops, you will lose 100 $.
Your Risk-Reward(RR) value is 2 means that if your position is successful, you will have 200 $ in your pocket.
A trader's success is determined by the amount of R he earns monthly or yearly, not how much money he makes.
What is different in this indicator ?
I want to say thank you to © EvoCrypto. His Calculator (weighted) – evo indicator helped me when I was developed my indicator.
I want to explain what I have improved:
1-In this strategy, we can determine the time period in which we want to open our positions.
2-We can open a maximum of 4 positions in the same direction and close our positions at a single level. StopLoss or TakeProfit
3-This indicator, which works in the form of a strategy, shows where our positions have been opened or closed. With the help of this, it helps us to determine our strategy in our future positions more accurately.
4-The most important improvement is that we do not miss our positions with the help of alarms (WEB HOOK). if we want, we receive by quickly connecting all these positions to our robot, the software can enter and exit the position while we are busy.
IMPLEMENTATION DETAILS – SETTINGS:
1 - We can set the start and end dates of the positions we will take.
2- We can set our take profit, stoploss levels.
3- If your trade is stopped, we can determine the amount of the trade that we will lose.
4- We can adjust our entry levels to positions and our position sizes at entry levels.
(Sum of positions weight must be 100%)
5- We can receive our positions even if we are busy with the help of algorithmic trading. For this, we must paste our Jshon codes into the fields specified in the settings panel.
6- Finally, we can change the settings we want and don't want to have in our visual elements.
Let's make a LONG side example together
We have determined our positions to enter stoploss, take profit and long positions. We did not forget to set the start time of our strategy
Our strategy appear on the graph as follows.
Our strategy has calculated the total position size, our R-R value, the distance of the current price to the stop and take profit levels, in short, a lot of things we could look visually.
Notes:
If you're going to connect this bot to an automatic Long or Short direction,
Don’t forget! you need to Webhook URL,
Don’t miss paste this code to your message window {{strategy.order.alert_message}}
ALSO:
If you have any ideas what to add to my work to add more sources or make calculations cooler, feel free to write me.

Scalper's toolkit - ATR WidgetWidget specifically designed for scalping. Many settings to fit the instrument and view preferences to make it fit into your chart window how you like, even on mobile.
** I have 5 other features to add into this in the very near future, as I use this as my primary tool for Risk reward. This script will be updated in the near future as more features are coded into it. See bottom for notes on plans
Features:
Displays a quick view of the ATR value on the chart, in decimal PIPs or directly in Points - a key value for scalping using the DOM for point value settings and one click trading on fast time frames.
Automatic calculation of stop and target distance for a predetermined Risk Reward Ratio (Set with the settings panel), and then also displayed in PIPs or Points for easy use in quick trading.
Works on most all instruments/pairs/cryptos with multiple precision levels for correct values to be shown in the widget.
Fully customizable -
ATR period Base setting, just like a normal ATR indicator
Display in : PIPs or Points
ATR based stop distance, using a multiplier. 2 is the most common multiplier used, and the default setting.
Risk Reward Calculation using the Stop Loss value.
-Quickly helps with proper target and stop sizing for the volatility in the price on the current trade entry point.
-Set to any ratio you wish, from 1:0.1 all the way to 1:100 or more, unlimited R ratio settings to fit your strategy and risk tolerances.
Position anywhere on the chart window with 9 preset locations available (Pine script limitation)
Show as a column layout or a row layout
Customize the Size, with 5 preset widget sizes, from tiny to huge (Pine script limitation)
-Mobile Friendly - Tiny or Small may be too small on PC, but can be used for Mobile so the widget does not become too large over the chart.
Custom text, background, and boarder colors
Custom Boarder Size - 0 size is no boarder
Set up:
-Open the settings panel.
First section is the basic settings for the ATR - the length (Default is 14) and to use a PIP value display, or Point value display.
Here you also see a "Precision" Setting. **Because each instrument returns different precision ATR values, it is difficult to determine with code what those values will be ahead of time to do the math in the background. Even some 2 decimal instruments return 5 decimal ATR values, so this setting filters that** Just use the dropdown and choose how many decimal places the instrument has from 2 - 5 decimals
The second section is for risk and reward calculations, and can be disabled if you do not want to see these values.
The first value is the "ATR Multiplier" Typically, a 2x multiplier is used on the ATR to determine how far away to place your stop loss from the entry, placing it out of harm's way from normal market activity.
The second value is the Reward target distance, based from the stop loss size. This quickly calculates your target to match your intended reward ratio, saving some manual work to calculate this by hand every trade.
** Note: because of the math used in the code, you may see odd values on some instruments, like indexes. If you have the precision correct, try changing the "Show in Pips" to "Show in Points", as this may solve the issue.
The last two sections are purely for how the widget looks and how/where it shows on the screen. These can be set however you like. To have no boarder, just set the "Frame size" value to 0.
Additional Updates planned:
Pip value calculation (2 feature uses)
-This will serve 2 purposes. The widget will calculate the value of the trade based on the lot size. It will also have a risk limit, so if the ATR get's too high for the current risk settings, It will show red to warn you of a high risk situation before you trade.
Example, you have a set limit of 3 dollars per trade using .02 lot sizing. If the ATR get's too high, The Stop value will be more risk than you would like to use at that trade sizing. Reduce the trade size, or wait for ATR to come lower.
Purpose 2: lot size calculation, so if you wanted to maximize the use of risk available. If you wanted to risk 600 for example, it would use the ATR you have set for the risk, and determine the proper lot size for the amount of volatility in the market. This way, you Risk Exactly, or as close as possible to 600 for the the current trade conditions.
Extra use for this value: Show the Current trade amounts at risk and for gain in money values on the side of the pip/point value. Know what you're risking and also trading for in monetary value.
ATR candle Comparison- Early momentum Detection (2 feature uses)
Will show an additional section on the bottom of the widget to show how each candle compares to the one before, up to the last 5, and show if ATR went down, up, or stayed the same over the last 5 candles.
Show an additional symbol to indicate the current candle status in comparison to the close of the last candle. Real time of if the ATR is getting larger, smaller, or staying the same.
