Stocks Above 5-Day Average (FOMO)Overview
Inspired by Matt Carusos's FOMO indicator, this breadth indicator is designed to provide a visual representation of the percentage of stocks within major indices that are trading above their 5-day moving average.
Functionality
The indicator plots the percentage of stocks trading above their 5-day moving average for the following indices:
S&P 500
Nasdaq
Russell 2000
Dow Jones
All Markets (MMFD)
The indicator includes two horizontal lines:
Upper Threshold: Default at 85%
Lower Threshold: Default at 15%
These lines are used to identify potential overbought (above upper threshold) or oversold (below lower threshold) conditions.
Plot Shapes:
Small circles are plotted at the points where the percentage of stocks crosses the upper or lower thresholds, with colors matching the respective index.
Table:
The current percentage of stocks above the 5-day average for each index.
A warning sign (⚠️) is shown in the table if the percentage crosses the upper or lower threshold, regardless of whether the index plot is enabled or not.
Tìm kiếm tập lệnh với " TABLE"

RSI Analysis with Statistical Summary Scientific Analysis of the Script "RSI Analysis with Statistical Summary"
Introduction
I observed that there are outliers in the price movement liquidity, and I wanted to understand the RSI value at those points and whether there are any notable patterns. I aimed to analyze this statistically, and this script is the result.
Explanation of Key Terms
1. Outliers in Price Movement Liquidity: An outlier is a data point that significantly deviates from other values. In this context, an outlier refers to an unusually high or low liquidity of price movement, which is the ratio of trading volume to the price difference between the open and close prices. These outliers can signal important market changes or unusual trading activities.
2. RSI (Relative Strength Index): The RSI is a technical indicator that measures the speed and change of price movements. It ranges from 0 to 100 and helps identify overbought or oversold conditions of a trading instrument. An RSI value above 70 indicates an overbought condition, while a value below 30 suggests an oversold condition.
3. Mean: The mean is a measure of the average of a dataset. It is calculated by dividing the sum of all values by the number of values. In this script, the mean of the RSI values is calculated to provide a central tendency of the RSI distribution.
4. Standard Deviation (stdev): The standard deviation is a measure of the dispersion or variation of a dataset. It shows how much the values deviate from the mean. A high standard deviation indicates that the values are widely spread, while a low standard deviation indicates that the values are close to the mean.
5. 68% Confidence Interval: A confidence interval indicates the range within which a certain percentage of values of a dataset lies. The 68% confidence interval corresponds to a range of plus/minus one standard deviation around the mean. It indicates that about 68% of the data points lie within this range, providing insight into the distribution of values.
Overview
This Pine Script™, written in Pine version 5, is designed to analyze the Relative Strength Index (RSI) of a stock or other trading instrument and create statistical summaries of the distribution of RSI values. The script identifies outliers in price movement liquidity and uses this information to calculate the frequency of RSI values. At the end, it displays a statistical summary in the form of a table.
Structure and Functionality of the Script
1. Input Parameters
- `rsi_len`: An integer input parameter that defines the length of the RSI (default: 14).
- `outlierThreshold`: An integer input parameter that defines the length of the outlier threshold (default: 10).
2. Calculating Price Movement Liquidity
- `priceMovementLiquidity`: The volume is divided by the absolute difference between the close and open prices to calculate the liquidity of the price movement.
3. Determining the Boundary for Liquidity and Identifying Outliers
- `liquidityBoundary`: The boundary is calculated using the Exponential Moving Average (EMA) of the price movement liquidity and its standard deviation.
- `outlier`: A boolean value that indicates whether the price movement liquidity exceeds the set boundary.
4. Calculating the RSI
- `rsi`: The RSI is calculated with a period length of 14, using various moving averages (e.g., SMA, EMA) depending on the settings.
5. Storing and Limiting RSI Values
- An array `rsiFrequency` stores the frequency of RSI values from 0 to 100.
- The function `f_limit_rsi` limits the RSI values between 0 and 100.
6. Updating RSI Frequency on Outlier Occurrence
- On an outlier occurrence, the limited and rounded RSI value is updated in the `rsiFrequency` array.
7. Statistical Summary
- Various variables (`mostFrequentRsi`, `leastFrequentRsi`, `maxCount`, `minCount`, `sum`, `sumSq`, `count`, `upper_interval`, `lower_interval`) are initialized to perform statistical analysis.
- At the last bar (`bar_index == last_bar_index`), a loop is run to determine the most and least frequent RSI values and their frequencies. Sum and sum of squares of RSI values are also updated for calculating mean and standard deviation.
- The mean (`mean`) and standard deviation (`stddev`) are calculated. Additionally, a 68% confidence interval is determined.
8. Creating a Table for Result Display
- A table `resultsTable` is created and filled with the results of the statistical analysis. The table includes the most and least frequent RSI values, the standard deviation, and the 68% confidence interval.
9. Graphical Representation
- The script draws horizontal lines and fills to indicate overbought and oversold regions of the RSI.
Interpretation of the Results
The script provides a detailed analysis of RSI values based on specific liquidity outliers. By calculating the most and least frequent RSI values, standard deviation, and confidence interval, it offers a comprehensive statistical summary that can help traders identify patterns and anomalies in the RSI. This can be particularly useful for identifying overbought or oversold conditions of a trading instrument and making informed trading decisions.
Critical Evaluation
1. Robustness of Outlier Identification: The method of identifying outliers is solely based on the liquidity of price movement. It would be interesting to examine whether other methods or additional criteria for outlier identification would lead to similar or improved results.
2. Flexibility of RSI Settings: The ability to select various moving averages and period lengths for the RSI enhances the adaptability of the script, allowing users to tailor it to their specific trading strategies.
3. Visualization of Results: While the tabular representation is useful, additional graphical visualizations, such as histograms of RSI distribution, could further facilitate the interpretation of the results.
In conclusion, this script provides a solid foundation for analyzing RSI values by considering liquidity outliers and enables detailed statistical evaluation that can be beneficial for various trading strategies.

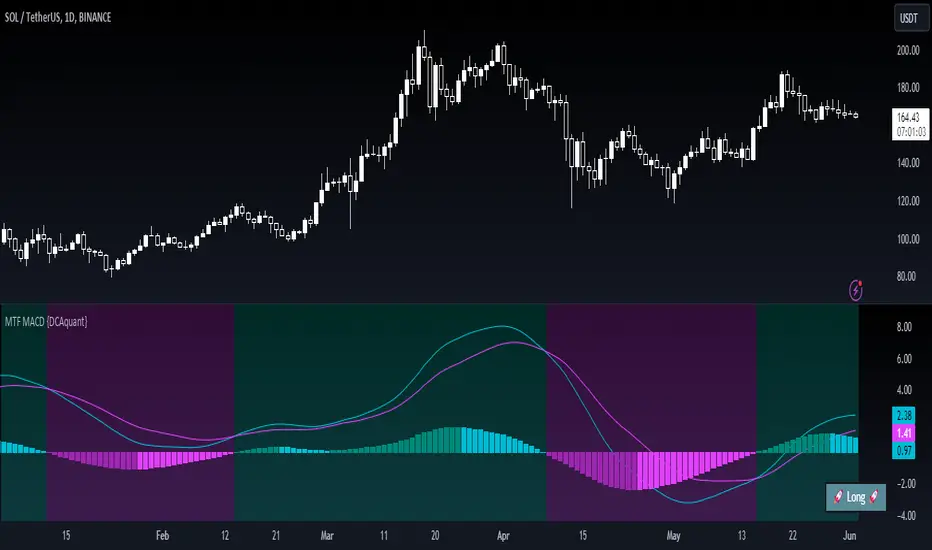
Multi Timeframe Moving Average Convergence Divergence {DCAquant}Overview
The MTF MACD indicator provides a unique view of MACD (Moving Average Convergence Divergence) and Signal Line dynamics across various timeframes. It calculates the MACD and Signal Line for each selected timeframe and aggregates them for analysis.
Key Features
MACD Calculation
Utilizes standard MACD calculations based on user-defined parameters like fast length, slow length, and signal smoothing.
Determines the difference between the MACD and Signal Line to identify convergence or divergence.
Multiple Timeframe Analysis
Allows users to select up to six different timeframes for analysis, ranging from minutes to days, providing a holistic view of market trends.
Calculates MACD and Signal Line for each timeframe independently.
Aggregated Analysis
Combines MACD and Signal Line values from multiple timeframes to derive a consolidated view.
Optionally applies moving average smoothing to aggregated MACD and Signal Line values for better clarity.
Position Identification
Determines the trading position (Long, Short, or Neutral) based on the relationship between MACD and Signal Line.
Considers the proximity of MACD and Signal Line to identify potential trading opportunities.
Visual Representation
Plots MACD and Signal Line on the price chart for visual analysis.
Utilizes color-coded backgrounds to indicate trading conditions (Long, Short, or Neutral) for quick interpretation.
Dynamic Table Display
Displays trading position alongside graphical indicators (rocket for Long, snowflake for Short, and star for Neutral) in a customizable table.
Offers flexibility in table placement and size for user preference.
How to Use
Parameter Configuration
Adjust parameters like fast length, slow length, and signal smoothing to fine-tune MACD calculations.
Select desired timeframes for analysis based on trading preferences and market conditions.
Interpretation
Monitor the relationship between MACD and Signal Line on the price chart.
Pay attention to color-coded backgrounds and graphical indicators in the table for actionable insights.
Decision Making
Consider entering Long positions when MACD is above the Signal Line and vice versa for Short positions.
Exercise caution during Neutral conditions, as there may be uncertainty in market direction.
Risk Management
Combine MTF MACD analysis with risk management strategies to optimize trade entries and exits.
Set stop-loss and take-profit levels based on individual risk tolerance and market conditions.
Conclusion
The Multi Timeframe Moving Average Convergence Divergence (MTF MACD) indicator offers a robust framework for traders to analyze market trends across multiple timeframes efficiently. By combining MACD insights from various time horizons and presenting them in a clear and actionable format, it empowers traders to make informed decisions and enhance their trading strategies.
Disclaimer
The Multi Timeframe Moving Average Convergence Divergence (MTF MACD) indicator provided here is intended for educational and informational purposes only. Trading in financial markets involves risk, and past performance is not indicative of future results. The use of this indicator does not guarantee profits or prevent losses.
Please be aware that trading decisions should be made based on your own analysis, risk tolerance, and financial situation. It is essential to conduct thorough research and seek advice from qualified financial professionals before engaging in any trading activity.
The MTF MACD indicator is a tool designed to assist traders in analyzing market trends and identifying potential trading opportunities. However, it is not a substitute for sound judgment and prudent risk management.
By using this indicator, you acknowledge that you are solely responsible for your trading decisions, and you agree to indemnify and hold harmless the developer and distributor of this indicator from any losses, damages, or liabilities arising from its use.
Trading in financial markets carries inherent risks, and you should only trade with capital that you can afford to lose. Exercise caution and discretion when implementing trading strategies, and consider seeking independent financial advice if necessary.
Multi-Timeframe Momentum Indicator [Ox_kali]The Multi-Timeframe Momentum Indicator is a trend analysis tool designed to examine market momentum across various timeframes on a single chart. Utilizing the Relative Strength Index (RSI) to assess the market’s strength and direction, this indicator offers a multidimensional perspective on current trends, enriching technical analysis with a deeper understanding of price movements. Other oscillators, such as the MACD and StochRSI, will be integrated in future updates.
Regarding the operation with the RSI: when its value is below 50 for a given period, the trend is considered bearish. Conversely, a value above 50 indicates a bullish trend. The indicator goes beyond the isolated analysis of each period by calculating an average of the displayed trends, based on user preferences. This average, ranging from “Strong Down” to “Strong Up,” reflects the percentage of periods indicating a bullish or bearish trend, thus providing a precise overview of the overall market condition.
Key Features:
Multi-Timeframe Analysis : Allows RSI analysis across multiple timeframes, offering an overview of market dynamics.
Advanced Customization : Includes options to adjust the RSI period, the RSI trend threshold, and more.
Color and Transparency Options : Offers color styles for bullish and bearish trends, as well as adjustable transparency levels for personalized visualization.
Average Trend Display : Calculates and displays the average trend based on activated timeframes, providing a quick summary of the current market state.
Flexible Table Positioning : Allows users to choose the indicator’s display location on the chart for seamless integration.
List of Parameters:
RSI Period : Defines the RSI period for calculation.
RSI Up/Down Threshold: Threshold for determining bullish or bearish trends of the RSI.
Table Position: Location of the indicator’s display on the chart.
Color Style : Selection of the color style for the indicator.
Strong Down/Up Color (User) : Customization of colors for strong market movements.
Table TF Transparency : Adjustment of the transparency level for the timeframe table.
Show X Minute/Hour/Day/Week Trend : Activation of the RSI display for specific timeframes.
Show AVG : Option to display or not the calculated average trend.
the Multi-Timeframe Momentum Indicator , stands as a comprehensive tool for market trend analysis across various timeframes, leveraging the RSI for in-depth market insights. With the promise of future updates including the integration of additional oscillators like the MACD and StochRSI, this indicator is set to offer even more robust analysis capabilities.
Please note that the MTF-Momentum is not a guarantee of future market performance and should be used in conjunction with proper risk management. Always ensure that you have a thorough understanding of the indicator’s methodology and its limitations before making any investment decisions. Additionally, past performance is not indicative of future results.

Backtest any Indicator v5Happy Trade,
here you get the opportunity to backtest any of your indicators like a strategy without converting them into a strategy. You can choose to go long or go short and detailed time filters. Further more you can set the take profit and stop loss, initial capital, quantity per trade and set the exchange fees. You get an overall result table and even a detailed, scroll-able table with all trades. In the Image 1 you see the provided info tables about all Trades and the Result Summary. Further more every trade is marked by a background color, Labels and Levels. An opening Label with the trade direction and trade number. A closing Label again with the trade number, the trades profit in % and the total amount of $ after all past trades. A green line for the take profit level and a red line for the stop loss.
Image 1
Example
For this description we choose the Stochastic RSI indicator from TradingView as it is. In Image 2 is shown the performance of it with decent settings.
Timeframe=45, BTCUSD, 2023-08-01 - 2023-10-20
Stoch RSI: k=30, d=40, RSI-length=140, stoch-length=140
Backtest any Indicator: input signal=Stoch RSI, goLong, take profit=9.1%, stop loss=2.5%, start capital=1000$, qty=5%, fee=0.1%, no Session Filter
Image 2
Usage
1) You need to know the name of the boolean (or integer) variable of your indicator which hold the buy condition. Lets say that this boolean variable is called BUY. If this BUY variable is not plotted on the chart you simply add the following code line at the end of your pine script.
For boolean (true/false) BUY variables use this:
plot(BUY ? 1:0,'Your buy condition hold in that variable BUY',display = display.data_window)
And in case your script's BUY variable is an integer or float then use instate the following code line:
plot(BUY ,'Your buy condition hold in that variable BUY',display = display.data_window)
2) Probably the name of this BUY variable in your indicator is not BUY. Simply replace in the code line above the BUY with the name of your script's trade condition variable.
3) Save your changed Indicator script.
4) Then add this 'Backtest any Indicator' script to the chart ...
5) and go to the settings of it. Choose under "Settings -> Buy Signal" your Indicator. So in the example above choose .
The form is usually: ' : BUY'. Then you see something like Image 2
6) Decide which trade direction the BUY signal should trigger. A go Long or a go Short by set the hook or not.
Now you have a backtest of your Indicator without converting it into a strategy. You may change the setting of your Indicator to the best results and setup the following strategy settings like Time- and Session Filter, Stop Loss, Take Profit etc. More of it below in the section Settings Menu.
Appereance
In the Image 2 you see on the right side the List of Trades . To scroll down you go into the settings again and decrease the scroll value. So you can see all trades that have happened before. In case there is an open trade you will find it at the last position of the list.
Every Long trade is green back grounded while Short trades are red.
Every trade begins with a label that show goLong or goShort and its number. And ends with another label again with its number, Profit in % and the resulting total amount of cash.
If activated you further see the Take Profit as a green line and the Stop Loss as a orange line. In the settings you can set their percentage above or below the entry price.
You also see the Result Summary below. Here you find the usual stats of a strategy of all closed trades. The profit after total amount of fees , amount of trades, Profit Factor and the total amount of fees .
Settings Menu
In the settings menu you will find the following high-lighted sections. Most of the settings have a question mark on their right side. Move over it with the cursor to read specific explanation.
Input Signal of your Indicator: Under Buy you set the trade signal of your Indicator. And under Target you set the value when a trade should happen. In the Example with the Stochastic RSI above we used 20. Below you can set the trade direction, let it be go short when hooked or go long when unhooked.
Trade Settings & List of Trades: Take Profit set the target price of any trade. Stop Loss set the price to step out when a trade goes the wrong direction. Check mark the List of Trades to see any single trade with their stats. In case that there are more trades as fits in the list you can scroll down the list by decrease the value Scroll .
Time Filter: You can set a Start Time or deactivate it by leave it unhooked. The same with End Time .
Session Filter: here you can choose to activate it on weekly base. Which days of the week should be trading and those without. And also on daily base from which time on and until trade are possible. Outside of all times and sessions there will be no new trades if activated.
Invest Settings: here you can choose the amount of cash to start with. The Quantity percentage define for every trade how much of the cash should be invested and the Fee percentage which have to be payed every trade. Open position and closing position.
Other Announcements
This Backtest script don't use the strategy functions of TradingView. It is programmed as an indicator. All trades get executed at candle closing. This script use the functionality "Indicator-on-Indicator" from TradingView.
Conclusion
So now it is your turn, take your promising indicators and connect it to that Backtest script. With it you get a fast impression of how successful your indicator will trade. You don't have to relay on coders who maybe add cheating code lines. Further more you can check with the Time Filter under which market condition you indicator perform the best or not so well. Also with the Session Filter you can sort out repeating good market conditions for your indicator. Even you can check with the GoShort XOR GoLong check mark the trade signals of you indicator in opposite trade direction with one click. And compare your indicators under the same conditions and get the results just after 2 clicks. Thanks to the in-build fee setting you get an impression how much a 0.1% fee cost you in total.
Cheers

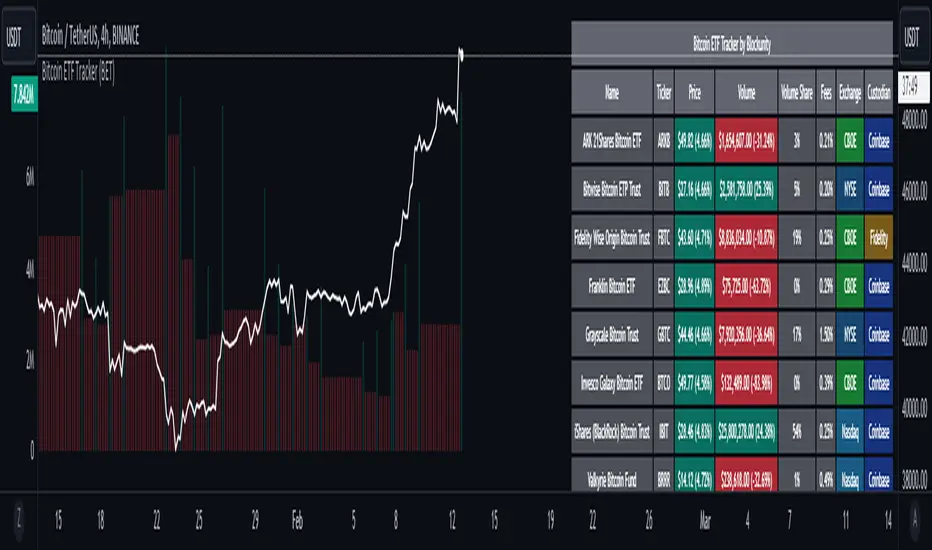
Bitcoin ETF Tracker (BET)Get all the information you need about all the different Bitcoin ETFs.
With the Bitcoin ETF Tracker, you can observe all possible Bitcoin ETF data:
The ETF name.
The ticker.
The price.
The volume.
The share of total ETF volume.
The ETF fees.
The exchange and custodian.
At the bottom of the table, you'll find the day's total volume.
In addition, you can see the volume for the different Exchanges, as well as for the different Custodians.
If you don't want to display these lines to save space, you can uncheck "Show Additional Data" in the indicator settings.
The Idea
The goal is to provide the community with a tool for tracking all Bitcoin ETF data in a synthesized way, directly in your TradingView chart.
How to Use
Simply read the information in the table. You can hover above the Fees and Exchanges cells for more details.
The table takes space on the chart, you can remove the extra lines by unchecking "Show Additional Data" in the indicator settings or reduce text size by changing the "Table Text Size" parameter.
Upcoming Features
As soon as we have a little more history, we'll add variation rates as well as plots to observe the breakdown between the various Exchanges and Custodians.
GOLD MonitorI'm using this platform from sometime and I carry out trading on Gold, using a kind of scalping strategy.
Scalping is not an easy task to do. Personally I found a lot of problems while detecting the trend direction.
So I decided to develop an indicator that is capable, in a discrete way, to give an instant-view on the market that is interesting.
This indicator can summarize in a small table all interesting figures related to gold scalping trading and is useful while joined with technical and fundamental analysis.
In this way it is possible to easy take under control all important aspects related to gold trading that I summarize here and you can find inside the table:
1) Gold / USD current direction
2) USD dollar strength (instant DXY) indicator take under consideration the DXY value every each tick and measures the increase or decrease in percentage. If there is a decrease the indicator displays a red low arrow, if there is an increase the indicator displays a green high arrow
also Gold friends are important so it is possible to find also:
3) NZDUSD (that is a Gold friend) variation percentage. If there is a decrease the indicator displays a red low arrow, if there is an increase the indicator displays a green high arrow
4) AUDUSD (that is a Gold friend) variation percentage. If there is a decrease the indicator displays a red low arrow, if there is an increase the indicator displays a green high arrow
then it is possible to find DXY USD dollar strength calculated between previous period (e.g. in timeframe M5 last 5 minutes) and current period (current 5 minutes). This indication is represented by an high arrow if there has been an increase, or by an low arrow if there has been a decrease.
Last but not least the information about the Gold trend itself with the possible forecast for the current period. This information must be carefully interpreted together with other instruments for technical analysis like Fibonacci lines.

Harmonic Trend Fusion [kikfraben]📈 Harmonic Trend Fusion - Your Personal Trading Assistant
This versatile tool combines multiple indicators to provide a holistic view of market trends and potential signals.
🚀 Key Features:
Multi-Indicator Synergy: Benefit from the combined insights of Aroon, DMI, MACD, Parabolic SAR, RSI, Supertrend, and SMI Ergodic Oscillator, all in one powerful indicator.
Customizable Plot Options: Tailor your chart by choosing which signals to visualize. Whether you're interested in trendlines, histograms, or specific indicators, the choice is yours.
Color-Coded Trends: Quickly identify bullish and bearish trends with the color-coded visualizations. Stay ahead of market movements with clear and intuitive signals.
Table Display: Stay informed at a glance with the interactive table. It dynamically updates to reflect the current market sentiment, providing you with key information and trend direction.
Precision Control: Fine-tune your analysis with precision control over indicator parameters. Adjust lengths, colors, and other settings to align with your unique trading strategy.
🛠️ How to Use:
Customize Your View: Select which indicators to display and adjust plot options to suit your preferences.
Table Insights: Monitor the dynamic table for real-time updates on market sentiment and trend direction.
Indicator Parameters: Experiment with different lengths and settings to find the combination that aligns with your trading style.
Whether you're a seasoned trader or just starting, Harmonic Trend Fusion equips you with the tools you need to navigate the markets confidently. Take control of your trading journey and enhance your decision-making process with this comprehensive trading assistant.

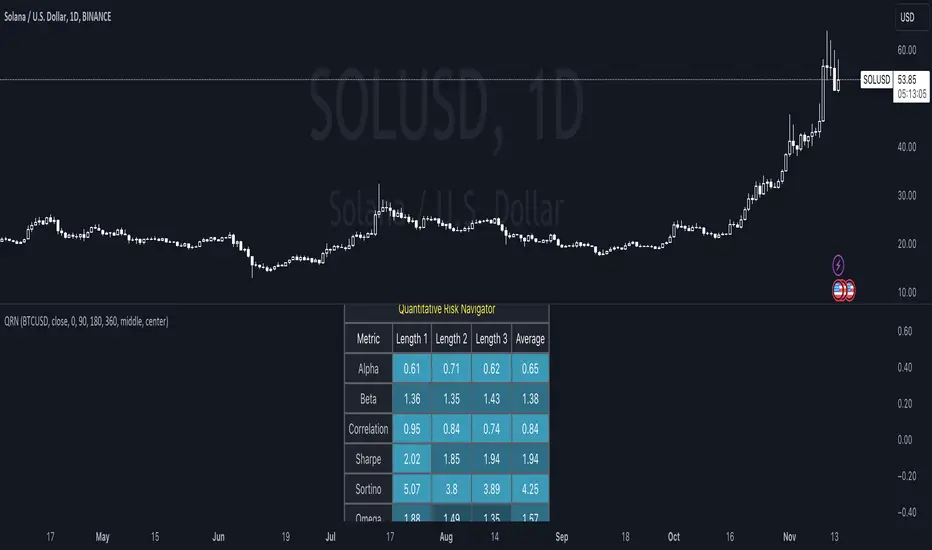
Quantitative Risk Navigator [kikfraben]📊 Quantitative Risk Navigator - Your Financial Performance GPS
Navigate the complexities of financial markets with confidence using the Quantitative Risk Navigator. This indicator provides you with a comprehensive dashboard to assess and understand the risk and performance of your chosen asset.
📈 Key Features:
Alpha and Beta Analysis: Uncover the outperformance (Alpha) and risk exposure (Beta) of your asset compared to a selected benchmark. Know where your investment stands in the market.
Correlation Insights: Understand the relationship between your asset and its benchmark through a clear visualization of correlation trends over different time lengths.
Risk-Return Metrics: Evaluate risk and return simultaneously with Sharpe and Sortino ratios. Make informed decisions by assessing the reward-to-risk ratio of your investment.
Omega Ratio: Gain deeper insights into your asset's performance by analyzing the Omega Ratio, which highlights the distribution of positive and negative returns.
Customizable Visualization: Tailor your chart to focus on specific metrics and time frames. Choose which metrics to display, allowing you to concentrate on the aspects that matter most to you.
Interactive Metrics Table: A user-friendly metrics table provides a quick overview of key values, including average metrics, enabling you to grasp the financial health of your asset at a glance.
Color-Coded Clarity: The indicator employs color-coded visualizations, making it easy to identify bullish and bearish trends, helping you make rapid and informed decisions.
🛠️ How to Use:
Symbol Selection: Choose your base symbol and preferred data source for analysis.
Risk-Free Rate: Input your risk-free rate to fine-tune calculations.
Length Customization: Adjust the lengths for different metrics to align with your analysis preferences.
Whether you're a seasoned trader or just stepping into the financial world, the Quantitative Risk Navigator empowers you to make strategic decisions by providing a comprehensive view of your asset's risk and return profile. Stay in control of your investments with this powerful financial GPS.
🚀 Start Navigating Your Financial Journey Today!
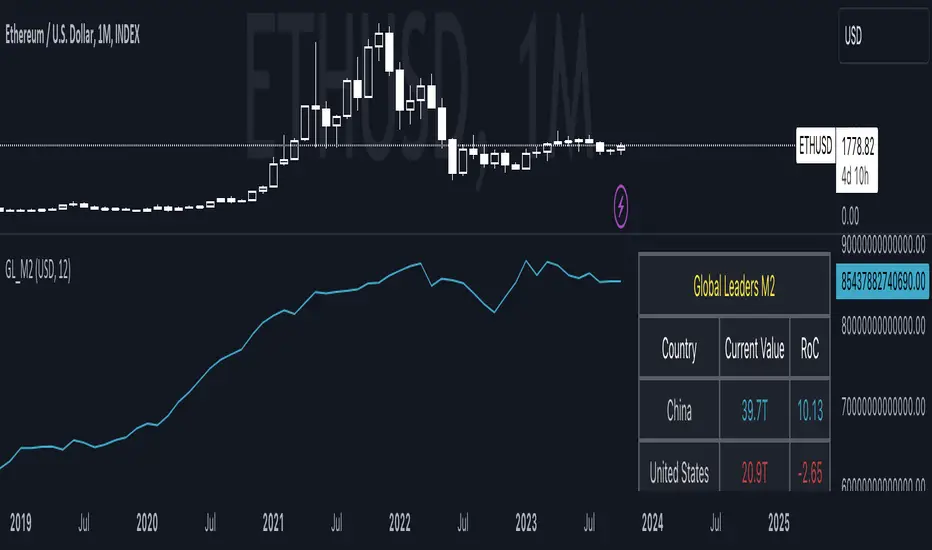
Global Leaders M2Introducing the Global Leaders M2 Indicator
The Global Leaders M2 indicator is a comprehensive tool designed to provide you with crucial insights into the money supply (M2) of the world's top 10 economic powerhouses. This powerful indicator offers a wealth of information to help you make informed decisions in the financial markets.
Key Features:
Multi-Country M2 Data: Access M2 data for the world's top 10 economic leaders, including China, the United States, Japan, Germany, the United Kingdom, France, Italy, Canada, Russia, and India.
Rate of Change Analysis: Understand the rate of change in M2 data for each country and the overall global aggregate, allowing you to gauge the momentum of monetary supply.
Customizable Display: Tailor your chart to display the data of specific countries, or focus on the total global M2 value based on your preferences.
Currency Selection: Choose your preferred currency for displaying the M2 data, making it easier to work with data in your currency of choice.
Interactive Overview Table: Get an overview of M2 data for each country and the global total in an interactive table, complete with color-coded indicators to help you quickly spot trends.
Precision and Clarity: The indicator provides precision to two decimal places and uses color coding to differentiate between positive and negative rate of change.
Whether you're a seasoned investor or a newcomer to the world of finance, the Global Leaders M2 indicator equips you with valuable data and insights to guide your financial decisions. Stay on top of global monetary supply trends, and trade with confidence using this user-friendly and informative tool.
SML SuiteIntroducing the "SML Suite" Indicator
The "SML Suite" is a powerful and easy-to-use trading indicator designed to help traders make informed decisions in the world of financial markets. Whether you're a seasoned trader or a novice, this indicator is your trusty sidekick for evaluating market trends.
Key Features:
Three Moving Averages: The indicator employs three different moving averages, each with a distinct length, allowing you to adapt to various market conditions.
Customizable Parameters: You can easily customize the moving average lengths and source data to tailor the indicator to your specific trading strategy.
Standard Deviation Multiplier: Adjust the standard deviation multiplier to fine-tune the indicator's sensitivity to market fluctuations.
Binary Results: The indicator provides clear binary signals (1 or -1) based on whether the current price is above or below certain bands. This simplifies your decision-making process.
SML Calculation: The SML (Short, Medium, Long) calculation is a smart combination of the binary results, offering you an overall sentiment about the market.
Color-Coded Visualization: Visualize market sentiment with color-coded bars, making it easy to spot trends at a glance.
Interactive Table: A table is displayed on your chart, giving you a quick overview of the binary results and the overall SML sentiment.
With the "SML Suite" indicator, you don't need to be a coding expert to harness the power of technical analysis. Stay ahead of the game and enhance your trading strategy with this user-friendly tool. Make your trading decisions with confidence and clarity, backed by the insights provided by the "SML Suite" indicator.

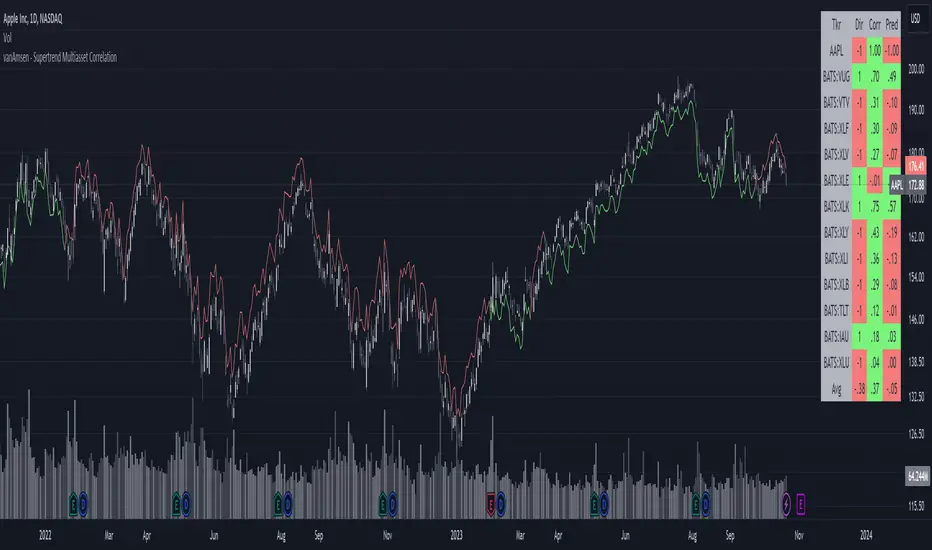
Supertrend Multiasset Correlation - vanAmsen Hello traders!
I am elated to introduce the "Supertrend Multiasset Correlation" , a groundbreaking fusion of the trusted Supertrend with multi-asset correlation insights. This approach offers traders a nuanced, multi-layered perspective of the market.
The Underlying Concept:
Ever pondered over the term Multiasset Correlation?
In the intricate tapestry of financial markets, assets do not operate in silos. Their movements are frequently intertwined, sometimes palpably so, and at other times more covertly. Understanding these correlations can unlock deeper insights into overarching market narratives and directional trends.
By melding the Supertrend with multi-asset correlations, we craft a holistic narrative. This allows traders to fathom not merely the trend of a lone asset but to appreciate its dynamics within a broader market tableau.
Strategy Insights:
At the core of this indicator is its strategic approach. For every asset, a signal is generated based on the Supertrend parameters you've configured. Subsequently, the correlation of daily price changes is assessed. The ultimate signal on the selected asset emerges from the average of the squared correlations, factoring in their direction. This indicator not only accounts for the asset under scrutiny (hence a correlation of 1) but also integrates 12 additional assets. By default, these span U.S. growth ETFs, value ETFs, sector ETFs, bonds, and gold.
Indicator Highlights:
The "Supertrend Multiasset Correlation" isn't your run-of-the-mill Supertrend adaptation. It's a bespoke concoction, tailored to arm traders with an all-encompassing view of market intricacies, fortified with robust correlation metrics.
Key Features:
- Supertrend Line : A crystal-clear visual depiction of the prevailing market trajectory.
- Multiasset Correlation : Delve into the intricate interplay of various assets and their correlation with your primary instrument.
- Interactive Correlation Table : Nestled at the top right, this table offers a succinct overview of correlation metrics.
- Predictive Insights : Leveraging correlations to proffer predictive pointers, adding another layer of conviction to your trades.
Usage Nuances:
- The bullish Supertrend line radiates in a rejuvenating green hue, indicative of potential upward swings.
- On the flip side, the bearish trajectory stands out in a striking red, signaling possible downtrends.
- A rich suite of customization tools ensures that the chart resonates with your trading ethos.
Parting Words:
While the "Supertrend Multiasset Correlation" bestows traders with a rejuvenated perspective, it's paramount to embed it within a comprehensive trading blueprint. This would include blending it with other technical tools and adhering to stringent risk management practices. And remember, before plunging into live trades, always backtest to fine-tune your strategies.
Euclidean Distance Predictive Candles [SS]Finally releasing this, its been in the works for the past 2 weeks and has undergone many iterations.
I am not sure if I am 100% happy with it yet, but I guess its best to release and get feedback to make improvements.
So this is the Euclidean distance predictive candle indicator and what it does is exactly what it sounds like, it uses Euclidean distance to identify similar candles and then plot the candles and range that immediately proceeded like candles.
While this is using a general machine learning/data science approach (Euclidean distance), I do not employ the KNN (Nearest Neighbors) algo into this. The reason being is it simply offered no predictive advantage than isolating for the last case. I tried it, I didn't like it, the results were not improve and, at times, acutally hindered so I ditched it. Perhaps it was my approach but using some other KNN indicators, I just don't really find them all that more advantageous to simply relying on the Law of Large Numbers and collecting more data rather than less data (which we will get into later in this explanation).
So using this indicator:
There is a lot of customizability here. And the reason is, not all settings are going to work the same for all tickers. To help you narrow down your parameters, I have included various backtest results that show you how the model is performing. You see in the AMZN chart above, with the current settings, it is performing optimally, with a cumulative range pass of 99% (meaning that, of all the cases, the indicator accurately predicted the next day high OR low range 99% of the time), and the ability to predict the candle slightly over 52%.
The recommended settings, from me, are as follows:
So these are generally my recommended settings.
Euclidian Tolerance: This will determine the parameters to look for similar candles. In general, the lower the tolerance, the greater the precision. I recommend keeping it between 0.5, for tickers with larger prices (like ES1! futures or NQ1!) or 0.05 for tickers with lower TPs, like SPY or QQQ.
If the ED Tolerance is too extreme that the indicator cannot find identical setups, it will alert you:
But in general, the more precise you can get it, the better.
Anchor Type: You will see the option to anchor by "Predicted Open" or by "Previous Close". I suggest sticking with anchoring by predicted open. All this means is, it is going to anchor your range, candle, high and low targets by the predicted open price. Anchoring by previous close will anchor by the close of yesterday. Both work okay, but in general the results from anchoring to predicted open have higher pass rates and more accurately depict the candle.
Euclidean Distance Measurement Type: You can choose to measure by candle body or from high to low wicks. I haven't played around with measuring from high to low wicks all that much, because candle body tends to do the job. But remember, ED is a neutral measurement. Which means, its not going to distinguish between a red or green candle, just the formation of the candle. Thus, I tend to recommend, pragmatically, not to necessarily rely on the candle being red or green, but one the formation of the candle (where are the wicks going, are there more bearish wicks or bullish wicks) etc. Examples will follow.
Range Prediction Type: You can filter the range prediction type by last instance (in which, it will pull the previous identical candle and plot the next candle that followed it, adjusted for the current ranges) or "Average of All Cases". So this is where we need to talk a little bit about the law of large numbers.
In general, in statistics, when you have a huge amount of random data, the law of large numbers stipulates that, within this randomness should be repeated events. This is why sometimes chart patterns work, sometimes they don't. When we filter by the average of all cases, we are relying on the law of large numbers. In general, if you are getting good Backtest readings from Last Instance, then you don't need to use this function. But it provides an alternative insight into potential candle formations next day. Its not a bad idea to compare between the two and look for similarities and differences.
So now that we have covered the boring details, let's get into how to use the indicator and some examples.
So the indicator is plotting the range and candle for the next day. As such, we are not looking at the current candle being plotted, but we are looking at the previous candle (see image below for example):
The green arrow shows the prediction for Friday, along with the corresponding result. The purple arrow shows the prediction for Monday which we have yet to realize.
So remember when you are using this, you need to look at the previous candle, and not the candle that it is currently plotting with realtime data, because it is plotting for the next candle.
If you are plotting by last instance, the indicator will tell you which day it is pulling its data from if you have opted to toggle on the demographic data:
You can see the green arrow pointing to the date where it is pulling from. This data serves as the example candle with the candle proceeding this date being the anchored candle (or the predicted candle).
Price Targets and Probability:
In the chart, you can see the green arrow pointing to the green portion of the table. In this table, it will give you the current TPs. These represent the current time target price, which means, the TPs shown here are for Friday. On Monday, the table will update with the TPs for Monday, etc. If you want to view the TPs in advance, you can view them from the actual candle itself.
Below the TPs, you see a bullish 7:6. It means, in a total of 13 cases, the next candle was bullish 7 times and bearish 6 times. Where do we see the number of cases? In the demographic table as well:
Auxiliary functions
Because you are using the previous candle, if you want to avoid confusion, you can have the indicator plot the price targets over the predicted candle, to anchor your attention so to speak. Simply select "Label" in the "Show Price Targets" section, which will look like this:
You can also ask the indicator to plot the demographic data of Higher High, Low, etc. information. What this does is simply looks at all the cases and plots how many times higher highs, lows, lower lows, highs etc. were made:
This will just count all of the cases identified and plot the number of times higher highs, lows, etc. were made.
Concluding Remarks
This is a kind of complex indicator and I can appreciate it may take some getting used to.
I will try to post a tutorial video at some point next week for it, so stay tuned for that.
But this isn't designed to make your life more complicated, just to help give you insights into potential outcomes for the next day or hour or 5 minute (it can be used on all timeframes).
If you find it helpful, great! If not, that's okay, too :-).
Please be aware, this is not my forte of indicators. I am not a data scientist or programmer. My background is in Epi and we don't use these types of data science approaches, so if you have any suggestions or critiques, feel free to share them below.
Otherwise, I hope you enjoy!
Take care everyone and safe trades!

buyer_seller_scalping_indicatorThis code is a custom script designed for analyzing trading volume within a specific time window on the TradingView platform. It offers a comprehensive analysis of buying and selling activity during a defined period and provides visual aids and data summaries for traders to make informed decisions. Here's a detailed breakdown of its functionality and how to use it:
1. Custom Time Period: The script starts by allowing you to specify a custom time period for analysis. In this example, it's set from 04:00 to 09:29. You can modify these time values to suit your specific trading needs.
2. Volume Calculation: The script calculates buying and selling volume based on price levels. It takes into account the open, high, low, and close prices to determine whether buying or selling pressure is dominant during the specified time frame.
3. Total Volume Calculation: It calculates the total volume within the custom time period. This can help you gauge the overall activity and liquidity during the chosen time window.
4. Visualizations: The script then plots visual elements on the chart:
- A volume histogram, which provides a graphical representation of the total volume during the time period.
- Buying and selling volume indicators, which are shown as circles on the chart, highlighting the relative strength of buyers and sellers.
- An average volume line, represented in gray, which helps you identify the average trading volume over a 50-period moving average.
5. Volume Type Determination: The script determines whether buyers or sellers dominate the market during the specified time period. It labels this as "Buyers Volume > Sellers Volume," "Sellers Volume > Buyers Volume," or "Buyers Volume = Sellers Volume." This information can be crucial for assessing market sentiment.
6. Percentage Breakdown: The script calculates the percentage of buying and selling volume in relation to the total volume, helping you understand the distribution of market participants. These percentages are displayed in a table.
7. Table Display: Finally, the script creates a table that displays the following information:
- The current volume type (buyers, sellers, or balanced), with corresponding text colors.
- The percentage of buyers and sellers in the market.
How to Use:
1. Copy the script and add it as a custom script on TradingView.
2. Apply the script to your desired financial chart.
3. Adjust the custom time period if needed.
4. Interpret the visual elements and table to gain insights into market sentiment and volume distribution during the specified time frame.
5. Use this information to inform your trading decisions and strategies, especially when trading within the chosen time window.
This script is a valuable tool for traders seeking to understand market dynamics and volume behavior during specific trading hours, ultimately aiding in more informed trading decisions.
Disclaimer:
The indicator provided herein is experimental and has not undergone comprehensive testing. Its usage is solely at your own risk.
The publisher assumes no responsibility for any trading decisions made based on the utilization of this indicator.

AlpHay : ToolKitToolKit:
First Impressions for Securities; (like crime scene investigators) 🧐
Our first job is to understand "What did happen here?" (historically, like Price Ranges or Price Performances) 🤔
Secondly, we try to figure out "where are we now?" (like common indicators or Moving Averages) 🤔
Then "What was the chain of events?" (macro, local, fundamentals, shorts, etc.)
Note: There are a lot of useful scripts out there, but If you want to see my approach for "Fundamentals" or "Finra Short Report" scripts, have a look.
Now we have a Clue. 😎
Includes;
1. Daily Metrics (Price performance, Price Difference, Volume, Trade)
2. Historic Price Performances
3. Historic Price ranges
4. RSI and MACD (you can change) Indicators for four "Time Frame" (you can change also)
5. Moving Averages (also shows daily values on the chart)
* Easy to customize.
* You can be positioned where ever you need. (be careful about overlays)
* You can turn on/off tables for your daily usage.
* You can flip Horizontally for some of the tables.
* Always look at tooltips (mouse over for Averages etc.)
I hope you enjoy it.
Disclaimer and Warning!
* Do not forget this is my Interpolation of the data sets. You can't invest in relying on this indicator. This is just a visual representation of the data sets.
* Just be careful what you wish for. And search for anomalies.
// ToDO List.
* Pre/Post Market Price and Volume

Regression Candle Conversion IndicatorHey everyone!
I got a pseudo-request a while ago for something like this, essentially the ability to track where another ticker would fall based on an alternative ticker.
I did create my ticker correlation reference indicator which directly looks at the correlation between 2 tickers. However, this is an indicator that operates on the same principle but is more pragmatic for trading.
What does it do?
Well, in keeping with the theme of what I call my indicators, this has a title that explains exactly what it does, "Regression Candle Conversion Indicator" or "RCCI" for short. It uses simple regression to convert one ticker to another. So while you are tracking one indicator, you can see where the expected value should fall on the other.
Applications?
The big application of this for me is being able to track where SPY/QQQ or IWM is falling during overnight trading sessions. Extended trading hours close at 8 pm NYSE time. After that, you have to guess where futures prices will put the ETF version of it. This indicator will allow you to track where, theoretically, the underlying ETF ticker will fall based on the current trading behaviour.
Some other applications are just the ability to track how similar or dissimilar one stock is to the other. For example, if we wanted to trade, say, Boeing using shares of DFEN or ITA (a defence specific ETF), here is what we get:
In the chart above we can see BA as the primary chart and ITA as the RCCI converted chart. We will see 2 major things that should cause us concern.
First, there is a really poor correlation between the two tickers. This indicates that ITA may not produce the best exposure if I am directly looking for Boeing exposure.
Second, there is a wide standard error. this means that the results that the RCCI is providing may be skewed up to +/- 2 points (as indicated by the standard error chart).
Let's take a look at BA and DFEN:
In the above, we can see that the correlation is not great, but the standard error is quite low.
This means that, while this may not be the best ticker for Boeing exposure, the RCCI is able to confidently calculate the ticker within +/- 0.50 cents based on BA's underlying data.
However, its important to note that it is not advisable to really rely on these results if the correlation is less than + 0.5 or greater than -0.5.
Let's take a look at a few more examples:
Above we have BA (NYSE) vs BA (NEO TSX CAD Hedged). We can see the strong relationship and high confidence calculations.
And some others:
SPX (primary) and ES1! (secondary):
RTY and IWM:
ES1! and SPY:
Customizations:
As you can see above, it is pretty straight forward. There are 3 options:
Lookback Length: Determines the length of assessment for correlation and the regression assessment.
Manual Ticker Input: The indicator will pull the data from your current chart and compare it against a manually selected indicator. You must tell the indicator which ticker you are comparing against.
Data Table: This will show you the data table which contains the standard error assessment and the correlation assessment. These are determined by your lookback length. The lookback length is defaulted to 500.
And that's the indicator! It's pretty straight forward. Hopefully you find it helpful, especially if you track futures during overnight sessions.
Leave your comments/questions and feedback below.
Thanks for checking it out!
