AC- MY SCRIPT1My Ac- My Scrpt1 that the BUY and SELL signals (trend reversals) for many coins defined different tickers in Tradingview charts
Terminology explanation:
Confirmed Reversal: Oxford T reversal that happened in the last bar and cannot be repainted.
Potential Reversal: Oxford T reversal that might happen in the current bar but can also not happen depending upon the timeframe closing price.
Downtrend: Tickers that are currently in the sell zone
Uptrend: Tickers that are currently in the buy zone
List and show has also got a built in Oxford T indicator which users can confirm the reversals on graphs.
Screener explores the 40 tickers in current graph's time frame and also in desired parameters of the OTT indicator.
Also you can optimize the parameters manually with the built in STRATEGY version.
Built in Moving Average type defaultly set as VAR but users can choose from 8 different Moving Average types like:
SMA : Simple Moving Average
EMA : Exponential Movin Average
WMA : Weighted Moving Average
TMA : Triangular Moving Average
VAR : Variable Index Dynamic Moving Average aka VIDYA
WWMA : Welles Wilder's Moving Average
ZLEMA : Zero Lag Exponential Moving Average
TSF : True Strength Force
Tip: In sideways VAR would be a good choice
You can use OxforfT default alarms and Buy Sell signals like:
1-
BUY when Prices are above OxfordT
SELL when Prices are below OxfordT
2-
BUY when OxfordT support Line crosses over OoxfordT line.
SELL when OxfordT support Line crosses under OxfordT line.
3-
BUY when OxfordT line is Green and makes higher highs.
SELL when OxfordT line is Red and makes lower lows.
IMPORTANT: SCREENER ONLY EXPLORES AND SCREENS FOR THE 2nd SIGNAL TYPE:
BUY when OxfordT support Line crosses over OxfordT line.
SELL when OxfordT support Line crosses under OxfordT line.
Tìm kiếm tập lệnh với "信达股份40周年"
JohnEhlersFourierTransformLibrary "JohnEhlersFourierTransform"
Fourier Transform for Traders By John Ehlers, slightly modified to allow to inspect other than the 8-50 frequency spectrum.
reference:
www.mesasoftware.com
high_pass_filter(source) Detrended version of the data by High Pass Filtering with a 40 Period cutoff
Parameters:
source : float, data source.
Returns: float.
transformed_dft(source, start_frequency, end_frequency) DFT by John Elhers.
Parameters:
source : float, data source.
start_frequency : int, lower bound of the frequency window, must be a positive number >= 0, window must be less than or 30.
end_frequency : int, upper bound of the frequency window, must be a positive number >= 0, window must be less than or 30.
Returns: tuple with float, float array.
db_to_rgb(db, transparency) converts the frequency decibels to rgb.
Parameters:
db : float, decibels value.
transparency : float, transparency value.
Returns: color.

Forex Dogs Moving Averages with Distance TableThis is an indicator based on the book【Forex】ForexDog’s Vacuum Zone Trading 2021: Trading Strategy to “not lose” based on Experience and Logic written by Forex Dog (yes, this is his author name on Amazon; he is a trader popular mostly in Japan). It consists of simple moving averages which should somewhat correspond to the higher timeframes moving averages. The original was traded on a 15m chart and the periods are as follows: 5, 20, 40, 50, 80, 100, 200, 400, 640, 1600, 1920, 3200.
Then, there is a big table with a distances overview. This should give you an idea of how far each average is in ticks. The minus in front of the ticks_total signifies direction.
I expect some feedback on this because I don't think the user convenience is very with tables being so bright. My goal is to create a system that limits the number of "noodles" on the chart but still carries the information via the tables on the side.
Moving Average Length is not adjustable by design. The book says to use these quite explicitly, although the logic would work just fine with some other levels, it would not be the original strategy.
Good luck!

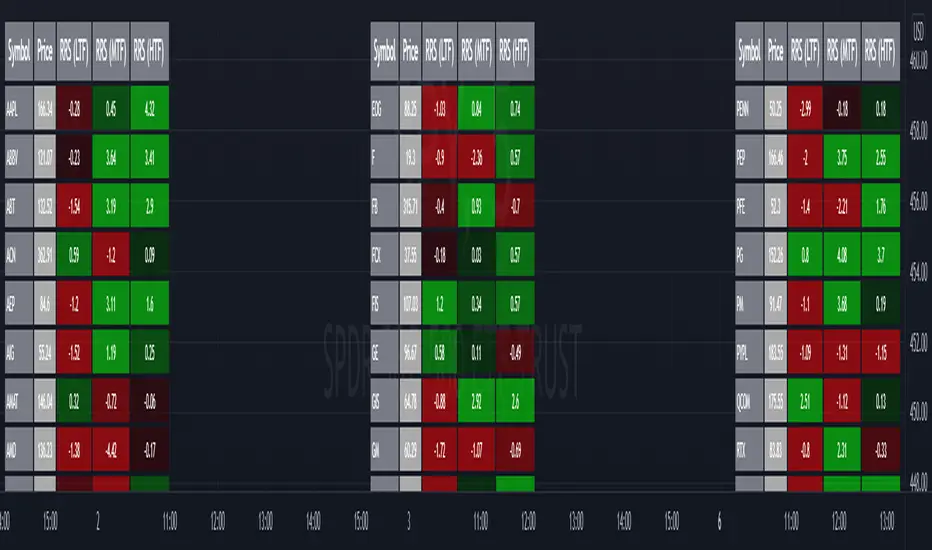
Relative Strength Screener V2 - Top 100 volume leadersNew and improved strength heatmap for the top 100 volume leaders in the S&P. Coded in a workaround to the 40 request.security limitation that currently exists in Pine. Added the ability to input the number of columns (time frames) you wish to display.
For 3 time frame analysis, add the indicator to your chart 3 times. Change the number of columns to 3 for each of these indicators. Specify the column and time frame for each one (example, 5 minute for column 1, 1 hour for column 2 and Daily chart for column 3). It will automatically resize the columns/tables to properly display the output. This provides a sort of "Strength Heatmap" for the top 100 stocks in the S&P. To achieve this, make a copy of the indicator and substitute lines 68-105 with the following premade watchlists :
Make a copy 1 - FIrst 38 volume leaders in the S&P
s01 = input.symbol('AAPL', group = 'Symbols', inline = 's01')
s02 = input.symbol('ABBV', group = 'Symbols', inline = 's02')
s03 = input.symbol('ABT', group = 'Symbols', inline = 's03')
s04 = input.symbol('ACN', group = 'Symbols', inline = 's04')
s05 = input.symbol('AEP', group = 'Symbols', inline = 's05')
s06 = input.symbol('AIG', group = 'Symbols', inline = 's06')
s07 = input.symbol('AMAT', group = 'Symbols', inline = 's07')
s08 = input.symbol('AMD', group = 'Symbols', inline = 's08')
s09 = input.symbol('APA', group = 'Symbols', inline = 's09')
s10 = input.symbol('ATVI', group = 'Symbols', inline = 's10')
s11 = input.symbol('AXP', group = 'Symbols', inline = 's11')
s12 = input.symbol('BA', group = 'Symbols', inline = 's12')
s13 = input.symbol('BBWI', group = 'Symbols', inline = 's13')
s14 = input.symbol('BBY', group = 'Symbols', inline = 's14')
s15 = input.symbol('BK', group = 'Symbols', inline = 's15')
s16 = input.symbol('BMY', group = 'Symbols', inline = 's16')
s17 = input.symbol('BRK.B', group = 'Symbols', inline = 's17')
s18 = input.symbol('C', group = 'Symbols', inline = 's18')
s19 = input.symbol('CAT', group = 'Symbols', inline = 's19')
s20 = input.symbol('CCL', group = 'Symbols', inline = 's20')
s21 = input.symbol('CFG', group = 'Symbols', inline = 's21')
s22 = input.symbol('CL', group = 'Symbols', inline = 's22')
s23 = input.symbol('CNC', group = 'Symbols', inline = 's23')
s24 = input.symbol('COF', group = 'Symbols', inline = 's24')
s25 = input.symbol('COP', group = 'Symbols', inline = 's25')
s26 = input.symbol('COST', group = 'Symbols', inline = 's26')
s27 = input.symbol('CRM', group = 'Symbols', inline = 's27')
s28 = input.symbol('CVS', group = 'Symbols', inline = 's28')
s29 = input.symbol('CVX', group = 'Symbols', inline = 's29')
s30 = input.symbol('DAL', group = 'Symbols', inline = 's30')
s31 = input.symbol('DIS', group = 'Symbols', inline = 's31')
s32 = input.symbol('DISCA', group = 'Symbols', inline = 's32')
s33 = input.symbol('DISCK', group = 'Symbols', inline = 's33')
s34 = input.symbol('DISH', group = 'Symbols', inline = 's34')
s35 = input.symbol('DLTR', group = 'Symbols', inline = 's35')
s36 = input.symbol('DOW', group = 'Symbols', inline = 's36')
s37 = input.symbol('DVN', group = 'Symbols', inline = 's37')
s38 = input.symbol('EBAY', group = 'Symbols', inline = 's38')
Make a copy 2 - Tickers 39 to 76
s01 = input.symbol('EOG', group = 'Symbols', inline = 's01')
s02 = input.symbol('F', group = 'Symbols', inline = 's02')
s03 = input.symbol('FB', group = 'Symbols', inline = 's03')
s04 = input.symbol('FCX', group = 'Symbols', inline = 's04')
s05 = input.symbol('FIS', group = 'Symbols', inline = 's05')
s06 = input.symbol('GE', group = 'Symbols', inline = 's06')
s07 = input.symbol('GIS', group = 'Symbols', inline = 's07')
s08 = input.symbol('GM', group = 'Symbols', inline = 's08')
s09 = input.symbol('GS', group = 'Symbols', inline = 's09')
s10 = input.symbol('HD', group = 'Symbols', inline = 's10')
s11 = input.symbol('IBM', group = 'Symbols', inline = 's11')
s12 = input.symbol('INTC', group = 'Symbols', inline = 's12')
s13 = input.symbol('JNJ', group = 'Symbols', inline = 's13')
s14 = input.symbol('JPM', group = 'Symbols', inline = 's14')
s15 = input.symbol('KR', group = 'Symbols', inline = 's15')
s16 = input.symbol('LUV', group = 'Symbols', inline = 's16')
s17 = input.symbol('LVS', group = 'Symbols', inline = 's17')
s18 = input.symbol('MA', group = 'Symbols', inline = 's18')
s19 = input.symbol('MCD', group = 'Symbols', inline = 's19')
s20 = input.symbol('MCHP', group = 'Symbols', inline = 's20')
s21 = input.symbol('MDT', group = 'Symbols', inline = 's21')
s22 = input.symbol('MET', group = 'Symbols', inline = 's22')
s23 = input.symbol('MGM', group = 'Symbols', inline = 's23')
s24 = input.symbol('MOS', group = 'Symbols', inline = 's24')
s25 = input.symbol('MPC', group = 'Symbols', inline = 's25')
s26 = input.symbol('MRK', group = 'Symbols', inline = 's26')
s27 = input.symbol('MRNA', group = 'Symbols', inline = 's27')
s28 = input.symbol('MS', group = 'Symbols', inline = 's28')
s29 = input.symbol('MSFT', group = 'Symbols', inline = 's29')
s30 = input.symbol('MU', group = 'Symbols', inline = 's30')
s31 = input.symbol('NCLH', group = 'Symbols', inline = 's31')
s32 = input.symbol('NEE', group = 'Symbols', inline = 's32')
s33 = input.symbol('NEM', group = 'Symbols', inline = 's33')
s34 = input.symbol('NFLX', group = 'Symbols', inline = 's34')
s35 = input.symbol('NKE', group = 'Symbols', inline = 's35')
s36 = input.symbol('NVDA', group = 'Symbols', inline = 's36')
s37 = input.symbol('ORCL', group = 'Symbols', inline = 's37')
s38 = input.symbol('OXY', group = 'Symbols', inline = 's38')
Make a copy 3 - tickers 77 to 114
s01 = input.symbol('PENN', group = 'Symbols', inline = 's01')
s02 = input.symbol('PEP', group = 'Symbols', inline = 's02')
s03 = input.symbol('PFE', group = 'Symbols', inline = 's03')
s04 = input.symbol('PG', group = 'Symbols', inline = 's04')
s05 = input.symbol('PM', group = 'Symbols', inline = 's05')
s06 = input.symbol('PYPL', group = 'Symbols', inline = 's06')
s07 = input.symbol('QCOM', group = 'Symbols', inline = 's07')
s08 = input.symbol('RTX', group = 'Symbols', inline = 's08')
s09 = input.symbol('SBUX', group = 'Symbols', inline = 's09')
s10 = input.symbol('SCHW', group = 'Symbols', inline = 's10')
s11 = input.symbol('SLB', group = 'Symbols', inline = 's11')
s12 = input.symbol('SYF', group = 'Symbols', inline = 's12')
s13 = input.symbol('T', group = 'Symbols', inline = 's13')
s14 = input.symbol('TFC', group = 'Symbols', inline = 's14')
s15 = input.symbol('TGT', group = 'Symbols', inline = 's15')
s16 = input.symbol('TJX', group = 'Symbols', inline = 's16')
s17 = input.symbol('TMUS', group = 'Symbols', inline = 's17')
s18 = input.symbol('TSLA', group = 'Symbols', inline = 's18')
s19 = input.symbol('TWTR', group = 'Symbols', inline = 's19')
s20 = input.symbol('TXN', group = 'Symbols', inline = 's20')
s21 = input.symbol('UAL', group = 'Symbols', inline = 's21')
s22 = input.symbol('UNH', group = 'Symbols', inline = 's22')
s23 = input.symbol('V', group = 'Symbols', inline = 's23')
s24 = input.symbol('VIAC', group = 'Symbols', inline = 's24')
s25 = input.symbol('WBA', group = 'Symbols', inline = 's25')
s26 = input.symbol('WFC', group = 'Symbols', inline = 's26')
s27 = input.symbol('WMT', group = 'Symbols', inline = 's27')
s28 = input.symbol('WYNN', group = 'Symbols', inline = 's28')
s29 = input.symbol('XOM', group = 'Symbols', inline = 's29')
s30 = input.symbol('SPY', group = 'Symbols', inline = 's30')
s31 = input.symbol('SPY', group = 'Symbols', inline = 's31')
s32 = input.symbol('SPY', group = 'Symbols', inline = 's32')
s33 = input.symbol('SPY', group = 'Symbols', inline = 's33')
s34 = input.symbol('SPY', group = 'Symbols', inline = 's34')
s35 = input.symbol('SPY', group = 'Symbols', inline = 's35')
s36 = input.symbol('SPY', group = 'Symbols', inline = 's36')
s37 = input.symbol('SPY', group = 'Symbols', inline = 's37')
s38 = input.symbol('SPY', group = 'Symbols', inline = 's38')
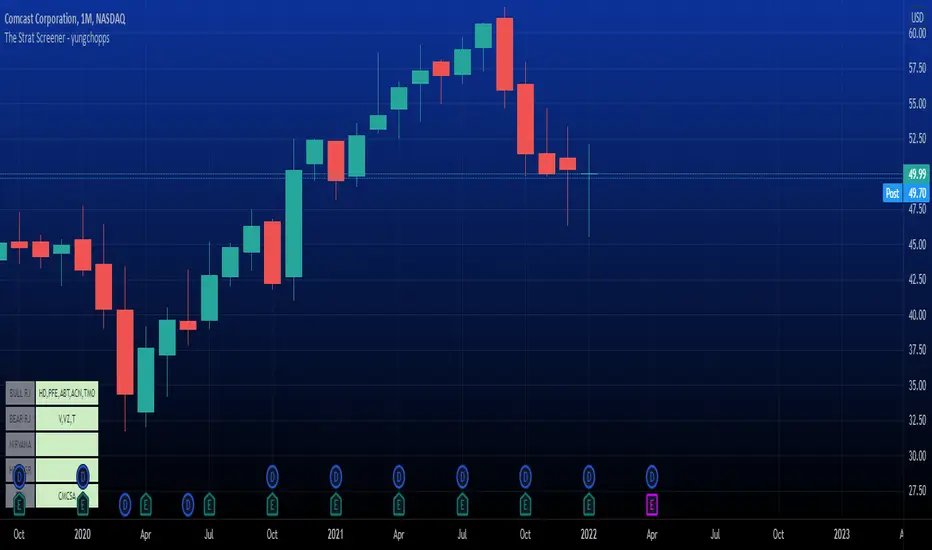
The Strat Screener - yungchoppsThis indicator scan up to 40 tickers of your choice for bullish and bearish Randy Jackson setups. Randy Jackson setups are 2u-2u-2d-2u for bullish cases and 2d-2d-2u-2d for bearish cases. If a ticker has a possible RJ setup, the ticker name will be display on the table depending if it is bullish or bearish. The only thing you need to do it change one of the default tickers to the ones you desire and the table will update if there are any RJ setups. The indicators search for RJ setups on the current timeframe that you are on.
Randy Jackson setups are part of the 'Strat' candlestick analysist. More information about the Strat can be found on the internet and YouTube. This indicator reads the previous candles of every selected ticker and searched for a RJ setup. If one exist, it will update the table with the tickers name. I will add more setups in the future.
This is a screener. This indicator really just makes it easier to scan many indicators at once. Its not hard to use... just place it on the chart and it will do the work for you. Hopefully mods find this enough of a description...
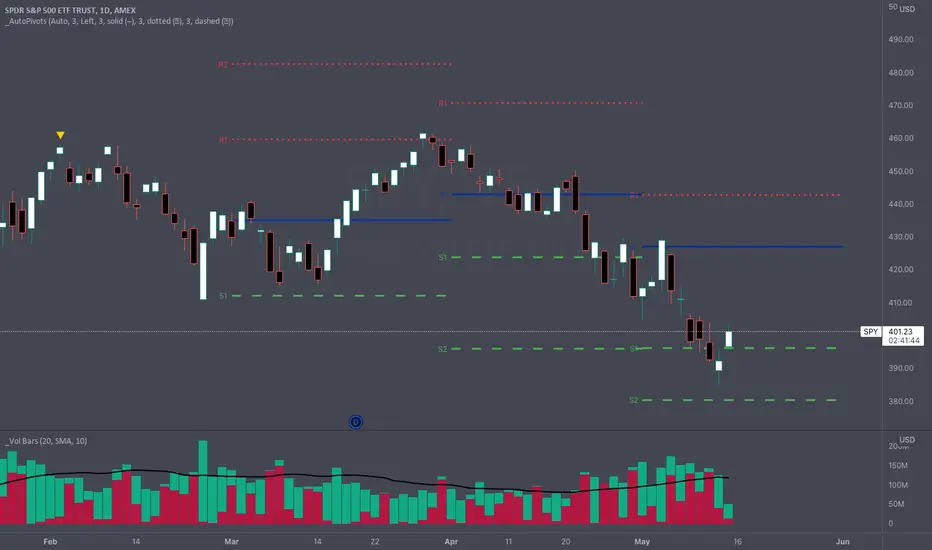
_Auto Pivot PointsOne of the main drawbacks to displaying Pivot Points on a chart is that many times the more extreme pivots (R/S3, R/S4, R/S5) aren't anywhere close to the price action during a timeframe. These extreme pivot points clutter up your chart and make it hard to use the "auto" zoom feature of TradingView.
The " _Auto Pivot Points " indicator solves these problems by automatically only displaying the pivot points if the price has crossed the pivot during the timeframe or it is the next closest pivot . For example, on monthly pivots if the price has only crossed the R1 Pivot then this indicator will display the R2 Pivot and any pivots below but it won't display the R3, R4, R5 pivots . The R3, R4, & R5 pivots are not very useful to the trader because the price hasn't even crossed the R2 Pivot . But as soon as the price crosses the R2 Pivot then this indicator will display the R3 Pivot because it is the next closest. And the same logic applies to the S Pivots .
If you need to see all the Pivots then there is a convenient toggle to display all the pivots by turning off the intelligent auto pivots . But as soon as you don't need to display all the pivots the toggle will turn on the automatic pivots .
This indicator has many style and logic options. This script allows you to control:
Number of past timeframes to display
Displaying Pivot labels
Label position (left/right)
Line color
Line width
Note: TradingView has a limit of 40 security calls per script. Due to this limitation this indicator can only display pivots a max of 7 time periods back.
Note 2: This indicator uses the Traditional pivot calculations.

Supertrend Explorer First_40This indicator was brought by Kıvanç Özbilgiç. I only modified it to search for 40 stocks on BIST. The other stocks are listed as Second_40, Third_40 and Fourth_40.

Drawdown + Labels BINANCE:BTCUSDT
Indicador de reducciones de precio con etiqueta.
El indicador toma por defecto el valor máximo histórico y a partir de ese valor realiza los siguientes cálculos:
Reducción del 50% = Máximo Histórico*(50/100)
Reducción del 60% = Máximo Histórico*(40/100)
Reducción del 70% = Máximo Histórico*(30/100)
Reducción del 80% = Máximo Histórico*(20/100)
Reducción del 90% = Máximo Histórico*(10/100)
En el grafico se mostrará una etiqueta a la derecha por defecto, el valor que corresponde a cada reducción.
Ejemplo:
Fecha: 04 de Enero de 2022
Máximo Histórico de BTC = $ 69,000 (Línea color Naranja)
Reducción del 50% = $ 34,500 (Línea color Morada)
Reducción del 60% = $ 27,600 (Línea color Marrón)
Reducción del 70% = $ 20,700 (Línea color Verde)
Reducción del 80% = $ 13,800 (Línea color Roja)
Reducción del 90% = $ 6,900 (Línea color Aqua)
Reducción del 100% = $ 0 (Línea color Negro)
Espero les ayude, saludos.

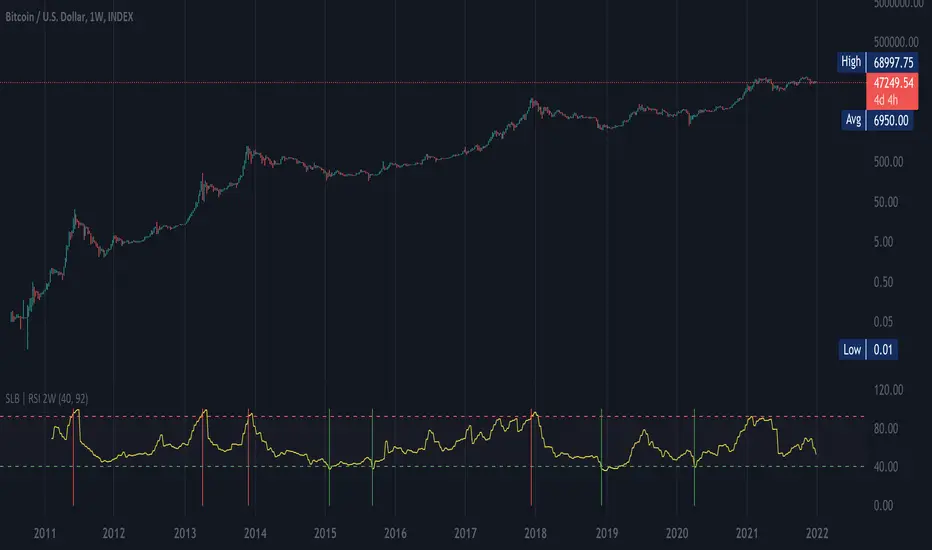
SLB | RSI 2WThis script shows RSI ( Relative Strength Index ) over a 2 week period (RSI2W). The RSI2W is used by some traders to identify tops and valleys.
Taking historical BTC values as an example, the RSI 92+ (red lines) matches with the historical tops, and the RSI 40- (green lines) matches with the valleys, a good chance of bull markets' start.
Pivots High-Low Screener & AlertsHi fellow traders ,
Pleased to share a Pivot High - Low Screener.
The script uses the TV inbuilt Pivot function.
It Screens 25 tickers default set, these can be modified in the input dialog box.
All you need to do is attach to any chart and set the periodicity or the resolution of the chart to your desired alert() frequency requirement.
Now go to the input settings icon of the script and set your Pivot right and left parameters!
Set the alert from the menu as usual click - Any alert() function call and bingo you are done!!
Similarily change the chart periodicity to the next timeframe and set the next alert.
No more opening multiple charts and setting individual time consuming alerts().
You will get concatenated alerts or summary alerts for your tickers.
Track 25tickers with a single alert for each timeframe(Supports 40 tickers).
Happy trading with TV..

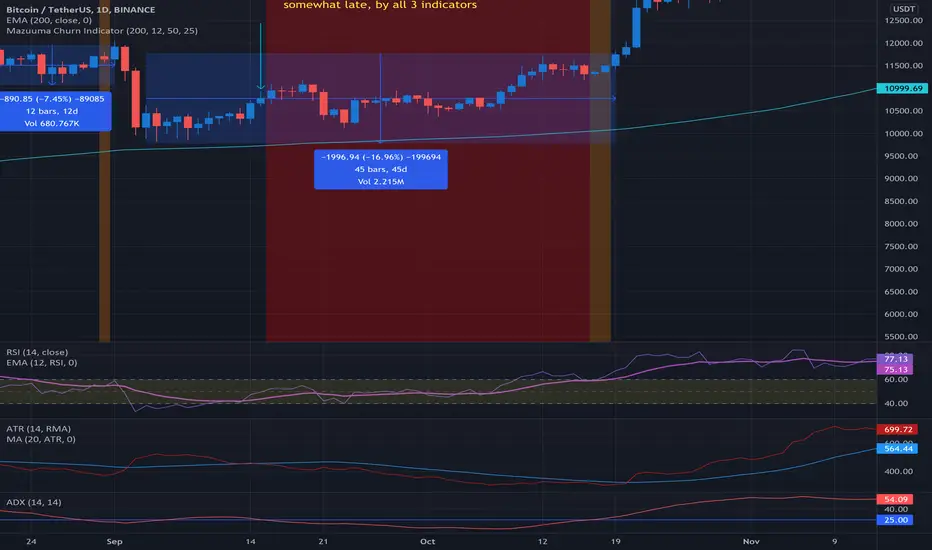
Mazuuma Churn IndicatorThis indicator was specifically made to confirm a periode of sideways movement (churn) on Bitcoin. It can probably be used for other cryptocurrencies as well. I use it on the daily timeframe.
Yellow means "Unconfirmed".
Orange means "Partially Confirmed".
Red means "Confirmed"
The indicator is not perfect, so use your common sense.
Churn starts when at least 2 of the conditions below are met (use also your common sense):
1. ATR < MA 20 on ATR
2. Distance to EMA 200 must be ≤ 16% at “Open churn”
3. EMA 12 on RSI between 40 and 60
4. ADX < 25
The above are weighted. Meaning no 1 has most significance. The numbers can be tweaked.
Reversal coming
* The indicators above break out, especially the ATR
* Color shift of the Heikin Ashi candle on weekly timeframe
* Engulfing candle on weekly timeframe
Because of the offset of the EMA 200, the precision of the Churn predictor can be off after a VERY big spike up or down, e.g. dec 2017. After such a spike use your common sense.
Personally I use this for bot trading, i.e. turn off trend following bots when in sideways market and use grid bots or other means of trading instead.
High-Low IndexHello All,
High-Low Index is a breadth indicator based on Record High Percent (RHP). RHP is based on new 52-week highs and new 52-week lows. RHP => 100 * (new highs) / (new highs + new lows). High-Low Index is a 10-day Simple Moving Average of the RHP, which makes it a smoothed version of RHP. You can find many articles about High-Low Index on the net.
High-Low Index above 50 indicates that there are more new highs than new lows, and considered as Bullish.
High-Low Index below 50 indicates that there are more new lows than new highs, and considered as Bearish.
High-Low Index = 0 indicates there is no new highs (0% new highs).
High-Low Index = 100 indicates that there is at least 1 new high and no new lows.
and High-Low Index = 50 indicates that new highs and new lows is equal.
by default 40 cryptos are used in the script and shows High-Low Index for these cryptos. but you can change them as you wish. for example you can set all of them as stocks and see High-Low Index for these stocks.
You can set " Time frame " and the " Length " using the options. For example; if you set " Time frame " = 1 Week and the " Length " = 52 then it finds High-Low Index for 52weeks .
or another example; if you set " Time frame " = 1 Day and the " Length " = 22 the High-Low Indexn it finds High-Low Index for 22days.
You can enable/disable Record High Percent or Simple Moving Average of High-Low Index. Some traders use High-Low Index with its SMA, for example; High-Low Index generates a buy signal when it crosses above its moving average, and a sell signal when it crosses below its moving average.
Optionally you can see the securities in a table on the left bottom, you can change table size by usşng the options.
In the Table, for each security/cell;
=> if background is green then it has New High
=> if background is red then it has New Low
=> if background is gray then no New High, no New Low
=> if background is back then Data is not available for the security
As you can see in the screenshot below, the securities were changed and stocks are used instead of cryptos, so it calculates & shows High-Low Index for these stocks.
you can also find explanation in this screenshot:
Enjoy!

Trend Following with Bollinger BandsThis is a trend following system which uses the Bollinger Bands instead of the Donchian Channels.
Long position:
* Price closes above the middle line.
* The fast EMA (in this case the 40) crosses over or is above the slow one (in this case the 120)
Short position:
* Price closes below the middle line.
* The fast EMA crosses under or is below the slow one.
Stoploss:
* 4 ATRs away from the price.

Joint Conditions Strategy Suite + TradingConnector alerts bot"Please give us combined alerts with the possibility of having several conditions in place to trigger the alert." - was the top voted request from users under one of the recent blogposts by TradingView.
Ask and you shall receive ;)
TradingView is a great platform, with unmatched set of functionalities, yet this particular combo of features indeed seems not to be in place. Fortunately, TradingView is also very open platform, thanks to PineScript coding language, which enables developing combos like the requried one and plenty of other magic.
I have already published numerous "educational" scripts, showing how to code indicators and alerts with PineScript, but... this is not one of them. This one is for real. READY FOR USE on real markets, also by the non-coding traders. Just take my script, set parameters with dropdowns, backtest the strategy, fire the alerts and execute them.
HOW TO USE IT
In "Settings" popup I tried to mimic the CreateAlert popup dropdowns for selecting logic. Let's say you want to enter Long position at Stochastic KxD crossover. In first line of Long Entry conditions set "StochK" + "Crossing Up" + "StochD". Last field doesn't matter because in 3rd dropdown something else than "value" was selected. In second line you could set "maB" + "Greater Than" + "maC" to filter out those entries which are in direction of the uptrend. And yeah, add ADX>25 to make sure the market is actually moving: "ADX" + "Greater Than" + "value" + "25". All condition lines must be TRUE (or skipped) for the entry to be triggered. Toghether with an alert.
The same for Short entries. Combinations are limitless.
INDICATORS AND MTF (MULTI-TIMEFRAME)
In those dropdowns you can select candle values like open/close/high/low/ohlc4, but also some most popular indicators, which I have pre-built into this script: RSI, various Moving Averages, ADX-DMI, Stochastic and Bollinger Bands for start. You can configure parameters of those indicators also in "Settings" popup, in "Indicator Definitions" section. What's important, you can use any of these indicators from higher timeframe, setting MTF multiplier. So if you applied this indicator to 1h chart, but want to use rsi(close,14) from 4h chart, set MTF to 4. If you want to use current timeframe indicators, keep MTF at 1, which is a default setting here.
Note for coders: to keep focus of this script on joining conditions, entire logic for those indicators has been moved to external library, also open source. I encourage you to dig into the code and see how it's done. I love the addition of libraries concept in PineScript.
CUSTOM INDICATOR
Following the "openness" spirit of my master - which is TradingView itself - my work is also open, in 2 ways:
1. This script is open source. So you can grab it, modify or add any functionalities you want. I cannot and don't want to stop you from doing that. I'm asking for only one favor - please mention this source script in your credits.
2. You can import the plot (series) from any other indicator on TradingView. In Settings popup of my script, scroll down to "Indicator Definitions" section, and select the series of your choice in the first dropdown. Now it is ready to use in conditions dropdowns on top of the Settings popup.
Let me give you an example of that last scenario. Take another script of mine, "Pivot Points on SR lines DEMO". You can find it in "Indicators & Strategies" library or here: (). Attach it to your chart. Now come back to THIS script, open Settings popup and in "Custom Indicator aka Imported Source" select "Pivot Points on SR lines: ...". The way it works - it detects if a pivot point happened on Support/Resistance line from the past and returns 1 for PivotLow and -1 for Pivot High. Now in first Long Entry condition set: "custom indicator" + "Greater Than" + "value" + "0" and long entries will be marked on every pivot low noticed on Support/Resistance line.
ALERTS
Last but not least - the alerts. This script produces alerts on the entries calculated by strategy logic, as marked on the chart by the backtester. Moreover, syntax of those alerts is already prepared and fully compatible with TradingConnector - alerts executing tool (bot), if you want to auto-execute those trades. Apart from installing the tool, you need to set
up the alerts in TradingView, here is how:
open CreateAlert popup
in first dropdown select "Joint Conditions Strategy Template"
in second dropdown select "alert() function calls only"
And that's all. You only need to set one alert for the whole script, not one for Longs and one for Shorts as it was in the past. Also, you don't need to setup closing alerts, because stop-loss/take-profit/trailing-stop information is embedded in the entry alert so your broker receives it as early as possible. Alerts sent will look like this: "long sl=40 tp=80", which is exactly what TradingConnector expects.
Phew, that's all folks. If you think I should add something to this template (maybe other indicators?) please let me know in comments or via DM. Happy trading!
P.S. Pyramiding is not supported in this script.
Disclaimer : I'm not saying above combination of conditions will make you money. Actually none of this can be considered financial advice. It is only a software tool. Use it wisely, be aware of the risk and do your own research!

Sentiment Estimator [AstrideUnicorn]Sentiment Estimator is an indicator that estimates market sentiment using only its pricing data. It counts bullish and bearish candles in a rolling window and calculates their relative values as percentages of the total amount of candles in the window. Market sentiment shows the direction in which the market is biased to move or the current trend direction. Extreme values of the market sentiment are contrarian signals. When the market sentiment is too bullish, it is time to sell and vice versa.
HOW TO USE
Sentiment Estimator plots a pair of green and red circles for each candle. They represent bullish and bearish sentiments, respectively.
The vertical positions of the circles show corresponding sentiment values in percentage units. For example, if a green circle's height is 60, the market is 60% bullish. In this case, the red circle's height will be 40, as bullish and bearish parts of the market sentiment sum to 100%.
The blue line plotted at the 50% level shows the neutral sentiment level. If a green circle is above the blue line, the prevailing market sentiment at that time is bullish, and the market is biased to move up. If a red one is above, the market has predominantly bearish sentiment and is prone to move down.
The red level shows extreme sentiment level. If a green or red circle is above this line, it means that the market is extremely bullish or bearish, respectively. It is a contrarian signal, and one can expect a reversal soon. In this case, a blue label with the text "reversal expected" is shown.
SETTINGS
Timeframe - allows choosing a timeframe other than the chart's one for the indicator calculation.
Look-Back Window - sets the historical window length used to perform the calculations. You can adjust the window to get the best results for a particular market or timeframe.

Rebalance as a Bear/Bull indicatorCheck if the current market has a Bear tendency or a Bull tendency.
Bear areas are marked as red squares going down from 0.
Bull areas are marked as green squares going up from 0.
Buying/Selling windows of opportunity
On top of the Bear/Bull squares, this indicator tries to show you the windows where to look for good buying/selling opportunities.
These are marked as full columns:
Blue columns represent a window to look out for good buying opportunities
Pink columns represent a window to look out for good selling opportunities
How is this possible?
This is an indicator of a simple idea to check if the market has a Bear or Bull tendency:
1. Start with a virtual portfolio of 60/40 tokens per fiat.
2. Rebalance it when its ratio oscillates by a given % (first input)
3. Count the number of times the rebalancer buys, and sells
4. When the number of buys is greater than the number of sells => the market is going down
5. When the number of sells is greater than the number of buys => the market is going up
This is shown as the "Bear/Bull Strength" squares (red when bear, green when bull)
An extra rebalancer is also kept that works at each bar (regardless of the input %).
This is used to calculate an amount of tokens beying sold/bought and used as a "market force" coefficient.
Another extra: based on both the bear/bull strengh and market force an attempt is made to
provide good buying/selling windows of analysis.
The blue background is a buying opportunity, the red background is a sell opportunity.
In a bear market sales are delayed, and in a bull market buys are delayed.

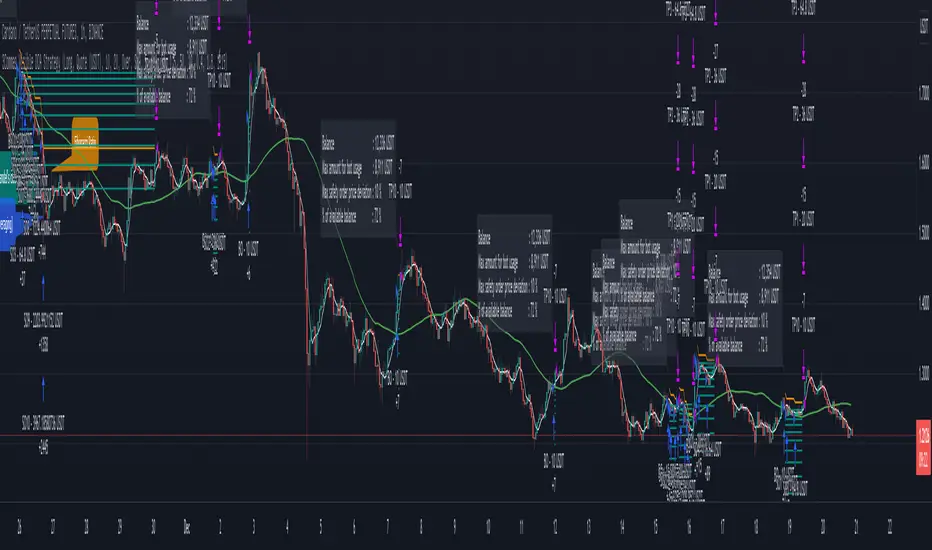
3Commas Visible DCA StrategyThis strategy consists of the following elements and can all be set by the user.
1. Entry by moving average cross.
1) Selection of moving average line.
- SMA(Simple Moving Average)
- EMA(Exponential Moving Average)
- HMA(Hull Moving Average)
2) Selection of Cross over / Cross under
2. Add Entry by DCA(Dollar Cost Averaging)
- A DCA strategy is the practice of investing into a currency at preset intervals to reduce the entry price of a position over time and mitigate volatility risk.
For example,
Base Order = 10 Dollar at Price 100%
Safety Order1 = 20 Dollar at Price 90%
Safety Order2 = 40 Dollar at Price 80%
Average Price => Price 80~90%
thereby getting a better average price for your position and greatly reducing risks from the consequences of volatility.
3. Target Price and Stop Loss.
1) Target Price : Realize profits at % set from the average unit price.
2) Stop Loss : Stop Loss % set from the last safety order.
You can easily find out what's related by changing the setting value after setting the strategy.
This strategy has the following Good characteristics.
1. It informs you of the assets required according to DCA settings.
If you are short of assets, a warning sign will appear.
2. Amount of assets invested in each long entry and long entry close.
3. Visibility of the lowest purchase price line and DCA purchase location according to DCA setting.
easily check the values set in the backtest.
I hope it will help you. Thank you.
Bollinger Band Breakout Positional Strategy- BN -15M This strategy consists of following criteria:
Buy:
1. Candle should have RSI is above 60 and Close above Bollinger band upper limit
2. Exit When candle is closed below 20MA
Sell:
1. Candle should have RSI is above 40 and Close below Bollinger band lower limit
2. Exit When candle is closed above 20MA
Checkout results.

ADX Screener// Identify potential trend reversals using ADX on up to 40 crypto assets.
// ADX shows the strength of a trend, not the direction.
// By monitoring the difference of ADX values between candles, you can potentially identify reversals before they happen.
// A strong trend has a 14 period ADX slope increasing .5 or more from the prior candle.
// At a minimum, a weak trend has a 14 period ADX slope of +.25 or less, and strictly it would be decreasing.
// This indicator prints one row for each asset with three columns for ADX differences one candle back each.
// The asset name is colored green or red dependent on whether +DI > -DI or not.
The market was in a down trend (-DI > +DI).
A bullish wave moved price up to EMA 8 resistance with strong ADX momentum (ADX diff of prior candle >= 0.5).
A Spinning Top showed that the trend was losing momentum (ADX diff lower than previous candle, showed the bullish wave losing momentum).
A Morning Star bearish reversal pattern draws resistance at the high of the pattern. (ADX Bullish momentum exhausted).
Symbol: -DI > +DI
2: Strong momentum
1: Losing momentum (spinning top)
0: Trend reversal (bearish engulfing pattern)

Multiple Indicators ScreenerA screener for multiple indicators with nice table output.
I was asked many times to update custom screener to display results in a table form. This way it looks much better.
You can play with background colors depend on values you're looking for.
In the screener, for example, I'm highlighting overbought/oversold RSI values, big ADX levels and trend of the Supertrend.
In parameters you can change settings for all indicators and change/disable tickers if 40 is too many for you.
There is only 1 function that calculates all these indicators. Potentially you can change and even add more indicators to this function.
Writing code for these kind of screener is a bit time consuming, so I even created a code generator in Python for these kind of indicators :) .
Disclaimer
Please remember that past performance may not be indicative of future results.
Due to various factors, including changing market conditions, the strategy may no longer perform as well as in historical backtesting.
This post and the script don’t provide any financial advice.

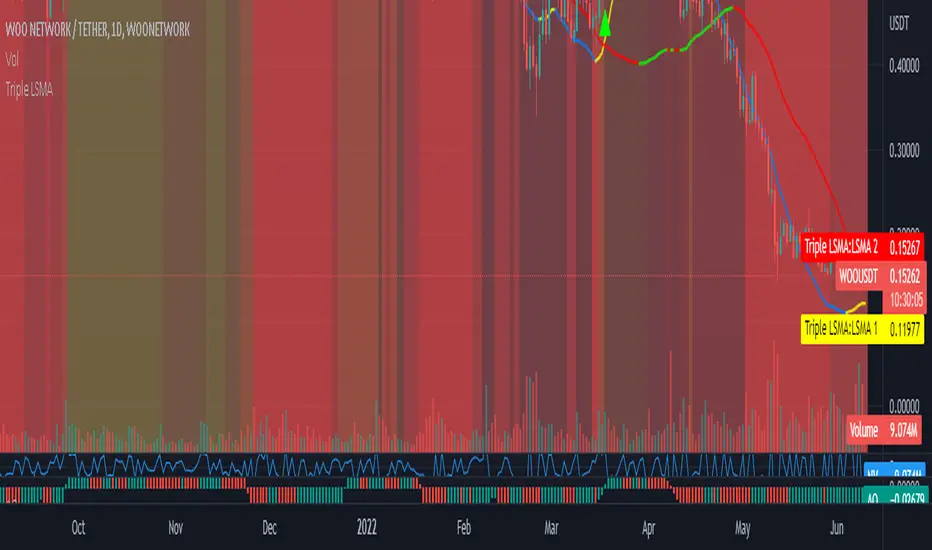
Triple Colored Least Squares Moving Average + Crossover AlertsThis script is forked from the ‘ Double Colored Least Squares Moving Average + Crossover Alerts ‘ from @IronKnightmare.
First release & notes : 2021-11-03.
Overview:
The Least Squares Moving Average is used mainly as a crossover signal to identify bullish or bearish trends. When a shorter duration line cross a longer one a trend can be identified. When multiple lines or the price action cross a longterm trend the confirmation can be further validated. Tradingview contains already some indicators with 1 or two LSMA trendlines that can be configured and toggled.
The original script that I forked had two LSMA lines that could be plotted with other valuable functions, I added a third for further confirmation as some trading systems will use three lines or some combination of those for validation.
Usage:
In inputs
- You will see LSMA 1, LSMA 2 & LSMA 3. The default values are 40, 100 & 400 representing the number of periods plotted by that line : fast, medium and slow changing trendlines will be plotted. The offset value and source are standard for most scripts.
In Style
- You can toggle LSMA 1, 2 or 3 and any combination of those. There are much more possibilities this way.
- For each LSMA, Color 0 & Color 1 are for coloring the slope of the trendline,
- Color 0 for rising slope,
- Color 1 for descending slope.
- The script will automatically color the rise or fall of the trendline accordingly. You can also set one identical color in both slopes for one unique color.
- The ‘ Long Crossover 1 on 2 ’ is a signal for when the LSMA 1 cross over the LSMA 2, usually a shorter periods trendline, more volatile, climbing over the medium term one. A Signal will be traced on the chart at that crossing, you can configure this. The ‘Short Crossover 1 on 2’ is when the LSMA 1 cross under the LSMA 2, a signal will be traced on the chart accordingly.
- The Long Crossover 1 on 3 & Short Crossover 1 on 3 act on the same principle, although the crossing of the fast LSMA on the long / slow LSMA are used. Both can be toggled.
- The ‘ Background Coloring Line 1 : 0-Neutral, 1-Up, 2-Down ’ is an optional background coloring for the LSMA1 line. This can provide additional information at a quick glance, especially if you combine the two other lines backgrounds, the partial transparency will compound.