FNGAdataOpenOpen prices for FNGA ETF (Dec 2018–May 2025)
The FNGA ETF (originally launched under the FNGU ticker before being renamed in March 2025) tracked the MicroSectors FANG+™ Index with 3x daily leverage and was designed to give traders magnified exposure to a concentrated basket of large-cap technology and tech-enabled companies. The fund’s price history contains multiple phases due to ticker changes, corporate actions, and its eventual redemption in mid-2025.
When looking specifically at Open prices from December 2018 through May 2025, this dataset provides the daily opening values for FNGA across its entire lifecycle. The opening price is the first traded price at the start of each regular U.S. market session (9:30 a.m. Eastern Time). It is an important measure for traders and analysts because it reflects overnight sentiment, pre-market positioning, and often sets the tone for intraday volatility.
Tìm kiếm tập lệnh với "文华财经tick价格"

POC Migration Velocity (POC-MV) [PhenLabs]📊POC Migration Velocity (POC-MV)
Version: PineScript™v6
📌Description
The POC Migration Velocity indicator revolutionizes market structure analysis by tracking the movement, speed, and acceleration of Point of Control (POC) levels in real-time. This tool combines sophisticated volume distribution estimation with velocity calculations to reveal hidden market dynamics that conventional indicators miss.
POC-MV provides traders with unprecedented insight into volume-based price movement patterns, enabling the early identification of continuation and exhaustion signals before they become apparent to the broader market. By measuring how quickly and consistently the POC migrates across price levels, traders gain early warning signals for significant market shifts and can position themselves advantageously.
The indicator employs advanced algorithms to estimate intra-bar volume distribution without requiring lower timeframe data, making it accessible across all chart timeframes while maintaining sophisticated analytical capabilities.
🚀Points of Innovation
Micro-POC calculation using advanced OHLC-based volume distribution estimation
Real-time velocity and acceleration tracking normalized by ATR for cross-market consistency
Persistence scoring system that quantifies directional consistency over multiple periods
Multi-signal detection combining continuation patterns, exhaustion signals, and gap alerts
Dynamic color-coded visualization system with intensity-based feedback
Comprehensive customization options for resolution, periods, and thresholds
🔧Core Components
POC Calculation Engine: Estimates volume distribution within each bar using configurable price bands and sophisticated weighting algorithms
Velocity Measurement System: Tracks the rate of POC movement over customizable lookback periods with ATR normalization
Acceleration Calculator: Measures the rate of change of velocity to identify momentum shifts in POC migration
Persistence Analyzer: Quantifies how consistently POC moves in the same direction using exponential weighting
Signal Detection Framework: Combines trend analysis, velocity thresholds, and persistence requirements for signal generation
Visual Rendering System: Provides dynamic color-coded lines and heat ribbons based on velocity and price-POC relationships
🔥Key Features
Real-time POC calculation with 10-100 configurable price bands for optimal precision
Velocity tracking with customizable lookback periods from 5 to 50 bars
Acceleration measurement for detecting momentum changes in POC movement
Persistence scoring to validate signal strength and filter false signals
Dynamic visual feedback with blue/orange color scheme indicating bullish/bearish conditions
Comprehensive alert system for continuation patterns, exhaustion signals, and POC gaps
Adjustable information table displaying real-time metrics and current signals
Heat ribbon visualization showing price-POC relationship intensity
Multiple threshold settings for customizing signal sensitivity
Export capability for use with separate panel indicators
🎨Visualization
POC Connecting Lines: Color-coded lines showing POC levels with intensity based on velocity magnitude
Heat Ribbon: Dynamic colored ribbon around price showing POC-price basis intensity
Signal Markers: Clear exhaustion top/bottom signals with labeled shapes
Information Table: Real-time display of POC value, velocity, acceleration, basis, persistence, and current signal status
Color Gradients: Blue gradients for bullish conditions, orange gradients for bearish conditions
📖Usage Guidelines
POC Calculation Settings
POC Resolution (Price Bands): Default 20, Range 10-100. Controls the number of price bands used to estimate volume distribution within each bar
Volume Weight Factor: Default 0.7, Range 0.1-1.0. Adjusts the influence of volume in POC calculation
POC Smoothing: Default 3, Range 1-10. EMA smoothing period applied to the calculated POC to reduce noise
Velocity Settings
Velocity Lookback Period: Default 14, Range 5-50. Number of bars used to calculate POC velocity
Acceleration Period: Default 7, Range 3-20. Period for calculating POC acceleration
Velocity Significance Threshold: Default 0.5, Range 0.1-2.0. Minimum normalized velocity for continuation signals
Persistence Settings
Persistence Lookback: Default 5, Range 3-20. Number of bars examined for persistence score calculation
Persistence Threshold: Default 0.7, Range 0.5-1.0. Minimum persistence score required for continuation signals
Visual Settings
Show POC Connecting Lines: Toggle display of colored lines connecting POC levels
Show Heat Ribbon: Toggle display of colored ribbon showing POC-price relationship
Ribbon Transparency: Default 70, Range 0-100. Controls transparency level of heat ribbon
Alert Settings
Enable Continuation Alerts: Toggle alerts for continuation pattern detection
Enable Exhaustion Alerts: Toggle alerts for exhaustion pattern detection
Enable POC Gap Alerts: Toggle alerts for significant POC gaps
Gap Threshold: Default 2.0 ATR, Range 0.5-5.0. Minimum gap size to trigger alerts
✅Best Use Cases
Identifying trend continuation opportunities when POC velocity aligns with price direction
Spotting potential reversal points through exhaustion pattern detection
Confirming breakout validity by monitoring POC gap behavior
Adding volume-based context to traditional technical analysis
Managing position sizing based on POC-price basis strength
⚠️Limitations
POC calculations are estimations based on OHLC data, not true tick-by-tick volume distribution
Effectiveness may vary in low-volume or highly volatile market conditions
Requires complementary analysis tools for complete trading decisions
Signal frequency may be lower in ranging markets compared to trending conditions
Performance optimization needed for very short timeframes below 1-minute
💡What Makes This Unique
Advanced Estimation Algorithm: Sophisticated method for calculating POC without requiring lower timeframe data
Velocity-Based Analysis: Focus on POC movement dynamics rather than static levels
Comprehensive Signal Framework: Integration of continuation, exhaustion, and gap detection in one indicator
Dynamic Visual Feedback: Intensity-based color coding that adapts to market conditions
Persistence Validation: Unique scoring system to filter signals based on directional consistency
🔬How It Works
Volume Distribution Estimation:
Divides each bar into configurable price bands for volume analysis
Applies sophisticated weighting based on OHLC relationships and proximity to close
Identifies the price level with maximum estimated volume as the POC
Velocity and Acceleration Calculation:
Measures POC rate of change over specified lookback periods
Normalizes values using ATR for consistent cross-market performance
Calculates acceleration as the rate of change of velocity
Signal Generation Process:
Combines trend direction analysis using EMA crossovers
Applies velocity and persistence thresholds to filter signals
Generates continuation, exhaustion, and gap alerts based on specific criteria
💡Note:
This indicator provides estimated POC calculations based on available OHLC data and should be used in conjunction with other analysis methods. The velocity-based approach offers unique insights into market structure dynamics but requires proper risk management and complementary analysis for optimal trading decisions.

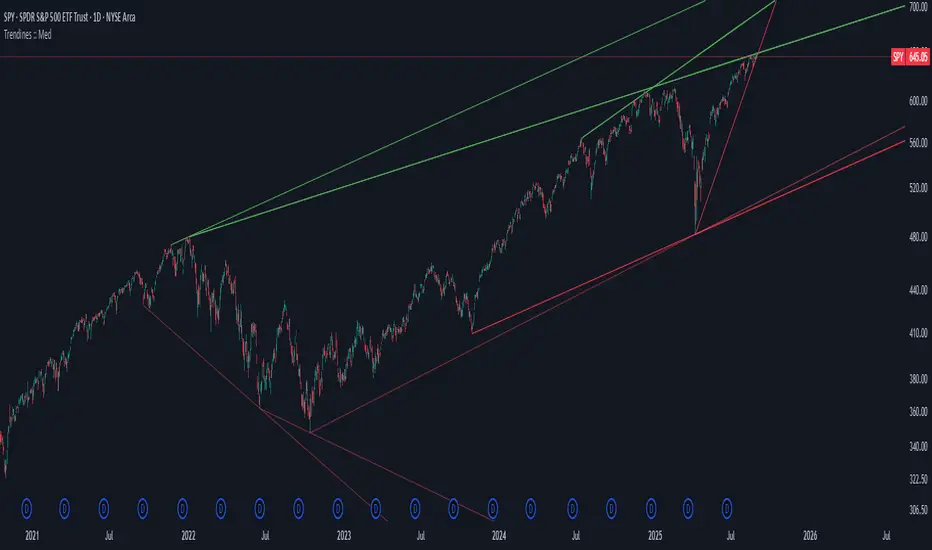
Algo + Trendlines :: Medium PeriodThis indicator helps me to avoid overlooking Trendlines / Algolines. So far it doesn't search explicitly for Algolines (I don't consider volume at all), but it's definitely now already not horribly bad.
These are meant to be used on logarithmic charts btw! The lines would be displayed wrong on linear charts.
The biggest challenge is that there are some technical restrictions in TradingView, f. e. a script stops executing if a for-loop would take longer than 0.5 sec.
So in order to circumvent this and still be able to consider as many candles from the past as possible, I've created multiple versions for different purposes that I use like this:
Algo + Trendlines :: Medium Period : This script looks for "temporary highs / lows" (meaning the bar before and after has lower highs / lows) on the daily chart, connects them and shows the 5 ones that are the closest to the current price (=most relevant). This one is good to find trendlines more thoroughly, but only up to 4 years ago.
Algo + Trendlines :: Long Period : This version looks instead at the weekly charts for "temporary highs / lows" and finds out which days caused these highs / lows and connects them, Taking data from the weekly chart means fewer data points to check whether a trendline is broken, which allows to detect trendlines from up to 12 years ago! Therefore it misses some trendlines. Personally I prefer this one with "Only Confirmed" set to true to really show only the most relevant lines. This means at least 3 candle highs / lows touched the line. These are more likely stronger resistance / support lines compared to those that have been touched only twice.
Very important: sometimes you might see dotted lines that suddenly stop after a few months (after 100 bars to be precise). This indicates you need to zoom further out for TradingView to be able to load the full line. Unfortunately TradingView doesn't render lines if the starting point was too long ago, so this is my workaround. This is also the script's biggest advantage: showing you lines that you might have missed otherwise since the starting bars were outside of the screen, and required you to scroll f. e back to 2015..
One more thing to know:
Weak colored line = only 2 "collision" points with candle highs/lows (= not confirmed)
Usual colored line = 3+ "collision" points (= confirmed)
Make sure to move this indicator above the ticker in the Object Tree, so that it is drawn on top of the ticker's candles!
More infos: www.reddit.com
Algo + Trendlines :: Long PeriodThis indicator helps me to avoid overlooking Trendlines / Algolines. So far it doesn't search explicitly for Algolines (I don't consider volume at all), but it's definitely now already not horribly bad.
These are meant to be used on logarithmic charts btw! The lines would be displayed wrong on linear charts.
The biggest challenge is that there are some technical restrictions in TradingView, f. e. a script stops executing if a for-loop would take longer than 0.5 sec.
So in order to circumvent this and still be able to consider as many candles from the past as possible, I've created multiple versions for different purposes that I use like this:
Algo + Trendlines :: Medium Period : This script looks for "temporary highs / lows" (meaning the bar before and after has lower highs / lows) on the daily chart, connects them and shows the 5 ones that are the closest to the current price (=most relevant). This one is good to find trendlines more thoroughly, but only up to 4 years ago.
Algo + Trendlines :: Long Period : This version looks instead at the weekly charts for "temporary highs / lows" and finds out which days caused these highs / lows and connects them, Taking data from the weekly chart means fewer data points to check whether a trendline is broken, which allows to detect trendlines from up to 12 years ago! Therefore it misses some trendlines. Personally I prefer this one with "Only Confirmed" set to true to really show only the most relevant lines. This means at least 3 candle highs / lows touched the line. These are more likely stronger resistance / support lines compared to those that have been touched only twice.
Very important: sometimes you might see dotted lines that suddenly stop after a few months (after 100 bars to be precise). This indicates you need to zoom further out for TradingView to be able to load the full line. Unfortunately TradingView doesn't render lines if the starting point was too long ago, so this is my workaround. This is also the script's biggest advantage: showing you lines that you might have missed otherwise since the starting bars were outside of the screen, and required you to scroll f. e back to 2015..
One more thing to know:
Weak colored line = only 2 "collision" points with candle highs/lows (= not confirmed)
Usual colored line = 3+ "collision" points (= confirmed)
Make sure to move this indicator above the ticker in the Object Tree, so that it is drawn on top of the ticker's candles!
More infos: www.reddit.com

High Volume Candles - RVolInspired by Key bars from Option Stalker Pro.
This one is meant to be used on charts where the interval is >=1D.
Highlights candles where RVol is > 1.2.
Helps to not accidentally miss that a candle move happened on high volume (or that it did not happen on high volume...), like potential reversals or resistance/support breaks.
Make sure to move this indicator above the ticker in the Object Tree, so that it is drawn on top of the ticker's candles.
More infos: www.reddit.com

High Volume CandlesInspired by Key bars from Option Stalker Pro.
This one is meant to be used on charts where the interval is <1D.
Highlights candles in chart with Volume > 1.4 * last 30 candles average volume.
Helps to not accidentally miss that a candle move happened on high volume (or that it did not happen on high volume...), like potential reversals or resistance/support breaks.
Make sure to move this indicator above the ticker in the Object Tree, so that it is drawn on top of the ticker's candles.
More infos: www.reddit.com

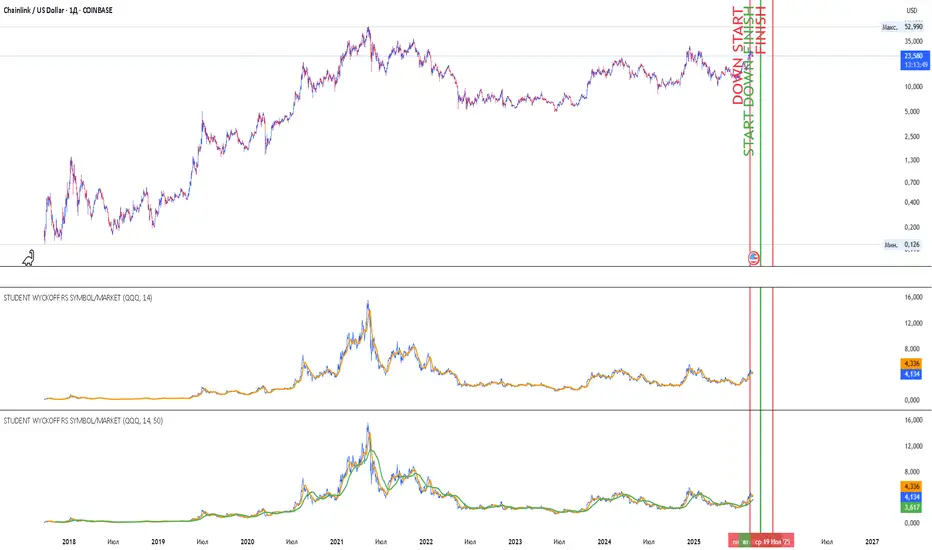
Student Wyckoff RS Symbol/MarketRelative Strength Indicator STUDENT WYCKOFF RS SYMBOL/MARKET
Description
The Relative Strength (RS) Indicator compares the price performance of the current financial instrument (e.g., a stock) against another instrument (e.g., an index or another stock). It is calculated by dividing the closing price of the first instrument by the closing price of the second, then multiplying by 100. This provides a percentage ratio that shows how one instrument outperforms or underperforms another. The indicator helps traders identify strong or weak assets, spot market leaders, or evaluate an asset’s performance relative to a benchmark.
Key Features
Relative Strength Calculation: Divides the closing price of the current instrument by the closing price of the second instrument and multiplies by 100 to express the ratio as a percentage.
Simple Moving Average (SMA): Applies a customizable Simple Moving Average (default period: 14) to smooth the data and highlight trends.
Visualization: Displays the Relative Strength as a blue line, the SMA as an orange line, and colors bars (blue for rising, red for falling) to indicate changes in relative strength.
Flexibility: Allows users to select the second instrument via an input field and adjust the SMA period.
Applications
Market Comparison: Assess whether a stock is outperforming an index (e.g., S&P 500 or MOEX) to identify strong assets for investment.
Sector Analysis: Compare stocks within a sector or against a sector ETF to pinpoint leaders.
Trend Analysis: Use the rise or fall of the RS line and its SMA to gauge the strength of an asset’s trend relative to another instrument.
Trade Timing: Bar coloring helps quickly identify changes in relative strength, aiding short-term trading decisions.
Interpretation
Rising RS: Indicates the first instrument is outperforming the second (e.g., a stock growing faster than an index).
Falling RS: Suggests the first instrument is underperforming.
SMA as a Trend Filter: If the RS line is above the SMA, it may signal strengthening performance; if below, weakening performance.
Settings
Instrument 2: Ticker of the second instrument (default: QQQ).
SMA Period: Period for the Simple Moving Average (default: 14).
Notes
The indicator works on any timeframe but requires accurate ticker input for the second instrument.
Ensure data for both instruments is available on the selected timeframe for precise analysis.
Future Value ProjectionFuture Value Projection with Actual CAGR
This indicator calculates the future value (FV) of the current ticker’s price using its historical Compound Annual Growth Rate (CAGR). It measures how much the price has grown over a chosen lookback period, derives the average annual growth rate, and then projects the current price forward into the future.
Formulae:
CAGR:
CAGR = ( PV_now / PV_past )^(1 / t) - 1
Future Value:
FV = PV_now × ( 1 + CAGR / n )^( n × T )
Where:
PV_now = Current price
PV_past = Price t years ago
t = Lookback period (years)
CAGR = Compound Annual Growth Rate
n = Compounding periods per year (1=annual, 12=monthly, 252=daily, etc.)
T = Projection horizon (years forward)
How it works:
Select a lookback period (e.g., 3 years).
The script finds the price from that time and computes the CAGR.
It then projects the current price forward by T years using the CAGR.
The chart shows:
Current price (blue)
Projected FV target (green)
A table with CAGR and projection details
Use case:
Helps investors and traders visualize long-term growth projections if the ticker continues growing at its historical pace.

FlowFusion Money Flow — FP + VWAP Drift + PVT (−100..+100)Title (ASCII only)
FlowFusion Money Flow — Flow Pressure + Rolling VWAP Drift + PVT (Normalized −100..+100)
Short Description
Original money-flow oscillator combining Flow Pressure, Rolling VWAP Drift, and PVT Momentum into one normalized score (−100..+100) with a signal line, thresholds, optional component plots, and ready-made alerts.
Full Description (meets “originality & usefulness”)
What’s original
FlowFusion Money Flow is not a generic mashup. It builds a single score from three complementary, volume-aware components that target different facets of order flow:
Flow Pressure (FP) — In-bar directional drive scaled by relative volume.
Drive
=
close
−
open
max
(
high
−
low
,
tick
)
∈
=
max(high−low, tick)
close−open
∈ .
Relative Volume
=
volume
average volume over
𝑓
𝑝
𝐿
𝑒
𝑛
=
average volume over fpLen
volume
.
𝐹
𝑃
𝑟
𝑎
𝑤
=
Drive
×
RelVol
FP
raw
=Drive×RelVol then squashed (softsign) to
.
Why it belongs: distinguishes real pushes (big body and big volume) from noise.
Rolling VWAP Drift — Direction of VWAP itself over a rolling window, normalized by ATR.
𝑉
𝑊
𝐴
𝑃
𝑡
=
∑
(
𝑇
𝑃
×
𝑉
𝑜
𝑙
)
∑
𝑉
𝑜
𝑙
VWAP
t
=
∑Vol
∑(TP×Vol)
over vwapLen.
Drift
=
𝑉
𝑊
𝐴
𝑃
𝑡
−
𝑉
𝑊
𝐴
𝑃
𝑡
−
1
𝐴
𝑇
𝑅
=
ATR
VWAP
t
−VWAP
t−1
→ squashed to
.
Why it belongs: persistent VWAP movement signals sustained accumulation/distribution.
PVT Momentum — Price-Volume Trend standardized (z-score) and squashed.
𝑃
𝑉
𝑇
𝑡
=
𝑃
𝑉
𝑇
𝑡
−
1
+
𝑉
𝑜
𝑙
×
Δ
𝐶
𝑙
𝑜
𝑠
𝑒
𝐶
𝑙
𝑜
𝑠
𝑒
𝑡
−
1
PVT
t
=PVT
t−1
+Vol×
Close
t−1
ΔClose
.
𝑧
=
𝑃
𝑉
𝑇
−
SMA
(
𝑃
𝑉
𝑇
)
StDev
(
𝑃
𝑉
𝑇
)
z=
StDev(PVT)
PVT−SMA(PVT)
→ squashed to
.
Why it belongs: captures volume-weighted trend pressure without relying on price alone.
Composite score:
Score
=
𝑤
𝐹
𝑃
⋅
𝐹
𝑃
+
𝑤
𝑉
𝑊
𝐴
𝑃
⋅
𝑉
𝑊
𝐴
𝑃
_
𝐷
𝑟
𝑖
𝑓
𝑡
+
𝑤
𝑃
𝑉
𝑇
⋅
𝑃
𝑉
𝑇
_
𝑀
𝑜
𝑚
𝑤
𝐹
𝑃
+
𝑤
𝑉
𝑊
𝐴
𝑃
+
𝑤
𝑃
𝑉
𝑇
Score=
w
FP
+w
VWAP
+w
PVT
w
FP
⋅FP+w
VWAP
⋅VWAP_Drift+w
PVT
⋅PVT_Mom
with a Signal = SMA(Score, sigLen). Thresholds mark strong accumulation/distribution zones.
How it works (step-by-step)
Compute FP, VWAP Drift, PVT Momentum.
Normalize each to the same
scale.
Weighted average → FlowFusion Score.
Smooth with a Signal line to reduce whipsaw.
Optional background shading when Score exceeds thresholds.
How to use
Direction filter:
Score > 0 favors longs; Score < 0 favors shorts.
Momentum turns:
Score crosses above Signal → setup for long; below → setup for short.
Strength zones:
Above Upper Threshold (default +40) = strong buy pressure; below Lower (−40) = strong sell pressure.
Confluence:
Best near S/R, trendlines, or HTF bias. For scalping on 1–5m, consider sigLen 9–13 and thresholds ±40 to ±50.
Alerts included: zero cross, zone entries, and Score/Signal crossovers.
Inputs (key)
fpLen (20): relative-volume lookback for Flow Pressure.
vwapLen (34): rolling VWAP window.
pvtLen (50): PVT z-score window.
sigLen (9): Signal smoothing.
Weights: wFP, wVWAP, wPVT to bias the blend.
Thresholds: upperBand / lowerBand (defaults +40/−40).
Display: toggle component plots and background shading.
Best practices
Trending markets: increase wVWAP (VWAP Drift) or widen thresholds.
Ranging markets: increase wFP and wPVT; take quicker profits.
News: wait for bar close confirmation or reduce size.
Data quality: use consistent volume feeds (especially in crypto).
Limitations
Oscillators can stay extreme in strong trends; use structure/trend filters.
Volume anomalies (illiquid pairs, API glitches) can distort signals—sanity-check with another venue when possible.
Disclaimer
This indicator is for educational purposes only and is not financial advice. Trading involves risk; past performance does not guarantee future results. Always paper-trade first and use appropriate risk controls.

ForecastForecast (FC), indicator documentation
Type: Study, not a strategy
Primary timeframe: 1D chart, most plots and the on-chart table only render on daily bars
Inspiration: Robert Carver’s “forecast” concept from Advanced Futures Trading Strategies, using normalized, capped signals for comparability across markets
⸻
What the indicator does
FC builds a volatility-normalized momentum forecast for a chosen symbol, optionally versus a benchmark. It combines an EWMAC composite with a channel breakout composite, then caps the result to a common scale. You can run it in three data modes:
• Absolute: Forecast of the selected symbol
• Relative: Forecast of the ratio symbol / benchmark
• Combined: Average of Absolute and Relative
A compact table can summarize the current forecast, short-term direction on the forecast EMAs, correlation versus the benchmark, and ATR-scaled distances to common price EMAs.
⸻
PineScreener, relative-strength screening
This indicator is excellent for screening on relative strength in PineScreener, since the forecast is volatility-normalized and capped on a common scale.
Available PineScreener columns
PineScreener reads the plotted series. You will see at least these columns:
• FC, the capped forecast
• from EMA20, (price − EMA20) / ATR in ATR multiples
• from EMA50, (price − EMA50) / ATR in ATR multiples
• ATR, ATR as a percent of price
• Corr, weekly correlation with the chosen benchmark
Relative mode and Combined mode are recommended for cross-sectional screens. In Relative mode the calculation uses symbol / benchmark, so ensure the ratio ticker exists for your data source.
⸻
How it works, step by step
1. Volatility model
Compute exponentially weighted mean and variance of daily percent returns on D, annualize, optionally blend with a long lookback using 10y %, then convert to a price-scaled sigma.
2. EWMAC momentum, three legs
Daily legs: EMA(8) − EMA(32), EMA(16) − EMA(64), EMA(32) − EMA(128).
Divide by price-scaled sigma, multiply by leg scalars, cap to Cap = 20, average, then apply a small FDM factor.
3. Breakout momentum, three channels
Smoothed position inside 40, 80, and 160 day channels, each scaled, then averaged.
4. Composite forecast
Average the EWMAC composite and the breakout composite, then cap to ±20.
Relative mode runs the same logic on symbol / benchmark.
Combined mode averages Absolute and Relative composites.
5. Weekly correlation
Pearson correlation between weekly closes of the asset and the benchmark over a user-set length.
6. Direction overlay
Two EMAs on the forecast series plus optional green or red background by sign, and optional horizontal level shading around 0, ±5, ±10, ±15, ±20.
⸻
Plots
• FC, capped forecast on the daily chart
• 8-32 Abs, 8-32 Rel, single-leg EWMAC plus breakout view
• 8-32-128 Abs, 8-32-128 Rel, three-leg composite views
• from EMA20, from EMA50, (price − EMA) / ATR
• ATR, ATR as a percent of price
• Corr, weekly correlation with the benchmark
• Forecast EMA1 and EMA2, EMAs of the forecast with an optional fill
• Backgrounds and guide lines, optional sign-based background, optional 0, ±5, ±10, ±15, ±20 guides
Most plots and the table are gated by timeframe.isdaily. Set the chart to 1D to see them.
⸻
Inputs
Symbol selection
• Absolute, Relative, Combined
• Vs. benchmark for Relative mode and correlation, choices: SPY, QQQ, XLE, GLD
• Ticker or Freeform, for Freeform use full TradingView notation, for example NASDAQ:AAPL
Engine selection
• Include:
• 8-32-128, three EWMAC legs plus three breakouts
• 8-32, simplified view based on the 8-32 leg plus a 40-day breakout
EMA, applied to the forecast
• EMA1, EMA2, with line-width controls, plus color and opacity
Volatility
• Span, EW volatility span for daily returns
• 10y %, blend of long-run volatility
• Thresh, Too volatile, placeholders in this version
Background
• Horizontal bg, level shading, enabled by default
• Long BG, Hedge BG, colors and opacities
Show
• Table, Header, Direction, Gain, Extension
• Corr, Length for correlation row
Table settings
• Position, background, opacity, text size, text color
Lines
• 0-lines, 10-lines, 5-lines, level guides
⸻
Reading the outputs
• Forecast > 0, bullish tilt; Forecast < 0, bearish or hedge tilt
• ±10 and ±20 indicate strength on a uniform scale
• EMA1 vs EMA2 on the forecast, EMA1 above EMA2 suggests improving momentum
• Table rows, label colored by sign, current forecast value plus a green or red dot for the forecast EMA cross, optional daily return percent, weekly correlation, and ATR-scaled EMA9, EMA20, EMA50 distances
⸻
Data handling, repainting, and performance
• Daily and weekly series are fetched with request.security().
• Calculations use closed bars, values can update until the bar closes.
• No lookahead, historical values do not repaint.
• Weekly correlation updates during the week, it finalizes on weekly close.
• On intraday charts most visuals are hidden by design.
⸻
Good practice and limitations
• This is a research indicator, not a trading system.
• The fixed Cap = 20 keeps a common scale, extreme moves will be clipped.
• Relative mode depends on the ratio symbol / benchmark, ensure both legs have data for your feed.
⸻
Credits
Concept inspired by Robert Carver’s forecast methodology in Advanced Futures Trading Strategies. Implementation details, parameters, and visuals are specific to this script.
⸻
Changelog
• First version
⸻
Disclaimer
For education and research only, not financial advice. Always test on your market and data feed, consider costs and slippage before using any indicator in live decisions.

Index Position Size Calculator for [US30 / US100 / SP500]What it does
This tool helps you size positions consistently for index trades on US30 (Dow Jones), NAS100 (Nasdaq-100), and SP500 (S&P 500). Enter your account balance, risk %, and your planned Entry / Stop-Loss / Target and the script calculates:
• Position Size (rounded to your lot/contract step)
• Risk-to-Reward (R/R)
• Potential P/L in USD based on your inputs
• Visual Entry / SL / TP lines with green/red zones and concise labels
Supported contract styles
Choose a preset for common products (e.g., CFD $1/pt, YM/NQ/ES futures, MYM/MNQ/MES micros) or override the economics yourself. You remain in control of the two key levers:
• $/point — how many dollars you gain/lose per 1 index point per contract/lot
• Point size — how many price units equal 1 index point on your chart (often 1.0, but some brokers use 0.1 or 0.5)
Inputs
• Account Balance ($) and Risk % per trade
• Index: US30 / NAS100 / SP500
• Contract: CFD / Futures (YM, NQ, ES) / Micros (MYM, MNQ, MES)
• $/point: auto from Contract or manual override
• Point size: auto from Index or manual override
• Position size step: rounding (e.g., 1 for futures, 0.01 for CFDs)
• Entry / SL / TP: typed values (snapped to tick), with on-chart zones and labels
• Display toggles for lines and labels
How the math works
• StopPoints = |Entry − SL| ÷ PointSize
• ProfitPoints = |TP − Entry| ÷ PointSize
• Position Size = (AccountBalance × Risk%) ÷ (StopPoints × $/point)
• R/R = ProfitPoints ÷ StopPoints
• Potential P/L = PositionSize × Points × $/point
How to use (quick start)
1. Select Index and Contract.
2. Confirm $/point and Point size match your broker’s specs.
3. Enter Entry / SL / TP for the trade idea.
4. Read the Position Size, R/R, and Potential P/L in the info box.
5. Adjust for fees, spreads, and slippage as needed.
Notes & limitations
• Broker symbols can vary. Always verify $/point and Point size for your instrument before risking capital.
• The script does not place orders and does not generate trade signals; it’s a sizing/visualization tool.
• Results can differ across brokers due to pricing, spreads, minimum lot sizes, and execution rules.
• Use on the intended indices; you’ll see a reminder if you load it elsewhere.
Changelog highlights
• Pine v6, constant-safe inputs, tick-snapping, global fills (no local-scope errors).
• Robust label handling and optional minimal chart markers.
Disclaimer
This script is provided for educational purposes only and does not constitute financial advice or a recommendation to buy or sell any security or derivative. Trading involves risk, including the possible loss of principal. Always do your own research, verify contract specifications with your broker, and consider testing in a demo environment before trading live.

1H Cross into Daily Bollinger UpperIndicator to spot volatility in a ticker.
The price moving above indicates a potential breakout and can be observed in such manner.
FibonacciRetracementHi all!
This library will help you draw Fibonacci retracement levels (zones). The code is from my indicator "Fibonacci retracement" (). You can see that description for more information about the behaviour and example of how to use this library. The code is almost the same with the addition of alerts. If the alert frequency is 'alert.freq_once_per_bar_close' alert messages will be concatenated and have a header saying how many messages it contains (if it's more than 1).
Hope this is of help!
Library "FibonacciRetracement"
ConcateAlerts(context)
Concatenates all alerts from the bar to one string (separated by new lines) and clears alert messages on the current bar.
Parameters:
context (Context)
AddAlert(context, message, unshiftInsteadOfPush)
Parameters:
context (Context)
message (string)
unshiftInsteadOfPush (bool)
Range(context, structure, settings)
Will return values if new levels/zones should be drawn.
Parameters:
context (Context) : The 'Context' for the Fibonacci retracement.
structure (Structure type from mickes/PriceAction/1) : The current 'Structure' from the 'MarketStructure' library.
settings (Settings) : The 'Settings' object for the 'Context'.
Returns: A tuple with the start and end pivot if new zones should be drawn, ' ' otherwise.
DrawAll(context, settings, start, end)
Draws lines and labels for the zone. It will also set the 'Price' value that will be used for absolute positions.
Parameters:
context (Context) : The 'Context' for the Fibonacci retracement.
settings (Settings) : The 'Settings' object for the 'Context'.
start (Pivot type from mickes/PriceAction/1)
end (Pivot type from mickes/PriceAction/1)
AlertActive(context, settings)
Will alert for all zones that are active. If multiple alert messages are added they will be concatenated (separated by a new line) with a header saying how many messages the alert contains.
Parameters:
context (Context) : The 'Context' for the Fibonacci retracement. This contains the zones that will be alerted if price (wick or close according to the settings) enters it.
settings (Settings) : The 'Settings' object for the 'Context'.
TrendlineSettings
Holds all the values for 'TrendlineSettings'.
Fields:
Enabled (series bool) : If the trendline should be visible or not.
Color (series color) : The color of the trendline.
Style (series string) : The style of the trendline (as a string).
GenericZonesSettings
Holds all the values for 'GenericZonesSettings', that will be applicable to all drawn objects.
Fields:
ExtendRight (series bool) : If all lines should extend to the right or not.
Style (series string) : The style of all drawn lines
Reverse (series bool) : If true, all lines will be reversed.
Prices (series bool) : If price levels should be shown or not.
Levels (series bool) : If levels should be shown or not.
LevelsValue (series string) : Either 'Value' or 'Percent'. Defined if value or percentage should be shown.
FontSize (series int) : The for size of the text in labels drawn.
LabelsPosition (series string) : Coul be 'Left', 'Rigth' or 'Adapt'. 'Adapt' will try to adapt the labels position to the prices.
ZoneSettings
Holds all the values for 'ZoneSettings'.
Fields:
Enabled (series bool) : If this zone is enabled or not.
Level (series float) : The level of the zone.
Color (series color) : The color that will be displayed.
Price (series float) : The price of the level. Will be set internally.
Settings
Holds all the values for 'Settings'.
Fields:
PivotLeftLength (series int) : The left length used to find pivots through the 'MarketStructure' library.
PivotRightLength (series int) : The right length used to find pivots through the 'MarketStructure' library.
Trendline (TrendlineSettings) : The settings for the 'Trendline' object.
GenericZonesSettings (GenericZonesSettings) : The setting applicable to all zones.
AlertFrequency (series string) : The frequency for the alerts. If 'alert.freq_once_per_bar_close', alert messages will be concatenated and have a header saying how many messages it contains (if it's more than 1).
AlertPrice (series string) : The price that has to enter a zone. Can be 'Close' (the closing price) or 'Wick' (the whole candle needs to be in the zone).
Zone1 (ZoneSettings) : The 'ZoneSettings' that represents this zone.
Zone2 (ZoneSettings) : The 'ZoneSettings' that represents this zone.
Zone3 (ZoneSettings) : The 'ZoneSettings' that represents this zone.
Zone4 (ZoneSettings) : The 'ZoneSettings' that represents this zone.
Zone5 (ZoneSettings) : The 'ZoneSettings' that represents this zone.
Zone6 (ZoneSettings) : The 'ZoneSettings' that represents this zone.
Zone7 (ZoneSettings) : The 'ZoneSettings' that represents this zone.
Zone8 (ZoneSettings) : The 'ZoneSettings' that represents this zone.
Zone9 (ZoneSettings) : The 'ZoneSettings' that represents this zone.
Zone10 (ZoneSettings) : The 'ZoneSettings' that represents this zone.
Zone11 (ZoneSettings) : The 'ZoneSettings' that represents this zone.
Zone12 (ZoneSettings) : The 'ZoneSettings' that represents this zone.
Zone13 (ZoneSettings) : The 'ZoneSettings' that represents this zone.
Zone14 (ZoneSettings) : The 'ZoneSettings' that represents this zone.
Zone15 (ZoneSettings) : The 'ZoneSettings' that represents this zone.
Zone16 (ZoneSettings) : The 'ZoneSettings' that represents this zone.
Zone17 (ZoneSettings) : The 'ZoneSettings' that represents this zone.
Zone18 (ZoneSettings) : The 'ZoneSettings' that represents this zone.
Zone19 (ZoneSettings) : The 'ZoneSettings' that represents this zone.
Zone20 (ZoneSettings) : The 'ZoneSettings' that represents this zone.
Zone21 (ZoneSettings) : The 'ZoneSettings' that represents this zone.
Zone22 (ZoneSettings) : The 'ZoneSettings' that represents this zone.
Zone23 (ZoneSettings) : The 'ZoneSettings' that represents this zone.
Zone24 (ZoneSettings) : The 'ZoneSettings' that represents this zone.
Context
Holds all the values for 'Context'.
Fields:
Lines (array) : All the drawn lines for the current 'Context'.
Labels (array) : All the drawn labels for the current 'Context'.
Boxes (array) : All the drawn boxes for the current 'Context'.
Alerts (array) : All the alert messages on the current tick.
Start (series int) : The start bar index of the current 'Context'.

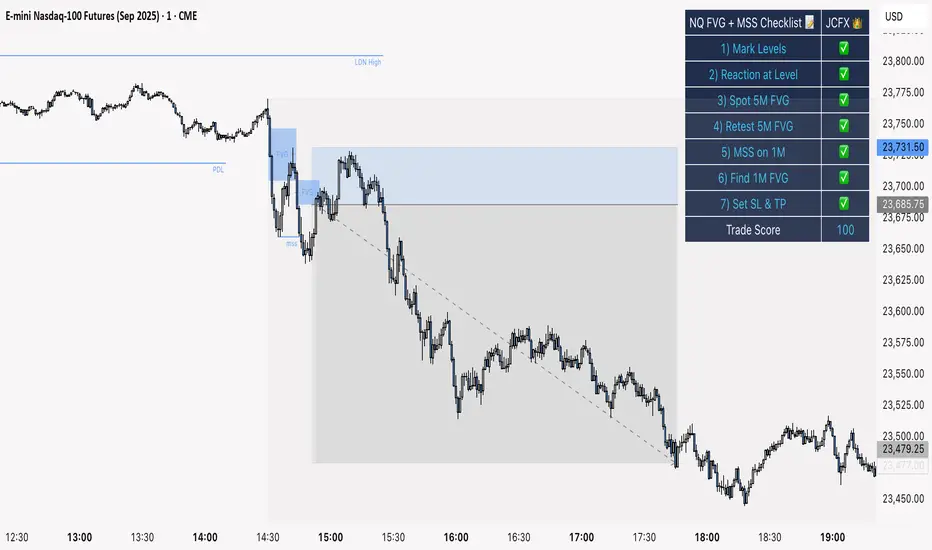
NQ FVG + MSS ChecklistThe NQ FVG + MSS Quick Checklist is a visual trading HUD for Nasdaq 100 (NQ) futures. It helps traders quickly track key setup elements: session & previous day levels, 5M FVG, retests, 1M MSS, and 1M FVG inside MSS.
Each step can be manually ticked, and a Trade Score shows setup strength at a glance. The checklist table sits on top of all chart elements for easy reference without interfering with your analysis.
Features:
Step-by-step NQ trading checklist
Manual inputs with visual ✅/❌
Trade Score for quick setup confirmation
Table overlay always on top of the chart
Multi-TF Trend Table (Configurable)1) What this tool does (in one minute)
A compact, multi‑timeframe dashboard that stacks eight timeframes and tells you:
Trend (fast MA vs slow MA)
Where price sits relative to those MAs
How far price is from the fast MA in ATR terms
MA slope (rising, falling, flat)
Stochastic %K (with overbought/oversold heat)
MACD momentum (up or down)
A single score (0%–100%) per timeframe
Alignment tick when trend, structure, slope and momentum all agree
Use it to:
Frame bias top‑down (M→W→D→…→15m)
Time entries on your execution timeframe when the higher‑TF stack is aligned
Avoid counter‑trend traps when the table is mixed
2) Table anatomy (each column explained)
The table renders 9 columns × 8 rows (one row per timeframe label you define).
TF — The label you chose for that row (e.g., Month, Week, 4H). Cosmetic; helps you read the stack.
Trend — Arrow from fast MA vs slow MA: ↑ if fastMA > slowMA (up‑trend), ↓ otherwise (down‑trend). Cell is green for up, red for down.
Price Pos — One‑character structure cue:
🔼 if price is above both fast and slow MAs (bullish structure)
🔽 if price is below both (bearish structure)
– otherwise (between MAs / mixed)
MA Dist — Distance of price from the fast MA measured in ATR multiples:
XS < S < M < L < XL according to your thresholds (see §3.3). Useful for judging stretch/mean‑reversion risk and stop sizing.
MA Slope — The fast MA one‑bar slope:
↑ if fastMA - fastMA > 0
↓ if < 0
→ if = 0
Stoch %K — Rounded %K value (default 14‑1‑3). Background highlights when it aligns with the trend:
Green heat when trend up and %K ≤ oversold
Red heat when trend down and %K ≥ overbought Tooltip shows K and D values precisely.
Trend % — Composite score (0–100%), the dashboard’s confidence for that timeframe:
+20 if trendUp (fast>slow)
+20 if fast MA slope > 0
+20 if MACD up (signal definition in §2.8)
+20 if price above fast MA
+20 if price above slow MA
Background colours:
≥80 lime (strong alignment)
≥60 green (good)
≥40 orange (mixed)
<40 grey (weak/contrary)
MACD — 🟢 if EMA(12)−EMA(26) > its EMA(9), else 🔴. It’s a simple “momentum up/down” proxy.
Align — ✔ when everything is in gear for that trend direction:
For up: trendUp and price above both MAs and slope>0 and MACD up
For down: trendDown and price below both MAs and slope<0 and MACD down Tooltip spells this out.
3) Settings & how to tune them
3.1 Timeframes (TF1–TF8)
Inputs: TF1..TF8 hold the resolution strings used by request.security().
Defaults: M, W, D, 720, 480, 240, 60, 15 with display labels Month, Week, Day, 12H, 8H, 4H, 1H, 15m.
Tips
Keep a top‑down funnel (e.g., Month→Week→Day→H4→H1→M15) so you can cascade bias into entries.
If you scalp, consider D, 240, 120, 60, 30, 15, 5, 1.
Crypto weekends: consider 2D in place of W to reflect continuous trading.
3.2 Moving Average (MA) group
Type: EMA, SMA, WMA, RMA, HMA. Changes both fast & slow MA computations everywhere.
Fast Length: default 20. Shorten for snappier trend/slope & tighter “price above fast” signals.
Slow Length: default 200. Controls the structural trend and part of the score.
When to change
Swing FX/equities: EMA 20/200 is a solid baseline.
Mean‑reversion style: consider SMA 20/100 so trend flips slower.
Crypto/indices momentum: HMA 21 / EMA 200 will read slope more responsively.
3.3 ATR / Distance group
ATR Length: default 14; longer makes distance less jumpy.
XS/S/M/L thresholds: define the labels in column MA Dist. They are compared to |close − fastMA| / ATR.
Defaults: XS 0.25×, S 0.75×, M 1.5×, L 2.5×; anything ≥L is XL.
Usage
Entries late in a move often occur at L/XL; consider waiting for a pullback unless you are trading breakouts.
For stops, an initial SL around 0.75–1.5 ATR from fast MA often sits behind nearby noise; use your plan.
3.4 Stochastic group
%K Length / Smoothing / %D Smoothing: defaults 14 / 1 / 3.
Overbought / Oversold: defaults 70 / 30 (adjust to 80/20 for trendier assets).
Heat logic (column Stoch %K): highlights when a pullback aligns with the dominant trend (oversold in an uptrend, overbought in a downtrend).
3.5 View
Full Screen Table Mode: centers and enlarges the table (position.middle_center). Great for clean screenshots or multi‑monitor setups.
4) Signal logic (how each datapoint is computed)
Per‑TF data (via a single request.security()):
fastMA, slowMA → based on your MA Type and lengths
%K, %D → Stoch(High,Low,Close,kLen) smoothed by kSmooth, then %D smoothed by dSmooth
close, ATR(atrLen) → for structure and distance
MACD up → (EMA12−EMA26) > EMA9(EMA12−EMA26)
fastMA_prev → yesterday/previous‑bar fast MA for slope
TrendUp → fastMA > slowMA
Price Position → compares close to both MAs
MA Distance Label → thresholds on abs(close − fastMA)/ATR
Slope → fastMA − fastMA
Score (0–100) → sum of the five 20‑point checks listed in §2.7
Align tick → conjunction of trend, price vs both MAs, slope and MACD (see §2.9)
Important behaviour
HTF values are sampled at the execution chart’s bar close using Pine v6 defaults (no lookahead). So the daily row updates only when a daily bar actually closes.
5) How to trade with it (playbooks)
The table is a framework. Entries/exits still follow your plan (e.g., S/D zones, price action, risk rules). Use the table to know when to be aggressive vs patient.
Playbook A — Trend continuation (pullback entry)
Look for Align ✔ on your anchor TFs (e.g., Week+Day both ≥80 and green, Trend ↑, MACD 🟢).
On your execution TF (e.g., H1/H4), wait for Stoch heat with the trend (oversold in uptrend or overbought in downtrend), and MA Dist not at XL.
Enter on your trigger (break of pullback high/low, engulfing, retest of fast MA, or S/D first touch per your plan).
Risk: consider ATR‑based SL beyond structure; size so 0.25–0.5% account risk fits your rules.
Trail or scale at M/L distances or when score deteriorates (<60).
Playbook B — Breakout with confirmation
Mixed stack turns into broad green: Trend % jumps to ≥80 on Day and H4; MACD flips 🟢.
Price Pos shows 🔼 across H4/H1 (above both MAs). Slope arrows ↑.
Enter on the first clean base‑break with volume/impulse; avoid if MA Dist already XL.
Playbook C — Mean‑reversion fade (advanced)
Use only when higher TFs are not aligned and the row you trade shows XL distance against the higher‑TF context. Take quick targets back to fast MA. Lower win‑rate, faster management.
Playbook D — Top‑down filter for Supply/Demand strategy
Trade first retests only in the direction where anchor TFs (Week/Day) have Align ✔ and Trend % ≥60. Skip counter‑trend zones when the stack is red/green against you.
6) Reading examples
Strong bullish stack
Week: ↑, 🔼, S/M, slope ↑, %K=32 (green heat), Trend 100%, MACD 🟢, Align ✔
Day: ↑, 🔼, XS/S, slope ↑, %K=45, Trend 80%, MACD 🟢, Align ✔
Action: Look for H4/H1 pullback into demand or fast MA; buy continuation.
Late‑stage thrust
H1: ↑, 🔼, XL, slope ↑, %K=88
Day/H4: only 60–80%
Action: Likely overextended on H1; wait for mean reversion or multi‑TF alignment before chasing.
Bearish transition
Day flips from 60%→40%, Trend ↓, MACD turns 🔴, Price Pos “–” (between MAs)
Action: Stand aside for longs; watch for lower‑high + Align ✔ on H4/H1 to join shorts.
7) Practical tips & pitfalls
HTF closure: Don’t assume a daily row changed mid‑day; it won’t settle until the daily bar closes. For intraday anticipation, watch H4/H1 rows.
MA Type consistency: Changing MA Type changes slope/structure everywhere. If you compare screenshots, keep the same type.
ATR thresholds: Calibrate per asset class. FX may suit defaults; indices/crypto might need wider S/M/L.
Score ≠ signal: 100% does not mean “must buy now.” It means the environment is favourable. Still execute your trigger.
Mixed stacks: When rows disagree, reduce size or skip. The tool is telling you the market lacks consensus.
8) Customisation ideas
Timeframe presets: Save layouts (e.g., Swing, Intraday, Scalper) as indicator templates in TradingView.
Alternative momentum: Replace the MACD condition with RSI(>50/<50) if desired (would require code edit).
Alerts: You can add alert conditions for (a) Align ✔ changes, (b) Trend % crossing 60/80, (c) Stoch heat events. (Not shipped in this script, but easy to add.)
9) FAQ
Q: Why do I sometimes see a dash in Price Pos? A: Price is between fast and slow MAs. Structure is mixed; seek clarity before acting.
Q: Does it repaint? A: No, higher‑TF values update on the close of their own bars (standard request.security behaviour without lookahead). Intra‑bar they can fluctuate; decisions should be made at your bar close per your plan.
Q: Which columns matter most? A: For trend‑following: Trend, Price Pos, Slope, MACD, then Stoch heat for entries. The Score summarises, and Align enforces discipline.
Q: How do I integrate with ATR‑based risk? A: Use the MA Dist label to avoid chasing at extremes and to size stops in ATR terms (e.g., SL behind structure at ~1–1.5 ATR).

Order Blocks + Order-Flow ProxiesOrder Blocks + Order-Flow Proxies
This indicator combines structural analysis of order blocks with lightweight order-flow style proxies, providing a tool for chart annotation and contextual study. It is designed to help users visualize where significant structural shifts occur and how simple volume-based signals behave around those areas. The script does not guarantee profitable outcomes, nor does it issue financial advice. It is intended purely for research, learning, and discretionary use.
Conceptual Background
Order Blocks
An “order block” is a term often used to describe a zone on the chart where price left behind a significant reversal or imbalance before continuing strongly in the opposite direction. In practice, this can mean the last bullish or bearish candle before a strong breakout. Traders sometimes study these regions because they believe that unfilled resting orders may exist there, or simply because they mark important pivots in price structure. This indicator detects such moments by scanning for breaks of structure (BOS). When price pushes above or below recent swing levels with sufficient displacement, the script identifies the prior opposite candle as the potential order block.
Break of Structure
A break of structure in this context is defined when the closing price moves beyond the highest high or lowest low of a short lookback window. The script compares the magnitude of this break to an ATR-based displacement filter. This helps ensure that only meaningful moves are marked rather than small, random fluctuations.
Order-Flow Proxies
Traditional order flow analysis may use bid/ask data, footprint charts, or volume profiles. Because TradingView scripts cannot access true order-book data, this indicator instead uses proxy signals derived from standard chart data:
Delta (proxy): Estimated imbalance of buying vs. selling pressure, approximated using bar direction and volume.
Imbalance ratio: Normalizes delta by total volume, ranging between -1 and +1 in theory.
Cumulative Delta (CVD): Running sum of delta over time.
Effort vs. Result (EvR): A comparison between volume and actual bar movement, highlighting cases where large effort produced little result (or vice versa).
These are not real order-flow measurements, but rather simple mathematical constructs that mimic some of its logic.
How the Script Works
Detecting Break of Structure
The user specifies a swing length. When price closes above the recent high (for bullish BOS) or below the recent low (for bearish BOS), a potential shift is recorded.
To qualify, the breakout must exceed a displacement filter proportional to the ATR. This helps filter out weak moves.
Locating the Order Block Candle
Once a BOS is confirmed, the script looks back within a short window to find the last opposite-colored candle.
The high/low or open/close of that candle (depending on user settings) is marked as the potential order block zone.
Drawing and Maintaining Zones
Each order block is represented as a colored rectangle extending forward in time.
Bullish zones are teal by default, bearish zones are red.
Zones extend until invalidated (price closing or wicking beyond them, depending on user preference) or until a user-defined lifespan expires.
A pruning mechanism ensures that only the most recent set number of zones remain, preventing chart overload.
Monitoring Touches
The script checks whether the current bar’s range overlaps any existing order block.
If so, the “closest” zone is considered touched, and a label may appear on the chart.
Confirmation Filters
Touches can optionally be confirmed by order-flow proxies.
For a bullish confirmation, the following must align:
Imbalance ratio above threshold,
Delta EMA positive,
Effort vs. Result positive.
For a bearish confirmation, the opposite holds true.
Optionally, a higher-timeframe EMA slope filter can gate these confirmations. For example, a bullish confirmation may only be accepted if the higher-timeframe EMA is sloping upward.
Alerts
Users may create alerts based on conditions such as “bullish touch confirmed” or “bearish touch confirmed.”
Alerts can be gated to only fire after bar close, reducing intrabar noise.
Standard alertcondition calls are provided, and optional inline alert() calls can be enabled.
Inputs and Customization
Structure & OB
Swing length: Defines how many bars back to check for BOS.
ATR length & displacement factor: Adjust sensitivity for structural breaks.
Body vs. wick reference: Choose whether zones are based on candle bodies or full ranges.
Invalidation rule: Pick between wick breach or close beyond the level.
Lifespan (bars): Limit how long a zone remains active.
Max keep: Cap the number of zones stored to reduce clutter.
Order-Flow Proxies
Delta mode: Choose between “Close vs Previous Close” or “Body” for delta calculation.
EMA length: Smooths the delta/imbalance series.
Z-score lookback: Defines the averaging window for EvR.
Confirmation thresholds: Adjust the imbalance levels required for long/short confirmation.
Higher Timeframe Filter
Enable HTF gate: Optional filter requiring higher-timeframe EMA slope alignment.
HTF timeframe & EMA length: Configurable for context alignment.
Style
Colors and transparency for bullish and bearish zones.
Border color customization.
Alerts
Enable inline alerts: Optional direct calls to alert().
Alerts on bar close only: Helps avoid multiple firings during bar formation.
Practical Use
This tool is best seen as a way to annotate charts and to study how simple volume-derived signals behave near important structural levels. Some users may:
Observe whether order blocks line up with later price reactions.
Study how imbalance or cumulative delta conditions align with these zones.
Use it in a discretionary workflow to highlight areas of interest for deeper analysis.
Because the proxies are based only on candle OHLCV data, they are approximations. They cannot replace true depth-of-market analysis. Similarly, order block detection here is one specific algorithmic interpretation; other traders may define order blocks differently.
Limitations and Disclaimers
This indicator does not predict future price movement.
It does not access real order book or tick-by-tick data. All signals are derived from bar OHLCV.
Past performance of signals or zones does not guarantee future results.
The script is for educational and informational purposes only. It is not financial advice.
Users should test thoroughly, adjust parameters to their own instruments and timeframes, and use it in combination with broader analysis.
Summary
The Order Blocks + Order-Flow Proxies script is an experimental study tool that:
Detects potential order blocks using a displacement-filtered break of structure.
Marks these zones as boxes that persist until invalidation or expiry.
Provides lightweight order-flow-style proxies such as delta, imbalance, CVD, and effort vs. result.
Allows confirmation of zone touches through these proxies and optional higher-timeframe context.
Offers flexible customization, alerting, and chart-style options.
It is not a trading system by itself but rather a framework for studying price/volume behavior around structurally significant areas. With careful exploration, it can give users new ways to visualize market structure and to understand how simple flow-like measures behave in those contexts.

Chart-Only Scanner — Pro Table v2.5.1Chart-Only Scanner — Pro Table v2.5
User Manual (Pine Script v6)
What this tool does (in one line)
A compact, on-chart table that scores the current chart symbol (or an optional override) using momentum, volume, trend, volatility, and pattern checks—so you can quickly decide UP, DOWN, or WAIT.
Quick Start (90 seconds)
Add the indicator to any chart and timeframe (1m…1M).
Leave “Override chart symbol” = OFF to auto-use the chart’s symbol.
Choose your layout:
Row (wide horizontal strip), or Grid (title + labeled cells).
Pick a size preset (Micro, Small, Medium, Large, Mobile).
Optional: turn on “Use Higher TF (EMA 20/50)” and set HTF Multiplier (e.g., 4 ⇒ if chart is 15m, HTF is 60m).
Watch the table:
DIR (↑/↓/→), ROC%, MOM, VOL, EMA stack, HTF, REV, SCORE, ACT.
Add an alert if you want: the script fires when |SCORE| ≥ Action threshold.
What to expect
A small table appears on the chart corner you choose, updating each bar (or only at bar close if you keep default smart-update).
The ACT cell shows 🔥 (strong), 👀 (medium), or ⏳ (weak).
Panels & Settings (every option explained)
Core
Momentum Period: Lookback for rate-of-change (ROC%). Shorter = more reactive; longer = smoother.
ROC% Threshold: Minimum absolute ROC% to call direction UP (↑) or DOWN (↓); otherwise →.
Require Volume Confirmation: If ON and VOL ≤ 1.0, the SCORE is forced to 0 (prevents low-volume false positives).
Override chart symbol + Custom symbol: By default, the indicator uses the chart’s symbol. Turn this ON to lock to a specific ticker (e.g., a perpetual).
Higher TF
Use Higher TF (EMA 20/50): Compares EMA20 vs EMA50 on a higher timeframe.
HTF Multiplier: Higher TF = (chart TF × multiplier).
Example: on 3H chart with multiplier 2 ⇒ HTF = 6H.
Volatility & Oscillators
ATR Length: Used to show ATR% (ATR relative to price).
RSI Length: Standard RSI; colors: green ≤30 (oversold), red ≥70 (overbought).
Stoch %K Length: With %D = SMA(%K, 3).
MACD Fast/Slow/Signal: Standard MACD values; we display Line, Signal, Histogram (L/S/H).
ADX Length (Wilder): Wilder’s smoothing (internal derivation); also shows +DI / −DI if you enable the ADX column.
EMAs / Trend
EMA Fast/Mid/Slow: We compute EMA(20/50/200) by default (editable).
EMA Stack: Bull if Fast > Mid > Slow; Bear if Fast < Mid < Slow; Flat otherwise.
Benchmark (optional, OFF by default)
Show Relative Strength vs Benchmark: Displays RS% = ROC(symbol) − ROC(benchmark) over the Momentum Period.
Benchmark Symbol: Ticker used for comparison (e.g., BTCUSDT as a market proxy).
Columns (show/hide)
Toggle which fields appear in the table. Hiding unused fields keeps the layout clean (especially on mobile).
Display
Layout Mode:
Row = a single two-row strip; each column is a metric.
Grid = a title row plus labeled pairs (label/value) arranged in rows.
Size Preset: Micro, Small, Medium, Large, Mobile change text size and the grid density.
Table Corner: Where the panel sits (e.g., Top Right).
Opaque Table Background: ON = dark card; OFF = transparent(ish).
Update Every Bar: ON = update intra-bar; OFF = smart update (last bar / real-time / confirmed history).
Action threshold (|score|): The cutoff for 🔥 and alert firing (default 70).
How to read each field
CHART: The active symbol name (or your custom override).
DIR: ↑ (ROC% > threshold), ↓ (ROC% < −threshold), → otherwise.
ROC%: Rate of change over Momentum Period.
Formula: (Close − Close ) / Close × 100.
MOM: A scaled momentum score: min(100, |ROC%| × 10).
VOL: Volume ratio vs 20-bar SMA: Volume / SMA(Volume,20).
1.5 highlights as yellow (significant participation).
ATR%: (ATR / Close) × 100 (volatility relative to price).
RSI: Colored for extremes: ≤30 green, ≥70 red.
Stoch K/D: %K and %D numbers.
MACD L/S/H: Line, Signal, Histogram. Histogram color reflects sign (green > 0, red < 0).
ADX, +DI, −DI: Trend strength and directional components (Wilder). ADX ≥ 25 is highlighted.
EMA 20/50/200: Current EMA values (editable lengths).
STACK: Bull/Bear/Flat as defined above.
VWAP%: (Close − VWAP) / Close × 100 (premium/discount to VWAP).
HTF: ▲ if HTF EMA20 > EMA50; ▼ if <; · if flat/off.
RS%: Symbol’s ROC% − Benchmark ROC% (positive = outperforming).
REV (reversal):
🟢 Eng/Pin = bullish engulfing or bullish pin detected,
🔴 Eng/Pin = bearish engulfing or bearish pin,
· = none.
SCORE (absolute shown as a number; sign shown via DIR and ACT):
Components:
base = MOM × 0.4
volBonus = VOL > 1.5 ? 20 : VOL × 13.33
htfBonus = use_mtf ? (HTF == DIR ? 30 : HTF == 0 ? 15 : 0) : 0
trendBonus = (STACK == DIR) ? 10 : 0
macdBonus = 0 (placeholder for future versions)
scoreRaw = base + volBonus + htfBonus + trendBonus + macdBonus
SCORE = DIR ≥ 0 ? scoreRaw : −scoreRaw
If Require Volume Confirmation and VOL ≤ 1.0 ⇒ SCORE = 0.
ACT:
🔥 if |SCORE| ≥ threshold
👀 if 50 < |SCORE| < threshold
⏳ otherwise
Practical examples
Strong long (trend + participation)
DIR = ↑, ROC% = +3.2, MOM ≈ 32, VOL = 1.9, STACK = Bull, HTF = ▲, REV = 🟢
SCORE: base(12.8) + volBonus(20) + htfBonus(30) + trend(10) ≈ 73 → ACT = 🔥
Action idea: look for longs on pullbacks; confirm risk with ATR%.
Weak long (no volume)
DIR = ↑, ROC% = +1.0, but VOL = 0.8 and Require Volume Confirmation = ON
SCORE forced to 0 → ACT = ⏳
Action: wait for volume > 1.0 or turn off confirmation knowingly.
Bearish reversal warning
DIR = →, REV = 🔴 (bearish engulfing), RSI = 68, HTF = ▼
SCORE may be mid-range; ACT = 👀
Action: watch for breakdown and rising VOL.
Alerts (how to use)
The script calls alert() whenever |SCORE| ≥ Action threshold.
To receive pop-ups, sounds, or emails: click “⏰ Alerts” in TradingView, choose this indicator, and pick “Any alert() function call.”
The alert message includes: symbol, |SCORE|, DIR.
Layout, Size, and Corner tips
Row is best when you want a compact status ribbon across the top.
Grid is clearer on big screens or when you enable many columns.
Size:
Mobile = one pair per row (tall, readable)
Micro/Small = dense; good for many fields
Large = presentation/screenshots
Corner: If the table overlaps price, change the corner or set Opaque Background = OFF.
Repaint & timeframe behavior
Default smart update prefers stability (last bar / live / confirmed history).
For a stricter, “close-only” behavior (less repaint): turn Update Every Bar = OFF and avoid Heikin Ashi when you want raw market OHLC (HA modifies price inputs).
HTF logic is derived from a clean, integer multiple of your chart timeframe (via multiplier). It works with 3H/4H and any TF.
Performance notes
The script analyzes one symbol (chart or override) with multiple metrics using efficient tuple requests.
If you later want a multi-symbol grid, do it with pages (10–15 per page + rotate) to stay within platform limits (recommended future add-on).
Troubleshooting
No table visible
Ensure the indicator is added and not hidden.
Try toggling Opaque Background or switch Corner (it might be behind other drawings).
Keep Columns count reasonable for the chosen Size.
If you turned ON Override, verify the Custom symbol exists on your data provider.
Numbers look different on HA candles
Heikin Ashi modifies OHLC; switch to regular candles if you need raw price metrics.
3H/4H issues
Use integer HTF Multiplier (e.g., 2, 4). The tool builds the correct string internally; no manual timeframe strings needed.
Power user tips
Volume gating: keeping Require Volume Confirmation = ON filters most fake moves; if you’re a scalper, reduce strictness or turn it off.
Action threshold: 60–80 is typical. Higher = fewer but stronger signals.
Benchmark RS%: great for spotting leaders/laggards; positive RS% = outperformance vs benchmark.
Change policy & safety
This version doesn’t alter your historical logic you tested (no radical changes).
Any future “radical” change (score weights, HTF logic, UI hiding data) will ship with a toggle and an Impact Statement so you can keep old behavior if you prefer.
Glossary (quick)
ROC%: Percent change over N bars.
MOM: Scaled momentum (0–100).
VOL ratio: Volume vs 20-bar average.
ATR%: ATR as % of price.
ADX/DI: Trend strength / direction components (Wilder).
EMA stack: Relationship between EMAs (bullish/bearish/flat).
VWAP%: Premium/discount to VWAP.
RS%: Relative strength vs benchmark.

FVG + Bank Level Targeting w/ Alert TriggerDescription:
FVG + Bank Level Targeting w/ Alert Trigger is an intraday trading tool that combines Fair Value Gap (FVG) detection with dynamic institutional targeting using prior-day, weekly, and monthly high/low "Bank Levels." When a Fair Value Gap is detected, the script projects a logical target using the closest bank level in price's direction, and visually extends that level on your chart.
This tool is designed to help traders anticipate where price is most likely to move after an FVG appears — and alert them when price breaks through key target zones.
How It Works:
* Bank Level Calculation:
The indicator calculates Daily, Weekly, and Monthly high and low levels from the previous bar of each respective timeframe.
These are optionally plotted on the chart with a slight tick offset to avoid overlap with price.
* FVG Detection:
Bullish FVGs are defined by a gap between the low of the current candle and the high two candles prior, with a confirming middle candle.
Bearish FVGs follow the reverse pattern.
Once detected, the script finds the nearest unbroken institutional level (Bank Level) in the direction of the FVG and anchors a target line at that price level.
* Target Line Projection:
The script draws a persistent horizontal line (not just a plotted value) at the selected bank level.
These lines automatically extend a set number of bars into the future for clarity and trade planning.
* Breakout Detection:
When price crosses above a Bull Target or below a Bear Target, the script triggers a breakout condition.
These breakouts are useful for trade continuation or reversal setups.
* Alerts:
Built-in alert conditions notify you in real time when price crosses above or below a target.
These can be used to set TradingView alerts for your preferred Futures symbols or intraday pairs.
Parameters:
Tick Offset Multiplier: Adds distance between price and plotted levels.
Show Daily/Weekly/Monthly Levels: Toggle for each institutional level group.
FVG Extend Right (bars): Controls how far the target lines extend into the future.
Color Controls: Customize colors for FVG fill and target lines.
Use Case:
This indicator is designed for traders who want to:
Trade continuation or reversal moves around institutional price zones
Integrate Fair Value Gap concepts with more logical, historically anchored price targets
Trigger alerts when market structure evolves around key levels
It is especially useful for intraday Futures traders on the 15-minute chart or lower, but adapts well to any instrument with strong reactionary behavior at prior session highs/lows.

Volume Delta Pressure Tracker by GSK-VIZAG-AP-INDIA📢 Title:
Volume Delta Pressure Tracker by GSK-VIZAG-AP-INDIA
📝 Short Description (for script title box):
Real-time volume pressure tracker with estimated Buy/Sell volumes and Delta visualization in an Indian-friendly format (K, L, Cr).
📃 Full Description
🔍 Overview:
This indicator estimates buy and sell volumes using candle structure (OHLC) and displays a real-time delta table for the last N candles. It provides traders with a quick view of volume imbalance (pressure) — often indicating strength behind price moves.
📊 Features:
📈 Buy/Sell Volume Estimation using the candle’s OHLC and Volume.
⚖️ Delta Calculation (Buy Vol - Sell Vol) to detect pressure zones.
📅 Time-stamped Table displaying:
Time (HH:MM)
Buy Volume (Green)
Sell Volume (Red)
Delta (Color-coded)
🔢 Indian Number Format (K = Thousands, L = Lakhs, Cr = Crores).
🧠 Fully auto-calculated — no need for tick-by-tick bid/ask feed.
📍 Neatly placed bottom-right table, customizable number of rows.
🛠️ Inputs:
Show Table: Toggle the table on/off
Number of Bars to Show: Choose how many recent candles to include (5–50)
🎯 Use Cases:
Identify hidden buyer/seller strength
Detect volume absorption or exhaustion
✅ Compatibility:
Works on any timeframe
Ideal for intraday instruments like NIFTY, BANKNIFTY, etc.
Ideal for volume-based strategy confirmation.
🖋️ Developed by:
GSK-VIZAG-AP-INDIA

Relative Strength Range RankRelative Strength Range Rank – Chart Asset vs. Benchmarks
Description:
This indicator calculates and ranks the relative strength position of the current chart’s asset against up to five user-defined comparison symbols. By default, the comparison set is USDT.D, USDC.D and DAI.D.
Calculation method:
The same oscillator calculation is applied identically to the current chart’s asset and all comparison symbols:
For each symbol:
Determine the lowest low over LOWEST bars.
Determine the highest high over HIGHEST bars.
Calculate normalized position within range:
raw_osc = (close - lowest_low) / (highest_high - lowest_low) * 100
Apply a 10-period EMA to smooth raw_osc.
Invert and scale to match assets direction:
raw_osc = 100 - EMA_10(raw_osc)
Apply weighted smoothing:
smoothed = 0.191 * previous_value + 0.809 * current_value
Apply a final 1-period EMA to reduce jitter.
Output is the inverted smoothed oscillator value, representing the relative strength rank.
This function is implemented as calculate_oscillator() and used for all input symbols plus the current chart symbol, ensuring consistency in comparative analysis.
Plotting:
Each comparison symbol oscillator is plotted in the indicator pane.
The current chart oscillator is always plotted in black.
Alert condition:
Boolean chart_osc_above_all is true when the current chart oscillator is strictly greater than all other comparison oscillator values.
The alert chart_osc_crossed_above triggers only on the first bar where chart_osc_above_all changes from false to true.
Smoothing advantage:
The smoothing sequence (EMA → weighted smoothing → EMA) is designed to reduce short-term noise while preserving responsiveness to changes in price position.
The initial EMA(10) filters random fluctuations.
The weighted smoothing step (0.191 * prev + 0.809 * current) reduces overshoot and dampens oscillations without introducing significant lag, unlike longer EMAs.
The final EMA(1) step ensures stability in the plotted oscillator without visible jaggedness.
This combination yields a signal that is both smooth and reactive, making relative strength comparisons more precise.
Inputs:
Sym 1–5: up to five comparison tickers.
Lowest low lookback period ( LOWEST ).
Highest high lookback period ( HIGHEST ).
Color for plotted comparison lines.
Output:
Oscillator values from 0 to 100, where higher values indicate that the asset’s current price is closer to the highest high of the lookback period, and lower values indicate proximity to the lowest low.
Sorted table showing all selected assets ranked by oscillator value.
Optional alert when the current chart asset leads all selected assets in oscillator value.
Short Description:
Computes range-normalized oscillator values for the chart asset and up to 5 symbols, using EMA and weighted smoothing to reduce noise while preserving responsiveness; optional alert when the chart asset exceeds all others.

VG 1.0This script is an enhanced version of SMC Structures and FVG with an advanced JSON-based alert system designed for seamless integration with webhooks and external applications (such as a Swift iOS app).
What it does
It detects and plots on the chart:
Fair Value Gaps (FVG) — bullish and bearish.
Break of Structure (BOS) and Change of Character (CHOCH).
Key Fibonacci levels (0.786, 0.705, 0.618, 0.5, 0.382) based on the current structure.
Additionally, it generates custom alerts:
FVG Alerts:
When a new FVG is created (bullish or bearish).
When an existing FVG gets mitigated.
BOS & CHOCH Alerts:
Includes breakout direction (bullish or bearish).
Fibonacci Alerts:
When price touches a configured level, with adjustable tick tolerance.
Alerts can be:
Declarative (alertcondition) for manual setup inside TradingView.
Programmatic (alert() JSON) for automated webhook delivery to your system or mobile app.
Key Features
Optional close confirmation to filter out false signals.
Standardized JSON format for direct API or mobile app integration.
Webhook-ready for automated push notifications.
Full visual control with lines, boxes, and labels.
Configurable tick tolerance for Fibonacci “touch” detection.

Keltner Channel Based Grid Strategy # KC Grid Strategy - Keltner Channel Based Grid Trading System
## Strategy Overview
KC Grid Strategy is an innovative grid trading system that combines the power of Keltner Channels with dynamic position sizing to create a mean-reversion trading approach. This strategy automatically adjusts position sizes based on price deviation from the Keltner Channel center line, implementing a systematic grid-based approach that capitalizes on market volatility and price oscillations.
## Core Principles
### Keltner Channel Foundation
The strategy builds upon the Keltner Channel indicator, which consists of:
- **Center Line**: Moving average (EMA or SMA) of the price
- **Upper Band**: Center line + (ATR/TR/Range × Multiplier)
- **Lower Band**: Center line - (ATR/TR/Range × Multiplier)
### Grid Trading Logic
The strategy implements a sophisticated grid system where:
1. **Position Direction**: Inversely correlated to price position within the channel
- When price is above center line → Short positions
- When price is below center line → Long positions
2. **Position Size**: Proportional to distance from center line
- Greater deviation = Larger position size
3. **Grid Activation**: Positions are adjusted only when the difference exceeds a predefined grid threshold
### Mathematical Foundation
The core calculation uses the KC Rate formula:
```
kcRate = (close - ma) / bandWidth
targetPosition = kcRate × maxAmount × (-1)
```
This creates a mean-reversion system where positions increase as price moves further from the mean, expecting eventual return to equilibrium.
## Parameter Guide
### Time Range Settings
- **Start Date**: Beginning of strategy execution period
- **End Date**: End of strategy execution period
### Core Parameters
1. **Number of Grids (NumGrid)**: Default 12
- Controls grid sensitivity and position adjustment frequency
- Higher values = More frequent but smaller adjustments
- Lower values = Less frequent but larger adjustments
2. **Length**: Default 10
- Period for moving average and volatility calculations
- Shorter periods = More responsive to recent price action
- Longer periods = Smoother, less noisy signals
3. **Grid Coefficient (kcRateMult)**: Default 1.33
- Multiplier for channel width calculation
- Higher values = Wider channels, less frequent trades
- Lower values = Narrower channels, more frequent trades
4. **Source**: Default Close
- Price source for calculations (Close, Open, High, Low, etc.)
- Close price typically provides most reliable signals
5. **Use Exponential MA**: Default True
- True = Uses EMA (more responsive to recent prices)
- False = Uses SMA (equal weight to all periods)
6. **Bands Style**: Default "Average True Range"
- **Average True Range**: Smoothed volatility measure (recommended)
- **True Range**: Current bar's volatility only
- **Range**: Simple high-low difference
## How to Use
### Setup Instructions
1. **Apply to Chart**: Add the strategy to your desired timeframe and instrument
2. **Configure Parameters**: Adjust settings based on market characteristics:
- Volatile markets: Increase Grid Coefficient, reduce Number of Grids
- Stable markets: Decrease Grid Coefficient, increase Number of Grids
3. **Set Time Range**: Define your backtesting or live trading period
4. **Monitor Performance**: Watch strategy performance metrics and adjust as needed
### Optimal Market Conditions
- **Range-bound markets**: Strategy performs best in sideways trending markets
- **High volatility**: Benefits from frequent price oscillations around the mean
- **Liquid instruments**: Ensures efficient order execution and minimal slippage
### Position Management
The strategy automatically:
- Calculates optimal position sizes based on account equity
- Adjusts positions incrementally as price moves through grid levels
- Maintains risk control through maximum position limits
- Executes trades only during specified time periods
## Risk Warnings
### ⚠️ Important Risk Considerations
1. **Trending Market Risk**:
- Strategy may underperform or generate losses in strong trending markets
- Mean-reversion assumption may fail during sustained directional moves
- Consider market regime analysis before deployment
2. **Leverage and Position Size Risk**:
- Strategy uses pyramiding (up to 20 positions)
- Large positions may accumulate during extended moves
- Monitor account equity and margin requirements closely
3. **Volatility Risk**:
- Sudden volatility spikes may trigger multiple rapid position adjustments
- Consider volatility filters during high-impact news events
- Backtest across different volatility regimes
4. **Execution Risk**:
- Strategy calculates on every tick (calc_on_every_tick = true)
- May generate frequent orders in volatile conditions
- Ensure adequate execution infrastructure and consider transaction costs
5. **Parameter Sensitivity**:
- Performance highly dependent on parameter optimization
- Over-optimization may lead to curve-fitting
- Regular parameter review and adjustment may be necessary
## Suitable Scenarios
### Ideal Market Conditions
- **Sideways/Range-bound markets**: Primary use case
- **Mean-reverting instruments**: Forex pairs, some commodities
- **Stable volatility environments**: Consistent ATR patterns
- **Liquid markets**: Major currency pairs, popular stocks/indices
## Important Notes
### Strategy Limitations
1. **No Stop Loss**: Strategy relies on mean reversion without traditional stop losses
2. **Capital Requirements**: Requires sufficient capital for grid-based position sizing
3. **Market Regime Dependency**: Performance varies significantly across different market conditions
## Disclaimer
This strategy is provided for educational and research purposes only. Past performance does not guarantee future results. Trading involves substantial risk of loss and is not suitable for all investors. Users should thoroughly test the strategy and understand its mechanics before risking real capital. The author assumes no responsibility for trading losses incurred through the use of this strategy.
---
# KC网格策略 - 基于肯特纳通道的网格交易系统
## 策略概述
KC网格策略是一个创新的网格交易系统,它将肯特纳通道的力量与动态仓位调整相结合,创建了一个均值回归交易方法。该策略根据价格偏离肯特纳通道中心线的程度自动调整仓位大小,实施系统化的网格方法,利用市场波动和价格振荡获利。
## 核心原理
### 肯特纳通道基础
该策略建立在肯特纳通道指标之上,包含:
- **中心线**: 价格的移动平均线(EMA或SMA)
- **上轨**: 中心线 + (ATR/TR/Range × 乘数)
- **下轨**: 中心线 - (ATR/TR/Range × 乘数)
### 网格交易逻辑
该策略实施复杂的网格系统:
1. **仓位方向**: 与价格在通道中的位置呈反向关系
- 当价格高于中心线时 → 空头仓位
- 当价格低于中心线时 → 多头仓位
2. **仓位大小**: 与距离中心线的距离成正比
- 偏离越大 = 仓位越大
3. **网格激活**: 只有当差异超过预定义的网格阈值时才调整仓位
### 数学基础
核心计算使用KC比率公式:
```
kcRate = (close - ma) / bandWidth
targetPosition = kcRate × maxAmount × (-1)
```
这创建了一个均值回归系统,当价格偏离均值越远时仓位越大,期望最终回归均衡。
## 参数说明
### 时间范围设置
- **开始日期**: 策略执行期间的开始时间
- **结束日期**: 策略执行期间的结束时间
### 核心参数
1. **网格数量 (NumGrid)**: 默认12
- 控制网格敏感度和仓位调整频率
- 较高值 = 更频繁但较小的调整
- 较低值 = 较少频繁但较大的调整
2. **长度**: 默认10
- 移动平均线和波动率计算的周期
- 较短周期 = 对近期价格行为更敏感
- 较长周期 = 更平滑,噪音更少的信号
3. **网格系数 (kcRateMult)**: 默认1.33
- 通道宽度计算的乘数
- 较高值 = 更宽的通道,较少频繁的交易
- 较低值 = 更窄的通道,更频繁的交易
4. **数据源**: 默认收盘价
- 计算的价格来源(收盘价、开盘价、最高价、最低价等)
- 收盘价通常提供最可靠的信号
5. **使用指数移动平均**: 默认True
- True = 使用EMA(对近期价格更敏感)
- False = 使用SMA(对所有周期等权重)
6. **通道样式**: 默认"平均真实范围"
- **平均真实范围**: 平滑的波动率测量(推荐)
- **真实范围**: 仅当前K线的波动率
- **范围**: 简单的高低价差
## 使用方法
### 设置说明
1. **应用到图表**: 将策略添加到您所需的时间框架和交易品种
2. **配置参数**: 根据市场特征调整设置:
- 波动市场:增加网格系数,减少网格数量
- 稳定市场:减少网格系数,增加网格数量
3. **设置时间范围**: 定义您的回测或实盘交易期间
4. **监控表现**: 观察策略表现指标并根据需要调整
### 最佳市场条件
- **区间震荡市场**: 策略在横盘趋势市场中表现最佳
- **高波动性**: 受益于围绕均值的频繁价格振荡
- **流动性强的品种**: 确保高效的订单执行和最小滑点
### 仓位管理
策略自动:
- 根据账户权益计算最优仓位大小
- 随着价格在网格水平移动逐步调整仓位
- 通过最大仓位限制维持风险控制
- 仅在指定时间段内执行交易
## 风险警示
### ⚠️ 重要风险考虑
1. **趋势市场风险**:
- 策略在强趋势市场中可能表现不佳或产生损失
- 在持续方向性移动期间均值回归假设可能失效
- 部署前考虑市场制度分析
2. **杠杆和仓位大小风险**:
- 策略使用金字塔加仓(最多20个仓位)
- 在延长移动期间可能积累大仓位
- 密切监控账户权益和保证金要求
3. **波动性风险**:
- 突然的波动性激增可能触发多次快速仓位调整
- 在高影响新闻事件期间考虑波动性过滤器
- 在不同波动性制度下进行回测
4. **执行风险**:
- 策略在每个tick上计算(calc_on_every_tick = true)
- 在波动条件下可能产生频繁订单
- 确保充足的执行基础设施并考虑交易成本
5. **参数敏感性**:
- 表现高度依赖于参数优化
- 过度优化可能导致曲线拟合
- 可能需要定期参数审查和调整
## 适用场景
### 理想市场条件
- **横盘/区间震荡市场**: 主要用例
- **均值回归品种**: 外汇对,某些商品
- **稳定波动性环境**: 一致的ATR模式
- **流动性市场**: 主要货币对,热门股票/指数
## 注意事项
### 策略限制
1. **无止损**: 策略依赖均值回归而无传统止损
2. **资金要求**: 需要充足资金进行基于网格的仓位调整
3. **市场制度依赖性**: 在不同市场条件下表现差异显著
## 免责声明
该策略仅供教育和研究目的。过往表现不保证未来结果。交易涉及重大损失风险,并非适合所有投资者。用户应在投入真实资金前彻底测试策略并理解其机制。作者对使用此策略产生的交易损失不承担任何责任。
---
**Strategy Version**: Pine Script v6
**Author**: Signal2Trade
**Last Updated**: 2025-8-9
**License**: Open Source (Mozilla Public License 2.0)

EMA Channel with ATR Offset + 2 Custom EMAsJust an alternative channel indicator to Bollinger Bands or Ketner channels that uses ATR offsets as the corridor of possible movements, which I recommend changing to fit various tickers.
Also thrown in is EMA, default is 100 and 50 periods for trend direction and potential confirmation
