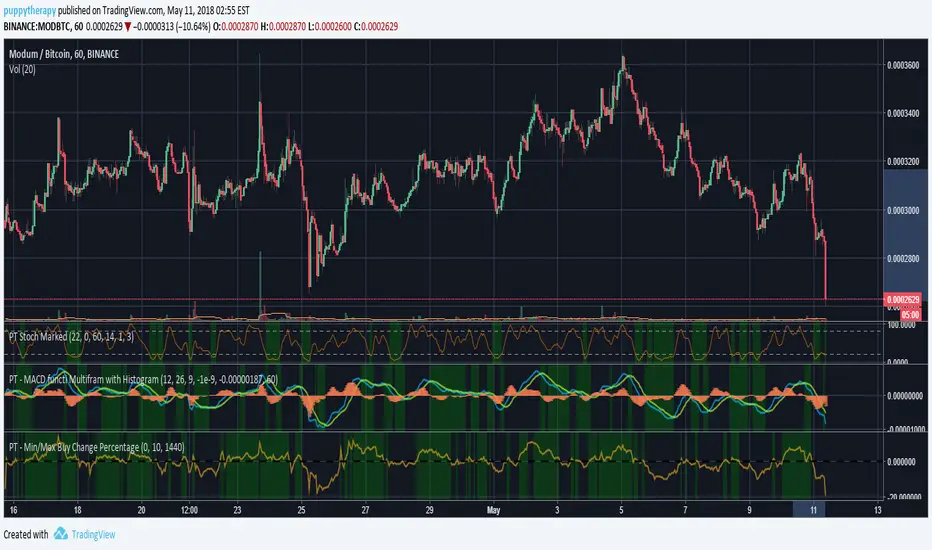
PT - Min/Max Buy Change PercentageDEFAULT_buy_min_change_percentage
Only purchase a coin if the 24 hour percentage change is above the set value.
Example:
DEFAULT_buy_min_change_percentage = 3.5 –> Only buy a coin if the 24 hour change is above 3.5%
DEFAULT_buy_min_change_percentage = -2 –> Only buy a coin if the 24 hour change is above -2%
DEFAULT_buy_max_change_percentage
Only purchase a coin if the 24 hour percentage change is below the set value.
Example:
DEFAULT_buy_max_change_percentage = 8 –> Only buy a coin if the 24 hour change is below 8%
DEFAULT_buy_max_change_percentage = -1 –> Only buy a coin if the 24 hour change is below -1%
Source Profit Trailer Wiki ( wiki.profittrailer.com )
Tìm kiếm tập lệnh với "油价调整最新消息:国内油价今日24时上调"
Clean Multi-Indicator Alignment System
Overview
A sophisticated multi-indicator alignment system designed for 24/7 trading across all markets, with pure signal-based exits and no time restrictions. Perfect for futures, forex, and crypto markets that operate around the clock.
Key Features
🎯 Multi-Indicator Confluence System
EMA Cross Strategy: Fast EMA (5) and Slow EMA (10) for precise trend direction
VWAP Integration: Institution-level price positioning analysis
RSI Momentum: 7-period RSI for momentum confirmation and reversal detection
MACD Signals: Optimized 8/17/5 configuration for scalping responsiveness
Volume Confirmation: Customizable volume multiplier (default 1.6x) for signal validation
🚀 Advanced Entry Logic
Initial Full Alignment: Requires all 5 indicators + volume confirmation
Smart Continuation Entries: EMA9 pullback entries when trend momentum remains intact
Flexible Time Controls: Optional session filtering or 24/7 operation
🎪 Pure Signal-Based Exits
No Forced Closes: Positions exit only on technical signal reversals
Dual Exit Conditions: EMA9 breakdown + RSI flip OR MACD cross + EMA20 breakdown
Trend Following: Allows profitable trends to run their full course
Perfect for Swing Scalping: Ideal for multi-session position holding
📊 Visual Interface
Real-Time Status Dashboard: Live alignment monitoring for all indicators
Color-Coded Candles: Instant visual confirmation of entry/exit signals
Clean Chart Display: Toggle-able EMAs and VWAP with professional styling
Signal Differentiation: Clear labels for entries, X-crosses for exits
🔔 Alert System
Entry Notifications: Separate alerts for buy/sell signals
Exit Warnings: Technical breakdown alerts for position management
Mobile Ready: Push notifications to TradingView mobile app
Market Applications
Perfect For:
Gold Futures (GC): 24-hour precious metals trading
NASDAQ Futures (NQ): High-volatility index scalping
Forex Markets: Currency pairs with continuous operation
Crypto Trading: 24/7 cryptocurrency momentum plays
Energy Futures: Oil, gas, and commodity swing trades
Optimal Timeframes:
1-5 Minutes: Ultra-fast scalping during high volatility
5-15 Minutes: Balanced approach for most markets
15-30 Minutes: Swing scalping for trend following
🧠 Smart Position Management
Tracks implied position direction
Prevents conflicting signals
Allows trend continuation entries
State-aware exit logic
⚡ Scalping Optimized
Fast-reacting indicators with shorter periods
Volume-based confirmation reduces false signals
Clean entry/exit visualization
Minimal lag for time-sensitive trades
Configuration Options
All parameters fully customizable:
EMA Lengths: Adjustable from 1-30 periods
RSI Period: 1-14 range for different market conditions
MACD Settings: Fast (1-15), Slow (1-30), Signal (1-10)
Volume Confirmation: 0.5-5.0x multiplier range
Visual Preferences: Colors, displays, and table options
Risk Management Features
Clear visual exit signals prevent emotion-based decisions
Volume confirmation reduces false breakouts
Multi-indicator confluence improves signal quality
Optional time filtering for session-specific strategies
Best Use Cases
Futures Scalping: NQ, ES, GC during active sessions
Forex Swing Trading: Major pairs during overlap periods
Crypto Momentum: Bitcoin, Ethereum trend following
24/7 Automated Systems: Algorithmic trading implementation
Multi-Market Scanning: Portfolio-wide signal monitoring

Range Bar Gaps DetectorRange Bar Gaps Detector
Overview
The Range Bar Gaps Detector identifies price gaps across multiple range bar sizes (12, 24, 60, and 120) on any trading instrument, helping traders spot potential support/resistance zones or breakout opportunities. Designed for Pine Script v6, this indicator detects gaps on range bars and exports data for use in companion scripts like Range Bar Gaps Overlap, making it ideal for multi-timeframe gap analysis.
Key Features
Multi-Range Gap Detection: Identifies gaps on 12, 24, 60, and 120-range bars, capturing both bullish (gap up) and bearish (gap down) price movements.
Customizable Sensitivity: Includes a user-defined minimum deviation (default: 10% of 14-period SMA) for 12-range gaps to filter out noise.
7-Day Lookback: Automatically prunes gaps older than 7 days to focus on recent, relevant price levels.
Data Export: Serializes up to 10 gaps per range (tops, bottoms, start bars, highest/lowest prices, and age) for seamless integration with overlap analysis scripts.
Debugging Support: Plots gap counts and aggregation data in the Data Window for easy verification of detected gaps.
How It Works
The indicator aggregates price movements to simulate higher range bars (24, 60, 120) from a base range bar chart. It detects gaps when the price jumps significantly between bars, ensuring gaps meet the minimum deviation threshold for 12-range bars. Gaps are stored in arrays, serialized for external use, and pruned after 7 days to maintain efficiency.
Usage
Add to your range bar chart (e.g., 12-range) to detect gaps across multiple ranges.
Use alongside the Range Bar Gaps Overlap indicator to visualize gaps and their overlaps as boxes on the chart.
Check the Data Window to confirm gap counts and sizes for each range (12, 24, 60, 120).
Adjust the "Minimal Deviation (%) for 12-Range" input to control gap detection sensitivity.
Settings
Minimal Deviation (%) for 12-Range: Set the minimum gap size for 12-range bars (default: 10% of 14-period SMA).
Range Sizes: Fixed at 24, 60, and 120 for higher range bar aggregation.
Notes
Ensure the script is published under your TradingView username (e.g., GreenArrow2005) for use with companion scripts.
Best used on range bar charts to maintain consistent gap detection.
For advanced overlap analysis, pair with the Range Bar Gaps Overlap indicator to highlight zones where gaps from different ranges align.
Ideal For
Traders seeking to identify key price levels for support/resistance or breakout strategies.
Multi-timeframe analysts combining gap data across various range bar sizes.
Developers building custom indicators that leverage gap data for advanced charting.

Ragi's 24h volumeThis script is a TradingView Pine Script indicator that displays the 24-hour trading volume for a given asset. It provides both the native volume of the asset and, if the asset is not already listed on Binance, also displays the 24-hour volume from Binance (if applicable). Here's a breakdown of the key components:
Volume Calculation:
It sums the volume data over different time frames: 1-minute, 5-minute (for daily charts), or 60-minute intervals.
The volume is calculated based on the asset's volume type (either "quote" volume or a calculated value of close * volume).
For crypto assets, if the volume data is unavailable, it raises an error.
Binance Volume:
If the asset is not from Binance, the script fetches 24-hour volume data from Binance for that symbol, ensuring it is using the correct currency rate.
Display:
The indicator displays a table with the 24-hour volume in the chosen position on the chart (top, middle, or bottom).
The table displays the current exchange's volume, and if applicable, the Binance volume.
The volume is color-coded based on predefined thresholds:
Attention: Displays a warning color for volumes exceeding the attention level.
Warning: Shows an alert color for volumes above the warning threshold.
Normal: Displays in standard color when the volume is lower than the warning level.
The text and background color are customizable, and users can adjust the text size and position of the table.
User Inputs:
The script allows customization of table text size, position, background color, and volume thresholds for attention and warning.
In summary, this indicator is designed to track and display 24-hour volume on a chart, with additional volume information from Binance if necessary, and provides visual cues based on volume levels to help traders quickly assess trading activity.
Timeframe-Based Dynamic MA [odnac]
This code is a Timeframe-Based Dynamic MA indicator, written in Pine Script, that dynamically calculates and displays the Simple Moving Average (SMA), Exponential Moving Average (EMA), and Volume Weighted Moving Average (VWMA) based on a 24-hour period, according to the selected timeframe. It automatically adjusts the length of the moving averages for each timeframe, showing the appropriate value optimized for that specific timeframe.
Code Explanation:
Settings:
inputLength: A user input that allows setting the base time (24 hours by default). This value determines the reference for calculating the length of the moving averages according to the timeframe.
transp: A setting for the transparency of the moving average lines. It can accept values from 0 to 100 (0 is opaque, 100 is fully transparent).
Timeframe-Based Moving Average Calculation:
The length variable is dynamically calculated based on the current chart's timeframe.
For shorter timeframes like 1-minute, 2-minute, 3-minute, 5-minute, 10-minute, 15-minute, 30-minute, and 45-minute, the length is calculated by multiplying 60 / selected timeframe to obtain the moving average length based on a 24-hour period.
For longer timeframes like 1 hour, 4 hours, and 1 day, fixed values are used to set the moving average length.
Moving Average Calculation:
sma, ema, vwma: These are the Simple Moving Average, Exponential Moving Average, and Volume Weighted Moving Average calculated based on the length.
else_sma, else_ema, else_vwma: These represent the moving averages fetched from the 1-hour chart. For timeframes that are not calculated directly, the values are taken from the 1-hour chart.
Displaying the Moving Averages:
The moving averages are plotted according to the length calculated for the current timeframe.
If the length for the current timeframe is valid, the corresponding SMA, EMA, and VWMA values are displayed. Otherwise, the values fetched from the 1-hour chart are used.
The moving averages are displayed with the transparency (transp) value set by the user, controlling their opacity on the chart.
How to Use:
Base Time: The user sets a base time. For example, setting inputLength to 24 will calculate the moving average length based on a 24-hour period, which will be dynamically adjusted and displayed according to the selected timeframe.
Transparency Setting: The transparency of the moving average lines can be adjusted using the transp value.
Supported Timeframes:
For shorter timeframes (1-minute, 2-minute, 3-minute, 5-minute, 10-minute, 15-minute, 30-minute, 45-minute), the moving average lengths are dynamically calculated and displayed.
For longer timeframes (1 hour, 4 hours, 1 day), fixed length values are used.
This indicator allows you to dynamically calculate daily moving averages across different timeframes and visually check which moving average is the most appropriate for the selected timeframe.

Ichimoku Kinko Hyo + HULL-MA_X + MacDThe Ichimoku Kinko Hyo system includes five kinds of signal, of which this strategy uses the most recent of ones i.e. Tenkan Sen / Kijun Sen Cross and price crosses the Kijun Sen. As the Chikou Span, Senkou Span A and Senkou Span B are shifted into the past/future, the trigger signals will be only be used for visual confirmation and not part of the strategy.
The Tenkan Sen, also known as the Turning or Conversion line, is a moving average of the highest high and lowest low over the last 9 periods in this strategy.
The Kijun Sen, also known as the Standard or Base line, is a moving average of the highest high and lowest low over the last 24 periods in this strategy.
The Chikou Span, also known as the Lagging line, is the closing price plotted 24 periods behind in this strategy.
The Senkou Span A, also known as the 1st leading line, is a moving average of the Tenkan Sen and Kijun Sen and is plotted 24 periods ahead in this strategy.
The Senkou Span B, also known as the 2nd leading line, is a moving average of the highest high and lowest low over the last 51 trading days is plotted 24 periods ahead in this strategy.
Moving average convergence divergence (MaCD) is a trend-following momentum indicator that shows the relationship between two moving averages of prices. The MaCD is calculated in this strategy by subtracting the 24-day exponential moving average (EMA) from the 12-day EMA. A nine-day EMA of the MACD, called the "signal line", aMaCD in this case, is then plotted on top of the MaCD. In this strategy, MaCD/ aMaCD Cross is functioning as a trigger for buy and sell signals.
As with most technical analysis methods, Ichimoku is likely to produce frequent conflicting signals in non-trending markets, So in addition to Ichimoku Kinko Hyo, the Hull MA is popular amongst some day traders, as the indicator which in combination with MaCD attempts to give an accurate signal by eliminating lags and improving the smoothness of the line.
Alan Hull, developed this moving average indicator and hence it’s called the Hull MA.
Now, let’s dissect how the Hull moving average is calculated.
The Hull MA involves the weighted moving average (WMA) in its calculation.
First, calculate the WMA with period (n / 2) and multiply this by 2. Remember ‘n’ is the time period configurable based on the trader’s requirement. The default setting is 12 periods in this strategy, fast Hull MA crossing slow Hull MA will generate a circle on charts.
Second, calculate the WMA for period “n” and subtract if from the first step. Thirdly, calculate the weighted moving average with period sqrt (n) using the data from the second step. You can take a look at the below formula:
Hull MA= WMA (2*WMA (n/2) − WMA (n)), sqrt (n))
The Hull MA Cross in combination with Tenkan Sen / Kijun Sen Cross and MaCD tries to give an accurate signal by eliminating lags and improve the smoothness of price activity. Please note that price trends can and do change often, so your readings of the charts and this trading system should be probabilistic, rather than predictive.

Squeeze Hour Frequency [CHE]Squeeze Hour Frequency (ATR-PR) — Standalone — Tracks daily squeeze occurrences by hour to reveal time-based volatility patterns
Summary
This indicator identifies periods of unusually low volatility, defined as squeezes, and tallies their frequency across each hour of the day over historical trading sessions. By aggregating counts into a sortable table, it helps users spot hours prone to these conditions, enabling better scheduling of trading activity to avoid or target specific intraday regimes. Signals gain robustness through percentile-based detection that adapts to recent volatility history, differing from fixed-threshold methods by focusing on relative lowness rather than absolute levels, which reduces false positives in varying market environments.
Motivation: Why this design?
Traders often face uneven intraday volatility, with certain hours showing clustered low-activity phases that precede or follow breakouts, leading to mistimed entries or overlooked calm periods. The core idea of hourly squeeze frequency addresses this by binning low-volatility events into 24 hourly slots and counting distinct daily occurrences, providing a historical profile of when squeezes cluster. This reveals time-of-day biases without relying on real-time alerts, allowing proactive adjustments to session focus.
What’s different vs. standard approaches?
- Reference baseline: Classical volatility tools like simple moving average crossovers or fixed ATR thresholds, which flag squeezes uniformly across the day.
- Architecture differences:
- Uses persistent arrays to track one squeeze per hour per day, preventing overcounting within sessions.
- Employs custom sorting on ratio arrays for dynamic table display, prioritizing top or bottom performers.
- Handles timezones explicitly to ensure consistent binning across global assets.
- Practical effect: Charts show a persistent table ranking hours by squeeze share, making intraday patterns immediately visible—such as a top hour capturing over 20 percent of total events—unlike static overlays that ignore temporal distribution, which matters for avoiding low-liquidity traps in crypto or forex.
How it works (technical)
The indicator first computes a rolling volatility measure over a specified lookback period. It then derives a relative ranking of the current value against recent history within a window of bars. A squeeze is flagged when this ranking falls below a user-defined cutoff, indicating the value is among the lowest in the recent sample.
On each bar, the local hour is extracted using the selected timezone. If a squeeze occurs and the bar has price data, the count for that hour increments only if no prior mark exists for the current day, using a persistent array to store the last marked day per hour. This ensures one tally per unique trading day per slot.
At the final bar, arrays compile counts and ratios for all 24 hours, where the ratio represents each hour's share of total squeezes observed. These are sorted ascending or descending based on display mode, and the top or bottom subset populates the table. Background shading highlights live squeezes in red for visual confirmation. Initialization uses zero-filled arrays for counts and negative seeds for day tracking, with state persisting across bars via variable declarations.
No higher timeframe data is pulled, so there is no repaint risk from external fetches; all logic runs on confirmed bars.
Parameter Guide
ATR Length — Controls the lookback for the volatility measure, influencing sensitivity to short-term fluctuations; shorter values increase responsiveness but add noise, longer ones smooth for stability — Default: 14 — Trade-offs/Tips: Use 10-20 for intraday charts to balance quick detection with fewer false squeezes; test on historical data to avoid over-smoothing in trending markets.
Percentile Window (bars) — Sets the history depth for ranking the current volatility value, affecting how "low" is defined relative to past; wider windows emphasize long-term norms — Default: 252 — Trade-offs/Tips: 100-300 bars suit daily cycles; narrower for fast assets like crypto to catch recent regimes, but risks instability in sparse data.
Squeeze threshold (PR < x) — Defines the cutoff for flagging low relative volatility, where values below this mark a squeeze; lower thresholds tighten detection for rarer events — Default: 10.0 — Trade-offs/Tips: 5-15 percent for conservative signals reducing false positives; raise to 20 for more frequent highlights in high-vol environments, monitoring for increased noise.
Timezone — Specifies the reference for hourly binning, ensuring alignment with market sessions — Default: Exchange — Trade-offs/Tips: Set to "America/New_York" for US assets; mismatches can skew counts, so verify against chart timezone.
Show Table — Toggles the results display, essential for reviewing frequencies — Default: true — Trade-offs/Tips: Disable on mobile for performance; pair with position tweaks for clean overlays.
Pos — Places the table on the chart pane — Default: Top Right — Trade-offs/Tips: Bottom Left avoids candle occlusion on volatile charts.
Font — Adjusts text readability in the table — Default: normal — Trade-offs/Tips: Tiny for dense views, large for emphasis on key hours.
Dark — Applies high-contrast colors for visibility — Default: true — Trade-offs/Tips: Toggle false in light themes to prevent washout.
Display — Filters table rows to focus on extremes or full list — Default: All — Trade-offs/Tips: Top 3 for quick scans of risky hours; Bottom 3 highlights safe low-squeeze periods.
Reading & Interpretation
Red background shading appears on bars meeting the squeeze condition, signaling current low relative volatility. The table lists hours as "H0" to "H23", with columns for daily squeeze counts, percentage share of total squeezes (summing to 100 percent across hours), and an arrow marker on the top hour. A summary row above details the peak count, its share, and the leading hour. A label at the last bar recaps total days observed, data-valid days, and top hour stats. Rising shares indicate clustering, suggesting regime persistence in that slot.
Practical Workflows & Combinations
- Trend following: Scan for hours with low squeeze shares to enter during stable regimes; confirm with higher highs or lower lows on the 15-minute chart, avoiding top-share hours post-news like tariff announcements.
- Exits/Stops: Tighten stops in high-share hours to guard against sudden vol spikes; use the table to shift to conservative sizing outside peak squeeze times.
- Multi-asset/Multi-TF: Defaults work across crypto pairs on 5-60 minute timeframes; for stocks, widen percentile window to 500 bars. Combine with volume oscillators—enter only if squeeze count is below average for the asset.
Behavior, Constraints & Performance
Logic executes on closed bars, with live bars updating counts provisionally but finalizing on confirmation; table refreshes only at the last bar, avoiding intrabar flicker. No security calls or higher timeframes, so no repaint from external data. Resources include a 5000-bar history limit, loops up to 24 iterations for sorting and totals, and arrays sized to 24 elements; labels and table are capped at 500 each for efficiency. Known limits: Skips hours without bars (e.g., weekends), assumes uniform data availability, and may undercount in sparse sessions; timezone shifts can alter profiles without warning.
Sensible Defaults & Quick Tuning
Start with ATR Length at 14, Percentile Window at 252, and threshold at 10.0 for broad crypto use. If too many squeezes flag (noisy table), raise threshold to 15.0 and narrow window to 100 for stricter relative lowness. For sluggish detection in calm markets, drop ATR Length to 10 and threshold to 5.0 to capture subtler dips. In high-vol assets, widen window to 500 and threshold to 20.0 for stability.
What this indicator is—and isn’t
This is a historical frequency tracker and visualization layer for intraday volatility patterns, best as a filter in multi-tool setups. It is not a standalone signal generator, predictive model, or risk manager—pair it with price action, news filters, and position sizing rules.
Disclaimer
The content provided, including all code and materials, is strictly for educational and informational purposes only. It is not intended as, and should not be interpreted as, financial advice, a recommendation to buy or sell any financial instrument, or an offer of any financial product or service. All strategies, tools, and examples discussed are provided for illustrative purposes to demonstrate coding techniques and the functionality of Pine Script within a trading context.
Any results from strategies or tools provided are hypothetical, and past performance is not indicative of future results. Trading and investing involve high risk, including the potential loss of principal, and may not be suitable for all individuals. Before making any trading decisions, please consult with a qualified financial professional to understand the risks involved.
By using this script, you acknowledge and agree that any trading decisions are made solely at your discretion and risk.
Do not use this indicator on Heikin-Ashi, Renko, Kagi, Point-and-Figure, or Range charts, as these chart types can produce unrealistic results for signal markers and alerts.
Best regards and happy trading
Chervolino
Thanks to Duyck
for the ma sorter

Mikula's Master 360° Square of 12Mikula’s Master 360° Square of 12
An educational W. D. Gann study indicator for price and time. Anchor a compact Square of 12 table to a start point you choose. Begin from a bar’s High or Low (or set a manual start price). From that anchor you can progress or regress the table to study how price steps through cycles in either direction.
What you’re looking at :
Zodiac rail (far left): the twelve signs.
Degree rail: 24 rows in 15° steps from 15° up to 360°/0°.
Transit rail and Natal rail: track one planet per rail. Each planet is placed at its current row (℞ shown when retrograde). As longitude advances, the planet climbs bottom → top, then wraps to the bottom at the next sign; during retrograde it steps downward.
Hover a planet’s cell to see a tooltip with its exact longitude and sign (e.g., 152.4° ♌︎). The linked price cell in the grid moves with the planet’s row so you can follow a planet’s path through the zodiac as a path through price.
Price grid (right): the 12×24 Square of 12. Each column is a cycle; cells are stepped price levels from your start price using your increment.
Bottom rail: shows the current square number and labels the twelve columns in that square.
How the square is read
The square always begins at the bottom left. Read each column bottom → top. At the top, return to the bottom of the next column and read up again. One square contains twelve cycles. Because the anchor can be a High or a Low, you can progress the table upward from the anchor or regress it downward while keeping the same bottom-to-top reading order.
Iterate Square (shifting)
Iterate Square shifts the entire 12×24 grid to the next set of twelve cycles.
Square 1 shows cycles 1–12; Square 2 shows 13–24; Square 3 shows 25–36, etc.
Visibility rules
Pivot cells are table-bound. If you shift the square beyond those prices, their highlights won’t appear in the table.
A/B levels and Transit/Natal planetary lines are chart overlays and can remain visible on the table as you shift the square.
Quick use
Choose an anchor (date/time + High/Low) or enable a manual start price .
Set the increment. If you anchored with a Low and want the table to step downward from there, use a negative value.
Optional: pick Transit and Natal planets (one per rail), toggle their plots, and hover their cells for longitude/sign.
Optional: turn on A/B levels to display repeating bands from the start price.
Optional: enable swing pivots to tint matching cells after the anchor.
Use Iterate Square to shift to later squares of twelve cycles.
Examples
These are exploratory examples to spark ideas:
Overview layout (zodiac & degree rails, Transit/Natal rails, price grid)
A-levels plotted, pivots tinted on the table, real-time price highlighted
Drawing angles from the anchor using price & time read from the table
Using a TradingView Gann box along the A-levels to study reactions
Attribution & originality
This script is an original implementation (no external code copied). Conceptual credit to Patrick Mikula, whose discussion of the Master 360° Square of 12 inspired this study’s presentation.
Further reading (neutral pointers)
Patrick Mikula, Gann’s Scientific Methods Unveiled, Vol. 2, “W. D. Gann’s Use of the Circle Chart.”
W. D. Gann’s Original Commodity Course (as provided by WDGAN.com).
No affiliation implied.
License CC BY-NC-SA 4.0 (non-commercial; please attribute @Javonnii and link the original).
Dependency AstroLib by @BarefootJoey
Disclaimer Educational use only; not financial advice.

Ichimoku Cloud Auto TF🧠 Timeframe Breakdown for Ichimoku Cloud Auto TF
Each timeframe in this indicator is carefully calibrated to reflect meaningful Ichimoku behavior relative to its scale. Here's how each one is structured and what it's best used for:
⏱️ 1 Minute (1m)
Tenkan / Kijun / Span B: 5 / 15 / 45
Use: Scalping fast price action.
Logic: Quick reaction to short-term momentum. Best for highly active traders or bots.
⏱️ 2 Minutes (2m)
Tenkan / Kijun / Span B: 6 / 18 / 54
Use: Slightly smoother than 1m, still ideal for scalping with a little more stability.
⏱️ 5 Minutes (5m)
Tenkan / Kijun / Span B: 8 / 24 / 72
Use: Intraday setups, quick trend capture.
Logic: Balanced between reactivity and noise reduction.
⏱️ 15 Minutes (15m)
Tenkan / Kijun / Span B: 9 / 27 / 81
Use: Short-term swing and intraday entries with higher reliability.
⏱️ 30 Minutes (30m)
Tenkan / Kijun / Span B: 10 / 30 / 90
Use: Intra-swing entries or confirmation of 5m/15m signals.
🕐 1 Hour (1H)
Tenkan / Kijun / Span B: 12 / 36 / 108
Use: Ideal for swing trading setups.
Logic: Anchored to Daily reference (1H × 24 ≈ 1D).
🕐 2 Hours (2H)
Tenkan / Kijun / Span B: 14 / 42 / 126
Use: High-precision swing setups with better context.
🕒 3 Hours (3H)
Tenkan / Kijun / Span B: 15 / 45 / 135
Use: Great compromise between short and mid-term vision.
🕓 4 Hours (4H)
Tenkan / Kijun / Span B: 18 / 52 / 156
Use: Position traders & intraday swing confirmation.
Logic: Designed to echo the structure of 1D Ichimoku but on smaller scale.
📅 1 Day (1D)
Tenkan / Kijun / Span B: 9 / 26 / 52
Use: Classic Ichimoku settings.
Logic: Standard used globally for technical analysis. Suitable for swing and position trading.
📆 1 Week (1W)
Tenkan / Kijun / Span B: 12 / 24 / 120
Use: Long-term position trading & institutional swing confirmation.
Logic: Expanded ratios for broader perspective and noise filtering.
🗓️ 1 Month (1M)
Tenkan / Kijun / Span B: 6 / 12 / 24
Use: Macro-level trend visualization and investment planning.
Logic: Condensed but stable structure to handle longer data cycles.
📌 Summary
This indicator adapts Ichimoku settings dynamically to your chart's timeframe, maintaining logical ratios between Tenkan, Kijun, and Span B. This ensures each timeframe remains responsive yet meaningful for its respective market context.
IWMA - DolphinTradeBot1️⃣ WHAT IS IT ?
▪️ The Inverted Weighted Moving Average (IWMA) is the reversed version of WMA, where older prices receive higher weights, while recent prices receive lower weights. As a result, IWMA focuses more on past price movements while reducing sensitivity to new prices.
2️⃣ HOW IS IT WORK ?
🔍 To understand the IWMA(Inverted Weighted Moving Average) indicator, let's first look at how WMA (Weighted Moving Average) is calculated.
LET’S SAY WE SELECTED A LENGTH OF 5, AND OUR CURRENT CLOSING VALUES ARE .
▪️ WMA Calculation Method
When calculating WMA, the most recent price gets the highest weight, while the oldest price gets the lowest weight.
The Calculation is ;
( 10 ×1)+( 12 ×2)+( 21 ×3)+( 24 ×4)+( 38 ×5) = 10+24+63+96+190 = 383
1+2+3+4+5 = 15
WMA = 383/15 ≈ 25.53
WMA = ta.wma(close,5) = 25.53
▪️ IWMA Calculation Method
The Inverted Weighted Moving Average (IWMA) is the reversed version of WMA, where older prices receive higher weights, while recent prices receive lower weights. As a result, IWMA focuses more on past price movements while reducing sensitivity to new prices.
The Calculation is ;
( 10 ×5)+( 12 ×4)+( 21 ×3)+( 24 ×2)+( 38 ×1) = 50+48+63+48+38 = 247
1+2+3+4+5 = 15
IWMA = 247/15 ≈ 16.46
IWMA = iwma(close,5) = 16.46
3️⃣ SETTINGS
in the indicator's settings, you can change the length and source used for calculation.
With the default settings, when you first add the indicator, only the iwma will be visible. However, to observe how much it differs from the normal wma calculation, you can enable the "show wma" option to see both indicators with the same settings or you can enable the Show Signals to see IWMA and WMA crossover signals .
4️⃣ 💡 SOME IDEAS
You can use the indicator for support and resistance level analysis or trend analysis and reversal detection with short and long moving averages like regular moving averages.
Another option is to consider whether the iwma is above or below the normal wma or to evaluate the crossovers between wma and iwma.

Historical High/Lows Statistical Analysis(More Timeframe interval options coming in the future)
Indicator Description
The Hourly and Weekly High/Low (H/L) Analysis indicator provides a powerful tool for tracking the most frequent high and low points during different periods, specifically on an hourly basis and a weekly basis, broken down by the days of the week (DOTW). This indicator is particularly useful for traders seeking to understand historical behavior and patterns of high/low occurrences across both hourly intervals and weekly days, helping them make more informed decisions based on historical data.
With its customizable options, this indicator is versatile and applicable to a variety of trading strategies, ranging from intraday to swing trading. It is designed to meet the needs of both novice and experienced traders.
Key Features
Hourly High/Low Analysis:
Tracks and displays the frequency of hourly high and low occurrences across a user-defined date range.
Enables traders to identify which hours of the day are historically more likely to set highs or lows, offering valuable insights into intraday price action.
Customizable options for:
Hourly session start and end times.
22-hour session support for futures traders.
Hourly label formatting (e.g., 12-hour or 24-hour format).
Table position, size, and design flexibility.
Weekly High/Low Analysis by Day of the Week (DOTW):
Captures weekly high and low occurrences for each day of the week.
Allows traders to evaluate which days are most likely to produce highs or lows during the week, providing insights into weekly price movement tendencies.
Displays the aggregated counts of highs and lows for each day in a clean, customizable table format.
Options for hiding specific days (e.g., weekends) and customizing table appearance.
User-Friendly Table Display:
Both hourly and weekly data are displayed in separate tables, ensuring clarity and non-interference.
Tables can be positioned on the chart according to user preferences and are designed to be visually appealing yet highly informative.
Customizable Date Range:
Users can specify a start and end date for the analysis, allowing them to focus on specific periods of interest.
Possible Uses
Intraday Traders (Hourly Analysis):
Analyze hourly price action to determine which hours are more likely to produce highs or lows.
Identify intraday trading opportunities during statistically significant time intervals.
Use hourly insights to time entries and exits more effectively.
Swing Traders (Weekly DOTW Analysis):
Evaluate weekly price patterns by identifying which days of the week are more likely to set highs or lows.
Plan trades around days that historically exhibit strong movements or price reversals.
Futures and Forex Traders:
Use the 22-hour session feature to exclude the CME break or other session-specific gaps from analysis.
Combine hourly and DOTW insights to optimize strategies for continuous markets.
Data-Driven Trading Strategies:
Use historical high/low data to test and refine trading strategies.
Quantify market tendencies and evaluate whether observed patterns align with your strategy's assumptions.
How the Indicator Works
Hourly H/L Analysis:
The indicator calculates the highest and lowest prices for each hour in the specified date range.
Each hourly high and low occurrence is recorded and aggregated into a table, with counts displayed for all 24 hours.
Users can toggle the visibility of empty cells (hours with no high/low occurrences) and adjust the table's design to suit their preferences.
Supports both 12-hour (AM/PM) and 24-hour formats.
Weekly H/L DOTW Analysis:
The indicator tracks the highest and lowest prices for each day of the week during the user-specified date range.
Highs and lows are identified for the entire week, and the specific days when they occur are recorded.
Counts for each day are aggregated and displayed in a table, with a "Totals" column summarizing the overall occurrences.
The analysis resets weekly, ensuring accurate tracking of high/low days.
Code Breakdown:
Data Aggregation:
The script uses arrays to store counts of high/low occurrences for both hourly and weekly intervals.
Daily data is fetched using the request.security() function, ensuring consistent results regardless of the chart's timeframe.
Weekly Reset Mechanism:
Weekly high/low values are reset at the start of a new week (Monday) to ensure accurate weekly tracking.
A processing flag ensures that weekly data is counted only once at the end of the week (Sunday).
Table Visualization:
Tables are created using the table.new() function, with customizable styles and positions.
Header rows, data rows, and totals are dynamically populated based on the aggregated data.
User Inputs:
Customization options include text colors, background colors, table positioning, label formatting, and date ranges.
Code Explanation
The script is structured into two main sections:
Hourly H/L Analysis:
This section captures and aggregates high/low occurrences for each hour of the day.
The logic is session-aware, allowing users to define custom session times (e.g., 22-hour futures sessions).
Data is displayed in a clean table format with hourly labels.
Weekly H/L DOTW Analysis:
This section tracks weekly highs and lows by day of the week.
Highs and lows are identified for each week, and counts are updated only once per week to prevent duplication.
A user-friendly table displays the counts for each day of the week, along with totals.
Both sections are completely independent of each other to avoid interference. This ensures that enabling or disabling one section does not impact the functionality of the other.
Customization Options
For Hourly Analysis:
Toggle hourly table visibility.
Choose session start and end times.
Select hourly label format (12-hour or 24-hour).
Customize table appearance (colors, position, text size).
For Weekly DOTW Analysis:
Toggle DOTW table visibility.
Choose which days to include (e.g., hide weekends).
Customize table appearance (colors, position, text size).
Select values format (percentages or occurrences).
Conclusion
The Hourly and Weekly H/L Analysis indicator is a versatile tool designed to empower traders with data-driven insights into intraday and weekly market tendencies. Its highly customizable design ensures compatibility with various trading styles and instruments, making it an essential addition to any trader's toolkit.
With its focus on accuracy, clarity, and customization, this indicator adheres to TradingView's guidelines, ensuring a robust and valuable user experience.

K's Pivot PointsPivot points are a popular technical analysis tool used by traders to identify potential levels of support and resistance in a given timeframe. Pivot points are derived from previous price action and are used to estimate potential price levels where an asset may experience a reversal, breakout, or significant price movement.
The calculation of pivot points involves a simple formula that takes into account the high, low, and close prices from the previous trading session or a specific period. The most commonly used pivot point calculation method is the "Standard" or "Classic" method. Here's the formula:
Pivot Point (P) = (High + Low + Close) / 3
In addition to the pivot point itself, several support and resistance levels are calculated based on the pivot point value.
K's Pivot Points try to enhance them by incorporating multiple elements and by applying a re-integration strategy to validate two events:
* Found_Support: This event represents a basing market that is bound to recover or at least shape a bounce.
* Found_Resistance: This event represents a toppish market that is bound to consolidate or at least shape a pause.
K's Pivot Points are calculated following these steps:
1. Calculate the highest of highs for the previous 24 periods (preferably hours).
2. Calculate the lowest of lows for the previous 24 periods (preferably hours).
3. Calculate a 24-period (preferably hours) moving average of the close price.
4. Calculate K's Pivot Point as the average between the three previous step.
5. To find the support, use this formula: Support = (Lowest K's pivot point of the last 12 periods * 2) - Step 1
6. To find the resistance, use this formula: Resistance = (Highest K's pivot point of the last 12 periods * 2) - Step 2
The re-integration strategy to find support and resistance areas is as follows:
* A support has been found if the market breaks the support and shapes a close above it afterwards.
* A resistance has been found if the market surpasses the resistance and shapes a close below it afterwards.
The lookback period (whether 24 and 12) can be modified but the default versions work well.

WaveTrend 4h/24mWaveTrend 4h/24m is a trading tool based on two WaveTrend timeframes.
For this script the WaveTrend calculations made by LazyBear were used. WaveTrend is a widely used indicator for finding direction of an asset.
The strategy is developed by Youtuber Jayson Casper. The main strategy on the 4 hour and 24 minute timeframes, this will be the default timeframes. Timeframes can be adjusted in the indicator interface.
With Jaysons' we wait for both timeframes to have last printed a green dot for longs, and both timeframes to have last printed a red dot for shorts. When this occurs a green diamond will be printed for longs, a red diamond for shorts.
Make sure to always use the chart from the smallest timeframe you're using, so by defaults use the 24 minute chart.
Features of the indicator:
- WaveTrend Timeframe 1 (Blue/Lightblue wave).
- WaveTrend Timeframe 2 (Blue/Purple line with filled background between the lines).
- VWAP (Yellow wave which is turned off by default)
- Green/Red Diamonds
What to look for?
This script is all about the Green and Red Diamonds.
A Green diamond will be printed when on both the 4 hour and 24 minute timeframe the last printed dot was a green dot.
A Red diamond will be printed when on both the 4 hour and 24 minute timeframe the last printed dot was a red dot.
What are the Green and Red Diamonds based on?
When both VWAP timeframes are ABOVE 0, a green diamond will be printed. This is equivalent to the last dot on both WaveTrend timeframes being a green dot.
When both VWAP timeframes are BELOW 0, a red diamond will be printed. This is equivalent to the last dot on both WaveTrend timeframes being a red dot.
Happy Trading!

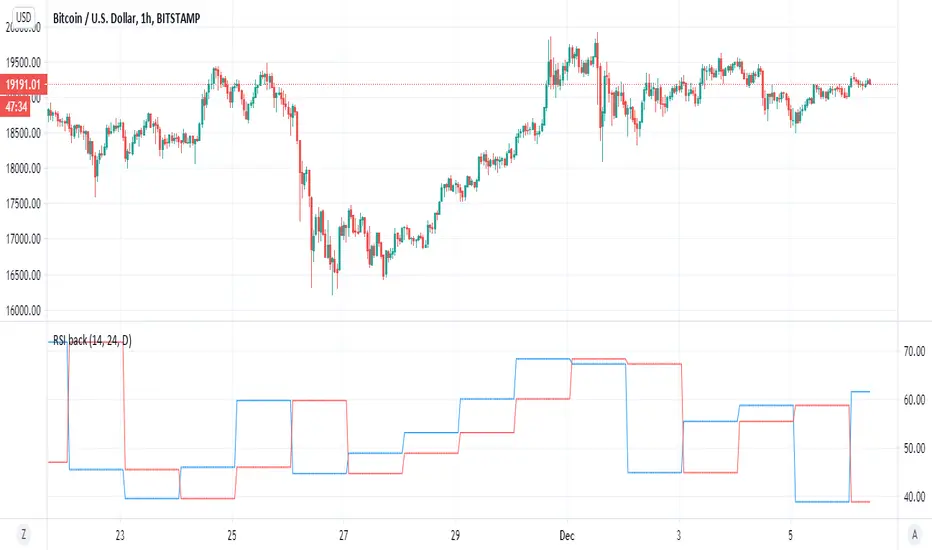
RSI backsimple indicator that based on difference between current RSI and past RSI (historic)
so lets say if take 1 hour chart then in a day there are 24 hour
so our RSI back if we put close will be the rsi of 24 hour before and this we compare it to the current rsi
if the current is above the past one then the signal is bullish , and vice versa. (similar logic to system of buy that based on close yesterday compare open of today)
so to this logic we can add no security MTF to make it nicer
blue line is current MTF RSI , red line is historic RSI based on the number of candles we choose
when blue over red is bullish ,red over blue is bearish
same on 4 hour mTF '1 hour chart and 24 candle back
RSI Correlation with future priceThis script measures the correlation of the hourly RSI of 24 hours ago with the difference of price between now and the price 24 hours ago. In other words, this is an indicator which measures the predictive power of the RSI.
Green means that the price is strongly correlated with the past RSI (which is the normal state when the market is flat and there is no news).
Red means that the price is inversely correlated with the past RSI.
The hourly RSI is a leading indicator which enables you to (sort of) see into the future. It shows you how the current price is, compared to the price 24 (or 48) hours into the future.
If the RSI is low, it means the current price is low compared to the future price, and if the RSI is high, it means the current price is high compared to the future price.
So the hourly RSI really correlates (in the way I described) to the price 24 hours in the future.
Except when it doesn't!!!
What happens when the correlation breaks (RED on this indicator)? Usually there are important news - a strong signal external to the chart. There are either economy at large news, or security-specific news.
Following a strong break of this RSI-future price correlation, some cash can be made by understanding what happened and playing the restoration of the RSI-price correlation.

RSI_SpeedUp_Volume measures the speed of purchases.If the RSI indicator shows the dominance of purchases over sales, it is interesting to know the speed of purchases. We calculate the speed using the wt indicator. We compute WT (RSI,len). Setting and designation of indicator RSI_SpeedUP. The RSI lines you are looking for are shown in smooth lines. The speed is shown by stepped lines.
In the indicator RSI and speed are calculated in two ways. The first method-calculations are made from the closing price.
The second way is from the volume price. Volume price is the closing price multiplied by volume. Basic settings of the RSI_SpeedUp-V indicator (1,24,9,40,14). What they mean?
RSI is calculated for two periods 24 and 9. The first parameter in the setting is "1", that the display of lines will be from the first period = 24. If the parameter is "2", the lines will be displayed from the second period = 9.
If the parameter is "3", the display will be simultaneously from both periods.
The fourth parameter " 40 " shows the width of the green and pink areas.
The fifth parameter " 14 " is the period with which the wt rate is calculated(rsi,14).
By default, the indicator window displays only the rates from the simple price and the volume price. In order to enable the display of RSI lines, press the "vkl RSI"button.
The blue line is RSI (close). Blue line-RSI (close*volume). Stepped green-speed from simple price wt(rsi (close)). Step brown line-speed from the volume price wt(rsi (close*volume)).
How to use. The volume price starts to react to the trend change earlier. Long before the reversal, it changes its direction. Comparison with the simple price speed line gives additional information about the market mood.
Good luck with your trading.
--------------------------
Если индикатор RSI показывает доминирование покупок над продажами, то интересно знать скорость покупок. Скорость мы вычисляем с помощью индикатора WT. Мы вычисляем WT ( RSI,len). Настройки и обозначения индикатора RSI_SpeedUP. Искомые линии RSI показаны гладкими линиями. Скорость показана ступенчатыми линиями.
В индикаторе RSI и скорость вычисляются двумя способами. Первый способ - вычисления производятся от цены закрытия. Второй способ от объемной цены. Объемная цена это цена закрытия умноженная на объем. Базовые настройки индикатора RSI_SpeedUp-V (1,24,9,40,14). Что они означают?
RSI вычисляется для двух периодов 24 и 9. Первый параметр в настройке "1" , что отображение линий будет от первого периода = 24. Если параметр "2", то отображение линий будет от второго периода = 9. Если параметр "3", то отображение будет одновременно от обоих периодов.
Четвертый параметр "40" показывает ширину области зеленой и розовой.
Пятый параметр "14" это период с которым вычисляется скорость wt(rsi,14).
По умолчанию в окне индикатора отображаются только скорости от простой цены и от объемной цены. Для того чтобы включить отображение линий RSI надо нажать кнопочку "vkl RSI".
Синяя линия - RSI (close). Голубая линия - RSI (close*volume). Ступенчатая зеленая - скорость от простой цены wt(rsi(close)). Ступенчатая коричневая линия - скорость от объемной цены wt(rsi(close*volume)).
Как пользоваться. Объемная цена раньше начинает реагировать на изменение тенденции. Задолго до разворота она изменяет своё направление. Сравнение с линией скорости простой цены дает дополнительную информацию о настроении рынка.
Успехов Вам в торговле.

Heiken Ashi + Ichimoku Kinko Hyo StrategyHeikin-Ashi:
Instead of using the open-high-low-close (OHLC) bars like standard candlestick charts, it uses a modified formula. Out of which only following two are used in this strategy.
High = Max (High,Open,Close)
Low = Min (Low,Open, Close)
Ichimoku Kinko Hyo:
The Ichimoku Kinko Hyo system includes five kinds of signal, of which this strategy uses four signals i.e. Tenkan Sen / Kijun Sen Cross, price crosses the Kijun Sen, Chikou Span and Kumo. Although the Chikou Span, Senkou Span A and Senkou Span B (Kumo) are shifted into the past/future, these trigger signals enhances the strategy.
The Tenkan Sen, also known as the Turning or Conversion line, is a moving average of the highest high and lowest low over the last 9 periods in this strategy.
The Kijun Sen, also known as the Standard or Base line, is a moving average of the highest high and lowest low over the last 24 periods in this strategy.
The Chikou Span, also known as the Lagging line, is the closing price plotted 24 periods behind in this strategy.
The Senkou Span A, also known as the 1st leading line, is a moving average of the Tenkan Sen and Kijun Sen and is plotted 24 periods ahead in this strategy.
The Senkou Span B, also known as the 2nd leading line, is a moving average of the highest high and lowest low over the last 51 trading days is plotted 24 periods ahead in this strategy.
Hull MA-X + Ichimoku Kinko Hyo StrategyHull MA-X:
The Hull MA involves the weighted moving average ( WMA ) in its calculation.
First, calculate the WMA with period (n / 2) and multiply this by 2. Remember ‘n’ is the time period configurable based on the trader’s requirement.
Second, calculate the WMA for period “n” and subtract if from the first step. Thirdly, calculate the weighted moving average with period sqrt (n) using the data from the second step. You can take a look at the below formula:
Hull MA= WMA (2*WMA (n/2) − WMA (n)), sqrt (n))
The default setting is 12 periods in this strategy, fast Hull MA crossing slow Hull MA will generate a circle on charts.
Ichimoku Kinko Hyo:
The Ichimoku Kinko Hyo system includes five kinds of signal, of which this strategy uses four signals i.e. Tenkan Sen / Kijun Sen Cross, price crosses the Kijun Sen, Chikou Span and Kumo. Although the Chikou Span, Senkou Span A and Senkou Span B (Kumo) are shifted into the past/future, these trigger signals enhances the strategy.
The Tenkan Sen, also known as the Turning or Conversion line, is a moving average of the highest high and lowest low over the last 9 periods in this strategy.
The Kijun Sen, also known as the Standard or Base line, is a moving average of the highest high and lowest low over the last 24 periods in this strategy.
The Chikou Span, also known as the Lagging line, is the closing price plotted 24 periods behind in this strategy.
The Senkou Span A, also known as the 1st leading line, is a moving average of the Tenkan Sen and Kijun Sen and is plotted 24 periods ahead in this strategy.
The Senkou Span B, also known as the 2nd leading line, is a moving average of the highest high and lowest low over the last 51 trading days is plotted 24 periods ahead in this strategy.
As with most technical analysis methods, Ichimoku is likely to produce frequent conflicting signals in non-trending markets, So in addition to Ichimoku Kinko Hyo, the Hull MA is used, which is popular amongst some day traders, in combination it attempts to give an accurate signal by eliminating lags and improving the smoothness of the line.
The Hull MA Cross in combination with Ichimoku Kinko Hyo signals tries to give an accurate signal by eliminating lags and improve the smoothness of price activity. Please note that price trends can and do change often, so your readings of the charts and this trading system should be probabilistic, rather than predictive.
Smart MACD Volume Trader# Smart MACD Volume Trader
## Overview
Smart MACD Volume Trader is an enhanced momentum indicator that combines the classic MACD (Moving Average Convergence Divergence) oscillator with an intelligent high-volume filter. This combination significantly reduces false signals by ensuring that trading signals are only generated when price momentum is confirmed by substantial volume activity.
The indicator supports over 24 different instruments including major and exotic forex pairs, precious metals (gold and silver), energy commodities (crude oil, natural gas), and industrial metals (copper). For forex and commodity traders, the indicator automatically maps to CME and COMEX futures contracts to provide accurate institutional-grade volume data.
## Originality and Core Concept
Traditional MACD indicators generate signals based solely on price momentum, which can result in numerous false signals during low-activity periods or ranging markets. This indicator addresses this critical weakness by introducing a volume confirmation layer with automatic institutional volume integration.
**What makes this approach original:**
- Signals are triggered only when MACD crossovers coincide with elevated volume activity
- Implements a lookback mechanism to detect volume spikes within recent bars
- Automatically detects and maps 24+ forex pairs and commodities to their corresponding CME and COMEX futures contracts
- Provides real institutional volume data for forex pairs where spot volume is unreliable
- Combines two independent market dimensions (price momentum and volume) into a single, actionable signal
- Includes intelligent asset detection that works across multiple exchanges and ticker formats
**The underlying principle:** Volume validates price movement. When institutional money enters the market, it creates volume signatures. By requiring high volume confirmation and using actual institutional volume data from futures markets, this indicator filters out weak price movements and focuses on trades backed by genuine market participation. The automatic futures mapping ensures that forex and commodity traders always have access to the most accurate volume data available, without manual configuration.
## How It Works
### MACD Component
The indicator calculates MACD using standard methodology:
1. **Fast EMA (default: 12 periods)** - Tracks short-term price momentum
2. **Slow EMA (default: 26 periods)** - Tracks longer-term price momentum
3. **MACD Line** - Difference between Fast EMA and Slow EMA
4. **Signal Line (default: 9-period SMA)** - Smoothed average of MACD line
**Crossover signals:**
- **Bullish:** MACD line crosses above Signal line (momentum turning positive)
- **Bearish:** MACD line crosses below Signal line (momentum turning negative)
### Volume Filter Component
The volume filter adds an essential confirmation layer:
1. **Volume Moving Average** - Calculates exponential MA of volume (default: 20 periods)
2. **High Volume Threshold** - Multiplies MA by ratio (default: 2.0x or 200%)
3. **Volume Detection** - Identifies bars where current volume exceeds threshold
4. **Lookback Period** - Checks if high volume occurred in recent bars (default: 5 bars)
**Signal logic:**
- Buy/Sell signals only trigger when BOTH conditions are met:
- MACD crossover/crossunder occurs
- High volume detected within lookback period
### Automatic CME Futures Integration
For forex traders, spot FX volume data can be unreliable or non-existent. This indicator solves this problem by automatically detecting forex pairs and mapping them to corresponding CME futures contracts with real institutional volume data.
**Supported Major Forex Pairs (7):**
- EURUSD → CME:6E1! (Euro FX Futures)
- GBPUSD → CME:6B1! (British Pound Futures)
- AUDUSD → CME:6A1! (Australian Dollar Futures)
- USDJPY → CME:6J1! (Japanese Yen Futures)
- USDCAD → CME:6C1! (Canadian Dollar Futures)
- USDCHF → CME:6S1! (Swiss Franc Futures)
- NZDUSD → CME:6N1! (New Zealand Dollar Futures)
**Supported Exotic Forex Pairs (4):**
- USDMXN → CME:6M1! (Mexican Peso Futures)
- USDRUB → CME:6R1! (Russian Ruble Futures)
- USDBRL → CME:6L1! (Brazilian Real Futures)
- USDZAR → CME:6Z1! (South African Rand Futures)
**Supported Cross Pairs (6):**
- EURJPY → CME:6E1! (Uses Euro Futures)
- GBPJPY → CME:6B1! (Uses British Pound Futures)
- EURGBP → CME:6E1! (Uses Euro Futures)
- AUDJPY → CME:6A1! (Uses Australian Dollar Futures)
- EURAUD → CME:6E1! (Uses Euro Futures)
- GBPAUD → CME:6B1! (Uses British Pound Futures)
**Supported Precious Metals (2):**
- Gold (XAUUSD, GOLD) → COMEX:GC1! (Gold Futures)
- Silver (XAGUSD, SILVER) → COMEX:SI1! (Silver Futures)
**Supported Energy Commodities (3):**
- WTI Crude Oil (USOIL, WTIUSD) → NYMEX:CL1! (Crude Oil Futures)
- Brent Oil (UKOIL) → NYMEX:BZ1! (Brent Crude Futures)
- Natural Gas (NATGAS) → NYMEX:NG1! (Natural Gas Futures)
**Supported Industrial Metals (1):**
- Copper (COPPER) → COMEX:HG1! (Copper Futures)
**How the automatic detection works:**
The indicator intelligently identifies the asset type by analyzing:
1. Exchange name (FX, OANDA, TVC, COMEX, NYMEX, etc.)
2. Currency pair pattern (6-letter codes like EURUSD, GBPUSD)
3. Commodity identifiers (XAU for gold, XAG for silver, OIL for crude)
When a supported instrument is detected, the indicator automatically switches to the corresponding futures contract for volume analysis. For stocks, cryptocurrencies, and other assets, the indicator uses the native volume data from the current chart.
**Visual feedback:**
An information table appears in the top-right corner of the MACD pane showing:
- Current chart symbol
- Exchange name
- Currency pair or asset name
- Volume source being used (highlighted in orange for futures, yellow for native volume)
- Current high volume status
This provides complete transparency about which data source the indicator is using for its volume analysis.
## How to Use
### Basic Setup
1. Add the indicator to your chart
2. The indicator displays in a separate pane (MACD) and overlay (signals/volume bars)
3. Default settings work well for most assets, but can be customized
### Signal Interpretation
### Visual Signals
**Visual Signals:**
- **Green "BUY" label** - Bullish MACD crossover confirmed by high volume
- **Red "SELL" label** - Bearish MACD crossunder confirmed by high volume
- **Green/Red candles** - Highlight bars with volume exceeding the threshold
- **Light green/red background** - Emphasizes signal bars on the chart
**Information Table:**
A detailed information table appears in the top-right corner of the MACD pane, providing real-time transparency about the indicator's operation:
- **Chart:** Current symbol being analyzed
- **Exchange:** The exchange or data feed being used
- **Pair:** The currency pair or asset name extracted from the ticker
- **Volume From:** The actual symbol used for volume analysis
- Orange color indicates CME or COMEX futures are being used (automatic institutional volume)
- Yellow color indicates native volume from the chart symbol is being used
- Hover tooltip shows whether automatic futures mapping is active
- **High Volume:** Current status showing YES (green) when volume exceeds threshold, NO (gray) otherwise
This table ensures complete transparency and allows you to verify that the correct volume source is being used for your analysis.
**Volume Analysis:**
- Gray histogram bars = Normal volume
- Red histogram bars = High volume (exceeds threshold)
- Green line = Volume moving average baseline
**MACD Analysis:**
- Blue line = MACD line (momentum indicator)
- Orange line = Signal line (trend confirmation)
- Gray dotted line = Zero line (bullish above, bearish below)
### Parameter Customization
**MACD Parameters:**
- Adjust Fast/Slow EMA lengths for different sensitivities
- Shorter periods = More signals, faster response
- Longer periods = Fewer signals, less noise
**Volume Parameters:**
- **Volume MA Period:** Higher values smooth volume analysis
- **High Volume Ratio:** Lower values (1.5x) = More signals; Higher values (3.0x) = Fewer, stronger signals
- **Volume Lookback Bars:** Controls how recent the volume spike must be
**Direction Filters:**
- **Only Buy Signals:** Enables long-only strategy mode
- **Only Sell Signals:** Enables short-only strategy mode
### Alert Configuration
The indicator includes three alert types:
1. **Buy Signal Alert** - Triggers when bullish signal appears
2. **Sell Signal Alert** - Triggers when bearish signal appears
3. **High Volume Alert** - Triggers when volume exceeds threshold
To set up alerts:
1. Click the indicator name → "Add alert on Smart MACD Volume Trader"
2. Select desired alert condition
3. Configure notification method (popup, email, webhook, etc.)
## Trading Strategy Guidelines
### Best Practices
**Recommended markets:**
- Liquid stocks (large-cap, high daily volume)
- Major forex pairs (EURUSD, GBPUSD, USDJPY, AUDUSD, USDCAD, USDCHF, NZDUSD)
- Exotic forex pairs (USDMXN, USDRUB, USDBRL, USDZAR)
- Cross pairs (EURJPY, GBPJPY, EURGBP, AUDJPY, EURAUD, GBPAUD)
- Precious metals (Gold, Silver with automatic COMEX futures mapping)
- Energy commodities (Crude Oil, Natural Gas with automatic NYMEX futures mapping)
- Industrial metals (Copper with automatic COMEX futures mapping)
- Major cryptocurrency pairs
- Index futures and ETFs
**Timeframe recommendations:**
- **Day trading:** 5-minute to 15-minute charts
- **Swing trading:** 1-hour to 4-hour charts
- **Position trading:** Daily charts
**Risk management:**
- Use signals as entry confirmation, not standalone strategy
- Combine with support/resistance levels
- Consider overall market trend direction
- Always use stop-loss orders
### Strategy Examples
**Trend Following Strategy:**
1. Identify overall trend using higher timeframe (e.g., daily chart)
2. Trade only in trend direction
3. Use "Only Buy" filter in uptrends, "Only Sell" in downtrends
4. Enter on signal, exit on opposite signal or at resistance/support
**Volume Breakout Strategy:**
1. Wait for consolidation period (low volume, tight MACD range)
2. Enter when signal appears with high volume (confirms breakout)
3. Target previous swing highs/lows
4. Stop loss below/above recent consolidation
**Forex Scalping Strategy (with automatic CME futures):**
1. The indicator automatically detects forex pairs and uses CME futures volume
2. Trade during active sessions only (use session filter)
3. Focus on quick profits (10-20 pips)
4. Exit at opposite signal or profit target
**Commodities Trading Strategy (Gold, Silver, Oil):**
1. The indicator automatically maps to COMEX and NYMEX futures contracts
2. Trade during high-liquidity sessions (overlap of major markets)
3. Use the high volume confirmation to identify institutional entry points
4. Combine with key support and resistance levels for entries
5. Monitor the information table to confirm futures volume is being used (orange color)
6. Exit on opposite MACD signal or at predefined profit targets
## Why This Combination Works
### The Volume Advantage
Studies consistently show that price movements accompanied by high volume are more likely to continue, while low-volume movements often reverse. This indicator leverages this principle by requiring volume confirmation.
**Key benefits:**
1. **Reduced False Signals:** Eliminates MACD whipsaws during low-volume consolidation
2. **Confirmation Bias:** Two independent indicators (price momentum + volume) agreeing
3. **Institutional Alignment:** High volume often indicates institutional participation
4. **Trend Validation:** Volume confirms that price momentum has "conviction"
### Statistical Edge
By combining two uncorrelated signals (MACD crossovers and volume spikes), the indicator creates a higher-probability setup than either signal alone. The lookback mechanism ensures signals aren't missed if volume spike slightly precedes the MACD cross.
## Supported Exchanges and Automatic Detection
The indicator includes intelligent asset detection that works across multiple exchanges and ticker formats:
**Forex Exchanges (Automatic CME Mapping):**
- FX (TradingView forex feed)
- OANDA
- FXCM
- SAXO
- FOREXCOM
- PEPPERSTONE
- EASYMARKETS
- FX_IDC
**Commodity Exchanges (Automatic COMEX/NYMEX Mapping):**
- TVC (TradingView commodity feed)
- COMEX (directly)
- NYMEX (directly)
- ICEUS
**Other Asset Classes (Native Volume):**
- Stock exchanges (NASDAQ, NYSE, AMEX, etc.)
- Cryptocurrency exchanges (BINANCE, COINBASE, KRAKEN, etc.)
- Index providers (SP, DJ, etc.)
The detection algorithm analyzes three factors:
1. Exchange prefix in the ticker symbol
2. Pattern matching for currency pairs (6-letter codes)
3. Commodity identifiers in the symbol name
This ensures accurate automatic detection regardless of which data feed or exchange you use for charting. The information table in the top-right corner always displays which volume source is being used, providing complete transparency.
## Technical Details
**Calculations:**
- MACD Fast MA: EMA(close, fastLength)
- MACD Slow MA: EMA(close, slowLength)
- MACD Line: Fast MA - Slow MA
- Signal Line: SMA(MACD Line, signalLength)
- Volume MA: Exponential MA of volume
- High Volume: Current volume >= Volume MA × Ratio
**Signal logic:**
```
Buy Signal = (MACD crosses above Signal) AND (High volume in last N bars)
Sell Signal = (MACD crosses below Signal) AND (High volume in last N bars)
```
## Parameters Reference
| Parameter | Default | Description |
|-----------|---------|-------------|
| Volume Symbol | Blank | Manual override for volume source (leave blank for automatic detection) |
| Use CME Futures | False | Legacy option (automatic detection is now built-in) |
| Alert Session | 1530-2200 | Active session time range for alerts |
| Timezone | UTC+1 | Timezone for alert sessions |
| Volume MA Period | 20 | Number of periods for volume moving average |
| High Volume Ratio | 2.0 | Volume threshold multiplier (2.0 = 200% of average) |
| Volume Lookback | 5 | Number of bars to check for high volume confirmation |
| MACD Fast Length | 12 | Fast EMA period for MACD calculation |
| MACD Slow Length | 26 | Slow EMA period for MACD calculation |
| MACD Signal Length | 9 | Signal line SMA period |
| Only Buy | False | Filter to show only bullish signals |
| Only Sell | False | Filter to show only bearish signals |
| Show Signals | True | Display buy and sell labels on chart |
## Optimization Tips
**For volatile markets (crypto, small caps):**
- Increase High Volume Ratio to 2.5-3.0
- Reduce Volume Lookback to 3-4 bars
- Consider faster MACD settings (8, 17, 9)
**For stable markets (large-cap stocks, bonds):**
- Decrease High Volume Ratio to 1.5-1.8
- Increase Volume MA Period to 30-50
- Use standard MACD settings
**For forex (with automatic CME futures):**
- The indicator automatically uses CME futures when forex pairs are detected
- Set appropriate trading session based on your timezone
- Use Volume Lookback of 5-7 bars
- Consider session-based alerts only
- Monitor the information table to verify correct futures mapping
**For commodities (Gold, Silver, Oil, Copper):**
- The indicator automatically maps to COMEX and NYMEX futures
- Increase High Volume Ratio to 2.0-2.5 for metals
- Use slightly higher Volume MA Period (25-30) for smoother analysis
- Trade during active market hours for best volume data
- The information table will show the futures contract being used (orange highlight)
## Limitations and Considerations
**What this indicator does NOT do:**
- Does not predict future price direction
- Does not guarantee profitable trades
- Does not replace proper risk management
- Does not work well in extremely low-volume conditions
**Market conditions to avoid:**
- Pre-market and after-hours sessions (low volume)
- Major news events (volatile, unpredictable volume)
- Holidays and low-liquidity periods
- Extremely low float stocks
## Conclusion
Smart MACD Volume Trader represents a significant evolution of the traditional MACD indicator by combining volume confirmation with automatic institutional volume integration. This dual-confirmation approach significantly improves signal quality by filtering out low-conviction price movements and ensuring traders work with accurate volume data.
The indicator's automatic detection and mapping system supports over 24 instruments across forex, commodities, and metals markets. By intelligently switching to CME and COMEX futures contracts when appropriate, the indicator provides forex and commodity traders with the same quality of volume data that stock traders naturally have access to.
This indicator is particularly valuable for traders who want to:
- Align their entries with institutional money flow
- Avoid getting trapped in false breakouts
- Trade forex pairs with reliable volume data
- Access accurate volume information for gold, silver, and energy commodities
- Combine momentum and volume analysis in a single, streamlined tool
Whether you are day trading stocks, swing trading forex pairs, or positioning in commodities markets, this indicator provides a robust framework for identifying high-probability momentum trades backed by genuine institutional participation. The automatic futures mapping works seamlessly across all supported instruments, requiring no manual configuration or expertise in futures markets.
---
## Support and Updates
This indicator is actively maintained and updated based on user feedback and market conditions. For questions about implementation or custom modifications, please use the comments section below.
**Disclaimer:** This indicator is for educational and informational purposes only. Past performance does not guarantee future results. Always conduct your own analysis and risk management before trading.

Historical VolatilityHistorical Volatility Indicator with Custom Trading Sessions
Overview
This indicator calculates **annualized Historical Volatility (HV)** using logarithmic returns and standard deviation. Unlike standard HV indicators, this version allows you to **customize trading sessions and holidays** for different markets, ensuring accurate volatility calculations for options pricing and risk management.
Key Features
✅ Custom Trading Sessions - Define multiple trading sessions per day with precise start/end times
✅ Multiple Markets Support - Pre-configured for US, Russian, European, and crypto markets
✅ Clearing Periods Handling - Account for intraday clearing breaks
✅ Flexible Calendar - Set trading days per year for different countries
✅ All Timeframes - Works correctly on intraday, daily, weekly, and monthly charts
✅ Info Table - Optional display showing calculation parameters
How It Works
The indicator uses the classical volatility formula:
σ_annual = σ_period × √(periods per year)
Where:
- σ_period = Standard deviation of logarithmic returns over the specified period
- Periods per year = Calculated based on actual trading time (not calendar time)
Calculation Method
1. Computes log returns: ln(close / close )
2. Calculates standard deviation over the lookback period
3. Annualizes using the square root rule with accurate period count
4. Displays as percentage
Settings
Calculation
- Period (default: 10) - Lookback period for volatility calculation
Trading Schedule
- Trading Days Per Year (default: 252) - Number of actual trading days
- USA: 252
- Russia: 247-250
- Europe: 250-253
- Crypto (24/7): 365
- Trading Sessions - Define trading hours in format: `hh:mm:ss-hh:mm:ss, hh:mm:ss-hh:mm:ss`
Display
- Show Info Table - Shows calculation parameters in real-time
Market Presets
United States (NYSE/NASDAQ)
Trading Sessions: 09:30:00-16:00:00
Trading Days Per Year: 252
Trading Minutes Per Day: 390
Russia (MOEX)
Trading Sessions: 10:00:00-14:00:00, 14:05:00-18:40:00
Trading Days Per Year: 248
Trading Minutes Per Day: 515
Europe (LSE)
Trading Sessions: 08:00:00-16:30:00
Trading Days Per Year: 252
Trading Minutes Per Day: 510
Germany (XETRA)
Trading Sessions: 09:00:00-17:30:00
Trading Days Per Year: 252
Trading Minutes Per Day: 510
Cryptocurrency (24/7)
Trading Sessions: 00:00:00-23:59:59
Trading Days Per Year: 365
Trading Minutes Per Day: 1440
Use Cases
Options Trading
- Compare HV vs IV - Historical volatility compared to implied volatility helps identify mispriced options
- Volatility mean reversion - Identify when volatility is unusually high or low
- Straddle/strangle selection - Choose optimal strikes based on historical movement
Risk Management
- Position sizing - Adjust position size based on current volatility
- Stop-loss placement - Set stops based on expected price movement
- Portfolio volatility - Monitor individual asset volatility contribution
Market Analysis
- Regime identification - Detect transitions between low and high volatility environments
- Cross-market comparison - Compare volatility across different assets and markets
Why Accurate Trading Hours Matter
Standard HV indicators assume 24-hour trading or use simplified day counts, leading to significant errors in annualized volatility:
- 5-minute chart error : Can be off by 50%+ if using wrong period count
- Options pricing impact : Even 2-3% HV error affects option values substantially
- Intraday vs overnight : Correctly excludes non-trading periods
This indicator ensures your HV calculations match the methodology used in professional options pricing models.
Technical Notes
- Uses actual trading minutes, not calendar days
- Handles multiple clearing periods within a single trading day
- Properly scales volatility across all timeframes
- Logarithmic returns for more accurate volatility measurement
- Compatible with Pine Script v6
Author Notes: This indicator was designed specifically for options traders who need precise volatility measurements across different global markets. The customizable trading sessions ensure your HV calculations align with actual market hours and industry-standard options pricing models.
BioSwarm Imprinter™BioSwarm Imprinter™ — Agent-Based Consensus for Traders
What it is
BioSwarm Imprinter™ is a non-repainting, agent-based sentiment oscillator. It fuses many short-to-medium lookback “opinions” into one 0–100 consensus line that is easy to read at a glance (50 = neutral, >55 bullish bias, <45 bearish bias). The engine borrows from swarm intelligence: many simple voters (agents) adapt their influence over time based on how well they’ve been predicting price, so the crowd gets smarter as conditions change.
Use it to:
• Detect emerging trends sooner without overreacting to noise.
• Filter mean-reversion vs continuation opportunities.
• Gate entries with a confidence score that reflects both strength and persistence of the move.
• Combine with your execution tools (VWAP/ORB/levels) as a state filter rather than a trade signal by itself.
⸻
Why it’s different
• Swarm learning: Each agent improves or decays its “fitness” depending on whether its vote matched the next bar’s direction. High-fitness agents matter more; weak agents fade.
• Multi-horizon by design: The crowd is composed of fixed, simple lookbacks spread from lenMin to lenMax. You get a blended, robust view instead of a single fragile parameter.
• Two complementary lenses: Each agent evaluates RSI-style balance (via Wilder’s RMA) and momentum (EMA deviation). You decide the weight of each.
• No repaint, no MTF pitfalls: Everything runs on the chart’s timeframe with bar-close confirmation; no request.security() or forward references.
• Actionable UI: A clean consensus line, optional regime background, confidence heat, and triangle markers when thresholds are crossed.
⸻
What you see on the chart
• Consensus line (0–100): Smoothed to your preference; color/area makes bull/bear zones obvious.
• Regime coloring (optional): Light green in bull zone, light red in bear zone; neutral otherwise.
• Confidence heat: A small gauge/number (0–100) that combines distance from neutral and recent persistence.
• Markers (optional): Triangles when consensus crosses up through your bull threshold (e.g., 55) or down through your bear threshold (e.g., 45).
• Info panel (optional): Consensus value, regime, confidence, number of agents, and basic diagnostics.
⸻
How it works (under the hood)
1. Horizon bins: The range is divided into numBins. Each bin has a fixed, simple integer length (crucial for Pine’s safety rules).
2. Per-bin features (computed every bar):
• RSI-style balance using Wilder’s RMA (not ta.rsi()), then mapped to −1…+1.
• Momentum as (close − EMA(L)) / EMA(L) (dimensionless drift).
3. Agent vote: For its assigned bin, an agent forms a weighted score: score = wRSI*RSI_like + wMOM*Momentum. A small dead-band near zero suppresses chop; votes are +1/−1/0.
4. Fitness update (bar close): If the agent’s previous vote agreed with the next bar’s direction, multiply its fitness by learnGain; otherwise by learnPain. Fitness is clamped so it never explodes or dies.
5. Consensus: Weighted average of all votes using fitness as weights → map to 0–100 and smooth with EMA.
Why it doesn’t repaint:
• No future references, no MTF resampling, fitness updates only on confirmed bars.
• All TA primitives (RMA/EMA/deltas) are computed every bar unconditionally.
⸻
Signals & confidence
• Bullish bias: consensus ≥ bullThr (e.g., 55).
• Bearish bias: consensus ≤ bearThr (e.g., 45).
• Confidence (0–100):
• Distance score: how far consensus is from 50.
• Momentum score: how strong the recent change is versus its recent average.
• Combined into a single gate; start filtering entries at ≥60 for higher quality.
Tip: For range sessions, raise thresholds (60/40) and increase smoothing; for momentum sessions, lower smoothing and keep thresholds at 55/45.
⸻
Inputs you’ll actually tune
• Agents & horizons:
• N_agents (e.g., 64–128)
• lenMin / lenMax (e.g., 6–30 intraday, 10–60 swing)
• numBins (e.g., 12–24)
• Weights & smoothing:
• wRSI vs wMOM (e.g., 0.7/0.3 for FX & indices; 0.6/0.4 for crypto)
• deadBand (0.03–0.08)
• consSmooth (3–8)
• Thresholds & hygiene:
• bullThr/bearThr (55/45 default)
• cooldownBars to avoid signal spam
⸻
Playbooks (ready-to-use)
1) Breakout / Trend continuation
• Timeframe: 15m–1h for day/swing.
• Filter: Take longs only when consensus > 55 and confidence ≥ 60.
• Execution: Use your ORB/VWAP/pullback trigger for entry. Trail with swing lows or 1.5×ATR. Exit on a close back under 50 or when a bearish signal prints.
2) Mean reversion (fade)
• When: Sideways days or low-volatility clusters.
• Setup: Increase deadBand and consSmooth.
• Signal: Bearish fades when consensus rolls over below ≈55 but stays above 50; bullish fades when it rolls up above ≈45 but stays below 50.
• Targets: The neutral zone (~50) as the first take-profit.
3) Multi-TF alignment
• Keep BioSwarm on 1H for bias, execute on 5–15m:
• Only take entries in the direction of the 1H consensus.
• Skip counter-bias scalps unless confidence is very low (explicit mean-reversion plan).
⸻
Integrations that work
• DynamoSent Pro+ (macro bias): Only act when macro bias and swarm consensus agree.
• ORB + Session VWAP Pro: Trade London/NY ORB breakouts that retest while consensus >55 (long) or <45 (short).
• Levels/Orderflow: BioSwarm is your “go / no-go”; execution stays with your usual triggers.
⸻
Quick start
1. Drop the indicator on a 1H chart.
2. Start with: N_agents=64, lenMin=6, lenMax=30, numBins=16, deadBand=0.06, consSmooth=5, thresholds 55/45.
3. Trade only when confidence ≥ 60.
4. Add your favorite execution tool (VWAP/levels/OR) for entries & exits.
⸻
Non-repainting & safety notes
• No request.security(); no hidden lookahead.
• Bar-close confirmation for fitness and signals.
• All TA calls are unconditional (no “sometimes called” warnings).
• No series-length inputs to RSI/EMA — we use RMA/EMA formulas that accept fixed simple ints per bin.
⸻
Known limits & tips
• Too many signals? Raise deadBand, increase consSmooth, widen thresholds to 60/40.
• Too few signals? Lower deadBand, reduce consSmooth, narrow thresholds to 53/47.
• Over-fitting risk: Keep learnGain/learnPain modest (e.g., ×1.04 / ×0.96).
• Compute load: Large N_agents × numBins is heavier; scale to your device.
⸻
Example recipes
EURUSD 1H (swing):
lenMin=8, lenMax=34, numBins=16, wRSI=0.7, wMOM=0.3, deadBand=0.06, consSmooth=6, thr=55/45
Buy breakouts when consensus >55 and confidence ≥60; confirm with 5–15m pullback to VWAP or level.
SPY 15m (US session):
lenMin=6, lenMax=24, numBins=12, consSmooth=4, deadBand=0.05
On trend days, stay with longs as long as consensus >55; add on shallow pullbacks.
BTC 1H (24/7):
Increase momentum weight: wRSI=0.6, wMOM=0.4, extend lenMax to ~50. Use dynamic stops (ATR) and partials on strong verticals.
⸻
Final word
BioSwarm is a state engine: it tells you when the market is primed to continue or mean-revert. Pair it with your entries and risk framework to turn that state into trades. If you’d like, I can supply a companion strategy template that consumes the consensus and back-tests the three playbooks (Breakout/Fade/Flip) with standard risk management.
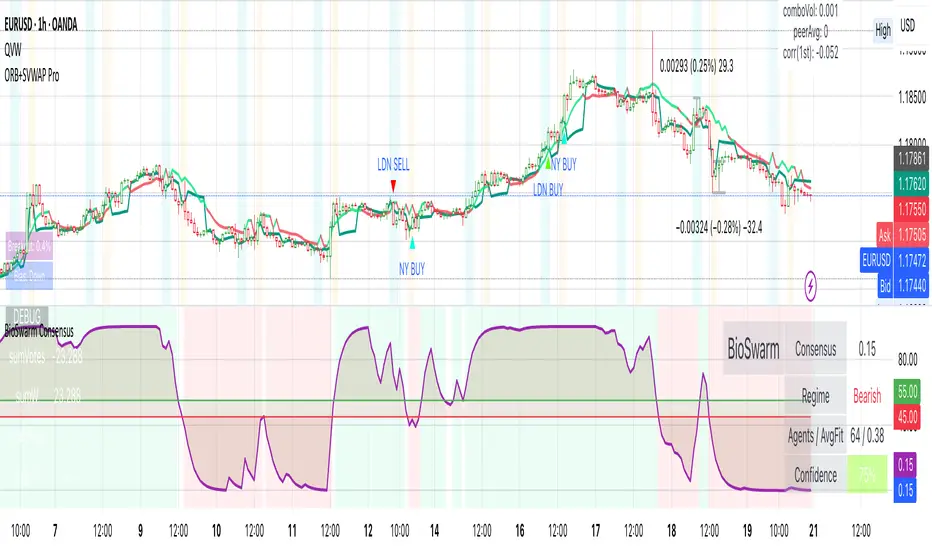
Six Meridian Divine Swords [theUltimator5]The Six Meridian Divine Sword is a legendary martial arts technique in the classic wuxia novel “Demi-Gods and Semi-Devils” (天龙八部) by Jin Yong (金庸). The technique uses powerful internal energy (qi) to shoot invisible sword-like energy beams from the six meridians of the hand. Each of the six fingers/meridians corresponds to a “sword,” giving six different sword energies.
The Six Meridian Divine Swords indicator is a compact “signal dashboard” that fuses six classic indicators (fingers)—MACD, KDJ, RSI, LWR (Williams %R), BBI, and MTM—into one pane. Each row is a traffic-light dot (green/bullish, red/bearish, gray/neutral). When all six align, the script draws a confirmation line (“All Bullish” or “All Bearish”). It’s designed for quick consensus reads across trend, momentum, and overbought/oversold conditions.
How to Read the Dashboard
The pane has 6 horizontal rows (explained in depth later):
MACD
KDJ
RSI
LWR (Larry Williams %R)
BBI (Bull & Bear Index)
MTM (Momentum)
Each tick in the row is a dot, with sentiment identified by a color.
Green = bullish condition met
Red = bearish condition met
Gray = inside a neutral band (filtering chop), shown when Use Neutral (Gray) Colors is ON
There are two lines that track the dots on the top or bottom of the pane.
All Bullish Signal Line: appears only if all 6 are strongly bullish (default color = white)
All Bearish Signal Line: appears only if all 6 are strongly bearish (default color = fuchsia)
The Six Meridians (Indicators) — What They Mean:
1) MACD — Trend & Momentum
What it is: A trend-following momentum indicator based on the relationship between two moving averages (typically 12-EMA and 26-EMA)
Logic used: Classic MACD line (EMA12−EMA26) vs its 9-EMA signal.
Bullish: MACD > Signal and |MACD−Signal| > Neutral Threshold
Bearish: MACD < Signal and |diff| > threshold
Neutral: |diff| ≤ threshold
Why: Small crosses can whipsaw. The neutral band ignores tiny separations to reduce noise.
Inputs: Fast/Slow/Signal lengths, Neutral Threshold.
2) KDJ — Stochastic with J-line boost
What it is: A variation of the stochastic oscillator popular in Chinese trading systems
Logic used: K = SMA(Stochastic, smooth), D = SMA(K, smooth), J = 3K − 2D.
Bullish: K > D and |K−D| > 2
Bearish: K < D and |K−D| > 2
Neutral: |K−D| ≤ 2
Why: K–D separation filters tiny wiggles; J offers an “extreme” early-warning context in the value label.
Inputs: Length, Smoothing.
3) RSI — Momentum balance (0–100)
What it is: A momentum oscillator measuring speed and magnitude of price changes (0–100)
Logic used: RSI(N).
Bullish: RSI > 50 + Neutral Zone
Bearish: RSI < 50 − Neutral Zone
Neutral: Between those bands
Why: Centerline/adaptive bands (around 50) give a directional bias without relying on fixed 70/30.
Inputs: Length, Neutral Zone (± around 50).
4) LWR (Williams %R) — Overbought/Oversold
What it is: An oscillator similar to stochastic, measuring how close the close is to the high-low range over N periods
Logic used: %R over N bars (0 to −100).
Bullish: %R > −50 + Neutral Zone
Bearish: %R < −50 − Neutral Zone
Neutral: Between those bands
Why: Uses a centered band around −50 instead of only −20/−80, making it act like a directional filter.
Inputs: Length, Neutral Zone (± around −50).
5) BBI (Bull & Bear Index) — Smoothed trend bias
What it is: A composite moving average, essentially the average of several different moving averages (often 3, 6, 12, 24 periods)
Logic used: Average of 4 SMAs (3/6/12/24 by default):
BBI = (MA3 + MA6 + MA12 + MA24) / 4
Bullish: Close > BBI and |Close−BBI| > 0.2% of BBI
Bearish: Close < BBI and |diff| > threshold
Neutral: |diff| ≤ threshold
Why: Multiple MAs blended together reduce single-MA whipsaw. A dynamic 0.2% band ignores tiny drift.
Inputs: 4 lengths (default 3/6/12/24). Threshold is auto-scaled at 0.2% of BBI.
6) MTM (Momentum) — Rate of change in price
What it is: A simple measure of rate of change
Logic used: MTM = Close − Close
Bullish: MTM > 0.5% of Close
Bearish: MTM < −0.5% of Close
Neutral: |MTM| ≤ threshold
Why: A percent-based gate adapts across prices (e.g., $5 vs $500) and mutes insignificant moves.
Inputs: Length. Threshold auto-scaled to 0.5% of current Close.
Display & Inputs You Can Tweak
🎨 Use Neutral (Gray) Colors
ON (default): 3-color mode with clear “no-trade”/“weak” states.
OFF: classic binary (green/red) without neutral filtering.

80% Rule Indicator (ETH Session + SVP Prior Session)I created this script to show the 80% opportunity on chart if setting lines up.
"80% rule: Open outside the vah or Val. Spend 30 mins outside there then break back inside spend 15 mins below or above depending which way u broke. Then come back and retest the vah/val and take it to the poc as a first target with the final target being the other Val/vah "
📌 Script Summary
The "80% Rule Indicator (ETH Session + SVP Prior Session)" overlays your chart with prior session value area levels (VAH, VAL, and POC) calculated from extended-hours 30-minute data. It tracks when the price reenters the value area and confirms 80% Rule setups during your chosen trading session. You can optionally trigger alerts, show/hide market sessions, and fine-tune line appearance for a clean, modular workflow.
⚙️ Options & Settings Breakdown
- Use 24-Hour Session (All Markets)
When checked, the indicator ignores time zones and tracks signals during a full 24-hour period (0000-0000), helpful if you're outside U.S. trading hours or want consistent behavior globally.
- Market Session
Dropdown to select one of three key market zones:
- New York (09:30–16:00 ET)
- London (08:00–16:30 local)
- Tokyo (09:00–15:00 local)
Used to gate entry signals during relevant hours unless you choose the 24-hour option.
- Show PD VAH/VAL/POC Lines
Toggle to show or hide prior day’s levels (based on the 30-min extended session). Turning this off removes both the lines and their white text labels.
- Extend Lines Right
When enabled, the VAH/VAL/POC lines extend into the current day’s session. If disabled, they appear only at their anchor point.
- Highlight Selected Session
Adds a soft blue background to help visualize the active session you selected.
- Enable Alert Conditions
Allows TradingView alerts to be created for long/short 80% Rule entries.
- Enable Audible Alerts
Plays an in-chart sound with a popup message (“80% Rule LONG” or “SHORT”) when signals trigger. Requires the chart to be active and sounds enabled in TradingView.
