Rule of 16 - LowerThe "Rule of 16" is a simple guideline used by traders and investors to estimate the expected annualized volatility of the S&P 500 Index (SPX) based on the level of the CBOE Volatility Index (VIX). The VIX, often referred to as the "fear gauge" or "fear index," measures the market's expectations for future volatility. It is calculated using the implied volatility of a specific set of S&P 500 options.
The Rule of 16 provides a rough approximation of the expected annualized percentage change in the S&P 500 based on the VIX level. Here's how it works:
Find the VIX level: Look up the current value of the VIX. Let's say it's currently at 20.
Apply the Rule of 16: Divide the VIX level by 16. In this example, 20 divided by 16 equals 1.25.
Result: The result of this calculation represents the expected annualized percentage change in the S&P 500. In this case, 1.25% is the estimated annualized volatility.
So, according to the Rule of 16, a VIX level of 20 suggests an expected annualized volatility of approximately 1.25% in the S&P 500.
Here's how you can use the Rule of 16:
Market Sentiment: The VIX is often used as an indicator of market sentiment. When the VIX is high (above its historical average), it suggests that investors expect higher market volatility, indicating potential uncertainty or fear in the markets. Conversely, when the VIX is low, it suggests lower expected volatility and potentially more confidence in the markets.
Risk Management: Traders and investors can use the Rule of 16 to estimate the potential risk associated with their portfolios. For example, if you have a portfolio of S&P 500 stocks and the VIX is at 20, you can use the Rule of 16 to estimate that the annualized volatility of your portfolio may be around 1.25%. This information can help you make decisions about position sizing and risk management.
Option Pricing: Options traders may use the Rule of 16 to get a quick estimate of the implied annualized volatility priced into S&P 500 options. It can help them assess whether options are relatively expensive or cheap based on the VIX level.
It's important to note that the Rule of 16 is a simplification and provides only a rough estimate of expected volatility. Market conditions and the relationship between the VIX and the S&P 500 can change over time. Therefore, it should be used as a guideline rather than a precise forecasting tool. Traders and investors should consider other factors and use additional analysis to make informed decisions.
Tìm kiếm tập lệnh với "美股标普500"

LineWrapperLibrary "LineWrapper"
Wrapper Type for Line. Useful when you want to store the line details without drawing them. Can also be used in scnearios where you collect lines to be drawn and draw together towards the end.
draw(this)
draws line as per the wrapper object contents
Parameters:
this : (series Line) Line object.
Returns: current Line object
draw(this)
draws lines as per the wrapper object array
Parameters:
this : (series array) Array of Line object.
Returns: current Array of Line objects
update(this)
updates or redraws line as per the wrapper object contents
Parameters:
this : (series Line) Line object.
Returns: current Line object
update(this)
updates or redraws lines as per the wrapper object array
Parameters:
this : (series array) Array of Line object.
Returns: current Array of Line objects
get_price(this, bar)
get line price based on bar
Parameters:
this : (series Line) Line object.
bar : (series/int) bar at which line price need to be calculated
Returns: line price at given bar.
get_x1(this)
Returns UNIX time or bar index (depending on the last xloc value set) of the first point of the line.
Parameters:
this : (series Line) Line object.
Returns: UNIX timestamp (in milliseconds) or bar index.
get_x2(this)
Returns UNIX time or bar index (depending on the last xloc value set) of the second point of the line.
Parameters:
this : (series Line) Line object.
Returns: UNIX timestamp (in milliseconds) or bar index.
get_y1(this)
Returns price of the first point of the line.
Parameters:
this : (series Line) Line object.
Returns: Price value.
get_y2(this)
Returns price of the second point of the line.
Parameters:
this : (series Line) Line object.
Returns: Price value.
set_x1(this, x, draw, update)
Sets bar index or bar time (depending on the xloc) of the first point.
Parameters:
this : (series Line) Line object.
x : (series int) Bar index or bar time. Note that objects positioned using xloc.bar_index cannot be drawn further than 500 bars into the future.
draw : (series bool) draw line after setting attribute
update : (series bool) update line instead of redraw. Only valid if draw is set.
Returns: Current Line object
set_x2(this, x, draw, update)
Sets bar index or bar time (depending on the xloc) of the second point.
Parameters:
this : (series Line) Line object.
x : (series int) Bar index or bar time. Note that objects positioned using xloc.bar_index cannot be drawn further than 500 bars into the future.
draw : (series bool) draw line after setting attribute
update : (series bool) update line instead of redraw. Only valid if draw is set.
Returns: Current Line object
set_y1(this, y, draw, update)
Sets price of the first point
Parameters:
this : (series Line) Line object.
y : (series int/float) Price.
draw : (series bool) draw line after setting attribute
update : (series bool) update line instead of redraw. Only valid if draw is set.
Returns: Current Line object
set_y2(this, y, draw, update)
Sets price of the second point
Parameters:
this : (series Line) Line object.
y : (series int/float) Price.
draw : (series bool) draw line after setting attribute
update : (series bool) update line instead of redraw. Only valid if draw is set.
Returns: Current Line object
set_color(this, color, draw, update)
Sets the line color
Parameters:
this : (series Line) Line object.
color : (series color) New line color
draw : (series bool) draw line after setting attribute
update : (series bool) update line instead of redraw. Only valid if draw is set.
Returns: Current Line object
set_extend(this, extend, draw, update)
Sets extending type of this line object. If extend=extend.none, draws segment starting at point (x1, y1) and ending at point (x2, y2). If extend is equal to extend.right or extend.left, draws a ray starting at point (x1, y1) or (x2, y2), respectively. If extend=extend.both, draws a straight line that goes through these points.
Parameters:
this : (series Line) Line object.
extend : (series string) New extending type.
draw : (series bool) draw line after setting attribute
update : (series bool) update line instead of redraw. Only valid if draw is set.
Returns: Current Line object
set_style(this, style, draw, update)
Sets the line style
Parameters:
this : (series Line) Line object.
style : (series string) New line style.
draw : (series bool) draw line after setting attribute
update : (series bool) update line instead of redraw. Only valid if draw is set.
Returns: Current Line object
set_width(this, width, draw, update)
Sets the line width.
Parameters:
this : (series Line) Line object.
width : (series int) New line width in pixels.
draw : (series bool) draw line after setting attribute
update : (series bool) update line instead of redraw. Only valid if draw is set.
Returns: Current Line object
set_xloc(this, x1, x2, xloc, draw, update)
Sets x-location and new bar index/time values.
Parameters:
this : (series Line) Line object.
x1 : (series int) Bar index or bar time of the first point.
x2 : (series int) Bar index or bar time of the second point.
xloc : (series string) New x-location value.
draw : (series bool) draw line after setting attribute
update : (series bool) update line instead of redraw. Only valid if draw is set.
Returns: Current Line object
set_xy1(this, x, y, draw, update)
Sets bar index/time and price of the first point.
Parameters:
this : (series Line) Line object.
x : (series int) Bar index or bar time. Note that objects positioned using xloc.bar_index cannot be drawn further than 500 bars into the future.
y : (series int/float) Price.
draw : (series bool) draw line after setting attribute
update : (series bool) update line instead of redraw. Only valid if draw is set.
Returns: Current Line object
set_xy2(this, x, y, draw, update)
Sets bar index/time and price of the second point
Parameters:
this : (series Line) Line object.
x : (series int) Bar index or bar time. Note that objects positioned using xloc.bar_index cannot be drawn further than 500 bars into the future.
y : (series int/float) Price.
draw : (series bool) draw line after setting attribute
update : (series bool) update line instead of redraw. Only valid if draw is set.
Returns: Current Line object
delete(this)
Deletes the underlying line drawing object
Parameters:
this : (series Line) Line object.
Returns: Current Line object
Line
Line Wrapper object
Fields:
x1 : (series int) Bar index (if xloc = xloc.bar_index) or bar UNIX time (if xloc = xloc.bar_time) of the first point of the line. Note that objects positioned using xloc.bar_index cannot be drawn further than 500 bars into the future.
y1 : (series int/float) Price of the first point of the line.
x2 : (series int) Bar index (if xloc = xloc.bar_index) or bar UNIX time (if xloc = xloc.bar_time) of the second point of the line. Note that objects positioned using xloc.bar_index cannot be drawn further than 500 bars into the future.
y2 : (series int/float) Price of the second point of the line.
xloc : (series string) See description of x1 argument. Possible values: xloc.bar_index and xloc.bar_time. Default is xloc.bar_index.
extend : (series string) If extend=extend.none, draws segment starting at point (x1, y1) and ending at point (x2, y2). If extend is equal to extend.right or extend.left, draws a ray starting at point (x1, y1) or (x2, y2), respectively. If extend=extend.both, draws a straight line that goes through these points. Default value is extend.none.
color : (series color) Line color.
style : (series string) Line style. Possible values: line.style_solid, line.style_dotted, line.style_dashed, line.style_arrow_left, line.style_arrow_right, line.style_arrow_both.
width : (series int) Line width in pixels.
obj : line object
[fikira] Fibonacci MA / EMA's (Fibma / Fibema)I've made SMA/EMA's NOT based on the principle of the 2(1+1), 3(2+1),
5(3+2), 8(5+3), 13(8+5), 21(13+8), 34(21+13), 55(34+21), ... numbers,
but based on these following Fibonacci numbers:
0,236
0,382
0,500
0,618
0,764
1
Ending up with 2 series of Fibma / Fibema:
"Tiny Fibma / Fibema":
24, 38, 50, 62, 76, 100
"Big Fibma / Fibema":
236, 382, 500, 618, 764, 1000
IMHO it is striking how these lines often act as Resistance/Support,
although (except the 50, 100 & 500) they are not typical MA/EMA's.
They perform very well on every Timeframe as well!
Week:
3 Days:
1 Day:
4h:
1h:
Even on the 15 minutes:
Or 5':
Things to watch for:
Price compared to the Tiny or Big Fibma / Fibema (below or above)
Price compared to important Fibma / Fibema (for example below or
above MA 236, MA 764, MA 1000, ...)
Crossing of Fibma / Fibema 24/76, 236/764 and 38/62, 382/618
(bullish crossover = Lime coloured "cloud", bearish crossunder = Red coloured "cloud"),
...
I've made a change in barcolor if the close crosses the "Big Fibma / Fibema 500"
If price closes above MA/EMA 500, the first bar is yellow coloured,
if price stays above this level, candles are coloured lime/orange (= very bullish)
If price closes under MA/EMA 500, the first bar is purple,
if price stays under this level, candles are standard coloured (= very bearish)
Strategy will follow,
Thanks!

ICT Fair Value Gap Detector [Eˣ]⚡ Fair Value Gap Detector
Overview
The Fair Value Gap Detector automatically identifies price imbalances on your charts - the inefficiencies left behind when price moves too quickly. This indicator reveals where price is likely to return for "rebalancing", based on ICT (Inner Circle Trader) concepts of market efficiency.
━━━━━━━━━━━━━━━━━━━━━━━━━━━━
🎯 What This Indicator Does
Detects Fair Value Gaps:
• 🟢 Bullish FVG - Gap left below during aggressive upward move
• 🔴 Bearish FVG - Gap left above during aggressive downward move
• Automatically identifies 3-candle price inefficiencies
• Works on all timeframes and instruments
Smart Fill Tracking:
• Full Fill - Price completely fills the gap
• 50% Fill - Price fills half the gap (critical level)
• Partial Fill - Price touches gap edge
• Real-time fill percentage tracking
• Auto-removes filled gaps (optional)
Professional Features:
• Active Gap Highlighting - Shows nearest unfilled gap
• Distance Calculator - Displays how far price is from gaps
• Market Bias - Analysis based on gap balance
• Size Filtering - Minimum gap size to avoid noise
• Visual Clarity - Clean boxes with color-coding
━━━━━━━━━━━━━━━━━━━━━━━━━━━━
📚 Understanding Fair Value Gaps
What Are Fair Value Gaps?
Fair Value Gaps (FVGs), also known as imbalances or inefficiencies, are zones where price moved so quickly that normal trading didn't occur. They represent:
• Price Imbalance - One-sided aggressive buying or selling
• Unfair Pricing - Some participants didn't get to trade at these levels
• Market Inefficiency - Supply/demand equilibrium was disrupted
• Rebalancing Zones - Price often returns to "fill" these gaps
The ICT Concept:
Markets constantly seek equilibrium (fair value). When price moves too fast:
1. It leaves gaps where normal trading didn't happen
2. These gaps represent unfair/inefficient pricing
3. Market has a tendency to return and "rebalance"
4. Smart money knows this and trades the fills
Why FVGs Work:
• Unfilled Orders - Traders who missed the move have pending orders in the gap
• Algorithmic Trading - Algos programmed to exploit inefficiencies
• Market Psychology - Traders notice gaps and place orders there
• Institutional Behavior - Smart money uses gaps for entries/exits
FVG vs Regular Gaps:
• Regular Gaps - Occur at market open, between daily closes
• Fair Value Gaps - Occur intraday, between 3 consecutive candles
• FVGs happen more frequently and on all timeframes
• FVGs are more tradeable for intraday/swing traders
━━━━━━━━━━━━━━━━━━━━━━━━━━━━
🟢 Bullish Fair Value Gaps Explained
How They Form:
Bullish FVG requires 3 candles:
1. Candle 1 - Any candle (sets the high reference)
2. Candle 2 - Strong bullish candle (aggressive buying)
3. Candle 3 - Continuation candle
The Gap: Candle 3's LOW is above Candle 1's HIGH = Gap left unfilled
Visual Example:
```
Candle 3: Low at $105 ──────────┐
│ ← GAP (Bullish FVG)
Candle 2: Strong bullish │
│
Candle 1: High at $100 ──────────┘
```
What It Means:
• Price jumped from $100 to $105+ so fast, no trading occurred in between
• This $100-$105 zone is "unfair" - buyers/sellers didn't get to trade there
• Market may return to this zone to "rebalance"
• When price returns, it often acts as support
Trading Bullish FVGs:
Strategy:
• Wait for price to retrace down into the bullish FVG (green box)
• Look for rejection/bounce from the gap zone
• Enter long when price respects the FVG as support
• Stop loss: Below the FVG
• Target: Previous high or opposite FVG
Best Entry Points:
• 50% Fill: Price enters middle of gap (highest probability)
• Full Fill: Price touches bottom of gap (aggressive entry)
• Tap & Reject: Price quickly enters and exits gap (strong signal)
Example Trade:
• Bullish FVG forms: $50,000 - $50,500 (500 point gap)
• Price rallies to $52,000 then retraces
• Price drops to $50,250 (50% of gap filled)
• Bullish reversal candle appears
• Enter long at $50,500, stop at $49,800
• Target: $52,000+
━━━━━━━━━━━━━━━━━━━━━━━━━━━━
🔴 Bearish Fair Value Gaps Explained
How They Form:
Bearish FVG requires 3 candles:
1. Candle 1 - Any candle (sets the low reference)
2. Candle 2 - Strong bearish candle (aggressive selling)
3. Candle 3 - Continuation candle
The Gap: Candle 3's HIGH is below Candle 1's LOW = Gap left unfilled
Visual Example:
```
Candle 1: Low at $100 ───────────┐
│ ← GAP (Bearish FVG)
Candle 2: Strong bearish │
│
Candle 3: High at $95 ───────────┘
```
What It Means:
• Price dropped from $100 to $95 so fast, no trading occurred in between
• This $95-$100 zone is "unfair" - buyers/sellers didn't get to trade there
• Market may return to this zone to "rebalance"
• When price returns, it often acts as resistance
Trading Bearish FVGs:
Strategy:
• Wait for price to retrace up into the bearish FVG (red box)
• Look for rejection/reversal from the gap zone
• Enter short when price respects the FVG as resistance
• Stop loss: Above the FVG
• Target: Previous low or opposite FVG
Best Entry Points:
• 50% Fill: Price enters middle of gap (highest probability)
• Full Fill: Price touches top of gap (aggressive entry)
• Tap & Reject: Price quickly enters and exits gap (strong signal)
Example Trade:
• Bearish FVG forms: $48,000 - $48,500 (500 point gap)
• Price drops to $46,000 then retraces
• Price rallies to $48,250 (50% of gap filled)
• Bearish reversal candle appears
• Enter short at $48,000, stop at $48,700
• Target: $46,000-
━━━━━━━━━━━━━━━━━━━━━━━━━━━━
📊 How To Use This Indicator
Strategy 1: FVG Rebalancing (Classic)
Best For: Swing trading, reversal trading
Timeframes: 15min, 1H, 4H
Win Rate: 65-75%
Entry Rules:
1. Identify unfilled FVG (bright color, not gray)
2. Wait for price to return to the gap
3. Best entry: 50% fill of the gap
4. Look for reversal confirmation:
• Bullish FVG: Pin bar, engulfing, hammer
• Bearish FVG: Shooting star, bearish engulfing
5. Enter when price bounces/rejects from FVG
6. Stop: Beyond opposite side of FVG
7. Target: 2-3R or previous high/low
Why It Works: 70%+ of FVGs get filled, and 60%+ show reaction
Strategy 2: FVG + Order Block Confluence
Best For: High-probability setups
Timeframes: 1H, 4H
Win Rate: 75-85%
Entry Rules:
1. Find FVG that overlaps with Order Block
2. This creates a "super zone" of confluence
3. Wait for price to return to this zone
4. Enter on first touch of confluence zone
5. Stop: Beyond the confluence zone
6. Target: 3-4R
Why It Works: Double institutional concepts = highest probability
Strategy 3: Multi-Timeframe FVG
Best For: Position trading, major moves
Timeframes: Combine Daily + 4H or 4H + 1H
Win Rate: 70-80%
Entry Rules:
1. Identify large FVG on higher timeframe (Daily/4H)
2. Wait for price to enter this HTF FVG
3. Switch to lower timeframe (4H/1H)
4. Look for LTF FVG within HTF FVG in same direction
5. Trade the LTF FVG fill
6. Stop: Below LTF FVG
7. Target: Exit HTF FVG or beyond
Why It Works: Timeframe alignment = institutional consensus
Strategy 4: FVG Rejection Trade
Best For: Quick scalps, day trading
Timeframes: 5min, 15min
Win Rate: 60-70%
Entry Rules:
1. Price enters FVG zone
2. Immediate rejection (strong reversal candle)
3. Enter on close of rejection candle
4. Tight stop beyond FVG
5. Quick target: 1-2R
Why It Works: Strong rejection = institutional defense of level
Strategy 5: FVG-to-FVG Trading
Best For: Momentum trading
Timeframes: 15min, 1H
Win Rate: 55-65%
Entry Rules:
1. Identify bullish FVG below and bearish FVG above
2. Enter long at bullish FVG, target bearish FVG
3. Or enter short at bearish FVG, target bullish FVG
4. Price often moves from one imbalance to another
5. Stop: Beyond trading FVG
6. Target: Opposite FVG
Why It Works: Price rebalances from one inefficiency to another
━━━━━━━━━━━━━━━━━━━━━━━━━━━━
⚙️ Settings Explained
Display Settings
Show Bullish/Bearish FVG
• Toggle each type on/off independently
• Customize colors for each FVG type
• Default: Green (bullish), Red (bearish)
• Tip: Use colors that contrast with your chart
Max FVG to Display (Default: 20)
• Limits how many gaps are shown at once
• Lower (10-15): Cleaner chart, recent gaps only
• Higher (30-50): More historical context
• Recommended: 15-25 for most trading
Show FVG Labels (Default: ON)
• Displays "FVG+" and "FVG-" text on gaps
• Shows 🎯 on active (nearest) gap
• Shows fill percentage (e.g., "FVG+ 35%")
• Turn OFF for minimal appearance
• Recommended: Keep ON for clarity
Extend Gaps (bars) (Default: 50)
• How far to extend gap boxes to the right
• Lower (20-30): Shorter boxes
• Higher (100+): Longer boxes, easier to see
• Gaps auto-extend until filled or limit reached
• Recommended: 40-60 bars
Filters
Min Gap Size % (Default: 0.05)
• Minimum gap size as percentage of price
• Filters out tiny, insignificant gaps
• Crypto: 0.05-0.15% (high volatility)
• Forex: 0.03-0.10% (moderate volatility)
• Stocks: 0.05-0.20% (varies by stock)
• Indices: 0.05-0.15%
• Adjust based on instrument's average move
Show Filled Gaps (Default: OFF)
• When ON: Shows gray boxes for filled gaps
• When OFF: Gaps disappear after mitigation
• Use ON: For learning and backtesting
• Use OFF: For clean, active trading view
Advanced Settings
Auto-Detect Mitigation (Default: ON)
• Automatically tracks when gaps are filled
• Updates fill percentage in real-time
• Marks gaps as "mitigated" when filled
• Recommended: Keep ON
Mitigation Type (Default: Full)
• Full: Gap considered filled when price closes through entire gap
• 50%: Gap considered filled at 50% (critical level)
• Partial: Gap considered filled on first touch
• For learning: Use "Full"
• For aggressive trading: Use "50%"
• For conservative trading: Use "Partial"
Highlight Nearest Gap (Default: ON)
• Highlights the closest unfilled gap to current price
• Active gap shown with 🎯 emoji and brighter color
• Helps focus on most relevant opportunity
• Recommended: Keep ON
━━━━━━━━━━━━━━━━━━━━━━━━━━━━
📱 Info Panel Guide
Bullish FVG Count
• Number of active (unfilled) bullish fair value gaps
• Higher number = More potential support zones below
• Multiple bullish FVGs = Strong rebalancing demand
Bearish FVG Count
• Number of active (unfilled) bearish fair value gaps
• Higher number = More potential resistance zones above
• Multiple bearish FVGs = Strong rebalancing supply
Bias Indicator
• ⬆ Bullish: More bullish FVGs than bearish
• ⬇ Bearish: More bearish FVGs than bullish
• ↔ Neutral: Equal FVGs on both sides
• Market tends to fill nearby gaps first
Target Indicator
• Shows nearest unfilled gap and distance
• Example: "Bull FVG -1.25%" = Bullish gap is 1.25% below price
• Example: "Bear FVG +0.85%" = Bearish gap is 0.85% above price
• Watch for price to reach these targets
━━━━━━━━━━━━━━━━━━━━━━━━━━━━
📱 Alert Setup
This indicator includes 4 alert types:
1. Price Entering Bullish FVG
• Fires when price drops into a bullish gap
• Action: Watch for bounce/reversal
• High-probability long setup developing
2. Price Entering Bearish FVG
• Fires when price rallies into a bearish gap
• Action: Watch for rejection/reversal
• High-probability short setup developing
3. New Bullish FVG Detected
• Fires when a new bullish gap forms
• Action: Mark zone for future fill
• New rebalancing target below identified
4. New Bearish FVG Detected
• Fires when a new bearish gap forms
• Action: Mark zone for future fill
• New rebalancing target above identified
To Set Up Alerts:
1. Click "Alert" button (clock icon)
2. Select "Fair Value Gap Detector"
3. Choose your alert condition
4. Configure notification method
5. Click "Create"
Pro Tip: Set "Price Entering" alerts to catch fills in real-time
━━━━━━━━━━━━━━━━━━━━━━━━━━━━
💎 Pro Tips & Best Practices
✅ DO:
• Wait for 50% fill - Middle of gap has highest win rate (65-70%)
• Use confirmation - Don't trade just because price touched gap
• Combine with structure - FVG + support/resistance = high probability
• Trade first fill - Unfilled gaps have better success rate than refilled
• Respect full fills - Once fully filled, gap is less reliable
• Use multiple timeframes - HTF FVGs are stronger than LTF
• Check session timing - FVGs work best during London/NY sessions
• Follow the bias - More bullish FVGs = favor longs
⚠️ DON'T:
• Don't blindly fade gaps - Wait for price action confirmation
• Don't ignore momentum - Strong trends can blow through FVGs
• Don't trade every gap - Quality over quantity
• Don't assume all gaps fill - About 70-80% fill, 20-30% don't
• Don't use tight stops - Allow room for wick into gap
• Don't overtrade - Wait for confluence and confirmation
• Don't fight trends - Best FVG trades are with higher TF trend
• Don't ignore fill percentage - 50% is often the sweet spot
🎯 Best Timeframes:
• Scalpers: 1min, 5min (many gaps, quick fills)
• Day Traders: 5min, 15min, 1H (balanced)
• Swing Traders: 1H, 4H, Daily (larger, more reliable gaps)
• Position Traders: 4H, Daily, Weekly (major imbalances)
🔥 Best Instruments:
• Excellent: BTC, ETH, ES, NQ, Forex majors (clean price action)
• Good: Gold, Oil, Major indices, Large-cap stocks
• Moderate: Altcoins, small-cap stocks (more noise)
• Best Markets: Trending markets with clear swings
⏰ Best Times for FVG Trading:
• London Session: High volume = reliable gap fills
• NY Session: Strong moves create quality gaps
• London-NY Overlap: Best time for gap creation and fills
• Asian Session: Lower probability, wait for London
━━━━━━━━━━━━━━━━━━━━━━━━━━━━
🎓 Advanced FVG Concepts
FVG Mitigation Levels
Understanding fill percentages:
• 0-25% Fill: Gap barely touched, often continues without fill
• 25-50% Fill: Partial rebalancing, may reverse here
• 50% Fill: CRITICAL LEVEL - Highest probability reversal zone
• 50-75% Fill: Deep rebalancing, strong reversal likely
• 75-100% Fill: Full rebalancing, gap's purpose fulfilled
Why 50% Matters: Market seeks equilibrium, and 50% represents perfect balance
FVG Inversions
When price breaks through a gap completely:
• Bullish FVG that's broken becomes bearish (support → resistance)
• Bearish FVG that's broken becomes bullish (resistance → support)
• Inverted gaps are weaker than fresh gaps
• Trading: Can fade the inverted gap but with caution
FVG Confluence Zones
Multiple FVGs at similar level:
• Creates "super gap" or confluence zone
• Much higher probability of reaction
• Wider zone for entries (more room for stops)
• Often aligns with other institutional concepts
FVG + Order Block Combo
When FVG overlaps with Order Block:
• Double institutional concept
• Extremely high probability setup (75-85% win rate)
• Price drawn to fill gap AND test order block
• Use tight stops, generous targets (3-5R possible)
Nested FVGs (Multi-Timeframe)
Small FVG inside larger FVG:
• Daily FVG contains 4H FVG contains 1H FVG
• Trade the smallest FVG in direction of larger ones
• Highest probability when all aligned
• Progressive targets: Fill small → medium → large gaps
FVG Exhaustion
When price creates multiple FVGs in same direction:
• Indicates strong momentum/impulsive move
• Each gap represents acceleration
• Last gap often signals exhaustion
• Watch for reversal after filling final gap
━━━━━━━━━━━━━━━━━━━━━━━━━━━━
📈 Common FVG Patterns
Pattern 1: The Perfect Rebalance
• FVG forms during strong move
• Price continues 100+ pips
• Clean return to 50% of gap
• Immediate reversal
• Textbook setup, 70%+ win rate
Pattern 2: The Double Fill
• Price partially fills gap (25%)
• Weak reaction, continues
• Returns again for deeper fill (75%)
• Strong reversal on second fill
• Second fill often better entry
Pattern 3: The Blow-Through
• Price approaches gap
• Completely ignores it, no reaction
• Keeps going in same direction
• Sign of very strong momentum
Pattern 4: The Magnet Effect
• Price slowly grinds toward gap
• Accelerates as it gets close
• Quickly fills and reverses
• Common in ranging markets
Pattern 5: The False Fill
• Price wicks into gap briefly
• Immediately reverses without filling
• "Stop hunt" or liquidity grab
• Gap remains unfilled
• Often precedes strong move
━━━━━━━━━━━━━━━━━━━━━━━━━━━━
🚀 What Makes This Different?
Unlike basic gap indicators, Fair Value Gap Detector:
• ICT Methodology - Based on proven institutional concepts
• Real-Time Fill Tracking - Shows percentage filled as it happens
• 3 Mitigation Types - Full, 50%, Partial for different strategies
• Active Gap Highlighting - Shows most relevant opportunity
• Smart Filtering - Minimum size to avoid noise
• Visual Clarity - Clean, professional appearance
• Auto-Management - Removes filled gaps automatically
• Distance Tracking - Know exactly where price needs to go
Based On Professional Concepts:
• ICT Fair Value Gap theory
• Market efficiency principles
• Price rebalancing dynamics
• Institutional order flow analysis
━━━━━━━━━━━━━━━━━━━━━━━━━━━━
📈 FVG Statistics & Probabilities
Based on ICT concepts and trader observations:
Gap Fill Rates:
• 70-80% of FVGs get filled eventually
• 60-70% show some reaction when filled
• 50% fill level has ~65% reversal rate
• Full fills have ~55% reversal rate
Timeframe Reliability:
• Daily FVGs: ~75-85% fill rate, strongest reactions
• 4H FVGs: ~70-80% fill rate, strong reactions
• 1H FVGs: ~65-75% fill rate, good reactions
• 15min FVGs: ~60-70% fill rate, moderate reactions
• 5min FVGs: ~55-65% fill rate, weaker reactions
Best Practices:
• First touch of gap = 65-70% win rate
• 50% fill = 65% win rate
• FVG + Order Block = 75-85% win rate
• Multi-timeframe aligned FVG = 70-80% win rate
• FVG in trending market = 60-70% win rate
Common Failures:
• Strong momentum blows through gaps (20-30% of time)
• Gaps in low-volume periods less reliable
• Very small gaps (<0.05%) often ignored
• Counter-trend gaps have lower success rate
━━━━━━━━━━━━━━━━━━━━━━━━━━━━
🙏 If You Find This Helpful
• ⭐ Leave your feedback
• 💬 Share your experience in the comments
• 🔔 Follow for updates and new tools
Questions about Fair Value Gaps? Feel free to ask in the comments.
━━━━━━━━━━━━━━━━━━━━━━━━━━━━
Version History
• v1.0 - Initial release with 3-candle FVG detection and real-time fill tracking

Kripto Fema ind/ This Pine Script™ code is subject to the terms of the Mozilla Public License 2.0 at mozilla.org
// © Femayakup
//@version=5
indicator(title = "Kripto Fema ind", shorttitle="Kripto Fema ind", overlay=true, format=format.price, precision=2,max_lines_count = 500, max_labels_count = 500, max_bars_back=500)
showEma200 = input(true, title="EMA 200")
showPmax = input(true, title="Pmax")
showLinreg = input(true, title="Linreg")
showMavilim = input(true, title="Mavilim")
showNadaray = input(true, title="Nadaraya Watson")
ma(source, length, type) =>
switch type
"SMA" => ta.sma(source, length)
"EMA" => ta.ema(source, length)
"SMMA (RMA)" => ta.rma(source, length)
"WMA" => ta.wma(source, length)
"VWMA" => ta.vwma(source, length)
//Ema200
timeFrame = input.timeframe(defval = '240',title= 'EMA200 TimeFrame',group = 'EMA200 Settings')
len200 = input.int(200, minval=1, title="Length",group = 'EMA200 Settings')
src200 = input(close, title="Source",group = 'EMA200 Settings')
offset200 = input.int(title="Offset", defval=0, minval=-500, maxval=500,group = 'EMA200 Settings')
out200 = ta.ema(src200, len200)
higherTimeFrame = request.security(syminfo.tickerid,timeFrame,out200 ,barmerge.gaps_on,barmerge.lookahead_on)
ema200Plot = showEma200 ? higherTimeFrame : na
plot(ema200Plot, title="EMA200", offset=offset200)
//Linreq
group1 = "Linreg Settings"
lengthInput = input.int(100, title="Length", minval = 1, maxval = 5000,group = group1)
sourceInput = input.source(close, title="Source")
useUpperDevInput = input.bool(true, title="Upper Deviation", inline = "Upper Deviation", group = group1)
upperMultInput = input.float(2.0, title="", inline = "Upper Deviation", group = group1)
useLowerDevInput = input.bool(true, title="Lower Deviation", inline = "Lower Deviation", group = group1)
lowerMultInput = input.float(2.0, title="", inline = "Lower Deviation", group = group1)
group2 = "Linreg Display Settings"
showPearsonInput = input.bool(true, "Show Pearson's R", group = group2)
extendLeftInput = input.bool(false, "Extend Lines Left", group = group2)
extendRightInput = input.bool(true, "Extend Lines Right", group = group2)
extendStyle = switch
extendLeftInput and extendRightInput => extend.both
extendLeftInput => extend.left
extendRightInput => extend.right
=> extend.none
group3 = "Linreg Color Settings"
colorUpper = input.color(color.new(color.blue, 85), "Linreg Renk", inline = group3, group = group3)
colorLower = input.color(color.new(color.red, 85), "", inline = group3, group = group3)
calcSlope(source, length) =>
max_bars_back(source, 5000)
if not barstate.islast or length <= 1
else
sumX = 0.0
sumY = 0.0
sumXSqr = 0.0
sumXY = 0.0
for i = 0 to length - 1 by 1
val = source
per = i + 1.0
sumX += per
sumY += val
sumXSqr += per * per
sumXY += val * per
slope = (length * sumXY - sumX * sumY) / (length * sumXSqr - sumX * sumX)
average = sumY / length
intercept = average - slope * sumX / length + slope
= calcSlope(sourceInput, lengthInput)
startPrice = i + s * (lengthInput - 1)
endPrice = i
var line baseLine = na
if na(baseLine) and not na(startPrice) and showLinreg
baseLine := line.new(bar_index - lengthInput + 1, startPrice, bar_index, endPrice, width=1, extend=extendStyle, color=color.new(colorLower, 0))
else
line.set_xy1(baseLine, bar_index - lengthInput + 1, startPrice)
line.set_xy2(baseLine, bar_index, endPrice)
na
calcDev(source, length, slope, average, intercept) =>
upDev = 0.0
dnDev = 0.0
stdDevAcc = 0.0
dsxx = 0.0
dsyy = 0.0
dsxy = 0.0
periods = length - 1
daY = intercept + slope * periods / 2
val = intercept
for j = 0 to periods by 1
price = high - val
if price > upDev
upDev := price
price := val - low
if price > dnDev
dnDev := price
price := source
dxt = price - average
dyt = val - daY
price -= val
stdDevAcc += price * price
dsxx += dxt * dxt
dsyy += dyt * dyt
dsxy += dxt * dyt
val += slope
stdDev = math.sqrt(stdDevAcc / (periods == 0 ? 1 : periods))
pearsonR = dsxx == 0 or dsyy == 0 ? 0 : dsxy / math.sqrt(dsxx * dsyy)
= calcDev(sourceInput, lengthInput, s, a, i)
upperStartPrice = startPrice + (useUpperDevInput ? upperMultInput * stdDev : upDev)
upperEndPrice = endPrice + (useUpperDevInput ? upperMultInput * stdDev : upDev)
var line upper = na
lowerStartPrice = startPrice + (useLowerDevInput ? -lowerMultInput * stdDev : -dnDev)
lowerEndPrice = endPrice + (useLowerDevInput ? -lowerMultInput * stdDev : -dnDev)
var line lower = na
if na(upper) and not na(upperStartPrice) and showLinreg
upper := line.new(bar_index - lengthInput + 1, upperStartPrice, bar_index, upperEndPrice, width=1, extend=extendStyle, color=color.new(colorUpper, 0))
else
line.set_xy1(upper, bar_index - lengthInput + 1, upperStartPrice)
line.set_xy2(upper, bar_index, upperEndPrice)
na
if na(lower) and not na(lowerStartPrice) and showLinreg
lower := line.new(bar_index - lengthInput + 1, lowerStartPrice, bar_index, lowerEndPrice, width=1, extend=extendStyle, color=color.new(colorUpper, 0))
else
line.set_xy1(lower, bar_index - lengthInput + 1, lowerStartPrice)
line.set_xy2(lower, bar_index, lowerEndPrice)
na
showLinregPlotUpper = showLinreg ? upper : na
showLinregPlotLower = showLinreg ? lower : na
showLinregPlotBaseLine = showLinreg ? baseLine : na
linefill.new(showLinregPlotUpper, showLinregPlotBaseLine, color = colorUpper)
linefill.new(showLinregPlotBaseLine, showLinregPlotLower, color = colorLower)
// Pearson's R
var label r = na
label.delete(r )
if showPearsonInput and not na(pearsonR) and showLinreg
r := label.new(bar_index - lengthInput + 1, lowerStartPrice, str.tostring(pearsonR, "#.################"), color = color.new(color.white, 100), textcolor=color.new(colorUpper, 0), size=size.normal, style=label.style_label_up)
//Mavilim
group4 = "Mavilim Settings"
mavilimold = input(false, title="Show Previous Version of MavilimW?",group=group4)
fmal=input(3,"First Moving Average length",group = group4)
smal=input(5,"Second Moving Average length",group = group4)
tmal=fmal+smal
Fmal=smal+tmal
Ftmal=tmal+Fmal
Smal=Fmal+Ftmal
M1= ta.wma(close, fmal)
M2= ta.wma(M1, smal)
M3= ta.wma(M2, tmal)
M4= ta.wma(M3, Fmal)
M5= ta.wma(M4, Ftmal)
MAVW= ta.wma(M5, Smal)
col1= MAVW>MAVW
col3= MAVWpmaxsrc ? pmaxsrc-pmaxsrc : 0
vdd1=pmaxsrc
ma = 0.0
if mav == "SMA"
ma := ta.sma(pmaxsrc, length)
ma
if mav == "EMA"
ma := ta.ema(pmaxsrc, length)
ma
if mav == "WMA"
ma := ta.wma(pmaxsrc, length)
ma
if mav == "TMA"
ma := ta.sma(ta.sma(pmaxsrc, math.ceil(length / 2)), math.floor(length / 2) + 1)
ma
if mav == "VAR"
ma := VAR
ma
if mav == "WWMA"
ma := WWMA
ma
if mav == "ZLEMA"
ma := ZLEMA
ma
if mav == "TSF"
ma := TSF
ma
ma
MAvg=getMA(pmaxsrc, length)
longStop = Normalize ? MAvg - Multiplier*atr/close : MAvg - Multiplier*atr
longStopPrev = nz(longStop , longStop)
longStop := MAvg > longStopPrev ? math.max(longStop, longStopPrev) : longStop
shortStop = Normalize ? MAvg + Multiplier*atr/close : MAvg + Multiplier*atr
shortStopPrev = nz(shortStop , shortStop)
shortStop := MAvg < shortStopPrev ? math.min(shortStop, shortStopPrev) : shortStop
dir = 1
dir := nz(dir , dir)
dir := dir == -1 and MAvg > shortStopPrev ? 1 : dir == 1 and MAvg < longStopPrev ? -1 : dir
PMax = dir==1 ? longStop: shortStop
plot(showsupport ? MAvg : na, color=#fbff04, linewidth=2, title="EMA9")
pALL=plot(PMax, color=color.new(color.red, transp = 0), linewidth=2, title="PMax")
alertcondition(ta.cross(MAvg, PMax), title="Cross Alert", message="PMax - Moving Avg Crossing!")
alertcondition(ta.crossover(MAvg, PMax), title="Crossover Alarm", message="Moving Avg BUY SIGNAL!")
alertcondition(ta.crossunder(MAvg, PMax), title="Crossunder Alarm", message="Moving Avg SELL SIGNAL!")
alertcondition(ta.cross(pmaxsrc, PMax), title="Price Cross Alert", message="PMax - Price Crossing!")
alertcondition(ta.crossover(pmaxsrc, PMax), title="Price Crossover Alarm", message="PRICE OVER PMax - BUY SIGNAL!")
alertcondition(ta.crossunder(pmaxsrc, PMax), title="Price Crossunder Alarm", message="PRICE UNDER PMax - SELL SIGNAL!")
buySignalk = ta.crossover(MAvg, PMax)
plotshape(buySignalk and showsignalsk ? PMax*0.995 : na, title="Buy", text="Buy", location=location.absolute, style=shape.labelup, size=size.tiny, color=color.new(color.green, transp = 0), textcolor=color.white)
sellSignallk = ta.crossunder(MAvg, PMax)
plotshape(sellSignallk and showsignalsk ? PMax*1.005 : na, title="Sell", text="Sell", location=location.absolute, style=shape.labeldown, size=size.tiny, color=color.new(color.red, transp = 0), textcolor=color.white)
// buySignalc = ta.crossover(pmaxsrc, PMax)
// plotshape(buySignalc and showsignalsc ? PMax*0.995 : na, title="Buy", text="Buy", location=location.absolute, style=shape.labelup, size=size.tiny, color=#0F18BF, textcolor=color.white)
// sellSignallc = ta.crossunder(pmaxsrc, PMax)
// plotshape(sellSignallc and showsignalsc ? PMax*1.005 : na, title="Sell", text="Sell", location=location.absolute, style=shape.labeldown, size=size.tiny, color=#0F18BF, textcolor=color.white)
// mPlot = plot(ohlc4, title="", style=plot.style_circles, linewidth=0,display=display.none)
longFillColor = highlighting ? (MAvg>PMax ? color.new(color.green, transp = 90) : na) : na
shortFillColor = highlighting ? (MAvg math.exp(-(math.pow(x, 2)/(h * h * 2)))
//-----------------------------------------------------------------------------}
//Append lines
//-----------------------------------------------------------------------------{
n = bar_index
var ln = array.new_line(0)
if barstate.isfirst and repaint
for i = 0 to 499
array.push(ln,line.new(na,na,na,na))
//-----------------------------------------------------------------------------}
//End point method
//-----------------------------------------------------------------------------{
var coefs = array.new_float(0)
var den = 0.
if barstate.isfirst and not repaint
for i = 0 to 499
w = gauss(i, h)
coefs.push(w)
den := coefs.sum()
out = 0.
if not repaint
for i = 0 to 499
out += src * coefs.get(i)
out /= den
mae = ta.sma(math.abs(src - out), 499) * mult
upperN = out + mae
lowerN = out - mae
//-----------------------------------------------------------------------------}
//Compute and display NWE
//-----------------------------------------------------------------------------{
float y2 = na
float y1 = na
nwe = array.new(0)
if barstate.islast and repaint
sae = 0.
//Compute and set NWE point
for i = 0 to math.min(499,n - 1)
sum = 0.
sumw = 0.
//Compute weighted mean
for j = 0 to math.min(499,n - 1)
w = gauss(i - j, h)
sum += src * w
sumw += w
y2 := sum / sumw
sae += math.abs(src - y2)
nwe.push(y2)
sae := sae / math.min(499,n - 1) * mult
for i = 0 to math.min(499,n - 1)
if i%2 and showNadaray
line.new(n-i+1, y1 + sae, n-i, nwe.get(i) + sae, color = upCss)
line.new(n-i+1, y1 - sae, n-i, nwe.get(i) - sae, color = dnCss)
if src > nwe.get(i) + sae and src < nwe.get(i) + sae and showNadaray
label.new(n-i, src , '▼', color = color(na), style = label.style_label_down, textcolor = dnCss, textalign = text.align_center)
if src < nwe.get(i) - sae and src > nwe.get(i) - sae and showNadaray
label.new(n-i, src , '▲', color = color(na), style = label.style_label_up, textcolor = upCss, textalign = text.align_center)
y1 := nwe.get(i)
//-----------------------------------------------------------------------------}
//Dashboard
//-----------------------------------------------------------------------------{
var tb = table.new(position.top_right, 1, 1
, bgcolor = #1e222d
, border_color = #373a46
, border_width = 1
, frame_color = #373a46
, frame_width = 1)
if repaint
tb.cell(0, 0, 'Repainting Mode Enabled', text_color = color.white, text_size = size.small)
//-----------------------------------------------------------------------------}
//Plot
//-----------------------------------------------------------------------------}
// plot(repaint ? na : out + mae, 'Upper', upCss)
// plot(repaint ? na : out - mae, 'Lower', dnCss)
//Crossing Arrows
// plotshape(ta.crossunder(close, out - mae) ? low : na, "Crossunder", shape.labelup, location.absolute, color(na), 0 , text = '▲', textcolor = upCss, size = size.tiny)
// plotshape(ta.crossover(close, out + mae) ? high : na, "Crossover", shape.labeldown, location.absolute, color(na), 0 , text = '▼', textcolor = dnCss, size = size.tiny)
//-----------------------------------------------------------------------------}
//////////////////////////////////////////////////////////////////////////////////
enableD = input (true, "DIVERGANCE ON/OFF" , group="INDICATORS ON/OFF")
//DIVERGANCE
prd1 = input.int (defval=5 , title='PIVOT PERIOD' , minval=1, maxval=50 , group="DIVERGANCE")
source = input.string(defval='HIGH/LOW' , title='SOURCE FOR PIVOT POINTS' , options= , group="DIVERGANCE")
searchdiv = input.string(defval='REGULAR/HIDDEN', title='DIVERGANCE TYPE' , options= , group="DIVERGANCE")
showindis = input.string(defval='FULL' , title='SHOW INDICATORS NAME' , options= , group="DIVERGANCE")
showlimit = input.int(1 , title='MINIMUM NUMBER OF DIVERGANCES', minval=1, maxval=11 , group="DIVERGANCE")
maxpp = input.int (defval=20 , title='MAXIMUM PIVOT POINTS TO CHECK', minval=1, maxval=20 , group="DIVERGANCE")
maxbars = input.int (defval=200 , title='MAXIMUM BARS TO CHECK' , minval=30, maxval=200 , group="DIVERGANCE")
showlast = input (defval=false , title='SHOW ONLY LAST DIVERGANCE' , group="DIVERGANCE")
dontconfirm = input (defval=false , title="DON'T WAIT FOR CONFORMATION" , group="DIVERGANCE")
showlines = input (defval=false , title='SHOW DIVERGANCE LINES' , group="DIVERGANCE")
showpivot = input (defval=false , title='SHOW PIVOT POINTS' , group="DIVERGANCE")
calcmacd = input (defval=true , title='MACD' , group="DIVERGANCE")
calcmacda = input (defval=true , title='MACD HISTOGRAM' , group="DIVERGANCE")
calcrsi = input (defval=true , title='RSI' , group="DIVERGANCE")
calcstoc = input (defval=true , title='STOCHASTIC' , group="DIVERGANCE")
calccci = input (defval=true , title='CCI' , group="DIVERGANCE")
calcmom = input (defval=true , title='MOMENTUM' , group="DIVERGANCE")
calcobv = input (defval=true , title='OBV' , group="DIVERGANCE")
calcvwmacd = input (true , title='VWMACD' , group="DIVERGANCE")
calccmf = input (true , title='CHAIKIN MONEY FLOW' , group="DIVERGANCE")
calcmfi = input (true , title='MONEY FLOW INDEX' , group="DIVERGANCE")
calcext = input (false , title='CHECK EXTERNAL INDICATOR' , group="DIVERGANCE")
externalindi = input (defval=close , title='EXTERNAL INDICATOR' , group="DIVERGANCE")
pos_reg_div_col = input (defval=#ffffff , title='POSITIVE REGULAR DIVERGANCE' , group="DIVERGANCE")
neg_reg_div_col = input (defval=#00def6 , title='NEGATIVE REGULAR DIVERGANCE' , group="DIVERGANCE")
pos_hid_div_col = input (defval=#00ff0a , title='POSITIVE HIDDEN DIVERGANCE' , group="DIVERGANCE")
neg_hid_div_col = input (defval=#ff0015 , title='NEGATIVE HIDDEN DIVERGANCE' , group="DIVERGANCE")
reg_div_l_style_ = input.string(defval='SOLID' , title='REGULAR DIVERGANCE LINESTYLE' , options= , group="DIVERGANCE")
hid_div_l_style_ = input.string(defval='SOLID' , title='HIDDEN DIVERGANCE LINESTYLE' , options= , group="DIVERGANCE")
reg_div_l_width = input.int (defval=2 , title='REGULAR DIVERGANCE LINEWIDTH' , minval=1, maxval=5 , group="DIVERGANCE")
hid_div_l_width = input.int (defval=2 , title='HIDDEN DIVERGANCE LINEWIDTH' , minval=1, maxval=5 , group="DIVERGANCE")
showmas = input.bool (defval=false , title='SHOW MOVING AVERAGES (50 & 200)', inline='MA' , group="DIVERGANCE")
cma1col = input.color (defval=#ffffff , title='' , inline='MA' , group="DIVERGANCE")
cma2col = input.color (defval=#00def6 , title='' , inline='MA' , group="DIVERGANCE")
//PLOTS
plot(showmas ? ta.sma(close, 50) : na, color=showmas ? cma1col : na)
plot(showmas ? ta.sma(close, 200) : na, color=showmas ? cma2col : na)
var reg_div_l_style = reg_div_l_style_ == 'SOLID' ? line.style_solid : reg_div_l_style_ == 'DASHED' ? line.style_dashed : line.style_dotted
var hid_div_l_style = hid_div_l_style_ == 'SOLID' ? line.style_solid : hid_div_l_style_ == 'DASHED' ? line.style_dashed : line.style_dotted
rsi = ta.rsi(close, 14)
= ta.macd(close, 12, 26, 9)
moment = ta.mom(close, 10)
cci = ta.cci(close, 10)
Obv = ta.obv
stk = ta.sma(ta.stoch(close, high, low, 14), 3)
maFast = ta.vwma(close, 12)
maSlow = ta.vwma(close, 26)
vwmacd = maFast - maSlow
Cmfm = (close - low - (high - close)) / (high - low)
Cmfv = Cmfm * volume
cmf = ta.sma(Cmfv, 21) / ta.sma(volume, 21)
Mfi = ta.mfi(close, 14)
var indicators_name = array.new_string(11)
var div_colors = array.new_color(4)
if barstate.isfirst and enableD
array.set(indicators_name, 0, showindis == "DON'T SHOW" ? '' : '')
array.set(indicators_name, 1, showindis == "DON'T SHOW" ? '' : '')
array.set(indicators_name, 2, showindis == "DON'T SHOW" ? '' : '')
array.set(indicators_name, 3, showindis == "DON'T SHOW" ? '' : '')
array.set(indicators_name, 4, showindis == "DON'T SHOW" ? '' : '')
array.set(indicators_name, 5, showindis == "DON'T SHOW" ? '' : '')
array.set(indicators_name, 6, showindis == "DON'T SHOW" ? '' : '')
array.set(indicators_name, 7, showindis == "DON'T SHOW" ? '' : '')
array.set(indicators_name, 8, showindis == "DON'T SHOW" ? '' : '')
array.set(indicators_name, 9, showindis == "DON'T SHOW" ? '' : '')
array.set(indicators_name, 10, showindis == "DON'T SHOW" ? '' : '')
array.set(div_colors, 0, pos_reg_div_col)
array.set(div_colors, 1, neg_reg_div_col)
array.set(div_colors, 2, pos_hid_div_col)
array.set(div_colors, 3, neg_hid_div_col)
float ph1 = ta.pivothigh(source == 'CLOSE' ? close : high, prd1, prd1)
float pl1 = ta.pivotlow(source == 'CLOSE' ? close : low, prd1, prd1)
plotshape(ph1 and showpivot, text='H', style=shape.labeldown, color=color.new(color.white, 100), textcolor=#00def6, location=location.abovebar, offset=-prd1)
plotshape(pl1 and showpivot, text='L', style=shape.labelup, color=color.new(color.white, 100), textcolor=#ffffff, location=location.belowbar, offset=-prd1)
var int maxarraysize = 20
var ph_positions = array.new_int(maxarraysize, 0)
var pl_positions = array.new_int(maxarraysize, 0)
var ph_vals = array.new_float(maxarraysize, 0.)
var pl_vals = array.new_float(maxarraysize, 0.)
if ph1
array.unshift(ph_positions, bar_index)
array.unshift(ph_vals, ph1)
if array.size(ph_positions) > maxarraysize
array.pop(ph_positions)
array.pop(ph_vals)
if pl1
array.unshift(pl_positions, bar_index)
array.unshift(pl_vals, pl1)
if array.size(pl_positions) > maxarraysize
array.pop(pl_positions)
array.pop(pl_vals)
positive_regular_positive_hidden_divergence(src, cond) =>
divlen = 0
prsc = source == 'CLOSE' ? close : low
if dontconfirm or src > src or close > close
startpoint = dontconfirm ? 0 : 1
for x = 0 to maxpp - 1 by 1
len = bar_index - array.get(pl_positions, x) + prd1
if array.get(pl_positions, x) == 0 or len > maxbars
break
if len > 5 and (cond == 1 and src > src and prsc < nz(array.get(pl_vals, x)) or cond == 2 and src < src and prsc > nz(array.get(pl_vals, x)))
slope1 = (src - src ) / (len - startpoint)
virtual_line1 = src - slope1
slope2 = (close - close ) / (len - startpoint)
virtual_line2 = close - slope2
arrived = true
for y = 1 + startpoint to len - 1 by 1
if src < virtual_line1 or nz(close ) < virtual_line2
arrived := false
break
virtual_line1 -= slope1
virtual_line2 -= slope2
virtual_line2
if arrived
divlen := len
break
divlen
negative_regular_negative_hidden_divergence(src, cond) =>
divlen = 0
prsc = source == 'CLOSE' ? close : high
if dontconfirm or src < src or close < close
startpoint = dontconfirm ? 0 : 1
for x = 0 to maxpp - 1 by 1
len = bar_index - array.get(ph_positions, x) + prd1
if array.get(ph_positions, x) == 0 or len > maxbars
break
if len > 5 and (cond == 1 and src < src and prsc > nz(array.get(ph_vals, x)) or cond == 2 and src > src and prsc < nz(array.get(ph_vals, x)))
slope1 = (src - src ) / (len - startpoint)
virtual_line1 = src - slope1
slope2 = (close - nz(close )) / (len - startpoint)
virtual_line2 = close - slope2
arrived = true
for y = 1 + startpoint to len - 1 by 1
if src > virtual_line1 or nz(close ) > virtual_line2
arrived := false
break
virtual_line1 -= slope1
virtual_line2 -= slope2
virtual_line2
if arrived
divlen := len
break
divlen
//CALCULATIONS
calculate_divs(cond, indicator_1) =>
divs = array.new_int(4, 0)
array.set(divs, 0, cond and (searchdiv == 'REGULAR' or searchdiv == 'REGULAR/HIDDEN') ? positive_regular_positive_hidden_divergence(indicator_1, 1) : 0)
array.set(divs, 1, cond and (searchdiv == 'REGULAR' or searchdiv == 'REGULAR/HIDDEN') ? negative_regular_negative_hidden_divergence(indicator_1, 1) : 0)
array.set(divs, 2, cond and (searchdiv == 'HIDDEN' or searchdiv == 'REGULAR/HIDDEN') ? positive_regular_positive_hidden_divergence(indicator_1, 2) : 0)
array.set(divs, 3, cond and (searchdiv == 'HIDDEN' or searchdiv == 'REGULAR/HIDDEN') ? negative_regular_negative_hidden_divergence(indicator_1, 2) : 0)
divs
var all_divergences = array.new_int(44)
array_set_divs(div_pointer, index) =>
for x = 0 to 3 by 1
array.set(all_divergences, index * 4 + x, array.get(div_pointer, x))
array_set_divs(calculate_divs(calcmacd , macd) , 0)
array_set_divs(calculate_divs(calcmacda , deltamacd) , 1)
array_set_divs(calculate_divs(calcrsi , rsi) , 2)
array_set_divs(calculate_divs(calcstoc , stk) , 3)
array_set_divs(calculate_divs(calccci , cci) , 4)
array_set_divs(calculate_divs(calcmom , moment) , 5)
array_set_divs(calculate_divs(calcobv , Obv) , 6)
array_set_divs(calculate_divs(calcvwmacd, vwmacd) , 7)
array_set_divs(calculate_divs(calccmf , cmf) , 8)
array_set_divs(calculate_divs(calcmfi , Mfi) , 9)
array_set_divs(calculate_divs(calcext , externalindi), 10)
total_div = 0
for x = 0 to array.size(all_divergences) - 1 by 1
total_div += math.round(math.sign(array.get(all_divergences, x)))
total_div
if total_div < showlimit
array.fill(all_divergences, 0)
var pos_div_lines = array.new_line(0)
var neg_div_lines = array.new_line(0)
var pos_div_labels = array.new_label(0)
var neg_div_labels = array.new_label(0)
delete_old_pos_div_lines() =>
if array.size(pos_div_lines) > 0
for j = 0 to array.size(pos_div_lines) - 1 by 1
line.delete(array.get(pos_div_lines, j))
array.clear(pos_div_lines)
delete_old_neg_div_lines() =>
if array.size(neg_div_lines) > 0
for j = 0 to array.size(neg_div_lines) - 1 by 1
line.delete(array.get(neg_div_lines, j))
array.clear(neg_div_lines)
delete_old_pos_div_labels() =>
if array.size(pos_div_labels) > 0
for j = 0 to array.size(pos_div_labels) - 1 by 1
label.delete(array.get(pos_div_labels, j))
array.clear(pos_div_labels)
delete_old_neg_div_labels() =>
if array.size(neg_div_labels) > 0
for j = 0 to array.size(neg_div_labels) - 1 by 1
label.delete(array.get(neg_div_labels, j))
array.clear(neg_div_labels)
delete_last_pos_div_lines_label(n) =>
if n > 0 and array.size(pos_div_lines) >= n
asz = array.size(pos_div_lines)
for j = 1 to n by 1
line.delete(array.get(pos_div_lines, asz - j))
array.pop(pos_div_lines)
if array.size(pos_div_labels) > 0
label.delete(array.get(pos_div_labels, array.size(pos_div_labels) - 1))
array.pop(pos_div_labels)
delete_last_neg_div_lines_label(n) =>
if n > 0 and array.size(neg_div_lines) >= n
asz = array.size(neg_div_lines)
for j = 1 to n by 1
line.delete(array.get(neg_div_lines, asz - j))
array.pop(neg_div_lines)
if array.size(neg_div_labels) > 0
label.delete(array.get(neg_div_labels, array.size(neg_div_labels) - 1))
array.pop(neg_div_labels)
pos_reg_div_detected = false
neg_reg_div_detected = false
pos_hid_div_detected = false
neg_hid_div_detected = false
var last_pos_div_lines = 0
var last_neg_div_lines = 0
var remove_last_pos_divs = false
var remove_last_neg_divs = false
if pl1
remove_last_pos_divs := false
last_pos_div_lines := 0
last_pos_div_lines
if ph1
remove_last_neg_divs := false
last_neg_div_lines := 0
last_neg_div_lines
divergence_text_top = ''
divergence_text_bottom = ''
distances = array.new_int(0)
dnumdiv_top = 0
dnumdiv_bottom = 0
top_label_col = color.white
bottom_label_col = color.white
old_pos_divs_can_be_removed = true
old_neg_divs_can_be_removed = true
startpoint = dontconfirm ? 0 : 1
for x = 0 to 10 by 1
div_type = -1
for y = 0 to 3 by 1
if array.get(all_divergences, x * 4 + y) > 0
div_type := y
if y % 2 == 1
dnumdiv_top += 1
top_label_col := array.get(div_colors, y)
top_label_col
if y % 2 == 0
dnumdiv_bottom += 1
bottom_label_col := array.get(div_colors, y)
bottom_label_col
if not array.includes(distances, array.get(all_divergences, x * 4 + y))
array.push(distances, array.get(all_divergences, x * 4 + y))
new_line = showlines ? line.new(x1=bar_index - array.get(all_divergences, x * 4 + y), y1=source == 'CLOSE' ? close : y % 2 == 0 ? low : high , x2=bar_index - startpoint, y2=source == 'CLOSE' ? close : y % 2 == 0 ? low : high , color=array.get(div_colors, y), style=y < 2 ? reg_div_l_style : hid_div_l_style, width=y < 2 ? reg_div_l_width : hid_div_l_width) : na
if y % 2 == 0
if old_pos_divs_can_be_removed
old_pos_divs_can_be_removed := false
if not showlast and remove_last_pos_divs
delete_last_pos_div_lines_label(last_pos_div_lines)
last_pos_div_lines := 0
last_pos_div_lines
if showlast
delete_old_pos_div_lines()
array.push(pos_div_lines, new_line)
last_pos_div_lines += 1
remove_last_pos_divs := true
remove_last_pos_divs
if y % 2 == 1
if old_neg_divs_can_be_removed
old_neg_divs_can_be_removed := false
if not showlast and remove_last_neg_divs
delete_last_neg_div_lines_label(last_neg_div_lines)
last_neg_div_lines := 0
last_neg_div_lines
if showlast
delete_old_neg_div_lines()
array.push(neg_div_lines, new_line)
last_neg_div_lines += 1
remove_last_neg_divs := true
remove_last_neg_divs
if y == 0
pos_reg_div_detected := true
pos_reg_div_detected
if y == 1
neg_reg_div_detected := true
neg_reg_div_detected
if y == 2
pos_hid_div_detected := true
pos_hid_div_detected
if y == 3
neg_hid_div_detected := true
neg_hid_div_detected
if div_type >= 0
divergence_text_top += (div_type % 2 == 1 ? showindis != "DON'T SHOW" ? array.get(indicators_name, x) + '\n' : '' : '')
divergence_text_bottom += (div_type % 2 == 0 ? showindis != "DON'T SHOW" ? array.get(indicators_name, x) + '\n' : '' : '')
divergence_text_bottom
if showindis != "DON'T SHOW"
if dnumdiv_top > 0
divergence_text_top += str.tostring(dnumdiv_top)
divergence_text_top
if dnumdiv_bottom > 0
divergence_text_bottom += str.tostring(dnumdiv_bottom)
divergence_text_bottom
if divergence_text_top != ''
if showlast
delete_old_neg_div_labels()
array.push(neg_div_labels, label.new(x=bar_index, y=math.max(high, high ), color=top_label_col, style=label.style_diamond, size = size.auto))
if divergence_text_bottom != ''
if showlast
delete_old_pos_div_labels()
array.push(pos_div_labels, label.new(x=bar_index, y=math.min(low, low ), color=bottom_label_col, style=label.style_diamond, size = size.auto))
// POSITION AND SIZE
PosTable = input.string(defval="Bottom Right", title="Position", options= , group="Table Location & Size", inline="1")
SizTable = input.string(defval="Auto", title="Size", options= , group="Table Location & Size", inline="1")
Pos1Table = PosTable == "Top Right" ? position.top_right : PosTable == "Middle Right" ? position.middle_right : PosTable == "Bottom Right" ? position.bottom_right : PosTable == "Top Center" ? position.top_center : PosTable == "Middle Center" ? position.middle_center : PosTable == "Bottom Center" ? position.bottom_center : PosTable == "Top Left" ? position.top_left : PosTable == "Middle Left" ? position.middle_left : position.bottom_left
Siz1Table = SizTable == "Auto" ? size.auto : SizTable == "Huge" ? size.huge : SizTable == "Large" ? size.large : SizTable == "Normal" ? size.normal : SizTable == "Small" ? size.small : size.tiny
tbl = table.new(Pos1Table, 21, 16, border_width = 1, border_color = color.gray, frame_color = color.gray, frame_width = 1)
// Kullanıcı tarafından belirlenecek yeşil ve kırmızı zaman dilimi sayısı
greenThreshold = input.int(5, minval=1, maxval=10, title="Yeşil Zaman Dilimi Sayısı", group="Alarm Ayarları")
redThreshold = input.int(5, minval=1, maxval=10, title="Kırmızı Zaman Dilimi Sayısı", group="Alarm Ayarları")
// TIMEFRAMES OPTIONS
box01 = input.bool(true, "TF ", inline = "01", group="Select Timeframe")
tf01 = input.timeframe("1", "", inline = "01", group="Select Timeframe")
box02 = input.bool(false, "TF ", inline = "02", group="Select Timeframe")
tf02 = input.timeframe("3", "", inline = "02", group="Select Timeframe")
box03 = input.bool(true, "TF ", inline = "03", group="Select Timeframe")
tf03 = input.timeframe("5", "", inline = "03", group="Select Timeframe")
box04 = input.bool(true, "TF ", inline = "04", group="Select Timeframe")
tf04 = input.timeframe("15", "", inline = "04", group="Select Timeframe")
box05 = input.bool(false, "TF ", inline = "05", group="Select Timeframe")
tf05 = input.timeframe("30", "", inline = "05", group="Select Timeframe")
box06 = input.bool(true, "TF ", inline = "01", group="Select Timeframe")
tf06 = input.timeframe("60", "", inline = "01", group="Select Timeframe")
box07 = input.bool(false, "TF ", inline = "02", group="Select Timeframe")
tf07 = input.timeframe("120", "", inline = "02", group="Select Timeframe")
box08 = input.bool(false, "TF ", inline = "03", group="Select Timeframe")
tf08 = input.timeframe("180", "", inline = "03", group="Select Timeframe")
box09 = input.bool(true, "TF ", inline = "04", group="Select Timeframe")
tf09 = input.timeframe("240", "", inline = "04", group="Select Timeframe")
box10 = input.bool(false, "TF ", inline = "05", group="Select Timeframe")
tf10 = input.timeframe("D", "", inline = "05", group="Select Timeframe")
// indicator('Tillson FEMA', overlay=true)
length1 = input(1, 'FEMA Length')
a1 = input(0.7, 'Volume Factor')
e1 = ta.ema((high + low + 2 * close) / 4, length1)
e2 = ta.ema(e1, length1)
e3 = ta.ema(e2, length1)
e4 = ta.ema(e3, length1)
e5 = ta.ema(e4, length1)
e6 = ta.ema(e5, length1)
c1 = -a1 * a1 * a1
c2 = 3 * a1 * a1 + 3 * a1 * a1 * a1
c3 = -6 * a1 * a1 - 3 * a1 - 3 * a1 * a1 * a1
c4 = 1 + 3 * a1 + a1 * a1 * a1 + 3 * a1 * a1
FEMA = c1 * e6 + c2 * e5 + c3 * e4 + c4 * e3
tablocol1 = FEMA > FEMA
tablocol3 = FEMA < FEMA
color_1 = col1 ? color.rgb(149, 219, 35): col3 ? color.rgb(238, 11, 11) : color.yellow
plot(FEMA, color=color_1, linewidth=3, title='FEMA')
tilson1 = FEMA
tilson1a =FEMA
// DEFINITION OF VALUES
symbol = ticker.modify(syminfo.tickerid, syminfo.session)
tfArr = array.new(na)
tilson1Arr = array.new(na)
tilson1aArr = array.new(na)
// DEFINITIONS OF RSI & CCI FUNCTIONS APPENDED IN THE TIMEFRAME OPTIONS
cciNcciFun(tf, flg) =>
= request.security(symbol, tf, )
if flg and (barstate.isrealtime ? true : timeframe.in_seconds(timeframe.period) <= timeframe.in_seconds(tf))
array.push(tfArr, na(tf) ? timeframe.period : tf)
array.push(tilson1Arr, tilson_)
array.push(tilson1aArr, tilson1a_)
cciNcciFun(tf01, box01), cciNcciFun(tf02, box02), cciNcciFun(tf03, box03), cciNcciFun(tf04, box04),
cciNcciFun(tf05, box05), cciNcciFun(tf06, box06), cciNcciFun(tf07, box07), cciNcciFun(tf08, box08),
cciNcciFun(tf09, box09), cciNcciFun(tf10, box10)
// TABLE AND CELLS CONFIG
// Post Timeframe in format
tfTxt(x)=>
out = x
if not str.contains(x, "S") and not str.contains(x, "M") and
not str.contains(x, "W") and not str.contains(x, "D")
if str.tonumber(x)%60 == 0
out := str.tostring(str.tonumber(x)/60)+"H"
else
out := x + "m"
out
if barstate.islast
table.clear(tbl, 0, 0, 20, 15)
// TITLES
table.cell(tbl, 0, 0, "⏱", text_color=color.white, text_size=Siz1Table, bgcolor=#000000)
table.cell(tbl, 1, 0, "FEMA("+str.tostring(length1)+")", text_color=#FFFFFF, text_size=Siz1Table, bgcolor=#000000)
j = 1
greenCounter = 0 // Yeşil zaman dilimlerini saymak için bir sayaç
redCounter = 0
if array.size(tilson1Arr) > 0
for i = 0 to array.size(tilson1Arr) - 1
if not na(array.get(tilson1Arr, i))
//config values in the cells
TF_VALUE = array.get(tfArr,i)
tilson1VALUE = array.get(tilson1Arr, i)
tilson1aVALUE = array.get(tilson1aArr, i)
SIGNAL1 = tilson1VALUE >= tilson1aVALUE ? "▲" : tilson1VALUE <= tilson1aVALUE ? "▼" : na
// Yeşil oklar ve arka planı ayarla
greenArrowColor1 = SIGNAL1 == "▲" ? color.rgb(0, 255, 0) : color.rgb(255, 0, 0)
greenBgColor1 = SIGNAL1 == "▲" ? color.rgb(25, 70, 22) : color.rgb(93, 22, 22)
allGreen = tilson1VALUE >= tilson1aVALUE
allRed = tilson1VALUE <= tilson1aVALUE
// Determine background color for time text
timeBgColor = allGreen ? #194616 : (allRed ? #5D1616 : #000000)
txtColor = allGreen ? #00FF00 : (allRed ? #FF4500 : color.white)
if allGreen
greenCounter := greenCounter + 1
redCounter := 0
else if allRed
redCounter := redCounter + 1
greenCounter := 0
else
redCounter := 0
greenCounter := 0
// Dinamik pair değerini oluşturma
pair = "USDT_" + syminfo.basecurrency + "USDT"
// Bot ID için kullanıcı girişi
bot_id = input.int(12387976, title="Bot ID", minval=0,group ='3Comas Message', inline = '1') // Varsayılan değeri 12387976 olan bir tamsayı girişi alır
// E-posta tokenı için kullanıcı girişi
email_token = input("cd4111d4-549a-4759-a082-e8f45c91fa47", title="Email Token",group ='3Comas Message', inline = '1')
// USER INPUT FOR DELAY
delay_seconds = input.int(0, title="Delay Seconds", minval=0, maxval=86400,group ='3Comas Message', inline = '1')
// Dinamik mesajın oluşturulması
message = '{ "message_type": "bot", "bot_id": ' + str.tostring(bot_id) + ', "email_token": "' + email_token + '", "delay_seconds": ' + str.tostring(delay_seconds) + ', "pair": "' + pair + '"}'
// Kullanıcının belirlediği yeşil veya kırmızı zaman dilimi sayısına ulaşıldığında alarmı tetikle
if greenCounter >= greenThreshold
alert(message, alert.freq_once_per_bar_close)
// if redCounter >= redThreshold
// alert(message, alert.freq_once_per_bar_close)
// Kullanıcının belirlediği yeşil veya kırmızı zaman dilimi sayısına ulaşıldığında alarmı tetikle
// if greenCounter >= greenThreshold
// alert("Yeşil zaman dilimi sayısı " + str.tostring(greenThreshold) + " adede ulaştı", alert.freq_once_per_bar_close)
// if redCounter >= redThreshold
// alert("Kırmızı zaman dilimi sayısı " + str.tostring(redThreshold) + " adede ulaştı", alert.freq_once_per_bar_close)
table.cell(tbl, 0, j, tfTxt(TF_VALUE), text_color=txtColor, text_halign=text.align_left, text_size=Siz1Table, bgcolor=timeBgColor)
table.cell(tbl, 1, j, str.tostring(tilson1VALUE, "#.#######")+SIGNAL1, text_color=greenArrowColor1, text_halign=text.align_right, text_size=Siz1Table, bgcolor=greenBgColor1)
j += 1
prd = input.int(defval=10, title='Pivot Period', minval=4, maxval=30, group='Setup')
ppsrc = input.string(defval='High/Low', title='Source', options= , group='Setup')
maxnumpp = input.int(defval=20, title=' Maximum Number of Pivot', minval=5, maxval=100, group='Setup')
ChannelW = input.int(defval=10, title='Maximum Channel Width %', minval=1, group='Setup')
maxnumsr = input.int(defval=5, title=' Maximum Number of S/R', minval=1, maxval=10, group='Setup')
min_strength = input.int(defval=2, title=' Minimum Strength', minval=1, maxval=10, group='Setup')
labelloc = input.int(defval=20, title='Label Location', group='Colors', tooltip='Positive numbers reference future bars, negative numbers reference histical bars')
linestyle = input.string(defval='Dashed', title='Line Style', options= , group='Colors')
linewidth = input.int(defval=2, title='Line Width', minval=1, maxval=4, group='Colors')
resistancecolor = input.color(defval=color.red, title='Resistance Color', group='Colors')
supportcolor = input.color(defval=color.lime, title='Support Color', group='Colors')
showpp = input(false, title='Show Point Points')
float src1 = ppsrc == 'High/Low' ? high : math.max(close, open)
float src2 = ppsrc == 'High/Low' ? low : math.min(close, open)
float ph = ta.pivothigh(src1, prd, prd)
float pl = ta.pivotlow(src2, prd, prd)
plotshape(ph and showpp, text='H', style=shape.labeldown, color=na, textcolor=color.new(color.red, 0), location=location.abovebar, offset=-prd)
plotshape(pl and showpp, text='L', style=shape.labelup, color=na, textcolor=color.new(color.lime, 0), location=location.belowbar, offset=-prd)
Lstyle = linestyle == 'Dashed' ? line.style_dashed : linestyle == 'Solid' ? line.style_solid : line.style_dotted
//calculate maximum S/R channel zone width
prdhighest = ta.highest(300)
prdlowest = ta.lowest(300)
cwidth = (prdhighest - prdlowest) * ChannelW / 100
var pivotvals = array.new_float(0)
if ph or pl
array.unshift(pivotvals, ph ? ph : pl)
if array.size(pivotvals) > maxnumpp // limit the array size
array.pop(pivotvals)
get_sr_vals(ind) =>
float lo = array.get(pivotvals, ind)
float hi = lo
int numpp = 0
for y = 0 to array.size(pivotvals) - 1 by 1
float cpp = array.get(pivotvals, y)
float wdth = cpp <= lo ? hi - cpp : cpp - lo
if wdth <= cwidth // fits the max channel width?
if cpp <= hi
lo := math.min(lo, cpp)
else
hi := math.max(hi, cpp)
numpp += 1
numpp
var sr_up_level = array.new_float(0)
var sr_dn_level = array.new_float(0)
sr_strength = array.new_float(0)
find_loc(strength) =>
ret = array.size(sr_strength)
for i = ret > 0 ? array.size(sr_strength) - 1 : na to 0 by 1
if strength <= array.get(sr_strength, i)
break
ret := i
ret
ret
check_sr(hi, lo, strength) =>
ret = true
for i = 0 to array.size(sr_up_level) > 0 ? array.size(sr_up_level) - 1 : na by 1
//included?
if array.get(sr_up_level, i) >= lo and array.get(sr_up_level, i) <= hi or array.get(sr_dn_level, i) >= lo and array.get(sr_dn_level, i) <= hi
if strength >= array.get(sr_strength, i)
array.remove(sr_strength, i)
array.remove(sr_up_level, i)
array.remove(sr_dn_level, i)
ret
else
ret := false
ret
break
ret
var sr_lines = array.new_line(11, na)
var sr_labels = array.new_label(11, na)
for x = 1 to 10 by 1
rate = 100 * (label.get_y(array.get(sr_labels, x)) - close) / close
label.set_text(array.get(sr_labels, x), text=str.tostring(label.get_y(array.get(sr_labels, x))) + '(' + str.tostring(rate, '#.##') + '%)')
label.set_x(array.get(sr_labels, x), x=bar_index + labelloc)
label.set_color(array.get(sr_labels, x), color=label.get_y(array.get(sr_labels, x)) >= close ? color.red : color.lime)
label.set_textcolor(array.get(sr_labels, x), textcolor=label.get_y(array.get(sr_labels, x)) >= close ? color.white : color.black)
label.set_style(array.get(sr_labels, x), style=label.get_y(array.get(sr_labels, x)) >= close ? label.style_label_down : label.style_label_up)
line.set_color(array.get(sr_lines, x), color=line.get_y1(array.get(sr_lines, x)) >= close ? resistancecolor : supportcolor)
if ph or pl
//because of new calculation, remove old S/R levels
array.clear(sr_up_level)
array.clear(sr_dn_level)
array.clear(sr_strength)
//find S/R zones
for x = 0 to array.size(pivotvals) - 1 by 1
= get_sr_vals(x)
if check_sr(hi, lo, strength)
loc = find_loc(strength)
// if strength is in first maxnumsr sr then insert it to the arrays
if loc < maxnumsr and strength >= min_strength
array.insert(sr_strength, loc, strength)
array.insert(sr_up_level, loc, hi)
array.insert(sr_dn_level, loc, lo)
// keep size of the arrays = 5
if array.size(sr_strength) > maxnumsr
array.pop(sr_strength)
array.pop(sr_up_level)
array.pop(sr_dn_level)
for x = 1 to 10 by 1
line.delete(array.get(sr_lines, x))
label.delete(array.get(sr_labels, x))
for x = 0 to array.size(sr_up_level) > 0 ? array.size(sr_up_level) - 1 : na by 1
float mid = math.round_to_mintick((array.get(sr_up_level, x) + array.get(sr_dn_level, x)) / 2)
rate = 100 * (mid - close) / close
array.set(sr_labels, x + 1, label.new(x=bar_index + labelloc, y=mid, text=str.tostring(mid) + '(' + str.tostring(rate, '#.##') + '%)', color=mid >= close ? color.red : color.lime, textcolor=mid >= close ? color.white : color.black, style=mid >= close ? label.style_label_down : label.style_label_up))
array.set(sr_lines, x + 1, line.new(x1=bar_index, y1=mid, x2=bar_index - 1, y2=mid, extend=extend.both, color=mid >= close ? resistancecolor : supportcolor, style=Lstyle, width=linewidth))
f_crossed_over() =>
ret = false
for x = 0 to array.size(sr_up_level) > 0 ? array.size(sr_up_level) - 1 : na by 1
float mid = math.round_to_mintick((array.get(sr_up_level, x) + array.get(sr_dn_level, x)) / 2)
if close <= mid and close > mid
ret := true
ret
ret
f_crossed_under() =>
ret = false
for x = 0 to array.size(sr_up_level) > 0 ? array.size(sr_up_level) - 1 : na by 1
float mid = math.round_to_mintick((array.get(sr_up_level, x) + array.get(sr_dn_level, x)) / 2)
if close >= mid and close < mid
ret := true
ret
ret
alertcondition(f_crossed_over(), title='Resistance Broken', message='Resistance Broken')
alertcondition(f_crossed_under(), title='Support Broken', message='Support Broken')

Multi-Timeframe EMA Trend Dashboard with Volume and RSI Filters═══════════════════════════════════════════════════════════
MULTI-TIMEFRAME EMA TREND DASHBOARD
═══════════════════════════════════════════════════════════
OVERVIEW
This indicator provides a comprehensive view of trend direction across multiple timeframes using the classic EMA 20/50 crossover methodology, enhanced with volume confirmation and RSI filtering. It aggregates trend information from six timeframes into a single dashboard for efficient market analysis.
The indicator is designed for educational purposes and to assist traders in identifying potential trend alignments across different time horizons.
═══════════════════════════════════════════════════════════
FEATURES
═══════════════════════════════════════════════════════════
MULTI-TIMEFRAME ANALYSIS
• Monitors 6 timeframes simultaneously: 1m, 5m, 15m, 1H, 4H, 1D
• Each timeframe analyzed independently using request.security()
• Non-repainting implementation with proper lookahead settings
• Calculates overall trend strength as percentage of bullish timeframes
EMA CROSSOVER SYSTEM
• Fast EMA (default: 20) and Slow EMA (default: 50)
• Bullish: Fast EMA > Slow EMA
• Bearish: Fast EMA < Slow EMA
• Neutral: Fast EMA = Slow EMA (rare condition)
• Visual EMA plots with optional fill area
VOLUME CONFIRMATION
• Optional volume filter for crossover signals
• Compares current volume against moving average (default: 20-period SMA)
• Categorizes volume as: High (>1.5x average), Normal (>average), Low (70), oversold (<30), and neutral zones
• Used in quality score calculation
• Optional display toggle
SUPPORT & RESISTANCE DETECTION
• Automatic detection using highest/lowest over lookback period (default: 50 bars)
• Plots resistance (red), support (green), and mid-level (gray)
• Step-line style for clear visualization
• Optional display toggle
QUALITY SCORING SYSTEM
• Rates trade setups from 1-5 stars
• Considers: MTF alignment, volume confirmation, RSI positioning
• 5 stars: 4+ timeframes aligned + volume confirmed + RSI 50-70
• 4 stars: 4+ timeframes aligned + volume confirmed
• 3 stars: 3+ timeframes aligned
• 2 stars: Exactly 3 timeframes aligned
• 1 star: Other conditions
VISUAL DASHBOARD
• Clean table display (position customizable)
• Color-coded trend indicators (green/red/yellow)
• Extended statistics panel (toggleable)
• Shows: Trends, Strength, Quality, RSI, Volume, Price Distance
═══════════════════════════════════════════════════════════
TECHNICAL SPECIFICATIONS
═══════════════════════════════════════════════════════════
CALCULATIONS
Trend Determination per Timeframe:
• request.security() fetches EMA values with gaps=off, lookahead=off
• Compares Fast EMA vs Slow EMA
• Returns: 1 (bullish), -1 (bearish), 0 (neutral)
Trend Strength:
• Counts number of bullish timeframes
• Formula: (bullish_count / 6) × 100
• Range: 0% (all bearish) to 100% (all bullish)
Price Distance from EMA:
• Formula: ((close - EMA) / EMA) × 100
• Positive: Price above EMA
• Negative: Price below EMA
• Warning when absolute distance > 5%
ANTI-REPAINTING MEASURES
• All request.security() calls use lookahead=barmerge.lookahead_off
• Dashboard updates only on barstate.islast
• Historical bars remain unchanged
• Crossover signals finalize on bar close
═══════════════════════════════════════════════════════════
USAGE GUIDE
═══════════════════════════════════════════════════════════
INTERPRETING THE DASHBOARD
Timeframe Rows:
• Each row shows individual timeframe trend status
• Look for alignment (multiple timeframes same direction)
• Higher timeframes generally more significant
Strength Indicator:
• >66.67%: Strong bullish (4+ timeframes bullish)
• 33.33-66.67%: Mixed/choppy conditions
• <33.33%: Strong bearish (4+ timeframes bearish)
Quality Score:
• Higher stars = better confluence of factors
• 5-star setups have strongest multi-factor confirmation
• Lower scores may indicate weaker or conflicting signals
SUGGESTED APPLICATIONS
Trend Confirmation:
• Check if multiple timeframes confirm current chart trend
• Higher agreement = stronger trend confidence
• Use for position sizing decisions
Entry Timing:
• Wait for EMA crossover on chart timeframe
• Confirm with higher timeframe alignment
• Volume above average preferred
• RSI not in extreme zones
Divergence Detection:
• When lower timeframes diverge from higher
• May indicate trend exhaustion or reversal
• Requires additional confirmation
CUSTOMIZATION
EMA Settings:
• Adjust Fast/Slow lengths for different sensitivities
• Shorter periods = more responsive, more signals
• Longer periods = smoother, fewer signals
• Common alternatives: 10/30, 12/26, 50/200
Volume Filter:
• Enable for higher-quality signals (fewer false positives)
• Disable in always-liquid markets or for more signals
• Adjust MA length based on typical volume patterns
Display Options:
• Toggle EMAs, S/R levels, extended stats as needed
• Choose dashboard position to avoid chart overlap
• Adjust colors for visibility preferences
═══════════════════════════════════════════════════════════
ALERTS
═══════════════════════════════════════════════════════════
AVAILABLE ALERT CONDITIONS
1. Bullish EMA Cross (Volume Confirmed)
2. Bearish EMA Cross (Volume Confirmed)
3. Strong Bullish Alignment (4+ timeframes)
4. Strong Bearish Alignment (4+ timeframes)
5. Trend Strength Increasing (>16.67% jump)
6. Trend Strength Decreasing (>16.67% drop)
7. Excellent Trade Setup (5-star rating)
Alert messages use standard placeholders:
• {{ticker}} - Symbol name
• {{close}} - Current close price
• {{time}} - Bar timestamp
═══════════════════════════════════════════════════════════
LIMITATIONS & CONSIDERATIONS
═══════════════════════════════════════════════════════════
KNOWN LIMITATIONS
• Lower timeframe data may not be available on all symbols
• 1-minute data typically limited to recent history
• request.security() subject to TradingView data limits
• Dashboard requires screen space (may overlap on small screens)
• More complex calculations may affect load time on slower devices
NOT SUITABLE FOR
• Highly volatile/illiquid instruments (many false signals)
• News-driven markets during announcements
• Automated trading without additional filters
• Markets where EMA strategies don't perform well
DOES NOT PROVIDE
• Exact entry/exit prices
• Stop-loss or take-profit levels
• Position sizing recommendations
• Guaranteed profit signals
• Market predictions
═══════════════════════════════════════════════════════════
BEST PRACTICES
═══════════════════════════════════════════════════════════
RECOMMENDED USAGE
✓ Combine with price action analysis
✓ Use appropriate risk management
✓ Backtest on historical data before live use
✓ Adjust settings for specific market characteristics
✓ Wait for higher-quality setups in important trades
✓ Consider overall market context and fundamentals
NOT RECOMMENDED
✗ Using as standalone trading system without confirmation
✗ Trading every signal without discretion
✗ Ignoring risk management principles
✗ Trading without understanding the methodology
✗ Applying to unsuitable markets/timeframes
═══════════════════════════════════════════════════════════
EDUCATIONAL BACKGROUND
═══════════════════════════════════════════════════════════
EMA CROSSOVER STRATEGY
The Exponential Moving Average crossover is a classical trend-following technique:
• Golden Cross: Fast EMA crosses above Slow EMA (bullish signal)
• Death Cross: Fast EMA crosses below Slow EMA (bearish signal)
• Widely used since the 1970s in various markets
• More responsive than SMA due to exponential weighting
MULTI-TIMEFRAME ANALYSIS
Analyzing multiple timeframes helps traders:
• Identify alignment between short and long-term trends
• Reduce false signals from single-timeframe noise
• Understand market context across different horizons
• Make informed decisions about trade duration
VOLUME ANALYSIS
Volume confirmation adds reliability:
• High volume suggests institutional participation
• Low volume signals may indicate false breakouts
• Volume precedes price in many market theories
• Helps distinguish genuine moves from noise
═══════════════════════════════════════════════════════════
TECHNICAL IMPLEMENTATION
═══════════════════════════════════════════════════════════
CODE STRUCTURE
• Organized in clear sections with proper commenting
• Uses explicit type declarations (int, float, bool, color, string)
• Constants defined at top (BULLISH=1, BEARISH=-1, etc.)
• Functions documented with @function, @param, @returns
• Follows PineCoders naming conventions (camelCase variables)
PERFORMANCE OPTIMIZATION
• var keyword for table (created once, not every bar)
• Calculations cached where possible
• Dashboard updates only on last bar
• Minimal redundant security() calls
SECURITY IMPLEMENTATION
• Proper gaps and lookahead parameters
• No future data leakage
• Signals finalize on bar close
• Historical bars remain static
═══════════════════════════════════════════════════════════
VERSION INFORMATION
═══════════════════════════════════════════════════════════
Current Version: 2.0
Pine Script Version: 5
Last Updated: 2024
Developed by: Zakaria Safri
═══════════════════════════════════════════════════════════
SETTINGS REFERENCE
═══════════════════════════════════════════════════════════
EMA SETTINGS
• Fast EMA Length: 1-500 (default: 20)
• Slow EMA Length: 1-500 (default: 50)
VOLUME & MOMENTUM
• Use Volume Confirmation: true/false (default: true)
• Volume MA Length: 1-500 (default: 20)
• Show RSI Levels: true/false (default: true)
• RSI Length: 1-500 (default: 14)
PRICE ACTION FEATURES
• Show Price Distance: true/false (default: true)
• Show Key Levels: true/false (default: true)
• S/R Lookback Period: 10-500 (default: 50)
DISPLAY SETTINGS
• Show EMAs on Chart: true/false (default: true)
• Fast EMA Color: customizable (default: cyan)
• Slow EMA Color: customizable (default: orange)
• EMA Line Width: 1-5 (default: 2)
• Show Fill Between EMAs: true/false (default: true)
• Show Crossover Signals: true/false (default: true)
DASHBOARD SETTINGS
• Position: Top Left/Right, Bottom Left/Right
• Show Extended Statistics: true/false (default: true)
ALERT SETTINGS
• Alert on Multi-TF Alignment: true/false (default: true)
• Alert on Trend Strength Change: true/false (default: true)
═══════════════════════════════════════════════════════════
RISK DISCLAIMER
═══════════════════════════════════════════════════════════
This indicator is provided for educational and informational purposes only. It should not be considered financial advice or a recommendation to buy or sell any security.
IMPORTANT NOTICES:
• Past performance does not indicate future results
• All trading involves risk of capital loss
• No indicator guarantees profitable trades
• Always conduct independent research and analysis
• Use proper risk management and position sizing
• Consult a qualified financial advisor before trading
• The developer assumes no liability for trading losses
By using this indicator, you acknowledge that you understand these risks and accept full responsibility for your trading decisions.
═══════════════════════════════════════════════════════════
SUPPORT & CONTRIBUTIONS
═══════════════════════════════════════════════════════════
FEEDBACK WELCOME
• Constructive comments appreciated
• Bug reports help improve the indicator
• Feature suggestions considered for future versions
• Share your experience to help other users
OPEN SOURCE
This code is published as open source for the TradingView community to:
• Learn from the implementation
• Modify for personal use
• Understand multi-timeframe analysis techniques
If you find this indicator useful, please consider:
• Leaving a thoughtful review
• Sharing with other traders who might benefit
• Following for future updates and releases
═══════════════════════════════════════════════════════════
ADDITIONAL RESOURCES
═══════════════════════════════════════════════════════════
RECOMMENDED READING
• TradingView Pine Script documentation
• PineCoders community resources
• Technical analysis textbooks on moving averages
• Multi-timeframe trading strategy guides
• Risk management principles
RELATED CONCEPTS
• Trend following strategies
• Moving average convergence/divergence
• Multiple timeframe analysis
• Volume-price relationships
• Momentum indicators
═══════════════════════════════════════════════════════════
Thank you for using this indicator. Trade responsibly and continue learning!
═══════════════════════════════════════════════════════════

The RSP/VOO indicatorThe RSP/VOO indicator refers to the ratio between the performance of two exchange-traded funds (ETFs): RSP (Invesco S&P 500 Equal Weight ETF) and VOO (Vanguard S&P 500 ETF). RSP tracks an equal-weighted version of the S&P 500 index, meaning each of the 500 stocks in the index is given the same weight regardless of company size. In contrast, VOO is a market-cap-weighted ETF, where larger companies (like Apple or Microsoft) have a greater influence on the fund's performance based on their market capitalization.
This ratio (RSP divided by VOO) is often used as a market breadth indicator in finance. When the RSP/VOO ratio rises, it suggests that smaller or mid-sized stocks in the S&P 500 are outperforming the largest ones, indicating broader market participation and potentially healthier overall market conditions. Conversely, when the ratio falls, it implies that a few mega-cap stocks are driving the market's gains, which can signal increased concentration risk or a narrower rally. For example, RSP provides more diversified exposure by reducing concentration in large-cap stocks, while VOO reflects the dominance of top-weighted holdings. Investors might monitor this ratio to gauge market sentiment, with RSP historically showing higher expense ratios (around 0.20%) compared to VOO's lower fees (about 0.03%), but offering potentially better risk-adjusted returns in certain environments.1.6秒
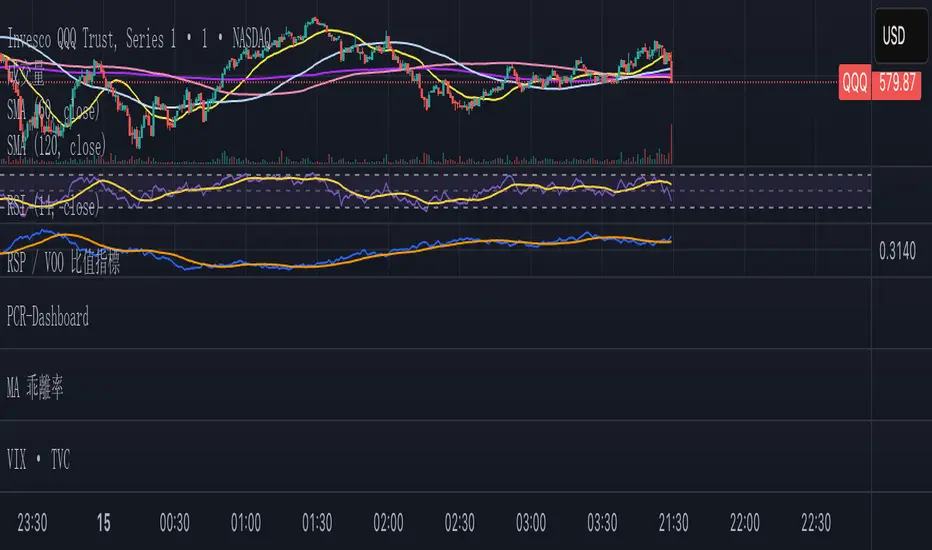
Magnificent 7 OscillatorThe Magnificent 7 Oscillator is a sophisticated momentum-based technical indicator designed to analyze the collective performance of the seven largest technology companies in the U.S. stock market (Apple, Microsoft, Alphabet, Amazon, NVIDIA, Tesla, and Meta). This indicator incorporates established momentum factor research and provides three distinct analytical modes: absolute momentum tracking, equal-weighted market comparison, and relative performance analysis. The tool integrates five different oscillator methodologies and includes advanced breadth analysis capabilities.
Theoretical Foundation
Momentum Factor Research
The indicator's foundation rests on seminal momentum research in financial markets. Jegadeesh and Titman (1993) demonstrated that stocks with strong price performance over 3-12 month periods tend to continue outperforming in subsequent periods¹. This momentum effect was later incorporated into formal factor models by Carhart (1997), who extended the Fama-French three-factor model to include a momentum factor (UMD - Up Minus Down)².
The momentum calculation methodology follows the academic standard:
Momentum(t) = / P(t-n) × 100
Where P(t) is the current price and n is the lookback period.
The focus on the "Magnificent 7" stocks reflects the increasing market concentration observed in recent years. Fama and French (2015) noted that a small number of large-cap stocks can drive significant market movements due to their substantial index weights³. The combined market capitalization of these seven companies often exceeds 25% of the total S&P 500, making their collective momentum a critical market indicator.
Indicator Architecture
Core Components
1. Data Collection and Processing
The indicator employs robust data collection with error handling for missing or invalid security data. Each stock's momentum is calculated independently using the specified lookback period (default: 14 periods).
2. Composite Oscillator Calculation
Following Fama-French factor construction methodology, the indicator offers two weighting schemes:
- Equal Weight: Each active stock receives identical weighting (1/n)
- Market Cap Weight: Reserved for future enhancement
3. Oscillator Transformation Functions
The indicator provides five distinct oscillator types, each with established technical analysis foundations:
a) Momentum Oscillator (Default)
- Pure rate-of-change calculation
- Centered around zero
- Direct implementation of Jegadeesh & Titman methodology
b) RSI (Relative Strength Index)
- Wilder's (1978) relative strength methodology
- Transformed to center around zero for consistency
- Scale: -50 to +50
c) Stochastic Oscillator
- George Lane's %K methodology
- Measures current position within recent range
- Transformed to center around zero
d) Williams %R
- Larry Williams' range-based oscillator
- Inverse stochastic calculation
- Adjusted for zero-centered display
e) CCI (Commodity Channel Index)
- Donald Lambert's mean reversion indicator
- Measures deviation from moving average
- Scaled for optimal visualization
Operational Modes
Mode 1: Magnificent 7 Analysis
Tracks the collective momentum of the seven constituent stocks. This mode is optimal for:
- Technology sector analysis
- Growth stock momentum assessment
- Large-cap performance tracking
Mode 2: S&P 500 Equal Weight Comparison
Analyzes momentum using an equal-weighted S&P 500 reference (typically RSP ETF). This mode provides:
- Broader market momentum context
- Size-neutral market analysis
- Comparison baseline for relative performance
Mode 3: Relative Performance Analysis
Calculates the momentum differential between Magnificent 7 and S&P 500 Equal Weight. This mode enables:
- Sector rotation analysis
- Style factor assessment (Growth vs. Value)
- Relative strength identification
Formula: Relative Performance = MAG7_Momentum - SP500EW_Momentum
Signal Generation and Thresholds
Signal Classification
The indicator generates three signal states:
- Bullish: Oscillator > Upper Threshold (default: +2.0%)
- Bearish: Oscillator < Lower Threshold (default: -2.0%)
- Neutral: Oscillator between thresholds
Relative Performance Signals
In relative performance mode, specialized thresholds apply:
- Outperformance: Relative momentum > +1.0%
- Underperformance: Relative momentum < -1.0%
Alert System
Comprehensive alert conditions include:
- Threshold crossovers (bullish/bearish signals)
- Zero-line crosses (momentum direction changes)
- Relative performance shifts
- Breadth Analysis Component
The indicator incorporates market breadth analysis, calculating the percentage of constituent stocks with positive momentum. This feature provides insights into:
- Strong Breadth (>60%): Broad-based momentum
- Weak Breadth (<40%): Narrow momentum leadership
- Mixed Breadth (40-60%): Neutral momentum distribution
Visual Design and User Interface
Theme-Adaptive Display
The indicator automatically adjusts color schemes for dark and light chart themes, ensuring optimal visibility across different user preferences.
Professional Data Table
A comprehensive data table displays:
- Current oscillator value and percentage
- Active mode and oscillator type
- Signal status and strength
- Component breakdowns (in relative performance mode)
- Breadth percentage
- Active threshold levels
Custom Color Options
Users can override default colors with custom selections for:
- Neutral conditions (default: Material Blue)
- Bullish signals (default: Material Green)
- Bearish signals (default: Material Red)
Practical Applications
Portfolio Management
- Sector Allocation: Use relative performance mode to time technology sector exposure
- Risk Management: Monitor breadth deterioration as early warning signal
- Entry/Exit Timing: Utilize threshold crossovers for position sizing decisions
Market Analysis
- Trend Identification: Zero-line crosses indicate momentum regime changes
- Divergence Analysis: Compare MAG7 performance against broader market
- Volatility Assessment: Oscillator range and frequency provide volatility insights
Strategy Development
- Factor Timing: Implement growth factor timing strategies
- Momentum Strategies: Develop systematic momentum-based approaches
- Risk Parity: Use breadth metrics for risk-adjusted portfolio construction
Configuration Guidelines
Parameter Selection
- Momentum Period (5-100): Shorter periods (5-20) for tactical analysis, longer periods (50-100) for strategic assessment
- Smoothing Period (1-50): Higher values reduce noise but increase lag
- Thresholds: Adjust based on historical volatility and strategy requirements
Timeframe Considerations
- Daily Charts: Optimal for swing trading and medium-term analysis
- Weekly Charts: Suitable for long-term trend analysis
- Intraday Charts: Useful for short-term tactical decisions
Limitations and Considerations
Market Concentration Risk
The indicator's focus on seven stocks creates concentration risk. During periods of significant rotation away from large-cap technology stocks, the indicator may not represent broader market conditions.
Momentum Persistence
While momentum effects are well-documented, they are not permanent. Jegadeesh and Titman (1993) noted momentum reversal effects over longer time horizons (2-5 years).
Correlation Dynamics
During market stress, correlations among the constituent stocks may increase, reducing the diversification benefits and potentially amplifying signal intensity.
Performance Metrics and Backtesting
The indicator includes hidden plots for comprehensive backtesting:
- Individual stock momentum values
- Composite breadth percentage
- S&P 500 Equal Weight momentum
- Relative performance calculations
These metrics enable quantitative strategy development and historical performance analysis.
References
¹Jegadeesh, N., & Titman, S. (1993). Returns to buying winners and selling losers: Implications for stock market efficiency. Journal of Finance, 48(1), 65-91.
Carhart, M. M. (1997). On persistence in mutual fund performance. Journal of Finance, 52(1), 57-82.
Fama, E. F., & French, K. R. (2015). A five-factor asset pricing model. Journal of Financial Economics, 116(1), 1-22.
Wilder, J. W. (1978). New concepts in technical trading systems. Trend Research.

HL2 Moving Average with BandsThis indicator is designed to assist traders in identifying potential trade entries and exits for S&P 500 (ES) and Nasdaq-100 (NQ) futures. It calculates a Simple Moving Average (SMA) based on the HL2 value (average of high and low prices) of the current candle over a user-defined lookback period (default: 200 periods). The indicator plots this SMA as a blue line, providing a smoothed reference for price trends.
Additionally, it includes upper and lower bands calculated as a percentage (default: 0.5%) above and below the SMA, plotted as green and red lines, respectively. These bands act as dynamic thresholds to identify overbought or oversold conditions. The indicator generates trade signals based on price action relative to these bands:
Long Entry: A green upward triangle is plotted below the candle when the close crosses above the upper band, signaling a potential buy.
Close Long: A red square is plotted above the candle when the close crosses back below the upper band, indicating an exit for the long position.
Short Entry: A red downward triangle is plotted above the candle when the close crosses below the lower band, signaling a potential sell.
Close Short: A green square is plotted below the candle when the close crosses back above the lower band, indicating an exit for the short position.
The script is customizable, allowing users to adjust the SMA length and band percentage to suit their trading style or market conditions. It is plotted as an overlay on the price chart for easy integration with other technical analysis tools.
Recommended Time Frame and Settings for Trading S&P 500 and Nasdaq-100 Futures
Based on research and market dynamics for S&P 500 (ES) and Nasdaq-100 (NQ) futures, the 5-minute chart is recommended as the optimal time frame for day trading with this indicator. This time frame strikes a balance between capturing intraday trends and filtering out excessive noise, which is critical for futures trading due to their high volatility and leverage. The 5-minute chart aligns well with periods of high liquidity and volatility, such as the U.S. market open (9:30 AM–11:00 AM EST) and the afternoon session (2:00 PM–4:00 PM EST), when institutional traders are most active.
Why 5-minute? It allows traders to react to short-term price movements while avoiding the rapid fluctuations of 1-minute charts, which can be prone to false signals in choppy markets. It also provides enough data points to make the SMA and bands meaningful without the lag associated with longer time frames like 15-minute or hourly charts.
Recommended Settings
SMA Length: Set to 200 periods. This longer lookback period smooths the HL2 data, reducing noise and providing a reliable trend reference for the 5-minute chart. A 200-period SMA helps identify significant trend shifts without being overly sensitive to minor price fluctuations.
Band Percentage: 0.5% is more suitable for the volatility of ES and NQ futures on a 5-minute chart, as it generates fewer but higher-probability signals. Wider bands (e.g., 1%) may miss short-term opportunities, while narrower bands (e.g., 0.1%) may produce excessive false signals.
Trading Session Recommendations
Futures markets for ES and NQ are open nearly 24 hours (Sunday 6:00 PM EST to Friday 5:00 PM EST, with a daily break from 4:00 PM–5:00 PM EST), but not all hours are equally optimal due to varying liquidity and volatility. The best times to trade with this indicator are:
U.S. Market Open (9:30 AM–11:00 AM EST): This period is characterized by high volume and volatility, driven by the opening of U.S. equity markets and economic data releases (e.g., 8:30 AM EST reports like CPI or GDP). The indicator’s signals are more reliable during this window due to strong order flow and price momentum.
Afternoon Session (2:00 PM–4:00 PM EST): After the lunchtime lull, volume picks up as institutional traders return, and news or FOMC announcements often drive price action. The indicator can capture breakout moves as prices test the upper or lower bands.
Pre-Market (7:30 AM–9:30 AM EST): For traders comfortable with lower liquidity, this period can offer opportunities, especially around 8:30 AM EST economic releases. However, use tighter risk management due to wider spreads and potential volatility spikes.
Additional Tips
Avoid Low-Volume Periods: Steer clear of trading during low-liquidity hours, such as the overnight session (11:00 PM–3:00 AM EST), when spreads widen and price movements can be erratic, leading to false signals from the indicator.
Combine with Other Tools: Enhance the indicator’s effectiveness by pairing it with support/resistance levels, Fibonacci retracements, or volume analysis to confirm signals. For example, a long entry signal above the upper band is stronger if it coincides with a breakout above a key resistance level.
Risk Management: Given the leverage in futures (e.g., Micro E-mini contracts require ~$1,200 margin for ES), use tight stop-losses (e.g., below the lower band for longs or above the upper band for shorts) to manage risk. Aim for a risk-reward ratio of at least 1:2.
Test Settings: Backtest the indicator on a demo account to optimize the SMA length and band percentage for your specific trading style and risk tolerance. Micro E-mini contracts (MES for S&P 500, MNQ for Nasdaq-100) are ideal for testing due to their lower capital requirements.
Why These Settings and Time Frame?
The 5-minute chart with a 200-period SMA and 0.5% bands is tailored for the volatility and liquidity of ES and NQ futures during peak trading hours. The longer SMA period ensures the indicator captures meaningful trends, while the 0.5% bands are tight enough to signal actionable breakouts but wide enough to avoid excessive whipsaws. Trading during high-volume sessions maximizes the likelihood of valid signals, as institutional participation drives clearer price action.
By focusing on these settings and time frames, traders can leverage the indicator to capitalize on the dynamic price movements of S&P 500 and Nasdaq-100 futures while managing the inherent risks of these markets.

Volume Profile [ActiveQuants]The Volume Profile indicator visualizes the distribution of trading volume across price levels over a user-defined historical period. It identifies key liquidity zones, including the Point of Control (POC) (price level with the highest volume) and the Value Area (price range containing a specified percentage of total volume). This tool is ideal for traders analyzing support/resistance levels, market sentiment , and potential price reversals .
█ CORE METHODOLOGY
Vertical Price Rows: Divides the price range of the selected lookback period into equal-height rows.
Volume Aggregation: Accumulates bullish/bearish or total volume within each price row.
POC: The row with the highest total volume.
Value Area: Expands from the POC until cumulative volume meets the user-defined threshold (e.g., 70%).
Dynamic Visualization: Rows are plotted as horizontal boxes with widths proportional to their volume.
█ KEY FEATURES
- Customizable Lookback & Resolution
Adjust the historical period ( Lookback ) and granularity ( Number of Rows ) for precise analysis.
- Configurable Profile Width & Horizontal Offset
Control the relative horizontal length of the profile rows, and set the distance from the current bar to the POC row’s anchor.
Important: Do not set the horizontal offset too high. Indicators cannot be plotted more than 500 bars into the future.
- Value Area & POC Highlighting
Set the percentage of total volume required to form the Value Area , ensuring that key volume levels are clearly identified.
Value Area rows are colored distinctly, while the POC is marked with a bold line.
- Flexible Display Options
Show bullish/bearish volume splits or total volume.
Place the profile on the right or left of the chart.
- Gradient Coloring
Rows fade in color intensity based on their relative volume strength .
- Real-Time Adjustments
Modify horizontal offset, profile width, and appearance without reloading.
█ USAGE EXAMPLES
Example 1: Basic Volume Profile with Value Area
Settings:
Lookback: 500 bars
Number of Rows: 100
Value Area: 70%
Display Type: Up/Down
Placement: Right
Image Context:
The profile appears on the right side of the chart. The POC (orange line) marks the highest volume row. Value Area rows (green/red) extend above/below the POC, containing 70% of total volume.
Example 2: Total Volume with Gradient Colors
Settings:
Lookback: 800 bars
Number of Rows: 100
Profile Width: 60
Horizontal Offset: 20
Display Type: Total
Gradient Colors: Enabled
Image Context:
Rows display total volume in a single color with gradient transparency. Darker rows indicate higher volume concentration.
Example 3: Left-Aligned Profile with Narrow Value Area
Settings:
Lookback: 600 bars
Number of Rows: 100
Profile Width: 45
Horizontal Offset: 500
Value Area: 50%
Profile Placement: Left
Image Context:
The profile shifts to the left, with a tighter Value Area (50%).
█ USER INPUTS
Calculation Settings
Lookback: Historical bars analyzed (default: 500).
Number of Rows: Vertical resolution of the profile (default: 100).
Profile Width: Horizontal length of rows (default: 50).
Horizontal Offset: Distance from the current bar to the POC (default: 50).
Value Area (%): Cumulative volume threshold for the Value Area (default: 70%).
Volume Display: Toggle between Up/Down (bullish/bearish) or Total volume.
Profile Placement: Align profile to the Right or Left of the chart.
Appearance
Rows Border: Customize border width/color.
Gradient Colors: Enable fading color effects.
Value Area Colors: Set distinct colors for bullish and bearish Value Area rows.
POC Line: Adjust color, width, and visibility.
█ CONCLUSION
The Volume Profile indicator provides a dynamic, customizable view of market liquidity. By highlighting the POC and Value Area, traders can identify high-probability reversal zones, gauge market sentiment, and align entries/exits with key volume levels.
█ IMPORTANT NOTES
⚠ Lookback Period: Shorter lookbacks prioritize recent activity but may omit critical levels.
⚠ Horizontal Offset Limitation: Avoid excessively high offsets (e.g., close to ±300). TradingView restricts plotting indicators more than 500 bars into the future, which may truncate or hide the profile.
⚠ Risk Management: While the indicator highlights areas of concentrated volume, always use it in combination with other technical analysis tools and proper risk management techniques.
█ RISK DISCLAIMER
Trading involves substantial risk. The Volume Profile highlights historical liquidity but does not predict future price movements. Always use stop-loss orders and confirm signals with additional analysis. Past performance is not indicative of future results.
📊 Happy trading! 🚀

Unleash Bitcoin's Next Move with S&P Divergence!BTC_GO_LONG_SONG
This script works like a special helper that watches two things: Bitcoin (a popular type of digital money) and the S&P 500 (which is like a big basket of important companies' stocks).
Imagine Bitcoin and the S&P 500 are connected by an invisible elastic band.
When they move together: The elastic band stays relaxed.
When they move apart: The elastic band stretches.
This script keeps an eye on how much the elastic band stretches.
If Bitcoin starts to move in a different way than the S&P 500 and the band stretches a lot, the script thinks that Bitcoin might snap back or make a big jump soon.
Here’s how it works:
Volume Check: The script looks at how many people are buying or selling Bitcoin. If a lot more people are trading than usual, it’s like a signal that something big might happen.
Price Movement: It watches how Bitcoin’s price is changing. If Bitcoin breaks away from its usual pattern and moves far from where it was recently, it could be a sign that a big change is coming.
Elastic Band Check: The script checks if Bitcoin is moving differently than the S&P 500. If Bitcoin is doing its own thing while the S&P 500 moves in another direction, it’s like the elastic band is being stretched.
When all these things happen together—high trading volume, unusual price movement, and a stretched elastic band—the script shows a green triangle on the chart.
This triangle is a signal for people who believe Bitcoin might go up (the Bulls) that it could be a good time to think about entering a trade because a breakout might be coming.
This explanation uses the idea of an elastic band to describe the relationship between Bitcoin and the S&P 500, making it easier to understand how this script helps traders spot potential breakout opportunities.

BetaBeta , also known as the Beta coefficient, is a measure that compares the volatility of an individual underlying or portfolio to the volatility of the entire market, typically represented by a market index like the S&P 500 or an investible product such as the SPY ETF (SPDR S&P 500 ETF Trust). A Beta value provides insight into how an asset's returns are expected to respond to market swings.
Interpretation of Beta Values
Beta = 1: The asset's volatility is in line with the market. If the market rises or falls, the asset is expected to move correspondingly.
Beta > 1: The asset is more volatile than the market. If the market rises or falls, the asset's price is expected to rise or fall more significantly.
Beta < 1 but > 0: The asset is less volatile than the market. It still moves in the same direction as the market but with less magnitude.
Beta = 0: The asset's returns are not correlated with the market's returns.
Beta < 0: The asset moves in the opposite direction to the market.
Example
A beta of 1.20 relative to the S&P 500 Index or SPY implies that if the S&P's return increases by 1%, the portfolio is expected to increase by 12.0%.
A beta of -0.10 relative to the S&P 500 Index or SPY implies that if the S&P's return increases by 1%, the portfolio is expected to decrease by 0.1%. In practical terms, this implies that the portfolio is expected to be predominantly 'market neutral' .
Calculation & Default Values
The Beta of an asset is calculated by dividing the covariance of the asset's returns with the market's returns by the variance of the market's returns over a certain period (standard period: 1 years, 250 trading days). Hint: It's noteworthy to mention that Beta can also be derived through linear regression analysis, although this technique is not employed in this Beta Indicator.
Formula: Beta = Covariance(Asset Returns, Market Returns) / Variance(Market Returns)
Reference Market: Essentially any reference market index or product can be used. The default reference is the SPY (SPDR S&P 500 ETF Trust), primarily due to its investable nature and broad representation of the market. However, it's crucial to note that Beta can also be calculated by comparing specific underlyings, such as two different stocks or commodities, instead of comparing an asset to the broader market. This flexibility allows for a more tailored analysis of volatility and correlation, depending on the user's specific trading or investment focus.
Look-back Period: The standard look-back period is typically 1-5 years (250-1250 trading days), but this can be adjusted based on the user's preference and the specifics of the trading strategy. For robust estimations, use at least 250 trading days.
Option Delta: An optional feature in the Beta Indicator is the ability to select a specific Delta value if options are written on the underlying asset with Deltas less than 1, providing an estimation of the beta-weighted delta of the position. It involves multiplying the beta of the underlying asset by the delta of the option. This addition allows for a more precise assessment of the underlying asset's correspondence with the overall market in case you are an options trader. The default Delta value is set to 1, representing scenarios where no options on the underlying asset are being analyzed. This default setting aligns with analyzing the direct relationship between the asset itself and the market, without the layer of complexity introduced by options.
Calculation: Simple or Log Returns: In the calculation of Beta, users have the option to choose between using simple returns or log returns for both the asset and the market. The default setting is 'Simple Returns'.
Advantages of Using Beta
Risk Management: Beta provides a clear metric for understanding and managing the risk of a portfolio in relation to market movements.
Portfolio Diversification: By knowing the beta of various assets, investors can create a balanced portfolio that aligns with their risk tolerance and investment goals.
Performance Benchmarking: Beta allows investors to compare an asset's risk-adjusted performance against the market or other benchmarks.
Beta-Weighted Deltas for Options Traders
For options traders, understanding the beta-weighted delta is crucial. It involves multiplying the beta of the underlying asset by the delta of the option. This provides a more nuanced view of the option's risk relative to the overall market. However, it's important to note that the delta of an option is dynamic, changing with the asset's price, time to expiration, and other factors.

High Impact NewsDo you have a difficult time remembering high-impact news events throughout the trading week? Now there is an indicator that allows the user to put labels directly on their charts at specific times in the future so news events won’t sneak up on the user.
Description
The “High Impact News” TradingView indicator by Infinity Trading gives the user complete control of three labels that can be set to any time and day of the trading week, even in the future. Each label can be displayed at a specific time, on a unique day of the week, and with custom text. Also, each label has a choice of over 20 emojis to display on the chart along with user-defined text. The text color and size can be independently adjusted.
The position of the labels on the chart can be easily moved up or down with 5 built-in presents: Current Week High, Current Day High, Current Price, Current Day Low, and Current Week Low. Additionally, each label has a separate buffer that allows the users to move the label up or down in increments of five. All of these user-controls ensure the labels are exactly where the user wants them on their charts.
Limitations
This indicator displays labels in the future. TradingView sets a limit of 500 bars/candles in the future you can interact on. This TradingView limit means that labels can only be drawn 500 candles in the future on any timeframe. On larger timeframes this is not a problem and one trading week can easily display any labels. But on smaller timeframes labels multiple days in the future will exceed the 500 candle limit. When a label exceeds the 500 candle limit the indicator will have a temporary error. THIS IS NOT A PROBLEM. Simply go back to a higher timeframe or wait until the label is within 500 candles. All of your Settings will be saved! This is just a limit placed by TradingView that cannot be overwritten.
Important Notice
As stated above, this indicator draws labels in the future on your charts. To achieve future labels, this indicator draws labels in the present and shifts them to the right (which is the future) certain number of bars. Please be aware of the following characteristics of this indicator:
Labels will not appear until after midnight EST on Monday of each trading week
Labels will not appear over the weekends
Labels set to “Monday” won’t appear until midnight EST on Monday (or later)
Labels set to “Tuesday” through “Friday” won’t appear until the time specified in the Settings on Monday. For example, a FOMC label set to 2pm EST on Wednesday will not appear on the chart until 2pm EST on Monday
On 1-Hour or 2-Hour charts, please note that labels with a non-hour time will be shifted slightly so they appear on the chart. For example, a label at 8:15 am on the 5-min chart will be adjusted to 8:00 am on the 1-Hour chart so the label will appear
The above characteristics are a result of having to draw the labels at a specified time (of the trading week) and then calculating how many bars it takes to get the label to the correct time in the future.

Key Support and ResistanceKEY SUPPORT AND RESISTANCE - USER GUIDE
========================================
OVERVIEW
This indicator automatically identifies and displays key support and resistance levels based on swing highs and swing lows. It uses pivot point detection to mark significant price levels where the market has previously shown reactions, helping traders identify potential entry/exit points and key decision zones.
KEY FEATURES
• Automatic Level Detection: Identifies swing highs (resistance) and swing lows (support) using pivot point analysis
• Dynamic Line Management: Displays only recent levels within a specified lookback period to keep charts clean
• Auto-Extending Lines: Projects support/resistance levels forward to anticipate future price interactions
• Color-Coded Levels: Red lines for resistance, green lines for support for easy visual identification
========================================
PARAMETERS
========================================
Left Bars (Default: 10)
• Minimum: 5 bars
• Number of bars to the left of the pivot point
• Higher values = more significant levels but fewer signals
• Lower values = more sensitive detection but may include minor swings
Right Bars (Default: 10)
• Minimum: 5 bars
• Number of bars to the right of the pivot point
• Must be confirmed by price action before the level is drawn
• Balances between confirmation delay and signal accuracy
Show Last N Bars (Default: 200)
• Minimum: 10 bars
• Only displays support/resistance levels detected within the most recent N bars
• Keeps your chart clean by removing outdated levels
• Adjust based on your trading timeframe and style
Line Extension Length (Default: 48)
• Minimum: 1 bar
• How many bars forward the support/resistance lines extend
• Helps visualize potential future price interactions
• Longer extensions useful for swing trading, shorter for day trading
========================================
HOW TO USE
========================================
FOR SWING TRADERS
1. Use default settings (10/10) or increase to 15/15 for more significant levels
2. Set "Show Last N Bars" to 300-500 to capture longer-term levels
3. Look for price reactions when approaching these levels
4. Combine with volume analysis for confirmation
FOR DAY TRADERS
1. Consider reducing Left/Right Bars to 7-8 for more frequent signals
2. Set "Show Last N Bars" to 100-150 to focus on recent action
3. Reduce "Line Extension Length" to 20-30 bars
4. Watch for intraday bounces or breakouts at these levels
TRADING STRATEGIES
Bounce Trading (Mean Reversion)
• Enter long when price approaches green support lines
• Enter short when price approaches red resistance lines
• Use stop loss just beyond the support/resistance level
• Best in ranging or consolidating markets
Breakout Trading (Trend Following)
• Wait for price to break through resistance (bullish) or support (bearish)
• Confirm with increased volume
• Previous resistance becomes new support (and vice versa)
• Best in trending markets
Multi-Timeframe Analysis
• Check higher timeframe levels for major support/resistance zones
• Use lower timeframe levels for precise entry/exit timing
• Confluence of multiple timeframe levels creates strong zones
========================================
IMPORTANT NOTES
========================================
Line Confirmation Delay
• Lines appear with a delay equal to "Right Bars" parameter
• This delay ensures the pivot point is confirmed
• Real-time level detection requires price action confirmation
Chart Clarity
• Maximum 500 lines can be displayed (TradingView limitation)
• Adjust "Show Last N Bars" if chart becomes too cluttered
• Old lines automatically delete when outside the lookback period
False Signals
• Not all support/resistance levels will hold
• Use additional confirmation (volume, candlestick patterns, other indicators)
• Markets can break through levels, especially during high-impact news
BEST PRACTICES
1. Combine with Other Analysis: Use alongside trend indicators, volume, and price action patterns
2. Context Matters: Consider overall market trend and structure
3. Risk Management: Always use stop losses; don't rely solely on S/R levels
4. Market Conditions: More effective in liquid, actively traded markets
5. Backtesting: Test settings on your specific instrument and timeframe before live trading
TROUBLESHOOTING
Too Many Lines?
• Increase "Left Bars" and "Right Bars" values
• Decrease "Show Last N Bars" value
Too Few Lines?
• Decrease "Left Bars" and "Right Bars" values
• Increase "Show Last N Bars" value
Lines Not Appearing?
• Ensure sufficient price data is loaded on your chart
• Check that "Right Bars" have passed since the last swing point
• Verify indicator is properly loaded (refresh if needed)
TECHNICAL DETAILS
• Uses ta.pivothigh() and ta.pivotlow() functions for level detection
• Implements array-based line management for efficient rendering
• Automatic cleanup of outdated lines to maintain performance
• Overlay indicator - displays directly on price chart
Disclaimer: This indicator is for educational and informational purposes only. It does not constitute financial advice. Always conduct your own research and risk assessment before making trading decisions.
========================================
中文使用指南
========================================
概述
本指標自動識別並顯示基於波段高點和低點的關鍵支撐阻力位。使用樞軸點檢測標記市場先前反應的重要價格水平,幫助交易者識別潛在的進出場點和關鍵決策區域。
主要功能
• 自動水平檢測:使用樞軸點分析識別波段高點(阻力)和波段低點(支撐)
• 動態線條管理:僅顯示指定回看期內的近期水平,保持圖表清晰
• 自動延伸線條:將支撐阻力水平向前投影,預測未來價格互動
• 顏色編碼:紅線表示阻力,綠線表示支撐,便於視覺識別
========================================
參數說明
========================================
左側K棒數(預設:10)
• 最小值:5根K棒
• 樞軸點左側的K棒數量
• 數值越高 = 水平越重要但訊號越少
• 數值越低 = 檢測更敏感但可能包含次要波動
右側K棒數(預設:10)
• 最小值:5根K棒
• 樞軸點右側的K棒數量
• 必須經過價格行為確認後才繪製水平
• 在確認延遲和訊號準確性之間取得平衡
顯示最近N根K棒內的點(預設:200)
• 最小值:10根K棒
• 僅顯示最近N根K棒內檢測到的支撐阻力水平
• 透過移除過時水平保持圖表清晰
• 根據您的交易時間框架和風格調整
線條延伸長度(預設:48)
• 最小值:1根K棒
• 支撐阻力線向前延伸的K棒數
• 幫助視覺化潛在的未來價格互動
• 較長延伸適合波段交易,較短適合當沖交易
========================================
使用方法
========================================
波段交易者
1. 使用預設設定(10/10)或增加至15/15以獲得更重要的水平
2. 將「顯示最近N根K棒」設為300-500以捕捉長期水平
3. 觀察價格接近這些水平時的反應
4. 結合成交量分析進行確認
當沖交易者
1. 考慮將左右側K棒減少至7-8以獲得更頻繁的訊號
2. 將「顯示最近N根K棒」設為100-150以專注於近期行情
3. 將「線條延伸長度」減少至20-30根K棒
4. 觀察日內在這些水平的反彈或突破
交易策略
反彈交易(均值回歸)
• 當價格接近綠色支撐線時做多
• 當價格接近紅色阻力線時做空
• 在支撐阻力水平之外設置止損
• 在區間或盤整市場中效果最佳
突破交易(趨勢跟隨)
• 等待價格突破阻力(看漲)或支撐(看跌)
• 以增加的成交量確認
• 先前的阻力成為新的支撐(反之亦然)
• 在趨勢市場中效果最佳
多時間框架分析
• 檢查更高時間框架的主要支撐阻力區域
• 使用較低時間框架進行精確的進出場時機
• 多個時間框架水平的匯合創造強大區域
========================================
重要注意事項
========================================
線條確認延遲
• 線條出現時會有等於「右側K棒數」參數的延遲
• 此延遲確保樞軸點被確認
• 實時水平檢測需要價格行為確認
圖表清晰度
• 最多可顯示500條線(TradingView限制)
• 如果圖表變得太雜亂,請調整「顯示最近N根K棒」
• 超出回看期的舊線會自動刪除
假訊號
• 並非所有支撐阻力水平都會守住
• 使用額外確認(成交量、K棒型態、其他指標)
• 市場可能突破水平,特別是在重大新聞期間
最佳實踐
1. 結合其他分析:與趨勢指標、成交量和價格行為型態一起使用
2. 背景很重要:考慮整體市場趨勢和結構
3. 風險管理:始終使用止損;不要僅依賴支撐阻力水平
4. 市場條件:在流動性高、活躍交易的市場中更有效
5. 回測:在實盤交易前,在您的特定商品和時間框架上測試設定
故障排除
線條太多?
• 增加「左側K棒數」和「右側K棒數」數值
• 減少「顯示最近N根K棒」數值
線條太少?
• 減少「左側K棒數」和「右側K棒數」數值
• 增加「顯示最近N根K棒」數值
線條未出現?
• 確保圖表上載入了足夠的價格數據
• 檢查自上次波動點以來是否已過「右側K棒數」
• 驗證指標是否正確載入(如需要請刷新)
技術細節
• 使用 ta.pivothigh() 和 ta.pivotlow() 函數進行水平檢測
• 實施基於陣列的線條管理以實現高效渲染
• 自動清理過時線條以保持性能
• 疊加指標 - 直接顯示在價格圖表上
免責聲明:本指標僅供教育和資訊目的。不構成財務建議。在做出交易決策前,請務必進行自己的研究和風險評估。

BTC Price Prediction Model [Global PMI]V2🇺🇸 English Guide
1. Introduction
This indicator was created by GW Capital using Gemini Vibe Coding technology. It leverages advanced AI coding capabilities to reconstruct complex macroeconomic models into actionable trading tools.
2. Credits
Special thanks to the original model author, Marty Kendall. His research into the correlation between Bitcoin's price and macroeconomic factors lays the foundation for this algorithm.
3. Model Principles & Formula
This model calculates the "Fair Value" of Bitcoin based on four key macroeconomic pillars. It assumes that Bitcoin's price is a function of Global Liquidity, Network Security, Risk Appetite, and the Economic Cycle.
💡 Unique Insight: PMI & The 4-Year Cycle
A key distinguishing feature of this model is the hypothesis that Bitcoin's famous "4-Year Halving Cycle" may be intrinsically linked to the Global Business Cycle (PMI), rather than just supply shocks.
Therefore, the model incorporates PMI as a valuation "Amplifier".
Note: Due to TradingView data limitations, US PMI is currently used as the proxy for the global cycle.
The Formula
$$\ln(BTC) = \alpha + (1 + \beta \cdot PMI_{z}) \times $$
Global Liquidity (M2): Sum of M2 supply from US, China, Eurozone, and Japan (converted to USD). Represents the pool of fiat money available to flow into assets.
Network Security (Hashrate): Bitcoin's hashrate, representing the physical security and utility of the network.
Risk Appetite (S&P 500): Used as a proxy for global risk sentiment.
Economic Cycle (PMI Z-Score): US Manufacturing PMI is used to amplify or dampen the valuation based on where we are in the business cycle (Expansion vs. Contraction).
4. How to Use
The indicator plots the Fair Value (White Line) and four sentiment bands based on statistical deviation (Z-Score).
Sentiment Zones
🚨 Extreme Greed (Red Zone): Price > +0.3 StdDev. Historically indicates a market top or overheated sentiment.
⚠️ Greed (Orange Zone): Price > +0.15 StdDev. Bullish momentum is strong but caution is advised.
⚖️ Fair Value (White Line): The theoretical "correct" price based on macro data.
😨 Fear (Teal Zone): Price < -0.15 StdDev. Undervalued territory.
💎 Extreme Fear (Green Zone): Price < -0.3 StdDev. Historically a generational buying opportunity.
Sentiment Score (0-100)
100: Maximum Greed (Top)
50: Fair Value
0: Maximum Fear (Bottom)
5. Usage Recommendations
Timeframe: Daily (1D) or Weekly (1W) ONLY.
Reason: The underlying data sources (M2, PMI) are updated monthly. The S&P 500 and Hashrate are daily. Using this indicator on intraday charts (e.g., 15m, 1h, 4h) adds no value because the fundamental data does not change that fast.
Long-Term View: This is a macro-cycle indicator designed for identifying cycle tops and bottoms over months and years, not for day trading.
6. Disclaimer
This indicator is for educational and informational purposes only. It does not constitute financial advice. The model relies on historical correlations which may not hold true in the future. All trading involves risk. GW Capital and the creators assume no responsibility for any trading losses.
7. Support Us ❤️
If you find this indicator useful, please Boost 👍, Comment, and add it to your Favorites! Your support keeps us going.
🇨🇳 中文说明 (Chinese Version)
1. 简介
本指标由 GW Capital 使用 Gemini Vibe Coding 技术制作。利用先进的 AI 编程能力,将复杂的宏观经济模型重构为可执行的交易工具。
2. 致谢
特别感谢模型原作者 Marty Kendall。他对这一算法的研究奠定了基础,揭示了比特币价格与宏观经济因素之间的深层联系。
3. 模型原理与公式
该模型基于四大宏观经济支柱计算比特币的“公允价值”。它假设比特币的价格是全球流动性、网络安全性、风险偏好和经济周期的函数。
💡 独家洞察:PMI 与 4年周期
本模型的一个核心独特之处在于:我们认为比特币著名的“4年减半周期”背后的真正驱动力,可能与全球商业周期 (PMI) 高度同步,而不仅仅是供应减半。
因此,模型特别引入 PMI 作为估值的“放大器” (Amplifier)。
注:由于 TradingView 数据源限制,目前采用历史数据最详尽的美国 PMI 作为全球周期的代理指标。
模型公式
$$\ln(BTC) = \alpha + (1 + \beta \cdot PMI_{z}) \times $$
全球流动性 (M2): 美、中、欧、日四大经济体的 M2 总量(折算为美元)。代表可流入资产的法币资金池。
网络安全性 (Hashrate): 比特币全网算力,代表网络的物理安全性和实用价值。
风险偏好 (S&P 500): 作为全球风险情绪的代理指标。
经济周期 (PMI Z-Score): 美国制造业 PMI 用于根据商业周期(扩张 vs 收缩)来放大或抑制估值。
4. 指标用法
指标会在图表上绘制 公允价值 (白线) 以及基于统计偏差 (Z-Score) 的四条情绪带。
情绪区间
🚨 极度贪婪 (红色区域): 价格 > +0.3 标准差。历史上通常预示市场顶部或情绪过热。
⚠️ 一般贪婪 (橙色区域): 价格 > +0.15 标准差。多头动能强劲,但需谨慎。
⚖️ 公允价值 (白线): 基于宏观数据的理论“正确”价格。
😨 一般恐惧 (青色区域): 价格 < -0.15 标准差。进入低估区域。
💎 极度恐惧 (绿色区域): 价格 < -0.3 标准差。历史上通常是代际级别的买入机会。
情绪评分 (0-100)
100: 极度贪婪 (顶部)
50: 公允价值
0: 极度恐惧 (底部)
5. 使用建议
周期: 仅限日线 (1D) 或周线 (1W)。
原因: 底层数据源(M2, PMI)是月度更新的。标普500和算力是日度更新的。在日内图表(如15分钟、1小时、4小时)上使用此指标没有任何意义,因为基本面数据不会变化得那么快。
长期视角: 这是一个宏观周期指标,旨在识别数月甚至数年的周期顶部和底部,而非用于日内交易。
6. 免责声明
本指标仅供教育和参考使用,不构成任何财务建议。该模型依赖于历史相关性,未来可能不再适用。所有交易均涉及风险。GW Capital 及制作者不对任何交易损失承担责任。

BTC Price Prediction Model [Global PMI]🇨🇳 中文说明 (Chinese Version)
1. 简介
本指标由 GW Capital 使用 Gemini Vibe Coding 技术制作。利用先进的 AI 编程能力,将复杂的宏观经济模型重构为可执行的交易工具。
2. 致谢
特别感谢模型原作者 Marty Kendall。他对这一算法的研究奠定了基础,揭示了比特币价格与宏观经济因素之间的深层联系。
3. 模型原理与公式
该模型基于四大宏观经济支柱计算比特币的“公允价值”。它假设比特币的价格是全球流动性、网络安全性、风险偏好和经济周期的函数。
模型公式
$$\ln(BTC) = \alpha + (1 + \beta \cdot PMI_{z}) \times $$
全球流动性 (M2): 美、中、欧、日四大经济体的 M2 总量(折算为美元)。代表可流入资产的法币资金池。
网络安全性 (Hashrate): 比特币全网算力,代表网络的物理安全性和实用价值。
风险偏好 (S&P 500): 作为全球风险情绪的代理指标。
经济周期 (PMI Z-Score): 美国制造业 PMI 用于根据商业周期(扩张 vs 收缩)来放大或抑制估值。
4. 指标用法
指标会在图表上绘制 公允价值 (白线) 以及基于统计偏差 (Z-Score) 的四条情绪带。
情绪区间
🚨 极度贪婪 (红色区域): 价格 > +0.3 标准差。历史上通常预示市场顶部或情绪过热。
⚠️ 一般贪婪 (橙色区域): 价格 > +0.15 标准差。多头动能强劲,但需谨慎。
⚖️ 公允价值 (白线): 基于宏观数据的理论“正确”价格。
😨 一般恐惧 (青色区域): 价格 < -0.15 标准差。进入低估区域。
💎 极度恐惧 (绿色区域): 价格 < -0.3 标准差。历史上通常是代际级别的买入机会。
情绪评分 (0-100)
100: 极度贪婪 (顶部)
50: 公允价值
0: 极度恐惧 (底部)
5. 使用建议
周期: 仅限日线 (1D) 或周线 (1W)。
原因: 底层数据源(M2, PMI)是月度更新的。标普500和算力是日度更新的。在日内图表(如15分钟、1小时、4小时)上使用此指标没有任何意义,因为基本面数据不会变化得那么快。
长期视角: 这是一个宏观周期指标,旨在识别数月甚至数年的周期顶部和底部,而非用于日内交易。
6. 免责声明
本指标仅供教育和参考使用,不构成任何财务建议。该模型依赖于历史相关性,未来可能不再适用。所有交易均涉及风险。GW Capital 及制作者不对任何交易损失承担责任。
🇺🇸 English Guide (英文说明)
1. Introduction
This indicator was created by GW Capital using Gemini Vibe Coding technology. It leverages advanced AI coding capabilities to reconstruct complex macroeconomic models into actionable trading tools.
2. Credits
Special thanks to the original model author, Marty Kendall. His research into the correlation between Bitcoin's price and macroeconomic factors lays the foundation for this algorithm.
3. Model Principles & Formula
This model calculates the "Fair Value" of Bitcoin based on four key macroeconomic pillars. It assumes that Bitcoin's price is a function of Global Liquidity, Network Security, Risk Appetite, and the Economic Cycle.
The Formula
$$\ln(BTC) = \alpha + (1 + \beta \cdot PMI_{z}) \times $$
Global Liquidity (M2): Sum of M2 supply from US, China, Eurozone, and Japan (converted to USD). Represents the pool of fiat money available to flow into assets.
Network Security (Hashrate): Bitcoin's hashrate, representing the physical security and utility of the network.
Risk Appetite (S&P 500): Used as a proxy for global risk sentiment.
Economic Cycle (PMI Z-Score): US Manufacturing PMI is used to amplify or dampen the valuation based on where we are in the business cycle (Expansion vs. Contraction).
4. How to Use
The indicator plots the Fair Value (White Line) and four sentiment bands based on statistical deviation (Z-Score).
Sentiment Zones
🚨 Extreme Greed (Red Zone): Price > +0.3 StdDev. Historically indicates a market top or overheated sentiment.
⚠️ Greed (Orange Zone): Price > +0.15 StdDev. Bullish momentum is strong but caution is advised.
⚖️ Fair Value (White Line): The theoretical "correct" price based on macro data.
😨 Fear (Teal Zone): Price < -0.15 StdDev. Undervalued territory.
💎 Extreme Fear (Green Zone): Price < -0.3 StdDev. Historically a generational buying opportunity.
Sentiment Score (0-100)
100: Maximum Greed (Top)
50: Fair Value
0: Maximum Fear (Bottom)
5. Usage Recommendations
Timeframe: Daily (1D) or Weekly (1W) ONLY.
Reason: The underlying data sources (M2, PMI) are updated monthly. The S&P 500 and Hashrate are daily. Using this indicator on intraday charts (e.g., 15m, 1h, 4h) adds no value because the fundamental data does not change that fast.
Long-Term View: This is a macro-cycle indicator designed for identifying cycle tops and bottoms over months and years, not for day trading.
6. Disclaimer
This indicator is for educational and informational purposes only. It does not constitute financial advice. The model relies on historical correlations which may not hold true in the future. All trading involves risk. GW Capital and the creators assume no responsibility for any trading losses.

1小时区域背景颜色// This work is licensed under a Attribution-NonCommercial-ShareAlike 4.0 International (CC BY-NC-SA 4.0) creativecommons.org
// © LuxAlgo
//@version=5
indicator("Sessions ", "LuxAlgo - Sessions", overlay = true, max_bars_back = 500, max_lines_count = 500, max_boxes_count = 500, max_labels_count = 500)
//------------------------------------------------------------------------------
//Settings
//-----------------------------------------------------------------------------{
//Session A
show_sesa = input(true, '', inline = 'sesa', group = 'Session A')
sesa_txt = input('New York', '', inline = 'sesa', group = 'Session A')
sesa_ses = input.session('1300-2200', '', inline = 'sesa', group = 'Session A')
sesa_css = input.color(#ff5d00, '', inline = 'sesa', group = 'Session A')
sesa_range = input(true, 'Range', inline = 'sesa_overlays', group = 'Session A')
sesa_tl = input(false, 'Trendline', inline = 'sesa_overlays', group = 'Session A')
sesa_avg = input(false, 'Mean', inline = 'sesa_overlays', group = 'Session A')
sesa_vwap = input(false, 'VWAP', inline = 'sesa_overlays', group = 'Session A')
sesa_maxmin = input(false, 'Max/Min', inline = 'sesa_overlays', group = 'Session A')
//Session B
show_sesb = input(true, '', inline = 'sesb', group = 'Session B')
sesb_txt = input('London', '', inline = 'sesb', group = 'Session B')
sesb_ses = input.session('0700-1600', '', inline = 'sesb', group = 'Session B')
sesb_css = input.color(#2157f3, '', inline = 'sesb', group = 'Session B')
sesb_range = input(true, 'Range', inline = 'sesb_overlays', group = 'Session B')
sesb_tl = input(false, 'Trendline', inline = 'sesb_overlays', group = 'Session B')
sesb_avg = input(false, 'Mean', inline = 'sesb_overlays', group = 'Session B')
sesb_vwap = input(false, 'VWAP', inline = 'sesb_overlays', group = 'Session B')
sesb_maxmin = input(false, 'Max/Min', inline = 'sesb_overlays', group = 'Session B')
//Session C
show_sesc = input(true, '', inline = 'sesc', group = 'Session C')
sesc_txt = input('Tokyo', '', inline = 'sesc', group = 'Session C')
sesc_ses = input.session('0000-0900', '', inline = 'sesc', group = 'Session C')
sesc_css = input.color(#e91e63, '', inline = 'sesc', group = 'Session C')
sesc_range = input(true, 'Range', inline = 'sesc_overlays', group = 'Session C')
sesc_tl = input(false, 'Trendline', inline = 'sesc_overlays', group = 'Session C')
sesc_avg = input(false, 'Mean', inline = 'sesc_overlays', group = 'Session C')
sesc_vwap = input(false, 'VWAP', inline = 'sesc_overlays', group = 'Session C')
sesc_maxmin = input(false, 'Max/Min', inline = 'sesc_overlays', group = 'Session C')
//Session D
show_sesd = input(true, '', inline = 'sesd', group = 'Session D')
sesd_txt = input('Sydney', '', inline = 'sesd', group = 'Session D')
sesd_ses = input.session('2100-0600', '', inline = 'sesd', group = 'Session D')
sesd_css = input.color(#ffeb3b, '', inline = 'sesd', group = 'Session D')
sesd_range = input(true, 'Range', inline = 'sesd_overlays', group = 'Session D')
sesd_tl = input(false, 'Trendline', inline = 'sesd_overlays', group = 'Session D')
sesd_avg = input(false, 'Mean', inline = 'sesd_overlays', group = 'Session D')
sesd_vwap = input(false, 'VWAP', inline = 'sesd_overlays', group = 'Session D')
sesd_maxmin = input(false, 'Max/Min', inline = 'sesd_overlays', group = 'Session D')
//Timezones
tz_incr = input.int(0, 'UTC (+/-)', group = 'Timezone')
use_exchange = input(false, 'Use Exchange Timezone', group = 'Timezone')
//Ranges Options
bg_transp = input.float(90, 'Range Area Transparency', group = 'Ranges Settings')
show_outline = input(true, 'Range Outline', group = 'Ranges Settings')
show_txt = input(true, 'Range Label', group = 'Ranges Settings')

ULTIMATE ORDER FLOW SYSTEM🔥 ULTIMATE ORDER FLOW SYSTEM
Overview
This comprehensive order flow analysis tool combines **Volume Profile**, **Cumulative Delta**, and **Large Order Detection** to identify high-probability trading setups. The script analyzes institutional order flow patterns and volume distribution to pinpoint key levels where price is likely to react.
📊 Core Components & Methodology
🔥 ULTIMATE ORDER FLOW SYSTEM
Overview
This comprehensive order flow analysis tool combines Volume Profile, Cumulative Delta, and Large Order Detection to identify high-probability trading setups. The script analyzes institutional order flow patterns and volume distribution to pinpoint key levels where price is likely to react.
________________________________________
📊 Core Components & Methodology
1. Volume Profile Analysis
The script constructs a horizontal volume profile by:
• Dividing the price range into configurable rows (default: 20)
• Accumulating volume at each price level over a lookback period (default: 50 bars)
• Separating buy volume (green bars close > open) from sell volume (red bars)
• Identifying three critical levels:
o POC (Point of Control): Price level with highest traded volume - acts as a strong magnet
o VAH/VAL (Value Area High/Low): Contains 70% of total volume - defines fair value zone
o HVN (High Volume Nodes): Resistance zones where institutions accumulated positions
o LVN (Low Volume Nodes): Thin zones that price moves through quickly - ideal targets
Why This Matters: Institutional traders leave footprints through volume. HVN zones show where large players defended levels, making them reliable support/resistance.
________________________________________
2. Cumulative Delta (Order Flow)
Tracks the running total of buying vs selling pressure:
• Bar Delta: Difference between buy and sell volume per candle
• Cumulative Delta: Sum of all bar deltas - shows net directional pressure
• Delta Moving Average: Smoothed delta (20-period) to identify trend
• Delta Divergences:
o Bullish: Price makes lower low, but delta makes higher low (absorption at bottom)
o Bearish: Price makes higher high, but delta makes lower high (exhaustion at top)
How It Works: When cumulative delta trends up while price consolidates, it signals accumulation. Delta divergences reveal when smart money is positioned opposite to retail expectations.
________________________________________
3. Large Order Detection
Identifies institutional-sized orders in real-time:
• Compares current bar volume to 20-period moving average
• Flags orders exceeding 2.5x average volume (configurable multiplier)
• Distinguishes bullish (green circles below) vs bearish (red circles above) large orders
Rationale: Sudden volume spikes at key levels indicate institutional participation - the "fuel" needed for breakouts or reversals.
________________________________________
🎯 Trading Signal Logic
Combined Setup Criteria
The script generates SHORT and LONG signals when multiple conditions align:
SHORT Signal Requirements:
1. Price reaches an HVN resistance zone (within 0.2%)
2. Large sell order detected (volume spike + red candle)
3. Cumulative delta is bearish OR bearish divergence present
4. 10-bar cooldown between signals (prevents overtrading)
LONG Signal Requirements:
1. Price reaches an HVN support zone
2. Large buy order detected (volume spike + green candle)
3. Cumulative delta is bullish OR bullish divergence present
4. 10-bar cooldown enforced
________________________________________
🔧 Customization Options
Setting - Purpose - Recommendation
Volume Profile Rows - Granularity of level detection - 20 (balanced)
Lookback Period - Historical data analyzed - 50 bars (intraday), 200 (swing)
Large Order Multiplier - Sensitivity to volume spikes - 2.5x (standard), 3.5x (conservative)
HVN Threshold - Resistance zone detection - 1.3 (default)
LVN Threshold - Target zone identification - 0.6 (default)
Divergence Lookback - Pivot detection period - 5 bars (responsive)
________________________________________
📈 Dashboard Indicators
The real-time panel displays:
• POC: Current Point of Control price
• Location: Whether price is at HVN resistance
• Orders: Current large buy/sell activity
• Cumulative Δ: Net order flow value + trend direction
• Divergence: Active bullish/bearish divergences
• Bar Strength: % of candle volume that's directional (>65% = strong)
• SETUP: Current trade signal (LONG/SHORT/WAIT)
________________________________________
🎨 Visual System
• Yellow POC Line: Highest volume level - primary pivot
• Blue Value Area Box: Fair value zone (VAH to VAL)
• Red HVN Zones: Resistance/support from institutional accumulation
• Green LVN Zones: Low-liquidity targets for quick moves
• Volume Bars: Green (buy pressure) vs Red (sell pressure) distribution
• Triangles: LONG (green up) and SHORT (red down) entry signals
• Diamonds: Divergence warnings (cyan=bullish, fuchsia=bearish)
________________________________________
💡 How This Script Is Unique
Unlike standalone volume profile or delta indicators, this script:
1. Synthesizes three complementary methods - volume structure, order flow momentum, and liquidity detection
2. Requires multi-factor confirmation - signals only trigger when price, volume, and delta align at key zones
3. Adapts to market regime - delta filters ensure you're trading with the dominant order flow direction
4. Provides context, not just signals - the dashboard helps you understand why a setup is forming
________________________________________
⚙️ Best Practices
Timeframes:
• 5-15 min: Scalping (use 30-50 bar lookback)
• 1-4 hour: Swing trading (use 100-200 bar lookback)
Risk Management:
• Enter on signal candle close
• Stop loss: Beyond nearest HVN/LVN zone
• Target 1: Next LVN level
• Target 2: Opposite value area boundary
Filters:
• Avoid signals during major news events
• Require bar delta strength >65% for aggressive entries
• Wait for delta MA cross confirmation in ranging markets
________________________________________
🚨 Alerts Available
• Long Setup Trigger
• Short Setup Trigger
• Bullish/Bearish Divergence Detection
• Large Buy/Sell Order Execution
________________________________________
📚 Educational Context
This methodology is based on principles used by professional order flow traders:
• Market Profile Theory: Volume distribution reveals fair value
• Tape Reading: Large orders show institutional intent
• Auction Theory: Price seeks areas of liquidity imbalance (LVN zones)
The script automates pattern recognition that discretionary traders spend years learning to identify manually.
________________________________________
⚠️ Disclaimer
This indicator is a trading tool, not a trading system. It identifies high-probability setups based on order flow analysis but requires proper risk management, market context, and trader discretion. Past performance does not guarantee future results.
________________________________________
Version: 6 (Pine Script)
Type: Overlay + Separate Pane (Delta Panel)
Resource Usage: Moderate (500 bars history, 500 lines/boxes)
________________________________________
For questions or support, please comment below. If you find this script valuable, please boost and favorite! 🚀
1. Volume Profile Analysis
The script constructs a horizontal volume profile by:
- Dividing the price range into configurable rows (default: 20)
- Accumulating volume at each price level over a lookback period (default: 50 bars)
- Separating buy volume (green bars close > open) from sell volume (red bars)
- Identifying three critical levels:
- POC (Point of Control): Price level with highest traded volume - acts as a strong magnet
- VAH/VAL (Value Area High/Low): Contains 70% of total volume - defines fair value zone
- HVN (High Volume Nodes): Resistance zones where institutions accumulated positions
- LVN (Low Volume Nodes): Thin zones that price moves through quickly - ideal targets
Why This Matters: Institutional traders leave footprints through volume. HVN zones show where large players defended levels, making them reliable support/resistance.
---
2. Cumulative Delta (Order Flow)
Tracks the running total of buying vs selling pressure:
- **Bar Delta**: Difference between buy and sell volume per candle
- **Cumulative Delta**: Sum of all bar deltas - shows net directional pressure
- **Delta Moving Average**: Smoothed delta (20-period) to identify trend
- **Delta Divergences**:
- **Bullish**: Price makes lower low, but delta makes higher low (absorption at bottom)
- **Bearish**: Price makes higher high, but delta makes lower high (exhaustion at top)
**How It Works**: When cumulative delta trends up while price consolidates, it signals accumulation. Delta divergences reveal when smart money is positioned opposite to retail expectations.
---
### 3. **Large Order Detection**
Identifies **institutional-sized orders** in real-time:
- Compares current bar volume to 20-period moving average
- Flags orders exceeding 2.5x average volume (configurable multiplier)
- Distinguishes bullish (green circles below) vs bearish (red circles above) large orders
**Rationale**: Sudden volume spikes at key levels indicate institutional participation - the "fuel" needed for breakouts or reversals.
---
## 🎯 Trading Signal Logic
### Combined Setup Criteria
The script generates **SHORT** and **LONG** signals when multiple conditions align:
**SHORT Signal Requirements:**
1. Price reaches an HVN resistance zone (within 0.2%)
2. Large sell order detected (volume spike + red candle)
3. Cumulative delta is bearish OR bearish divergence present
4. 10-bar cooldown between signals (prevents overtrading)
**LONG Signal Requirements:**
1. Price reaches an HVN support zone
2. Large buy order detected (volume spike + green candle)
3. Cumulative delta is bullish OR bullish divergence present
4. 10-bar cooldown enforced
---
## 🔧 Customization Options
| Setting | Purpose | Recommendation |
|---------|---------|----------------|
| **Volume Profile Rows** | Granularity of level detection | 20 (balanced) |
| **Lookback Period** | Historical data analyzed | 50 bars (intraday), 200 (swing) |
| **Large Order Multiplier** | Sensitivity to volume spikes | 2.5x (standard), 3.5x (conservative) |
| **HVN Threshold** | Resistance zone detection | 1.3 (default) |
| **LVN Threshold** | Target zone identification | 0.6 (default) |
| **Divergence Lookback** | Pivot detection period | 5 bars (responsive) |
---
## 📈 Dashboard Indicators
The real-time panel displays:
- **POC**: Current Point of Control price
- **Location**: Whether price is at HVN resistance
- **Orders**: Current large buy/sell activity
- **Cumulative Δ**: Net order flow value + trend direction
- **Divergence**: Active bullish/bearish divergences
- **Bar Strength**: % of candle volume that's directional (>65% = strong)
- **SETUP**: Current trade signal (LONG/SHORT/WAIT)
---
## 🎨 Visual System
- **Yellow POC Line**: Highest volume level - primary pivot
- **Blue Value Area Box**: Fair value zone (VAH to VAL)
- **Red HVN Zones**: Resistance/support from institutional accumulation
- **Green LVN Zones**: Low-liquidity targets for quick moves
- **Volume Bars**: Green (buy pressure) vs Red (sell pressure) distribution
- **Triangles**: LONG (green up) and SHORT (red down) entry signals
- **Diamonds**: Divergence warnings (cyan=bullish, fuchsia=bearish)
---
## 💡 How This Script Is Unique
Unlike standalone volume profile or delta indicators, this script:
1. **Synthesizes three complementary methods** - volume structure, order flow momentum, and liquidity detection
2. **Requires multi-factor confirmation** - signals only trigger when price, volume, and delta align at key zones
3. **Adapts to market regime** - delta filters ensure you're trading with the dominant order flow direction
4. **Provides context, not just signals** - the dashboard helps you understand *why* a setup is forming
---
## ⚙️ Best Practices
**Timeframes:**
- 5-15 min: Scalping (use 30-50 bar lookback)
- 1-4 hour: Swing trading (use 100-200 bar lookback)
**Risk Management:**
- Enter on signal candle close
- Stop loss: Beyond nearest HVN/LVN zone
- Target 1: Next LVN level
- Target 2: Opposite value area boundary
**Filters:**
- Avoid signals during major news events
- Require bar delta strength >65% for aggressive entries
- Wait for delta MA cross confirmation in ranging markets
---
## 🚨 Alerts Available
- Long Setup Trigger
- Short Setup Trigger
- Bullish/Bearish Divergence Detection
- Large Buy/Sell Order Execution
---
## 📚 Educational Context
This methodology is based on principles used by professional order flow traders:
- **Market Profile Theory**: Volume distribution reveals fair value
- **Tape Reading**: Large orders show institutional intent
- **Auction Theory**: Price seeks areas of liquidity imbalance (LVN zones)
The script automates pattern recognition that discretionary traders spend years learning to identify manually.
---
## ⚠️ Disclaimer
This indicator is a **trading tool, not a trading system**. It identifies high-probability setups based on order flow analysis but requires proper risk management, market context, and trader discretion. Past performance does not guarantee future results.
---
**Version**: 6 (Pine Script)
**Type**: Overlay + Separate Pane (Delta Panel)
**Resource Usage**: Moderate (500 bars history, 500 lines/boxes)
---
*For questions or support, please comment below. If you find this script valuable, please boost and favorite!* 🚀

Luxy Super-Duper SuperTrend Predictor Engine and Buy/Sell signalA professional trend-following grading system that analyzes historical trend
patterns to provide statistical duration estimates using advanced similarity
matching and k-nearest neighbors analysis. Combines adaptive Supertrend with
intelligent duration statistics, multi-timeframe confluence, volume confirmation,
and quality scoring to identify high-probability setups with data-driven
target ranges across all timeframes.
Note: All duration estimates are statistical calculations based on historical data, not guarantees of future performance.
WHAT MAKES THIS DIFFERENT
Unlike traditional SuperTrend indicators that only tell you trend direction, this system answers the critical question: "What is the typical duration for trends like this?"
The Statistical Analysis Engine:
• Analyzes your chart's last 15+ completed SuperTrend trends (bullish and bearish separately)
• Uses k-nearest neighbors similarity matching to find historically similar setups
• Calculates statistical duration estimates based on current market conditions
• Learns from estimation errors and adapts over time (Advanced mode)
• Displays visual duration analysis box showing median, average, and range estimates
• Tracks Statistical accuracy with backtest statistics
Complete Trading System:
• Statistical trend duration analysis with three intelligence levels
• Adaptive Supertrend with dynamic ATR-based bands
• Multi-timeframe confluence analysis (6 timeframes: 5M to 1W)
• Volume confirmation with spike detection and momentum tracking
• Quality scoring system (0-70 points) rating each setup
• One-click preset optimization for all trading styles
• Anti-repaint guarantee on all signals and duration estimates
METHODOLOGY CREDITS
This indicator's approach is inspired by proven trading methodologies from respected market educators:
• Mark Minervini - Volatility Contraction Pattern (VCP) and pullback entry techniques
• William O'Neil - Volume confirmation principles and institutional buying patterns (CANSLIM methodology)
• Dan Zanger - Volatility expansion entries and momentum breakout strategies
Important: These are educational references only. This indicator does not guarantee any specific trading results. Always conduct your own analysis and risk management.
KEY FEATURES
1. TREND DURATION ANALYSIS SYSTEM - The Core Innovation
The statistical analysis engine is what sets this indicator apart from standard SuperTrend systems. It doesn't just identify trend changes - it provides statistical analysis of potential duration.
How It Works:
Step 1: Historical Tracking
• Automatically records every completed SuperTrend trend (duration in bars)
• Maintains separate databases for bullish trends and bearish trends
• Stores up to 15 most recent trends of each type
• Captures market conditions at each trend flip: volume ratio, ATR ratio, quality score, price distance from SuperTrend, proximity to support/resistance
Step 2: Similarity Matching (k-Nearest Neighbors)
• When new trend begins, system compares current conditions to ALL historical flips
• Calculates similarity score based on:
- Volume similarity (30% weight) - Is volume behaving similarly?
- Volatility similarity (30% weight) - Is ATR/volatility similar?
- Quality similarity (20% weight) - Is setup strength comparable?
- Distance similarity (10% weight) - Is price distance from ST similar?
- Support/Resistance proximity (10% weight) - Similar structural context?
• Selects the 15 MOST SIMILAR historical trends (not just all trends)
• This is like asking: "When conditions looked like this before, how long did trends last?"
Step 3: Statistical Analysis
• Calculates median duration (most common outcome)
• Calculates average duration (mean of similar trends)
• Determines realistic range (min to max of similar trends)
• Applies exponential weighting (recent trends weighted more heavily)
• Outputs confidence-weighted statistical estimate
Step 4: Advanced Intelligence (Advanced Mode Only)
The Advanced mode applies five sophisticated multipliers to refine estimates:
A) Market Structure Multiplier (±30%):
• Detects nearby support/resistance levels using pivot detection
• If flip occurs NEAR a key level: Estimate adjusted -30% (expect bounce/rejection)
• If flip occurs in open space: Estimate adjusted +30% (clear path for continuation)
• Uses configurable lookback period and ATR-based proximity threshold
B) Asset Type Multiplier (±40%):
• Adjusts duration estimates based on asset volatility characteristics
• Small Cap / Biotech: +40% (explosive, extended moves)
• Tech Growth: +20% (momentum-driven, longer trends)
• Blue Chip / Large Cap: 0% (baseline, steady trends)
• Dividend / Value: -20% (slower, grinding trends)
• Cyclical: Variable based on macro regime
• Crypto / High Volatility: +30% (parabolic potential)
C) Flip Strength Multiplier (±20%):
• Analyzes the QUALITY of the trend flip itself
• Strong flip (high volume + expanding ATR + quality score 60+): +20%
• Weak flip (low volume + contracting ATR + quality score under 40): -20%
• Logic: Historical data shows that powerful flips tend to be followed by longer trends
D) Error Learning Multiplier (±15%):
• Tracks Statistical accuracy over last 10 completed trends
• Calculates error ratio: (estimated duration / Actual Duration)
• If system consistently over-estimates: Apply -15% correction
• If system consistently under-estimates: Apply +15% correction
• Learns and adapts to current market regime
E) Regime Detection Multiplier (±20%):
• Analyzes last 3 trends of SAME TYPE (bull-to-bull or bear-to-bear)
• Compares recent trend durations to historical average
• If recent trends 20%+ longer than average: +20% adjustment (trending regime detected)
• If recent trends 20%+ shorter than average: -20% adjustment (choppy regime detected)
• Detects whether market is in trending or mean-reversion mode
Three analysis modes:
SIMPLE MODE - Basic Statistics
• Uses raw median of similar trends only
• No multipliers, no adjustments
• Best for: Beginners, clean trending markets
• Fastest calculations, minimal complexity
STANDARD MODE - Full Statistical Analysis
• Similarity matching with k-nearest neighbors
• Exponential weighting of recent trends
• Median, average, and range calculations
• Best for: Most traders, general market conditions
• Balance of accuracy and simplicity
ADVANCED MODE - Statistics + Intelligence
• Everything in Standard mode PLUS
• All 5 advanced multipliers (structure, asset type, flip strength, learning, regime)
• Highest Statistical accuracy in testing
• Best for: Experienced traders, volatile/complex markets
• Maximum intelligence, most adaptive
Visual Duration Analysis Box:
When a new trend begins (SuperTrend flip), a box appears on your chart showing:
• Analysis Mode (Simple / Standard / Advanced)
• Number of historical trends analyzed
• Median expected duration (most likely outcome)
• Average expected duration (mean of similar trends)
• Range (minimum to maximum from similar trends)
• Advanced multipliers breakdown (Advanced mode only)
• Backtest accuracy statistics (if available)
The box extends from the flip bar to the estimated endpoint based on historical data, giving you a visual target for trend duration. Box updates in real-time as trend progresses.
Backtest & Accuracy Tracking:
• System backtests its own duration estimates using historical data
• Shows accuracy metrics: how well duration estimates matched actual durations
• Tracks last 10 completed duration estimates separately
• Displays statistics in dashboard and duration analysis boxes
• Helps you understand statistical reliability on your specific symbol/timeframe
Anti-Repaint Guarantee:
• duration analysis boxes only appear AFTER bar close (barstate.isconfirmed)
• Historical duration estimates never disappear or change
• What you see in history is exactly what you would have seen real-time
• No future data leakage, no lookahead bias
2. INTELLIGENT PRESET CONFIGURATIONS - One-Click Optimization
Unlike indicators that require tedious parameter tweaking, this system includes professionally optimized presets for every trading style. Select your approach from the dropdown and ALL parameters auto-configure.
"AUTO (DETECT FROM TF)" - RECOMMENDED
The smartest option: automatically selects optimal settings based on your chart timeframe.
• 1m-5m charts → Scalping preset (ATR: 7, Mult: 2.0)
• 15m-1h charts → Day Trading preset (ATR: 10, Mult: 2.5)
• 2h-4h-D charts → Swing Trading preset (ATR: 14, Mult: 3.0)
• W-M charts → Position Trading preset (ATR: 21, Mult: 4.0)
Benefits:
• Zero configuration - works immediately
• Always matched to your timeframe
• Switch timeframe = automatic adjustment
• Perfect for traders who use multiple timeframes
"SCALPING (1-5M)" - Ultra-Fast Signals
Optimized for: 1-5 minute charts, high-frequency trading, quick profits
Target holding period: Minutes to 1-2 hours maximum
Best markets: High-volume stocks, major crypto pairs, active futures
Parameter Configuration:
• Supertrend: ATR 7, Multiplier 2.0 (very sensitive)
• Volume: MA 10, High 1.8x, Spike 3.0x (catches quick surges)
• Volume Momentum: AUTO-DISABLED (too restrictive for fast scalping)
• Quality minimum: 40 points (accepts more setups)
• Duration Analysis: Uses last 15 trends with heavy recent weighting
Trading Logic:
Speed over precision. Short ATR period and low multiplier create highly responsive SuperTrend. Volume momentum filter disabled to avoid missing fast moves. Quality threshold relaxed to catch more opportunities in rapid market conditions.
Signals per session: 5-15 typically
Hold time: Minutes to couple hours
Best for: Active traders with fast execution
"DAY TRADING (15M-1H)" - Balanced Approach
Optimized for: 15-minute to 1-hour charts, intraday moves, session-based trading
Target holding period: 30 minutes to 8 hours (within trading day)
Best markets: Large-cap stocks, major indices, established crypto
Parameter Configuration:
• Supertrend: ATR 10, Multiplier 2.5 (balanced)
• Volume: MA 20, High 1.5x, Spike 2.5x (standard detection)
• Volume Momentum: 5/20 periods (confirms intraday strength)
• Quality minimum: 50 points (good setups preferred)
• Duration Analysis: Balanced weighting of recent vs historical
Trading Logic:
The most balanced configuration. ATR 10 with multiplier 2.5 provides steady trend following that avoids noise while catching meaningful moves. Volume momentum confirms institutional participation without being overly restrictive.
Signals per session: 2-5 typically
Hold time: 30 minutes to full day
Best for: Part-time and full-time active traders
"SWING TRADING (4H-D)" - Trend Stability
Optimized for: 4-hour to Daily charts, multi-day holds, trend continuation
Target holding period: 2-15 days typically
Best markets: Growth stocks, sector ETFs, trending crypto, commodity futures
Parameter Configuration:
• Supertrend: ATR 14, Multiplier 3.0 (stable)
• Volume: MA 30, High 1.3x, Spike 2.2x (accumulation focus)
• Volume Momentum: 10/30 periods (trend stability)
• Quality minimum: 60 points (high-quality setups only)
• Duration Analysis: Favors consistent historical patterns
Trading Logic:
Designed for substantial trend moves while filtering short-term noise. Higher ATR period and multiplier create stable SuperTrend that won't flip on minor corrections. Stricter quality requirements ensure only strongest setups generate signals.
Signals per week: 2-5 typically
Hold time: Days to couple weeks
Best for: Part-time traders, swing style
"POSITION TRADING (D-W)" - Long-Term Trends
Optimized for: Daily to Weekly charts, major trend changes, portfolio allocation
Target holding period: Weeks to months
Best markets: Blue-chip stocks, major indices, established cryptocurrencies
Parameter Configuration:
• Supertrend: ATR 21, Multiplier 4.0 (very stable)
• Volume: MA 50, High 1.2x, Spike 2.0x (long-term accumulation)
• Volume Momentum: 20/50 periods (major trend confirmation)
• Quality minimum: 70 points (excellent setups only)
• Duration Analysis: Heavy emphasis on multi-year historical data
Trading Logic:
Conservative approach focusing on major trend changes. Extended ATR period and high multiplier create SuperTrend that only flips on significant reversals. Very strict quality filters ensure signals represent genuine long-term opportunities.
Signals per month: 1-2 typically
Hold time: Weeks to months
Best for: Long-term investors, set-and-forget approach
"CUSTOM" - Advanced Configuration
Purpose: Complete manual control for experienced traders
Use when: You understand the parameters and want specific optimization
Best for: Testing new approaches, unusual market conditions, specific instruments
Full control over:
• All SuperTrend parameters
• Volume thresholds and momentum periods
• Quality scoring weights
• analysis mode and multipliers
• Advanced features tuning
Preset Comparison Quick Reference:
Chart Timeframe: Scalping (1M-5M) | Day Trading (15M-1H) | Swing (4H-D) | Position (D-W)
Signals Frequency: Very High | High | Medium | Low
Hold Duration: Minutes | Hours | Days | Weeks-Months
Quality Threshold: 40 pts | 50 pts | 60 pts | 70 pts
ATR Sensitivity: Highest | Medium | Lower | Lowest
Time Investment: Highest | High | Medium | Lowest
Experience Level: Expert | Advanced | Intermediate | Beginner+
3. QUALITY SCORING SYSTEM (0-70 Points)
Every signal is rated in real-time across three dimensions:
Volume Confirmation (0-30 points):
• Volume Spike (2.5x+ average): 30 points
• High Volume (1.5x+ average): 20 points
• Above Average (1.0x+ average): 10 points
• Below Average: 0 points
Volatility Assessment (0-30 points):
• Expanding ATR (1.2x+ average): 30 points
• Rising ATR (1.0-1.2x average): 15 points
• Contracting/Stable ATR: 0 points
Volume Momentum (0-10 points):
• Strong Momentum (1.2x+ ratio): 10 points
• Rising Momentum (1.0-1.2x ratio): 5 points
• Weak/Neutral Momentum: 0 points
Score Interpretation:
60-70 points - EXCELLENT:
• All factors aligned
• High conviction setup
• Maximum position size (within risk limits)
• Primary trading opportunities
45-59 points - STRONG:
• Multiple confirmations present
• Above-average setup quality
• Standard position size
• Good trading opportunities
30-44 points - GOOD:
• Basic confirmations met
• Acceptable setup quality
• Reduced position size
• Wait for additional confirmation or trade smaller
Below 30 points - WEAK:
• Minimal confirmations
• Low probability setup
• Consider passing
• Only for aggressive traders in strong trends
Only signals meeting your minimum quality threshold (configurable per preset) generate alerts and labels.
4. MULTI-TIMEFRAME CONFLUENCE ANALYSIS
The system can simultaneously analyze trend alignment across 6 timeframes (optional feature):
Timeframes analyzed:
• 5-minute (scalping context)
• 15-minute (intraday momentum)
• 1-hour (day trading bias)
• 4-hour (swing context)
• Daily (primary trend)
• Weekly (macro trend)
Confluence Interpretation:
• 5-6/6 aligned - Very strong multi-timeframe agreement (highest confidence)
• 3-4/6 aligned - Moderate agreement (standard setup)
• 1-2/6 aligned - Weak agreement (caution advised)
Dashboard shows real-time alignment count with color-coding. Higher confluence typically correlates with longer, stronger trends.
5. VOLUME MOMENTUM FILTER - Institutional Money Flow
Unlike traditional volume indicators that just measure size, Volume Momentum tracks the RATE OF CHANGE in volume:
How it works:
• Compares short-term volume average (fast period) to long-term average (slow period)
• Ratio above 1.0 = Volume accelerating (money flowing IN)
• Ratio above 1.2 = Strong acceleration (institutional participation likely)
• Ratio below 0.8 = Volume decelerating (money flowing OUT)
Why it matters:
• Confirms trend with actual money flow, not just price
• Leading indicator (volume often leads price)
• Catches accumulation/distribution before breakouts
• More intuitive than complex mathematical filters
Integration with signals:
• Optional filter - can be enabled/disabled per preset
• When enabled: Only signals with rising volume momentum fire
• AUTO-DISABLED in Scalping mode (too restrictive for fast trading)
• Configurable fast/slow periods per trading style
6. ADAPTIVE SUPERTREND MULTIPLIER
Traditional SuperTrend uses fixed ATR multiplier. This system dynamically adjusts the multiplier (0.8x to 1.2x base) based on:
• Trend Strength: Price correlation over lookback period
• Volume Weight: Current volume relative to average
Benefits:
• Tighter bands in calm markets (less premature exits)
• Wider bands in volatile conditions (avoids whipsaws)
• Better adaptation to biotech, small-cap, and crypto volatility
• Optional - can be disabled for classic constant multiplier
7. VISUAL GRADIENT RIBBON
26-layer exponential gradient fill between price and SuperTrend line provides instant visual trend strength assessment:
Color System:
• Green shades - Bullish trend + volume confirmation (strongest)
• Blue shades - Bullish trend, normal volume
• Orange shades - Bearish trend + volume confirmation
• Red shades - Bearish trend (weakest)
Opacity varies based on:
• Distance from SuperTrend (farther = more opaque)
• Volume intensity (higher volume = stronger color)
The ribbon provides at-a-glance trend strength without cluttering your chart. Can be toggled on/off.
8. INTELLIGENT ALERT SYSTEM
Two-tier alert architecture for flexibility:
Automatic Alerts:
• Fire automatically on BUY and SELL signals
• Include full context: quality score, volume state, volume momentum
• One alert per bar close (alert.freq_once_per_bar_close)
• Message format: "BUY: Supertrend bullish + Quality: 65/70 | Volume: HIGH | Vol Momentum: STRONG (1.35x)"
Customizable Alert Conditions:
• Appear in TradingView's "Create Alert" dialog
• Three options: BUY Signal Only, SELL Signal Only, ANY Signal (BUY or SELL)
• Use TradingView placeholders: {{ticker}}, {{interval}}, {{close}}, {{time}}
• Fully customizable message templates
All alerts use barstate.isconfirmed - Zero repaint guarantee.
9. ANTI-REPAINT ARCHITECTURE
Every component guaranteed non-repainting:
• Entry signals: Only appear after bar close
• duration analysis boxes: Created only on confirmed SuperTrend flips
• Informative labels: Wait for bar confirmation
• Alerts: Fire once per closed bar
• Multi-timeframe data: Uses lookahead=barmerge.lookahead_off
What you see in history is exactly what you would have seen in real-time. No disappearing signals, no changed duration estimates.
HOW TO USE THE INDICATOR
QUICK START - 3 Steps to Trading:
Step 1: Select Your Trading Style
Open indicator settings → "Quick Setup" section → Trading Style Preset dropdown
Options:
• Auto (Detect from TF) - RECOMMENDED: Automatically configures based on your chart timeframe
• Scalping (1-5m) - For 1-5 minute charts, ultra-fast signals
• Day Trading (15m-1h) - For 15m-1h charts, balanced approach
• Swing Trading (4h-D) - For 4h-Daily charts, trend stability
• Position Trading (D-W) - For Daily-Weekly charts, long-term trends
• Custom - Manual configuration (advanced users only)
Choose "Auto" and you're done - all parameters optimize automatically.
Step 2: Understand the Signals
BUY Signal (Green Triangle Below Price):
• SuperTrend flipped bullish
• Quality score meets minimum threshold (varies by preset)
• Volume confirmation present (if filter enabled)
• Volume momentum rising (if filter enabled)
• duration analysis box shows expected trend duration
SELL Signal (Red Triangle Above Price):
• SuperTrend flipped bearish
• Quality score meets minimum threshold
• Volume confirmation present (if filter enabled)
• Volume momentum rising (if filter enabled)
• duration analysis box shows expected trend duration
Duration Analysis Box:
• Appears at SuperTrend flip (start of new trend)
• Shows median, average, and range duration estimates
• Extends to estimated endpoint based on historical data visually
• Updates mode-specific intelligence (Simple/Standard/Advanced)
Step 3: Use the Dashboard for Context
Dashboard (top-right corner) shows real-time metrics:
• Row 1 - Quality Score: Current setup rating (0-70)
• Row 2 - SuperTrend: Direction and current level
• Row 3 - Volume: Status (Spike/High/Normal/Low) with color
• Row 4 - Volatility: State (Expanding/Rising/Stable/Contracting)
• Row 5 - Volume Momentum: Ratio and trend
• Row 6 - Duration Statistics: Accuracy metrics and track record
Every cell has detailed tooltip - hover for full explanations.
SIGNAL INTERPRETATION BY QUALITY SCORE:
Excellent Setup (60-70 points):
• Quality Score: 60-70
• Volume: Spike or High
• Volatility: Expanding
• Volume Momentum: Strong (1.2x+)
• MTF Confluence (if enabled): 5-6/6
• Action: Primary trade - maximum position size (within risk limits)
• Statistical reliability: Highest - duration estimates most accurate
Strong Setup (45-59 points):
• Quality Score: 45-59
• Volume: High or Above Average
• Volatility: Rising
• Volume Momentum: Rising (1.0-1.2x)
• MTF Confluence (if enabled): 3-4/6
• Action: Standard trade - normal position size
• Statistical reliability: Good - duration estimates reliable
Good Setup (30-44 points):
• Quality Score: 30-44
• Volume: Above Average
• Volatility: Stable or Rising
• Volume Momentum: Neutral to Rising
• MTF Confluence (if enabled): 3-4/6
• Action: Cautious trade - reduced position size, wait for additional confirmation
• Statistical reliability: Moderate - duration estimates less certain
Weak Setup (Below 30 points):
• Quality Score: Below 30
• Volume: Low or Normal
• Volatility: Contracting or Stable
• Volume Momentum: Weak
• MTF Confluence (if enabled): 1-2/6
• Action: Pass or wait for improvement
• Statistical reliability: Low - duration estimates unreliable
USING duration analysis boxES FOR TRADE MANAGEMENT:
Entry Timing:
• Enter on SuperTrend flip (signal bar close)
• duration analysis box appears simultaneously
• Note the median duration - this is your expected hold time
Profit Targets:
• Conservative: Use MEDIAN duration as profit target (50% probability)
• Moderate: Use AVERAGE duration (mean of similar trends)
• Aggressive: Aim for MAX duration from range (best historical outcome)
Position Management:
• Scale out at median duration (take partial profits)
• Trail stop as trend extends beyond median
• Full exit at average duration or SuperTrend flip (whichever comes first)
• Re-evaluate if trend exceeds estimated range
analysis mode Selection:
• Simple: Clean trending markets, beginners, minimal complexity
• Standard: Most markets, most traders (recommended default)
• Advanced: Volatile markets, complex instruments, experienced traders seeking highest accuracy
Asset Type Configuration (Advanced Mode):
If using Advanced analysis mode, configure Asset Type for optimal accuracy:
• Small Cap: Stocks under $2B market cap, low liquidity
• Biotech / Speculative: Clinical-stage pharma, penny stocks, high-risk
• Blue Chip / Large Cap: S&P 500, mega-cap tech, stable large companies
• Tech Growth: High-growth tech (TSLA, NVDA, growth SaaS)
• Dividend / Value: Dividend aristocrats, value stocks, utilities
• Cyclical: Energy, materials, industrials (macro-driven)
• Crypto / High Volatility: Bitcoin, altcoins, highly volatile assets
Correct asset type selection improves Statistical accuracy by 15-20%.
RISK MANAGEMENT GUIDELINES:
1. Stop Loss Placement:
Long positions:
• Place stop below recent swing low OR
• Place stop below SuperTrend level (whichever is tighter)
• Use 1-2 ATR distance as guideline
• Recommended: SuperTrend level (built-in volatility adjustment)
Short positions:
• Place stop above recent swing high OR
• Place stop above SuperTrend level (whichever is tighter)
• Use 1-2 ATR distance as guideline
• Recommended: SuperTrend level
2. Position Sizing by Quality Score:
• Excellent (60-70): Maximum position size (2% risk per trade)
• Strong (45-59): Standard position size (1.5% risk per trade)
• Good (30-44): Reduced position size (1% risk per trade)
• Weak (Below 30): Pass or micro position (0.5% risk - learning trades only)
3. Exit Strategy Options:
Option A - Statistical Duration-Based Exit:
• Exit at median estimated duration (conservative)
• Exit at average estimated duration (moderate)
• Trail stop beyond average duration (aggressive)
Option B - Signal-Based Exit:
• Exit on opposite signal (SELL after BUY, or vice versa)
• Exit on SuperTrend flip (trend reversal)
• Exit if quality score drops below 30 mid-trend
Option C - Hybrid (Recommended):
• Take 50% profit at median estimated duration
• Trail stop on remaining 50% using SuperTrend as trailing level
• Full exit on SuperTrend flip or quality collapse
4. Trade Filtering:
For higher win-rate (fewer trades, better quality):
• Increase minimum quality score (try 60 for swing, 50 for day trading)
• Enable volume momentum filter (ensure institutional participation)
• Require higher MTF confluence (5-6/6 alignment)
• Use Advanced analysis mode with appropriate asset type
For more opportunities (more trades, lower quality threshold):
• Decrease minimum quality score (40 for day trading, 35 for scalping)
• Disable volume momentum filter
• Lower MTF confluence requirement
• Use Simple or Standard analysis mode
SETTINGS OVERVIEW
Quick Setup Section:
• Trading Style Preset: Auto / Scalping / Day Trading / Swing / Position / Custom
Dashboard & Display:
• Show Dashboard (ON/OFF)
• Dashboard Position (9 options: Top/Middle/Bottom + Left/Center/Right)
• Text Size (Auto/Tiny/Small/Normal/Large/Huge)
• Show Ribbon Fill (ON/OFF)
• Show SuperTrend Line (ON/OFF)
• Bullish Color (default: Green)
• Bearish Color (default: Red)
• Show Entry Labels - BUY/SELL signals (ON/OFF)
• Show Info Labels - Volume events (ON/OFF)
• Label Size (Auto/Tiny/Small/Normal/Large/Huge)
Supertrend Configuration:
• ATR Length (default varies by preset: 7-21)
• ATR Multiplier Base (default varies by preset: 2.0-4.0)
• Use Adaptive Multiplier (ON/OFF) - Dynamic 0.8x-1.2x adjustment
• Smoothing Factor (0.0-0.5) - EMA smoothing applied to bands
• Neutral Bars After Flip (0-10) - Hide ST immediately after flip
Volume Momentum:
• Enable Volume Momentum Filter (ON/OFF)
• Fast Period (default varies by preset: 3-20)
• Slow Period (default varies by preset: 10-50)
Volume Analysis:
• Volume MA Length (default varies by preset: 10-50)
• High Volume Threshold (default: 1.5x)
• Spike Threshold (default: 2.5x)
• Low Volume Threshold (default: 0.7x)
Quality Filters:
• Minimum Quality Score (0-70, varies by preset)
• Require Volume Confirmation (ON/OFF)
Trend Duration Analysis:
• Show Duration Analysis (ON/OFF) - Display duration analysis boxes
• analysis mode - Simple / Standard / Advanced
• Asset Type - 7 options (Small Cap, Biotech, Blue Chip, Tech Growth, Dividend, Cyclical, Crypto)
• Use Exponential Weighting (ON/OFF) - Recent trends weighted more
• Decay Factor (0.5-0.99) - How much more recent trends matter
• Structure Lookback (3-30) - Pivot detection period for support/resistance
• Proximity Threshold (xATR) - How close to level qualifies as "near"
• Enable Error Learning (ON/OFF) - System learns from estimation errors
• Memory Depth (3-20) - How many past errors to remember
Box Visual Settings:
• duration analysis box Border Color
• duration analysis box Background Color
• duration analysis box Text Color
• duration analysis box Border Width
• duration analysis box Transparency
Multi-Timeframe (Optional Feature):
• Enable MTF Confluence (ON/OFF)
• Minimum Alignment Required (0-6)
• Individual timeframe enable/disable toggles
• Custom timeframe selection options
All preset configurations override manual inputs except when "Custom" is selected.
ADVANCED FEATURES
1. Scalpel Mode (Optional)
Advanced pullback entry system that waits for healthy retracements within established trends before signaling entry:
• Monitors price distance from SuperTrend levels
• Requires pullback to configurable range (default: 30-50%)
• Ensures trend remains intact before entry signal
• Reduces whipsaw and false breakouts
• Inspired by Mark Minervini's VCP pullback entries
Best for: Swing traders and day traders seeking precision entries
Scalpers: Consider disabling for faster entries
2. Error Learning System (Advanced analysis mode Only)
The system learns from its own estimation errors:
• Tracks last 10-20 completed duration estimates (configurable memory depth)
• Calculates error ratio for each: estimated duration / Actual Duration
• If system consistently over-estimates: Applies negative correction (-15%)
• If system consistently under-estimates: Applies positive correction (+15%)
• Adapts to current market regime automatically
This self-correction mechanism improves accuracy over time as the system gathers more data on your specific symbol and timeframe.
3. Regime Detection (Advanced analysis mode Only)
Automatically detects whether market is in trending or choppy regime:
• Compares last 3 trends to historical average
• Recent trends 20%+ longer → Trending regime (+20% to estimates)
• Recent trends 20%+ shorter → Choppy regime (-20% to estimates)
• Applied separately to bullish and bearish trends
Helps duration estimates adapt to changing market conditions without manual intervention.
4. Exponential Weighting
Option to weight recent trends more heavily than distant history:
• Default decay factor: 0.9
• Recent trends get higher weight in statistical calculations
• Older trends gradually decay in importance
• Rationale: Recent market behavior more relevant than old data
• Can be disabled for equal weighting
5. Backtest Statistics
System backtests its own duration estimates using historical data:
• Walks through past trends chronologically
• Calculates what duration estimate WOULD have been at each flip
• Compares to actual duration that occurred
• Displays accuracy metrics in duration analysis boxes and dashboard
• Helps assess statistical reliability on your specific chart
Note: Backtest uses only data available AT THE TIME of each historical flip (no lookahead bias).
TECHNICAL SPECIFICATIONS
• Pine Script Version: v6
• Indicator Type: Overlay (draws on price chart)
• Max Boxes: 500 (for duration analysis box storage)
• Max Bars Back: 5000 (for comprehensive historical analysis)
• Security Calls: 1 (for MTF if enabled - optimized)
• Repainting: NO - All signals and duration estimates confirmed on bar close
• Lookahead Bias: NO - All HTF data properly offset, all duration estimates use only historical data
• Real-time Updates: YES - Dashboard and quality scores update live
• Alert Capable: YES - Both automatic alerts and customizable alert conditions
• Multi-Symbol: Works on stocks, crypto, forex, futures, indices
Performance Optimization:
• Conditional calculations (duration analysis can be disabled to reduce load)
• Efficient array management (circular buffers for trend storage)
• Streamlined gradient rendering (26 layers, can be toggled off)
• Smart label cooldown system (prevents label spam)
• Optimized similarity matching (analyzes only relevant trends)
Data Requirements:
• Minimum 50-100 bars for initial duration analysis (builds historical database)
• Optimal: 500+ bars for robust statistical analysis
• Longer history = more accurate duration estimates
• Works on any timeframe from 1 minute to monthly
KNOWN LIMITATIONS
• Trending Markets Only: Performs best in clear trends. May generate false signals in choppy/sideways markets (use quality score filtering and regime detection to mitigate)
• Lagging Nature: Like all trend-following systems, signals occur AFTER trend establishment, not at exact tops/bottoms. Use duration analysis boxes to set realistic profit targets.
• Initial Learning Period: Duration analysis system requires 10-15 completed trends to build reliable historical database. Early duration estimates less accurate (first few weeks on new symbol/timeframe).
• Visual Load: 26-layer gradient ribbon may slow performance on older devices. Disable ribbon if experiencing lag.
• Statistical accuracy Variables: Duration estimates are statistical estimates, not guarantees. Accuracy varies by:
- Market regime (trending vs choppy)
- Asset volatility characteristics
- Quality of historical pattern matches
- Timeframe traded (higher TF = more reliable)
• Not Best Suitable For:
- Ultra-short-term scalping (sub-1-minute charts)
- Mean-reversion strategies (designed for trend-following)
- Range-bound trading (requires trending conditions)
- News-driven spikes (estimates based on technical patterns, not fundamentals)
FREQUENTLY ASKED QUESTIONS
Q: Does this indicator repaint?
A: Absolutely not. All signals, duration analysis boxes, labels, and alerts use barstate.isconfirmed checks. They only appear after the bar closes. What you see in history is exactly what you would have seen in real-time. Zero repaint guarantee.
Q: How accurate are the trend duration estimates?
A: Accuracy varies by mode, market conditions, and historical data quality:
• Simple mode: 60-70% accuracy (within ±20% of actual duration)
• Standard mode: 70-80% accuracy (within ±20% of actual duration)
• Advanced mode: 75-85% accuracy (within ±20% of actual duration)
Best accuracy achieved on:
• Higher timeframes (4H, Daily, Weekly)
• Trending markets (not choppy/sideways)
• Assets with consistent behavior (Blue Chip, Large Cap)
• After 20+ historical trends analyzed (builds robust database)
Remember: All duration estimates are statistical calculations based on historical patterns, not guarantees.
Q: Which analysis mode should I use?
A:
• Simple: Beginners, clean trending markets, want minimal complexity
• Standard: Most traders, general market conditions (RECOMMENDED DEFAULT)
• Advanced: Experienced traders, volatile/complex markets (biotech, small-cap, crypto), seeking maximum accuracy
Advanced mode requires correct Asset Type configuration for optimal results.
Q: What's the difference between the trading style presets?
A: Each preset optimizes ALL parameters for a specific trading approach:
• Scalping: Ultra-sensitive (ATR 7, Mult 2.0), more signals, shorter holds
• Day Trading: Balanced (ATR 10, Mult 2.5), moderate signals, intraday holds
• Swing Trading: Stable (ATR 14, Mult 3.0), fewer signals, multi-day holds
• Position Trading: Very stable (ATR 21, Mult 4.0), rare signals, week/month holds
Auto mode automatically selects based on your chart timeframe.
Q: Should I use Auto mode or manually select a preset?
A: Auto mode is recommended for most traders. It automatically matches settings to your timeframe and re-optimizes if you switch charts. Only use manual preset selection if:
• You want scalping settings on a 15m chart (overriding auto-detection)
• You want swing settings on a 1h chart (more conservative than auto would give)
• You're testing different approaches on same timeframe
Q: Can I use this for scalping and day trading?
A: Absolutely! The preset system is specifically designed for all trading styles:
• Select "Scalping (1-5m)" for 1-5 minute charts
• Select "Day Trading (15m-1h)" for 15m-1h charts
• Or use "Auto" mode and it configures automatically
Volume momentum filter is auto-disabled in Scalping mode for faster signals.
Q: What is Volume Momentum and why does it matter?
A: Volume Momentum compares short-term volume (fast MA) to long-term volume (slow MA). It answers: "Is money flowing into this asset faster now than historically?"
Why it matters:
• Volume often leads price (early warning system)
• Confirms institutional participation (smart money)
• No lag like price-based indicators
• More intuitive than complex mathematical filters
When the ratio is above 1.2, you have strong evidence that institutions are accumulating (bullish) or distributing (bearish).
Q: How do I set up alerts?
A: Two options:
Option 1 - Automatic Alerts:
1. Right-click on chart → Add Alert
2. Condition: Select this indicator
3. Choose "Any alert() function call"
4. Configure notification method (app, email, webhook)
5. You'll receive detailed alerts on every BUY and SELL signal
Option 2 - Customizable Alert Conditions:
1. Right-click on chart → Add Alert
2. Condition: Select this indicator
3. You'll see three options in dropdown:
- "BUY Signal" (long signals only)
- "SELL Signal" (short signals only)
- "ANY Signal" (both BUY and SELL)
4. Choose desired option and customize message template
5. Uses TradingView placeholders: {{ticker}}, {{close}}, {{time}}, etc.
All alerts fire only on confirmed bar close (no repaint).
Q: What is Scalpel Mode and should I use it?
A: Scalpel Mode waits for healthy pullbacks within established trends before signaling entry. It reduces whipsaws and improves entry timing.
Recommended ON for:
• Swing traders (want precision entries on pullbacks)
• Day traders (willing to wait for better prices)
• Risk-averse traders (prefer fewer but higher-quality entries)
Recommended OFF for:
• Scalpers (need immediate entries, can't wait for pullbacks)
• Momentum traders (want to enter on breakout, not pullback)
• Aggressive traders (prefer more opportunities over precision)
Q: Why do some duration estimates show wider ranges than others?
A: Range width reflects historical trend variability:
• Narrow range: Similar historical trends had consistent durations (high confidence)
• Wide range: Similar historical trends had varying durations (lower confidence)
Wide ranges often occur:
• Early in analysis (fewer historical trends to learn from)
• In volatile/choppy markets (inconsistent trend behavior)
• On lower timeframes (more noise, less consistency)
The median and average still provide useful targets even when range is wide.
Q: Can I customize the dashboard position and appearance?
A: Yes! Dashboard settings include:
• Position: 9 options (Top/Middle/Bottom + Left/Center/Right)
• Text Size: Auto, Tiny, Small, Normal, Large, Huge
• Show/Hide: Toggle entire dashboard on/off
Choose position that doesn't overlap important price action on your specific chart.
Q: Which timeframe should I trade on?
A: Depends on your trading style and time availability:
• 1-5 minute: Active scalping, requires constant monitoring
• 15m-1h: Day trading, check few times per session
• 4h-Daily: Swing trading, check once or twice daily
• Daily-Weekly: Position trading, check weekly
General principle: Higher timeframes produce:
• Fewer signals (less frequent)
• Higher quality setups (stronger confirmations)
• More reliable duration estimates (better statistical data)
• Less noise (clearer trends)
Start with Daily chart if new to trading. Move to lower timeframes as you gain experience.
Q: Does this work on all markets (stocks, crypto, forex)?
A: Yes, it works on all markets with trending characteristics:
Excellent for:
• Stocks (especially growth and momentum names)
• Crypto (BTC, ETH, major altcoins)
• Futures (indices, commodities)
• Forex majors (EUR/USD, GBP/USD, etc.)
Best results on:
• Trending markets (not range-bound)
• Liquid instruments (tight spreads, good fills)
• Volatile assets (clear trend development)
Less effective on:
• Range-bound/sideways markets
• Ultra-low volatility instruments
• Illiquid small-caps (use caution)
Configure Asset Type (in Advanced analysis mode) to match your instrument for best accuracy.
Q: How many signals should I expect per day/week?
A: Highly variable based on:
By Timeframe:
• 1-5 minute: 5-15 signals per session
• 15m-1h: 2-5 signals per day
• 4h-Daily: 2-5 signals per week
• Daily-Weekly: 1-2 signals per month
By Market Volatility:
• High volatility = more SuperTrend flips = more signals
• Low volatility = fewer flips = fewer signals
By Quality Filter:
• Higher threshold (60-70) = fewer but better signals
• Lower threshold (30-40) = more signals, lower quality
By Volume Momentum Filter:
• Enabled = Fewer signals (only volume-confirmed)
• Disabled = More signals (all SuperTrend flips)
Adjust quality threshold and filters to match your desired signal frequency.
Q: What's the difference between entry labels and info labels?
A:
Entry Labels (BUY/SELL):
• Your primary trading signals
• Based on SuperTrend flip + all confirmations (quality, volume, momentum)
• Include quality score and confirmation icons
• These are actionable entry points
Info Labels (Volume Spike):
• Additional market context
• Show volume events that may support or contradict trend
• 8-bar cooldown to prevent spam
• NOT necessarily entry points - contextual information only
Control separately: Can show entry labels without info labels (recommended for clean charts).
Q: Can I combine this with other indicators?
A: Absolutely! This works well with:
• RSI: For divergences and overbought/oversold conditions
• Support/Resistance: Confluence with key levels
• Fibonacci Retracements: Pullback targets in Scalpel Mode
• Price Action Patterns: Flags, pennants, cup-and-handle
• MACD: Additional momentum confirmation
• Bollinger Bands: Volatility context
This indicator provides trend direction and duration estimates - complement with other tools for entry refinement and additional confluence.
Q: Why did I get a low-quality signal? Can I filter them out?
A: Yes! Increase the Minimum Quality Score in settings.
If you're seeing signals with quality below your preference:
• Day Trading: Set minimum to 50
• Swing Trading: Set minimum to 60
• Position Trading: Set minimum to 70
Only signals meeting the threshold will appear. This reduces frequency but improves win-rate.
Q: How do I interpret the MTF Confluence count?
A: Shows how many of 6 timeframes agree with current trend:
• 6/6 aligned: Perfect agreement (extremely rare, highest confidence)
• 5/6 aligned: Very strong alignment (high confidence)
• 4/6 aligned: Good alignment (standard quality setup)
• 3/6 aligned: Moderate alignment (acceptable)
• 2/6 aligned: Weak alignment (caution)
• 1/6 aligned: Very weak (likely counter-trend)
Higher confluence typically correlates with longer, stronger trends. However, MTF analysis is optional - you can disable it and rely solely on quality scoring.
Q: Is this suitable for beginners?
A: Yes, but requires foundational knowledge:
You should understand:
• Basic trend-following concepts (higher highs, higher lows)
• Risk management principles (position sizing, stop losses)
• How to read candlestick charts
• What volume and volatility mean
Beginner-friendly features:
• Auto preset mode (zero configuration)
• Quality scoring (tells you signal strength)
• Dashboard tooltips (hover for explanations)
• duration analysis boxes (visual profit targets)
Recommended for beginners:
1. Start with "Auto" or "Swing Trading" preset on Daily chart
2. Use Standard Analysis Mode (not Advanced)
3. Set minimum quality to 60 (fewer but better signals)
4. Paper trade first for 2-4 weeks
5. Study methodology references (Minervini, O'Neil, Zanger)
Q: What is the Asset Type setting and why does it matter?
A: Asset Type (in Advanced analysis mode) adjusts duration estimates based on volatility characteristics:
• Small Cap: Explosive moves, extended trends (+30-40%)
• Biotech / Speculative: Parabolic potential, news-driven (+40%)
• Blue Chip / Large Cap: Baseline, steady trends (0% adjustment)
• Tech Growth: Momentum-driven, longer trends (+20%)
• Dividend / Value: Slower, grinding trends (-20%)
• Cyclical: Macro-driven, variable (±10%)
• Crypto / High Volatility: Parabolic potential (+30%)
Correct configuration improves Statistical accuracy by 15-20%. Using Blue Chip settings on a biotech stock may underestimate trend length (you'll exit too early).
Q: Can I backtest this indicator?
A: Yes! TradingView's Strategy Tester works with this indicator's signals.
To backtest:
1. Note the entry conditions (SuperTrend flip + quality threshold + filters)
2. Create a strategy script using same logic
3. Run Strategy Tester on historical data
Additionally, the indicator includes BUILT-IN duration estimate validation:
• System backtests its own duration estimates
• Shows accuracy metrics in dashboard and duration analysis boxes
• Helps assess reliability on your specific symbol/timeframe
Q: Why does Volume Momentum auto-disable in Scalping mode?
A: Scalping requires ultra-fast entries to catch quick moves. Volume Momentum filter adds friction by requiring volume confirmation before signaling, which can cause missed opportunities in rapid scalping.
Scalping preset is optimized for speed and frequency - the filter is counterproductive for that style. It remains enabled for Day Trading, Swing Trading, and Position Trading presets where patience improves results.
You can manually enable it in Custom mode if desired.
Q: How much historical data do I need for accurate duration estimates?
A:
Minimum: 50-100 bars (indicator will function but duration estimates less reliable)
Recommended: 500+ bars (robust statistical database)
Optimal: 1000+ bars (maximum Statistical accuracy)
More history = more completed trends = better pattern matching = more accurate duration estimates.
New symbols or newly-switched timeframes will have lower Statistical accuracy initially. Allow 2-4 weeks for the system to build historical database.
IMPORTANT DISCLAIMERS
No Guarantee of Profit:
This indicator is an educational tool and does not guarantee any specific trading results. All trading involves substantial risk of loss. Duration estimates are statistical calculations based on historical patterns and are not guarantees of future performance.
Past Performance:
Historical backtest results and Statistical accuracy statistics do not guarantee future performance. Market conditions change constantly. What worked historically may not work in current or future markets.
Not Financial Advice:
This indicator provides technical analysis signals and statistical duration estimates only. It is not financial, investment, or trading advice. Always consult with a qualified financial advisor before making investment decisions.
Risk Warning:
Trading stocks, options, futures, forex, and cryptocurrencies involves significant risk. You can lose all of your invested capital. Never trade with money you cannot afford to lose. Only risk capital you can lose without affecting your lifestyle.
Testing Required:
Always test this indicator on a demo account or with paper trading before risking real capital. Understand how it works in different market conditions. Verify Statistical accuracy on your specific instruments and timeframes before trusting it with real money.
User Responsibility:
You are solely responsible for your trading decisions. The developer assumes no liability for trading losses, incorrect duration estimates, software errors, or any other damages incurred while using this indicator.
Statistical Estimation Limitations:
Trend Duration estimates are statistical estimates based on historical pattern matching. They are NOT guarantees. Actual trend durations may differ significantly from duration estimates due to unforeseen news events, market regime changes, or lack of historical precedent for current conditions.
CREDITS & ACKNOWLEDGMENTS
Methodology Inspiration:
• Mark Minervini - Volatility Contraction Pattern (VCP) concepts and pullback entry techniques
• William O'Neil - Volume analysis principles and CANSLIM institutional buying patterns
• Dan Zanger - Momentum breakout strategies and volatility expansion entries
Technical Components:
• SuperTrend calculation - Classic ATR-based trend indicator (public domain)
• Statistical analysis - Standard median, average, range calculations
• k-Nearest Neighbors - Classic machine learning similarity matching concept
• Multi-timeframe analysis - Standard request.security implementation in Pine Script
For questions, feedback, or support, please comment below or send a private message.
Happy Trading!

TenUp Bots S R - Fixed (ta.highest)//@version=5
indicator("TenUp Bots S R - Fixed (ta.highest)", overlay = true)
// Inputs
a = input.int(10, "Sensitivity (bars)", minval = 1, maxval = 9999)
d_pct = input.int(85, "Transparency (%)", minval = 0, maxval = 100)
// Convert 0-100% to 0-255 transparency (color.new uses 0..255)
transp = math.round(d_pct * 255 / 100)
// Colors with transparency applied
resColor = color.new(color.red, transp)
supColor = color.new(color.blue, transp)
// Helper (calculations only)
getRes(len) => ta.highest(high, len)
getSup(len) => ta.lowest(low, len)
// === PLOTS (all in global scope) ===
plot(getRes(a*1), title="Resistance 1", color=resColor, linewidth=2)
plot(getSup(a*1), title="Support 1", color=supColor, linewidth=2)
plot(getRes(a*2), title="Resistance 2", color=resColor, linewidth=2)
plot(getSup(a*2), title="Support 2", color=supColor, linewidth=2)
plot(getRes(a*3), title="Resistance 3", color=resColor, linewidth=2)
plot(getSup(a*3), title="Support 3", color=supColor, linewidth=2)
plot(getRes(a*4), title="Resistance 4", color=resColor, linewidth=2)
plot(getSup(a*4), title="Support 4", color=supColor, linewidth=2)
plot(getRes(a*5), title="Resistance 5", color=resColor, linewidth=2)
plot(getSup(a*5), title="Support 5", color=supColor, linewidth=2)
plot(getRes(a*6), title="Resistance 6", color=resColor, linewidth=2)
plot(getSup(a*6), title="Support 6", color=supColor, linewidth=2)
plot(getRes(a*7), title="Resistance 7", color=resColor, linewidth=2)
plot(getSup(a*7), title="Support 7", color=supColor, linewidth=2)
plot(getRes(a*8), title="Resistance 8", color=resColor, linewidth=2)
plot(getSup(a*8), title="Support 8", color=supColor, linewidth=2)
plot(getRes(a*9), title="Resistance 9", color=resColor, linewidth=2)
plot(getSup(a*9), title="Support 9", color=supColor, linewidth=2)
plot(getRes(a*10), title="Resistance 10", color=resColor, linewidth=2)
plot(getSup(a*10), title="Support 10", color=supColor, linewidth=2)
plot(getRes(a*15), title="Resistance 15", color=resColor, linewidth=2)
plot(getSup(a*15), title="Support 15", color=supColor, linewidth=2)
plot(getRes(a*20), title="Resistance 20", color=resColor, linewidth=2)
plot(getSup(a*20), title="Support 20", color=supColor, linewidth=2)
plot(getRes(a*25), title="Resistance 25", color=resColor, linewidth=2)
plot(getSup(a*25), title="Support 25", color=supColor, linewidth=2)
plot(getRes(a*30), title="Resistance 30", color=resColor, linewidth=2)
plot(getSup(a*30), title="Support 30", color=supColor, linewidth=2)
plot(getRes(a*35), title="Resistance 35", color=resColor, linewidth=2)
plot(getSup(a*35), title="Support 35", color=supColor, linewidth=2)
plot(getRes(a*40), title="Resistance 40", color=resColor, linewidth=2)
plot(getSup(a*40), title="Support 40", color=supColor, linewidth=2)
plot(getRes(a*45), title="Resistance 45", color=resColor, linewidth=2)
plot(getSup(a*45), title="Support 45", color=supColor, linewidth=2)
plot(getRes(a*50), title="Resistance 50", color=resColor, linewidth=2)
plot(getSup(a*50), title="Support 50", color=supColor, linewidth=2)
plot(getRes(a*75), title="Resistance 75", color=resColor, linewidth=2)
plot(getSup(a*75), title="Support 75", color=supColor, linewidth=2)
plot(getRes(a*100), title="Resistance 100", color=resColor, linewidth=2)
plot(getSup(a*100), title="Support 100", color=supColor, linewidth=2)
plot(getRes(a*150), title="Resistance 150", color=resColor, linewidth=2)
plot(getSup(a*150), title="Support 150", color=supColor, linewidth=2)
plot(getRes(a*200), title="Resistance 200", color=resColor, linewidth=2)
plot(getSup(a*200), title="Support 200", color=supColor, linewidth=2)
plot(getRes(a*250), title="Resistance 250", color=resColor, linewidth=2)
plot(getSup(a*250), title="Support 250", color=supColor, linewidth=2)
plot(getRes(a*300), title="Resistance 300", color=resColor, linewidth=2)
plot(getSup(a*300), title="Support 300", color=supColor, linewidth=2)
plot(getRes(a*350), title="Resistance 350", color=resColor, linewidth=2)
plot(getSup(a*350), title="Support 350", color=supColor, linewidth=2)
plot(getRes(a*400), title="Resistance 400", color=resColor, linewidth=2)
plot(getSup(a*400), title="Support 400", color=supColor, linewidth=2)
plot(getRes(a*450), title="Resistance 450", color=resColor, linewidth=2)
plot(getSup(a*450), title="Support 450", color=supColor, linewidth=2)
plot(getRes(a*500), title="Resistance 500", color=resColor, linewidth=2)
plot(getSup(a*500), title="Support 500", color=supColor, linewidth=2)
plot(getRes(a*750), title="Resistance 750", color=resColor, linewidth=2)
plot(getSup(a*750), title="Support 750", color=supColor, linewidth=2)
plot(getRes(a*1000), title="Resistance 1000", color=resColor, linewidth=2)
plot(getSup(a*1000), title="Support 1000", color=supColor, linewidth=2)
plot(getRes(a*1250), title="Resistance 1250", color=resColor, linewidth=2)
plot(getSup(a*1250), title="Support 1250", color=supColor, linewidth=2)
plot(getRes(a*1500), title="Resistance 1500", color=resColor, linewidth=2)
plot(getSup(a*1500), title="Support 1500", color=supColor, linewidth=2)
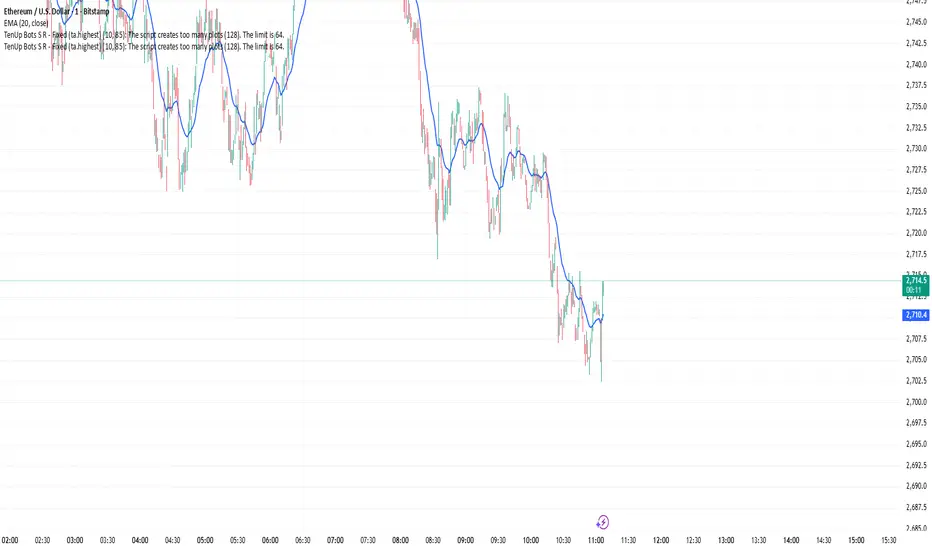
Fear & Greed [theUltimator5]This indicator attempts to replicate CNN's Fear & Greed Index methodology to measure market sentiment on a scale from 0-100. It combines seven key market components into a single sentiment score, where lower values indicate fear and higher values indicate greed.
Note: It is impossible to perfectly replicate the true Fear & Greed indicator due to data limitations, so this indicator attempts to best replicate the output for each of the (7) components using available data.
The uniqueness of this indicator comes from the calculation methods for the 7 components as well as the visual representation of the data, which includes a table and selectable plots for each of the 7 components which make up the overall sentiment. Existing variants of the Fear & Greed Index have substantial flaws in the calculations of several of the components which result in warped final sentiment numbers. This indicator attempts to better track all 7 components and provide a closer model to the actual Fear & Greed index.
Here are the seven components and a brief description of how each are calculated:
1. Market Momentum
Calculation: S&P 500 current price vs. 125-day moving average
Measures how far the market has moved from its long-term trend
Uses CNN-style Z-score normalization over 252 trading days
Higher values indicate strong upward momentum (greed)
Lower values suggest declining momentum (fear)
2. Stock Strength
Calculation: S&P 500 RSI scaled to 252-day range
Uses 14-period RSI of the S&P 500 index
Normalizes RSI values based on their 252-day minimum and maximum
Measures overbought/oversold conditions relative to recent history
Higher values indicate overbought conditions (greed)
Lower values suggest oversold conditions (fear)
3. Price Breadth
Calculation: Modified McClellan Oscillator
Primary: Uses NYSE advancing vs. declining issues with 7-day smoothing
Fallback: Compares sector performance (QQQ, IWM vs. SPY)
Measures how many stocks participate in market moves
Broader participation indicates healthier trends
Narrow breadth suggests selective or weak trends
4. Put/Call Ratio
Calculation: Inverted CBOE Put/Call ratios
Primary: CBOE Equity-only Put/Call ratio (more sensitive)
Fallback: CBOE Total Put/Call ratio
Uses 5-day average and applies CNN normalization
Higher put/call ratios indicate fear (inverted to lower scores)
Lower put/call ratios suggest complacency (higher scores)
5. Market Volatility
Calculation: VIX relative to its 50-day average
Compares current VIX level to its 50-day moving average
Measures deviation from normal volatility expectations
Higher VIX relative to average indicates fear (lower scores)
Lower relative VIX suggests complacency (higher scores)
6. Safe Haven Demand
Calculation: Stock returns vs. bond yield changes
Compares 20-day smoothed S&P 500 returns to Treasury yield changes
When stocks outperform bonds, indicates risk appetite (higher scores)
When bonds outperform stocks, suggests risk aversion (lower scores)
Uses Treasury 10-year yields as the safe haven benchmark
7. Junk Bond Demand
Calculation: High-yield bond spread analysis
Measures yield spread between junk bonds (JNK ETF) and Treasuries
Compares current spread to its 5-day average
Narrowing spreads indicate risk appetite (higher scores)
Widening spreads suggest risk aversion (lower scores)
The combined sentiment is plotted as a single line which changes color based on the current sentiment value.
0-25: Extreme Fear (Red) - Market panic, oversold conditions
26-45: Fear (Orange) - Cautious sentiment, bearish bias
46-55: Neutral (Yellow) - Balanced market sentiment
56-75: Greed (Light Green) - Optimistic sentiment, bullish bias
76-100: Extreme Greed (Green) - Market euphoria, potentially overbought
There are dashed lines to represent the threshold values for each of the sentiments to better visualize transitions.
The table displays each of the (7) components of the index and their respective values. The table can be toggled on/off and the position can be moved.
An optional secondary line can be toggled on to display (1) of the (7) components as a unique color and the component name and value will highlight on the table. The secondary line can be used to dig into the main driving forces behind the overall index value.

Extended CANSLIM Indicator❖ Extended CANSLIM Indicator.
The Extended CANSLIM indicator is an indicator that concentrates all the tools usually used by CANSLIM traders.
It shows a table where all the stock fundamental information is shown at once first for the last quarter and then up to 5 years back.
The fundamental data is checked against well known CANSLIM validation criteria and is shown over 4 state levels.
1. Good = Value is CANSLIM Compliant.
2. Acceptable = Value is not CANSLIM compliant but still good. value is shown with a lighter background color.
3. Warning = Value deserves special attention. Value is shown over orange background color.
3. Stop = Value is non CANSLIM compliant or indicates a stop trading condition. Value is shown over red background color.
The indicator has also a set of technical tools calculated on price or index and shown directly on the chart.
❖ Fundamental data shown in the table.
The table is arranged in 4 sets of data:
1. Table Header, showing Indicator and Company data.
2. CANSLIM.
3. 3Rs: RS Rating, Revenue and ROE.
4. Extra Data: Piotroski score, ATR, Trend Days, D to E, Avg Vol and Vol today.
Sets 3 and 4 can be hidden from the table.
❖ Indicator and Compay Data.
The table header shows, Indicator name and version.
It then displays Company Name, sector and industry, human size and its capitalization.
❖ CANSLIM Data.
Displays either genuine CANSLIM data from TradinView or custom data as best effort when that data cannot be obtained in TV.
C = EPS diluted growth, Quarterly YoY.
>= 25% = Good, >= 0% = Acceptable, < 0% = Stop
A = EPS diluted growth, Annual YoY.
>= 25% = Good, >= 0% = Acceptable, < 0% = Stop
N = New High as best effort (Cust).
Always Good
S = Float shares as best effort.
Always Good
L = One year performance relative to S&P 500 (Cust),
Positive : 0% .. 50% = Neutral, 50%+ = Leader, 80%+ = Leader+, 100%+ = Leader++
Negative : 0% .. -10% = Laggard, -10% .. -30% = Laggard+, -30%+ = Laggard++
>= 50% = Good, >= 0% = Acceptable, >= -10% Warning, < -10% = Stop
I = Accumulation/Distribution days over last 25 days as a clue for institutional support (Cust).
A delta is calculated by subtracting Distribution to Accumulation days.
> 0 = Good, = 0 = Acceptable, < 0 = Warning, < -5 = Stop
M = Market direction and exposure measured on S&500 closing between averages (Cust).
Varies from 0% Full Bear to 100% Full Bull
>= 80% = Good, >= 60% = Acceptable, >= 40% = Warning, < 40% = Stop
❖ Extra non CANSLIM Data.
RS = RS Rating.
>= 90 = Good, >= 80 = Accept, >= 50 = Warning, < 50 = Stop
Rev. = Revenue Growth Quarterly YoY.
>= 0% = Good, <0% = Stop
ROE = Return on Equity, Quarterly YoY.
>= 17% = Good, >= 0% = Acceptable, < 0% = Stop
Piotr. = Piotroski Score, www.investopedia.com (TV)
>= 7 = Good, >= 4 = Acceptable, < 4 = Stop
ATR = Average True Range over the last 20 days (Cust).
0% - 2% = Acceptable, 2% - 4% = Ideal, 4% - 6% = Warning, 5%+ = Stop.
Trend Days = Days since EMA150 is over EMA200 (Cust).
Always Good
D. to E. = Days left before Earnings. Maybe not a good idea buying just before earnings (Cust).
>= 28 = Good, >= 21 = Acceptable, >= 14 = Warning, < 14 = Stop
Avg Vol. = 50d Average Volume (Cust).
>= 100K = Good, < 100K = Acceptable
Vol. Today = Today's percentage volume compared to 50d average (Cust).
Always Good.
❖ Historical Data.
Optionally selectable historical data can be displayed for C, A, Revenue and ROE up to 20 quarters if available.
Quarterly numbers can also be displayed for A, C and Revenue.
Information can be shown in Chronological or Reverse Chronological order (default).
Increasing growth quarters are shown in white, while diminuing ones are shown in Yellow.
Transition from Losing to Profitable quarters are shown with an exclamation mark ‘!’
Finally, losing quarters are shown between parenthesis.
❖ MAs on chart.
Displays 200, 100, 50 and 20 days MAs on chart.
The MAs are also automatically scaled in the 1W time frame.
❖ New 52 Week High on chart.
A sun is shown on the chart the first time that a new 52 week high is reached.
The N cell shows a filled sun when a 52 week high is no older than a month, an lighter sun when it’s no older than a quarter or a moon otherwise.
❖ Pocket Pivots on chart.
Small triangles below the price are signaling pocket pivots.
❖ Bases on chart, formerly Darvas Boxes.
Draw bases as defined by Darvas boxes, both top or bottom of bases can be selected to be shown in order to only show resistance or support.
❖ Market exposure/direction indicator.
When charting S&P500 (SPX), Nasdaq 100 Index (NDX), Nasdaq composite (IXIC) or Dow Jownes Index (DJIA), the indicator switches to Market Exposure indicator, showing also Accumulation/Distribution days when volume information is available. This indication which varies from 0% to 100% is what is shown under the M letter in the CANSLIM table which is calculated on the S&P500.
❖ Follow Through Days indicator.
If you are an adept of the Low-cheat entry, then you will be highly interested by the Follow Through days indicator as measured in the S&P 500 and shown as diamonds on the chart.
The follow-through days are calculated on S&P500 but shown in current stock chart so you don’t need to chart the S&P 500 to know that a follow through day occurred.
Follow Through days show correctly on Daily time frame and most are also shown on the Weekly time frame as well.
They are also classified according to the market zone in which they occur:
0%-5% from peak = Pullback : FT day is not shown.
5%-10% from peak = Minor Correction : Minor FT days is shown.
10%-20% from peak = Correction : Intermediate FT days us shown
20+% from peak = Bear Market : Makor FT days is shown
❖ RS Line and Rating indicator.
A RS Line and Rating indicator can be added to the chart.
Relative Strength Rating Accuracy.
Please note that the RS Rating is not 100% accurate when compared to IBD values.
❖ Earning Line indicator.
An Earning Line indicator can be added to the chart.
❖ ATR Bands and ATR Trade calculator.
The motivation for this calculator came from my own need to enter trades on volatile stocks where the simple 7% Stop Loss rule doest not work.
It simply calculates the number of shares you can buy at any moment based on current stock price and using the lower ATR band as a stop loss.
A few words about the ATR Bands.
On this indicator the ATR bands are not drawn as a classical channel that follows the price.
The lower band is drawn as a support until it’s broken on a closing basis. It can’t be in a down trend.
The upper band is drawn as a resistance until it’s broken on a closing basis. It can’t be in an up trend.
The idea is that when price starts to fall down from a peak, it should not violate its lower band ATR and that means that we can use that level as a Stop Loss.
You must look back for the stock volatility and find out which ATR multiplier works well meaning that the ATR bands are not violated on normal pullbacks. By default, the indicator uses 5x multiplier.
❖ Extra things, visual features and default settings.
The first square cell of current quarter displays a check mark ‘V’ if the CANSLIM criteria is OK or acceptable or a cross ‘X’ otherwise.
The first square cell of historical C and Rev show respectively the count of last consecutive positive quarters.
There are different color themes from “Forest” to “Space” you can chose from to best fit your eyes.
You also have different table sizes going from “Micro” to “Huge” for better adjustment to the size of your display.
The default settings view show: Pocket Pivots, FT Days, MA50, RS Line and ATR Bands.
That's all, Enjoy!
