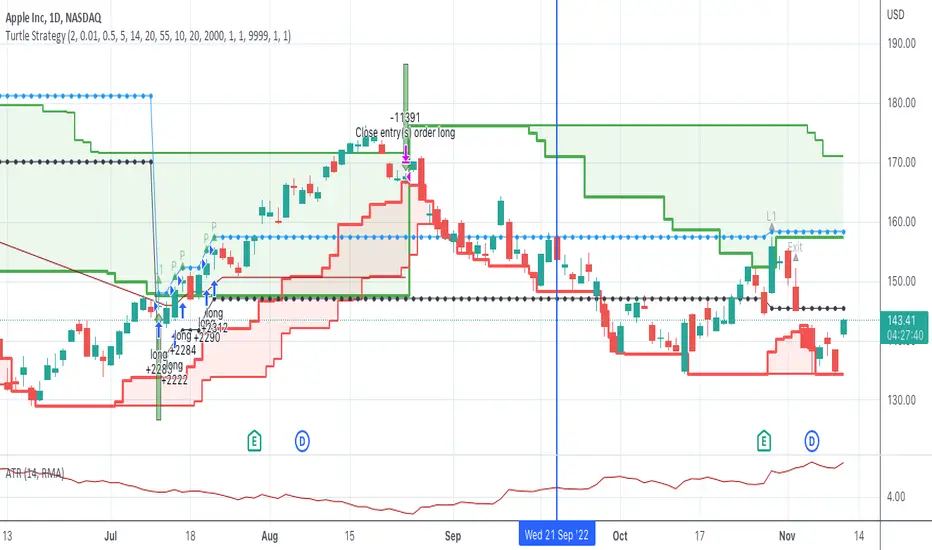
Turtle SystemFirst pinescript strategy I've ever written so still learning what is possible.
This strategy is based on the famous turtle system and tried to stay true
to the rules within the confines of what pinescript will allow me to do.
Features:
Green lines represents the 20/55 day highs (configurable)
Red lines represent the 10/20 day lows (configurable)
Purple line represents stop (defaults to 2N away configurable)
Pyramids up to 5 long positions (each 1N away configurable).
Arrows:
Up Arrow Green - 20 day long position entered
Up Arrow Purple - 55 day long position entered
Down Arrow Green - Winning trade exited out.
Down Arrow Red - Losing Trade either stopped out or exited out.
Code tracks successful wins as it is only allowed to enter positions if the last trade was not a wining trade.
One limitation, only supports Long trades although wouldn't be a lot of work to also make it support Short. NASDAQ:AAPL
Love to hear feedback on improvements, particularly to make it more robust.
Tìm kiếm tập lệnh với "黄金近20年走势"
Sexy RSI for sexy tradersHello fellow sexy traders.
I was tired of constantly having to add my own horizontals/MAs to the default RSI so I decided to make this modification.
The default settings include channels from 40-80 (green horizontals) for a bullish range, and 20-60 (red horizontals) for the bearish range.
Also includes white line at 50 level, and blue horizontals at extremes (90 and 10).
If RSI stays in one of the red or green range that can signify the trend direction, as directed by Andrew Cardwell (inventor of the RSI).
If you wish for other levels to be included, just let me know! Comment on here or dm me on twitter @boss_charts and I can add the settings for you, so all you have to do is click a button and it will set it to your desired config. I want this to be a tool that is useful for heavy traders to save them time.
Additionally, in order to tell the level of the RSI and how overextended it might be, I added the setting for the RSI to change color depending on its level. Current settings are as follows:
Normal RSI (30-70) = PURPLE
Conventional Overbought/Oversold (30-20 + 70-80) = RED
1st extended (20-15 + 80-85) = PINK
2nd extended (15-10 + 85-90) = ORANGE
VERY EXTENDED (<10 + >90) = YELLOW
That way you can get an idea of how drastic a move is by the color alone. According to Dr. Cardwell, a drastic move to over/under extended can be a sign of strength.
Finally, there are the default MAs added that Mr. Cardwell defines as useful for defining the trend. These being the 9 MA and 45 EMA/WMA.
The strategy with these is to have the MAs on both price and RSI. If the 9MA is above the 45 MA on both price and RSI, then this is bullish and you can look for longs.
Conversely, if the 9 is below the 45 on both RSI and price that is bearish, and you can look for shorts.
I added the background color change for the points where the MAs cross each other, so you do not have to have the MAs fogging up your charts to know where they are relative to one another. This is similar to my MA cross indicator which contains the same functionality.
Never financial advice. Backtest it for yourself and find MA configurations that work for you.
Enjoy! Feel free to send feedback/requests whenever.

Multi SMA EMA WMA HMA BB (5x8 MAs Bollinger Bands) MAX MTF - RRBMulti SMA EMA WMA HMA 4x7 Moving Averages with Bollinger Bands MAX MTF by RagingRocketBull 2019
Version 1.0
All available MAX MTF versions are listed below (They are very similar and I don't want to publish them as separate indicators):
ver 1.0: 4x7 = 28 MTF MAs + 28 Levels + 3 BB = 59 < 64
ver 2.0: 5x6 = 30 MTF MAs + 30 Levels + 3 BB = 63 < 64
ver 3.0: 3x10 = 30 MTF MAs + 30 Levels + 3 BB = 63 < 64
ver 4.0: 5(4+1)x8 = 8 CurTF MAs + 32 MTF MAs + 20 Levels + 3 BB = 63 < 64
ver 5.0: 6(5+1)x6 = 6 CurTF MAs + 30 MTF MAs + 24 Levels + 3 BB = 63 < 64
ver 6.0: 4(3+1)x10 = 10 CurTF MAs + 30 MTF MAs + 20 Levels + 3 BB = 63 < 64
Fib numbers: 8, 13, 21, 34, 55, 89, 144, 233, 377
This indicator shows multiple MAs of any type SMA EMA WMA HMA etc with BB and MTF support, can show MAs as dynamically moving levels.
There are 4 MA groups + 1 BB group, a total of 4 TFs * 7 MAs = 28 MAs. You can assign any type/timeframe combo to a group, for example:
- EMAs 9,12,26,50,100,200,400 x H1, H4, D1, W1 (4 TFs x 7 MAs x 1 type)
- EMAs 8,13,21,30,34,50,55,89,100,144,200,233,377,400 x M15, H1 (2 TFs x 14 MAs x 1 type)
- D1 EMAs and SMAs 8,13,21,30,34,50,55,89,100,144,200,233,377,400 (1 TF x 14 MAs x 2 types)
- H1 WMAs 13,21,34,55,89,144,233; H4 HMAs 9,12,26,50,100,200,400; D1 EMAs 12,26,89,144,169,233,377; W1 SMAs 9,12,26,50,100,200,400 (4 TFs x 7 MAs x 4 types)
- +1 extra MA type/timeframe for BB
There are several versions: Simple, MTF, Pro MTF, Advanced MTF, MAX MTF and Ultimate MTF. This is the MAX MTF version. The Differences are listed below. All versions have BB
- Simple: you have 2 groups of MAs that can be assigned any type (5+5)
- MTF: +2 custom Timeframes for each group (2x5 MTF) +1 TF for BB, TF XY smoothing
- Pro MTF: 4 custom Timeframes for each group (4x3 MTF), 1 TF for BB, MA levels and show max bars back options
- Advanced MTF: +4 extra MAs/group (4x7 MTF), custom Ticker/Symbols, Timeframe <>= filter, Remove Duplicates Option
- MAX MTF: +2 subtypes/group, packed to the limit with max possible MAs/TFs: 4x7, 5x6, 3x10, 4(3+1)x10, 5(4+1)x8, 6(5+1)x6
- Ultimate MTF: +individual settings for each MA, custom Ticker/Symbols
MAX MTF version tests the limits of Pinescript trying to squeeze as many MAs/TFs as possible into a single indicator.
It's basically a maxed out Advanced version with subtypes allowing for mixed types within a group (i.e. both emas and smas in a single group/TF)
Pinescript has the following limits:
- max 40 security calls (6 calls are reserved for dupe checks and smoothing, 2 are used for BB, so only 32 calls are available)
- max 64 plot outputs (BB uses 3 outputs, so only 61 plot outputs are available)
- max 50000 (50kb) size of the compiled code
Based on those limits, you can only have the following MAs/TFs combos in a single script:
1. 4x7, 5x6, 3x10 - total number of MTF MAs must always be <= 32, and you can still have BB and Num Levels = total MAs, without any compromises
2. 5(4+1)x8, 6(5+1)x6, 4(3+1)x10 - you can use the Current Symbol/Timeframe as an extra (+1) fixed TF with the same number of MTF MAs
- you don't need to call security to display MAs on the Current Symbol/Timeframe, so the total number of MTF MAs remains the same and is still <= 32
- to fit that many MAs into the max 64 plot outputs limit you need to reduce the number of levels (not every MA Group will have corresponding levels)
Features:
- 4x7 = 28 MAs of any type
- 4x MTF groups with XY step line smoothing
- +1 extra TF/type for BB MAs
- 2 MA subtypes within each group/TF
- 4x7 = 28 MA levels with adjustable group offsets, indents and shift
- supports any existing type of MA: SMA, EMA, WMA, Hull Moving Average (HMA)
- custom tickers/symbols for each group
- show max bars back option
- show/hide both groups of MAs/levels/BB and individual MAs
- timeframe filter: show only MAs/Levels with TFs <>= Current TF
- hide MAs/Levels with duplicate TFs
- support for custom TFs that are not available in free accounts: 2D, 3D etc
- support for timeframes in H: H, 2H, 4H etc
Notes:
- Uses timeframe textbox instead of input resolution dropdown to allow for 240 120 and other custom TFs
- Uses symbol textbox instead of input symbol to avoid establishing multiple dummy security connections to the current ticker - otherwise empty symbols will prevent script from running
- Possible reasons for missing MAs on a chart:
- there may not be enough bars in history to start plotting it. For example, W1 EMA200 needs at least 200 bars on a weekly chart.
- for charts with low/fractional prices i.e. 0.00002 << 0.001 (default Y smoothing step) decrease Y smoothing as needed (set Y = 0.0000001) or disable it completely (set X,Y to 0,0)
- for charts with high price values i.e. 20000 >> 0.001 increase Y smoothing as needed (set Y = 10-20). Higher values exceeding MAs point density will cause it to disappear as there will be no points to plot. Different TFs may require diff adjustments
- TradingView Replay Mode UI and Pinescript security calls are limited to TFs >= D (D,2D,W,MN...) for free accounts
- attempting to plot any TF < D1 in Replay Mode will only result in straight lines, but all TFs will work properly in history and real-time modes. This is not a bug.
- Max Bars Back (num_bars) is limited to 5000 for free accounts (10000 for paid), will show error when exceeded. To plot on all available history set to 0 (default)
- Slow load/redraw times. This indicator becomes slower, its UI less responsive when:
- Pinescript Node.js graphics library is too slow and inefficient at plotting bars/objects in a browser window. Code optimization doesn't help much - the graphics engine is the main reason for general slowness.
- the chart has a long history (10000+ bars) in a browser's cache (you have scrolled back a couple of screens in a max zoom mode).
- Reload the page/Load a fresh chart and then apply the indicator or
- Switch to another Timeframe (old TF history will still remain in cache and that TF will be slow)
- in max possible zoom mode around 4500 bars can fit on 1 screen - this also slows down responsiveness. Reset Zoom level
- initial load and redraw times after a param change in UI also depend on TF. For example: D1/W1 - 2 sec, H1/H4 - 5-6 sec, M30 - 10 sec, M15/M5 - 4 sec, M1 - 5 sec. M30 usually has the longest history (up to 16000 bars) and W1 - the shortest (1000 bars).
- when indicator uses more MAs (plots) and timeframes it will redraw slower. Seems that up to 5 Timeframes is acceptable, but 6+ Timeframes can become very slow.
- show_last=last_bars plot limit doesn't affect load/redraw times, so it was removed from MA plot
- Max Bars Back (num_bars) default/custom set UI value doesn't seem to affect load/redraw times
- In max zoom mode all dynamic levels disappear (they behave like text)
- Dupe check includes symbol: symbol, tf, both subtypes - all must match for a duplicate group
- For the dupe check to work correctly a custom symbol must always include an exchange prefix. BB is not checked for dupes
Good Luck! Feel free to learn from/reuse the code to build your own indicators.

Multi SMA EMA WMA HMA BB (4x5 MAs Bollinger Bands) Adv MTF - RRBMulti SMA EMA WMA HMA 4x5 Moving Averages with Bollinger Bands Advanced MTF by RagingRocketBull 2019
Version 1.0
This indicator shows multiple MAs of any type SMA EMA WMA HMA etc with BB and MTF support, can show MAs as dynamically moving levels.
There are 4 MA groups + 1 BB group, a total of 4 TFs * 5 MAs = 20 MAs. You can assign any type/timeframe combo to a group, for example:
- EMAs 12,26,50,100,200 x H1, H4, D1, W1 (4 TFs x 5 MAs x 1 type)
- EMAs 8,10,13,21,30,50,55,100,200,400 x M15, H1 (2 TFs x 10 MAs x 1 type)
- D1 EMAs and SMAs 8,10,12,26,30,50,55,100,200,400 (1 TF x 10 MAs x 2 types)
- H1 WMAs 7,77,89,167,231; H4 HMAs 12,26,50,100,200; D1 EMAs 89,144,169,233,377; W1 SMAs 12,26,50,100,200 (4 TFs x 5 MAs x 4 types)
- +1 extra MA type/timeframe for BB
There are several versions: Simple, MTF, Pro MTF, Advanced MTF and Ultimate MTF. This is the Advanced MTF version. The Differences are listed below. All versions have BB
- Simple: you have 2 groups of MAs that can be assigned any type (5+5)
- MTF: +2 custom Timeframes for each group (2x5 MTF) +1 TF for BB, TF XY smoothing
- Pro MTF: 4 custom Timeframes for each group (4x3 MTF), 1 TF for BB, MA levels and show max bars back options
- Advanced MTF: +2 extra MAs/group (4x5 MTF), custom Ticker/Symbols, Timeframe <>= filter, Remove Duplicates Option
- Ultimate MTF: +individual settings for each MA, custom Ticker/Symbols
Features:
- 4x5 = 20 MAs of any type
- 4x MTF groups with XY step line smoothing
- +1 extra TF/type for BB MAs
- 4x5 = 20 MA levels with adjustable group offsets, indents and shift
- supports any existing type of MA: SMA, EMA, WMA, Hull Moving Average (HMA)
- custom tickers/symbols for each group - you can compare MAs of the same symbol across exchanges
- show max bars back option
- show/hide both groups of MAs/levels/BB and individual MAs
- timeframe filter: show only MAs/Levels with TFs <>= Current TF
- hide MAs/Levels with duplicate TFs
- support for custom TFs that are not available in free accounts: 2D, 3D etc
- support for timeframes in H: H, 2H, 4H etc
Notes:
- Uses timeframe textbox instead of input resolution dropdown to allow for 240 120 and other custom TFs
- Uses symbol textbox instead of input symbol to avoid establishing multiple dummy security connections to the current ticker - otherwise empty symbols will prevent script from running
- Possible reasons for missing MAs on a chart:
- there may not be enough bars in history to start plotting it. For example, W1 EMA200 needs at least 200 bars on a weekly chart.
- price << default Y smoothing step 5. For charts with low/fractional prices (i.e. 0.00002 << 5) adjust X Y smoothing as needed (set Y = 0.0000001) or disable it completely (set X,Y to 0,0)
- TradingView Replay Mode UI and Pinescript security calls are limited to TFs >= D (D,2D,W,MN...) for free accounts
- attempting to plot any TF < D1 in Replay Mode will only result in straight lines, but all TFs will work properly in history and real-time modes. This is not a bug.
- Max Bars Back (num_bars) is limited to 5000 for free accounts (10000 for paid), will show error when exceeded. To plot on all available history set to 0 (default)
- Slow load/redraw times. This indicator becomes slower, its UI less responsive when:
- Pinescript Node.js graphics library is too slow and inefficient at plotting bars/objects in a browser window. Code optimization doesn't help much - the graphics engine is the main reason for general slowness.
- the chart has a long history (10000+ bars) in a browser's cache (you have scrolled back a couple of screens in a max zoom mode).
- Reload the page/Load a fresh chart and then apply the indicator or
- Switch to another Timeframe (old TF history will still remain in cache and that TF will be slow)
- in max possible zoom mode around 4500 bars can fit on 1 screen - this also slows down responsiveness. Reset Zoom level
- initial load and redraw times after a param change in UI also depend on TF. For example:
D1/W1 - 2 sec, H1/H4 - 5-6 sec, M30 - 10 sec, M15/M5 - 4 sec, M1 - 5 sec.
M30 usually has the longest history (up to 16000 bars) and W1 - the shortest (1000 bars).
- when indicator uses more MAs (plots) and timeframes it will redraw slower. Seems that up to 5 Timeframes is acceptable, but 6+ Timeframes can become very slow.
- show_last=last_bars plot limit doesn't affect load/redraw times, so it was removed from MA plot
- Max Bars Back (num_bars) default/custom set UI value doesn't seem to affect load/redraw times
- In max zoom mode all dynamic levels disappear (they behave like text)
1. based on 3EmaBB, uses plot*, barssince and security functions
2. you can't set certain constants from input due to Pinescript limitations - change the code as needed, recompile and use as a private version
3. Levels = trackprice implementation
4. Show Max Bars Back = show_last implementation
5. swma has a fixed length = 4, alma and linreg have additional offset and smoothing params
6. Smoothing is applied by default for visual aesthetics on MTF. To use exact ma mtf values (lines with stair stepping) - disable it
Good Luck! You can explore, modify/reuse the code to build your own indicators.

ADX +- DiThis Adx +-Di is just a complete version of what the ADX is supposed to signal.
So you have:
15 (contraction), 20 (threshold), 30 (expansion), 40 (resistance) levels.
Below 20 the price is not trending
Above 30 the price is trending
Below 15 price has been in contraction for too long
Between 20 and 30 price is in a "transition zone".
I finally added a "Resistance" level (40), which has to be adapted to best represent the historical levels where price usually encounters resistance, and where the price can be declared "overtrending", which means a return to lower levels is likely to happen.
I've chosen mild colors, and set the Adx Color to White, because I use black background, you can easily change that.
Enjoy
-Maurice

Average Directional Index with DI SpreadThis indicator converts conventional triple lined ADX, DI+ and DI- into two lines. First line is the
original ADX line and second line is obtained by subtracting DI- from DI+ which named DI Spread(DIS)
If ADX is greater than 20 there is a trend and if greater than 40 there is a strong trend but ADX does not tell
the trend direction
To determine trend direction, DIS can be used with ADX; Sımply; If DIS is greater than 0, it is an uptrend and If DIS
is less than 0, it is a downtrend.
To sum up;
If ADX is greater than 20 and especially greater than 40 with positive DIS value, this implies an uptrend.
If ADX is greater than 20 and especially greater than 40 with negative DIS value, this implies a downtrend.
*Because of coloration and reference levels used, this indicator is really simple and efficient to analyze trend direction.

MFI Multi-TimeframeThe Money Flow Index (MFI) is an oscillating momentum and market strength indicator that was developed by Gene Quong and Avrum Soudack. It is also a leading indicator, which means it tends to lead price action, and is similar in calculation as J. Welles Wilder's Relative Strength Index (RSI) with the significant difference being that the MFI uses both price and volume. Like the RSI, the MFI is a range-bound oscillator that oscillates between zero and 100 and is interpreted in a similar way as the RSI. The ultimate aim of the MFI is to determine whether money is flowing in or out of a security over a specified look-back period.
HOW IS IT USED ?
The MFI oscillates between 0 and 100 and a security is considered overbought when its MFI rises above 80 and oversold when its MFI falls below 20. These levels are the suggested overbought and oversold levels as suggested by Quong and Soudack, though they do not suggest these levels as entry signals. Instead, these caution levels warn that the price action and the current trend have reached extremes that may be unsustainable. Quong and Soudack also recommend using the 90 and 10 lines as truly overbought and truly oversold levels respectively. MFI movements above 90 and below 10 are rare and indicate a higher level of unsustainability.
Finally, failure swings from the 20 or 80 levels can also be used to identify potential price reversals and trade entries. A failure swing occurs when the MFI moves over the overbought or oversold level but reverses back before reaching the opposite level. Thus, when the MFI crosses up over the 20 (oversold) level but reverses before it reaches the 80 (overbought) level, it indicates that the uptrend is weak and that it may reverse soon. This signals that you should cover any long positions or go short. Similarly, when the MFI crosses down over the 80 (overbought) level but reverses before it reaches the 20 (oversold) level, it indicates a weakness in the down trend and the probability that the trend will reverse. This would be a signal to close of any short positions; or a signal to long buy.
I added the possibility to add on the chart a 2nd timeframe for confirmation.
If you found this script useful, a tip is always welcome... :)
Exponential Moving Average (Set of 3) [Krypt] + 13/34 EMAsI took Krypt's script and essentially added on to it.
the 20/50/100/200 EMAs should be used together as support and resistance as normal.
Wait for price to break 200 EMA
Wait for 50 EMA to cross 200 EMA
Wait for pullback to 50 EMA to open position
20 and 100 EMAs are for extra information about moving support and resistance
and 13/34 EMAs should be used in conjunction
When 13 EMA crosses 34 EMA, open position
When price gets far from 13/34, close position (because price will attempt to revert back to mean)
This is better for scalping and swing trades than the 20/50/100/200 setup.
Twitter: @AzorAhai06

Gap Gain Test V1.0 by @overratedtraderOddball indicators for entertainment purposes only. This is best used on daily chart.
Look at the 20 ALMA to gauge likelihood of stock following its up or down gap.
- if above the 20 ALMA , follow the gap direction
- if below the 20 ALMA , take counter trend trade
If stock gaps up AND closes higher than it opens, that gain % (close/open) is colored green and if stock gaps down and closes lower than it opens, that gain % (close/open) is colored green
Conversely if the stock gaps up BUT closes lower than it opens, red and if a stop gaps down but closes higher than it opens, red.
Enjoy and follow me on twitter @overratedtrader for more nonsensical and out-of-the-box ideas.

Adaptive Donchian ChannelThis indicator adds a level of adaptivity to the simple Donchian Channel by adjusting the sensitivity (lookback periods) of the channel's upper and lower bounds based on the amount of time that has elapsed since the price has hit/expanded the channel boundaries. Comparing the results of this indicator to the standard Donchian Channel, the readier level of responsiveness may prove self-evident.
METHODOLOGY:
Specifically, the more recently the channel was expanded in one direction, the longer the lookback period grows in that direction. Conversely, if the channel has not been expanded in a given direction, the lookback period will contract so as to allow for a tighter channel.
For example, let the initial lookback period be 20 bars and let the factor argument be 0.1 (or 2 bars to start, as 20*0.1 = 2). Now say the current bar sets a new 20-period high. Then the lookback period for the upper bound is expanded by 2 bars to 22, and the lookback period for the lower bound is contracted by 2 bars to 18, thereby making it simultaneously harder to set new highs and easier to set new lows (and vice versa for hitting new lows). If neither a new high nor a new low is formed, both periods contract by the given factor.

TonyUX EMA Scalper - Buy / SellThis is a simple scalping strategy that works for all time frames... I have only tested it on FOREX
It works by checking if the price is currently in an uptrend and if it crosses the 20 EMA.
If it crosses the 20 EMA and its in and uptrend it will post a BUY SIGNAL.
If it crosses the 20 EMA and its in and down it will post a SELL SIGNAL.
The red line is the highest close of the previous 8 bars --- This is resistance
The green line is the lowest close of the previous 8 bars -- This is support

EMA_ConvergenceFirst I have to give kudos to my son who I asked to take a shot at creating this little indicator. Nice work son!
While trading, one of the things I look for is when price or certain EMA's approach another EMA. The example that I use on this 1 minute SPY chart is an 8 EMA and 20 EMA. I am looking for when the 8 and 20 are within' 3 cents of each other. Many times when they are getting close, price is approaching a top or bottom. I am looking for a candlestick reversal around that area. You may want to know when PRICE is near the 50 EMA: Use EMA 1 and 50 for that. Having it light up on top of the page, or elsewhere, makes it easier to look for the convergence when it occurs. If it lights up for a long period, price may be going sideways. I don't enter into a trade until the EMA starts separating, usually with another candlestick formation.
You are able to change the distance for convergence and two EMA's. Unfortunately you will have to adjust the convergence number up as you increase in time frames. This is designed to see when they are close, not when they cross.
The bars on top of this example are lit up purple due to the 8 and 20 EMA are within' 3 cents of each other.
If you want to overlay the price bars, instead of having it separate, just change overlay to "true"
Enjoy.

Craig Cobb Cradle Strategy//@version=5
strategy("Craig Cobb Cradle Strategy", overlay=true, margin_long=100, margin_short=100)
// ─────────────────────────────────────────────
// Inputs
// ─────────────────────────────────────────────
emaLenFast = input.int(10, "Fast EMA")
emaLenSlow = input.int(20, "Slow EMA")
smallCandlePct = input.float(0.35, "Small candle max size (% of ATR)")
// MACD Inputs
fastLength = input.int(12)
slowLength = input.int(26)
signalLength = input.int(9)
// ─────────────────────────────────────────────
// EMAs (Cradle Zone)
// ─────────────────────────────────────────────
ema10 = ta.ema(close, emaLenFast)
ema20 = ta.ema(close, emaLenSlow)
plot(ema10, color=color.yellow, title="10 EMA")
plot(ema20, color=color.orange, title="20 EMA")
inCradleZone = low <= ema10 and high >= ema20 or low <= ema20 and high >= ema10
// Trend alignment
bullTrend = ema10 > ema20
bearTrend = ema10 < ema20
// ─────────────────────────────────────────────
// MACD + signal line
// ─────────────────────────────────────────────
macd = ta.ema(close, fastLength) - ta.ema(close, slowLength)
signal = ta.ema(macd, signalLength)
hist = macd - signal
// MACD confluence: Signal line moving in trend direction
macdBull = signal > signal // signal rising
macdBear = signal < signal // signal falling
// ─────────────────────────────────────────────
// Small Cradle Candle (the trigger candle)
// Candle must be small relative to ATR
// ─────────────────────────────────────────────
atr = ta.atr(14)
candleSize = high - low
smallCandle = candleSize <= atr * smallCandlePct
// Bullish small candle
bullishCandle = close > open and smallCandle
// Bearish small candle
bearishCandle = close < open and smallCandle
// ─────────────────────────────────────────────
// Cradle Entry Conditions
// ─────────────────────────────────────────────
longEntry = bullTrend and inCradleZone and bullishCandle and macdBull
shortEntry = bearTrend and inCradleZone and bearishCandle and macdBear
// ─────────────────────────────────────────────
// Plot signals
// ─────────────────────────────────────────────
plotshape(longEntry, title="Long Cradle", style=shape.labelup, color=color.lime, text="Cradle Long")
plotshape(shortEntry, title="Short Cradle", style=shape.labeldown, color=color.red, text="Cradle Short")
// ─────────────────────────────────────────────
// Alerts
// ─────────────────────────────────────────────
alertcondition(longEntry, title="Cradle Long Alert", message="Cradle long setup detected")
alertcondition(shortEntry, title="Cradle Short Alert", message="Cradle short setup detected")
// Strategy entry (optional)
if longEntry
strategy.entry("Long", strategy.long)
if shortEntry
strategy.entry("Short", strategy.short)

Volume % + OBV intensity + histogram (v6)1) Volume % (logic that already existed)
• Average volume at the last 20 days =
• Average level → 50%
• More than double the average → **100%**
• Mapping between 0 and 100%
2) OBV % (newly added)
• Look at the OBV change compared to the previous bar
• obvChange = obv - obv
• Compare the absolute value of this change (the magnitude of the force) to the average change in the last 20 bars
• Average level → 50%
• More than double the average → 100%
• Use the value from 0 to 100% as obvPercent
3) Long/Short Section Judgment (OBV basis)
• obvChange > 0 이고 obvPercent >= 60 →
👉 Good section to enter long (buying energy is strong) → Green number
• obvChange < 0 이고 obvPercent >= 60 →
👉 Short entry decent section (sell energy strong) → Red number

Buyers in Control █ OVERVIEW
The "Buyers in Control" indicator identifies periods when buying pressure dominates the market by combining three key technical factors:
✓ Price Momentum - Price trading above exponential moving average
✓ Volume Confirmation - Current volume exceeding average (strong participation)
✓ RSI Strength - Momentum indicator confirming bullish bias
When all three conditions align, the indicator signals that buyers are in control of the market.
█ HOW IT WORKS
The indicator evaluates three independent conditions:
1. PRICE POSITION: Close > EMA(21)
→ Confirms price is in an uptrend
2. VOLUME SURGE: Volume > SMA(20) × 1.2
→ Validates that the move has genuine buying interest
3. MOMENTUM: RSI(14) > 50
→ Ensures bullish momentum is present
Only when ALL three conditions are true does the indicator confirm buyer control.
█ KEY FEATURES
• Real-time Dashboard - Shows status of each condition (✓/✗)
• Visual Alerts - Green background + labels when buyers take control
• EMA Reference Line - Visual trend indicator
• Customizable Parameters - Adjust sensitivity for any market/timeframe
• Built-in Alerts - Notification when control shifts to buyers
• Clean Code - Well-documented Pine Script v6
█ SETTINGS
Price Momentum:
- EMA Length (default: 21) - Shorter = faster signals, Longer = more conservative
Volume Confirmation:
- Volume Multiple (default: 1.2) - Higher = requires stronger volume
- Volume SMA Length (default: 20) - Lookback period for average volume
RSI Momentum:
- RSI Length (default: 14) - Standard RSI calculation period
- RSI Threshold (default: 50) - Minimum RSI for buyer control
Display:
- Toggle background, labels, EMA line, and customize colors
█ USE CASES
• Trend Confirmation - Validate bullish moves before entering long positions
• Filter Weak Rallies - Avoid low-volume pumps that often reverse
• Multi-Timeframe Analysis - Check buyer control across multiple charts
• Alert System - Get notified when market regime shifts to buyers
█ BEST PRACTICES
✓ Works best in trending markets (avoid choppy/ranging conditions)
✓ Combine with support/resistance for optimal entries
✓ Test different EMA lengths for your specific asset/timeframe
✓ Use alongside risk management rules (stop losses, position sizing)
✓ Consider the dashboard to see which conditions are missing
█ TIMEFRAMES
Suitable for all timeframes:
• Intraday: 1m-15m (use EMA 9 for faster signals)
• Swing: 1h-4h (default settings work well)
• Position: Daily-Weekly (use EMA 50 for conservative signals)
█ TECHNICAL NOTES
• Pine Script v6 - Latest version for optimal performance
• No repainting - All calculations based on closed bar data
• Lightweight - Minimal CPU usage
• Open Source - Full code available for review and modification
█ ALERT CONDITIONS
1. "Buyers Take Control" - Fires when all three conditions become true
2. "Buyers Lose Control" - Fires when any condition breaks
█ LIMITATIONS
⚠ Not a standalone trading system - use as a confluence tool
⚠ May generate false signals in sideways/choppy markets
⚠ Volume data unavailable on some forex pairs (use tick volume)
⚠ Lagging by nature - confirmatory indicator, not predictive
█ CREDITS
Indicator combines classic technical analysis principles:
• EMA for trend direction
• Volume analysis for validation
• RSI for momentum confirmation
No proprietary algorithms - transparent, time-tested methods.

Luxy Sector & Industry RS AnalyzerEver wonder why some stocks soar while others in the same sector barely move? Or why your perfectly timed entry still loses money? Possibly the answer can be found in Relative Strength.
The Luxy Sector & Industry RS Analyzer solves a critical problem that most traders overlook: picking strong stocks in strong sectors AND strong industries . It's not enough for a stock to go up - you want stocks that are crushing their competition at both the sector AND industry level. This indicator does the heavy lifting by automatically comparing your stock against its sector ETF, industry ETF, the broader market, sector leader, and industry leader, giving you a complete multi-level picture of relative performance.
What makes this different?
- Automatic sector AND industry detection - no manual setup required
- Multi-level hierarchy analysis: Market → Sector → Industry → Stock
- Multi-timeframe analysis (1 month to 1 year) in one glance
- Industry ETF mapping (30+ industries covered)
- Clear 0-100 scoring system with letter grades (A+ to F)
- Works on stocks, crypto, forex, and commodities
- Real-time updates with anti-repaint protection
Think of it as your performance dashboard - instantly showing you if you're trading a champion or a laggard at every level of the market hierarchy.
METHODOLOGY & ATTRIBUTION
This indicator is based on classical Relative Strength (RS) analysis principles from technical analysis. RS methodology compares an asset's price performance against a benchmark to identify relative outperformance or underperformance. This concept has been used by professional traders and institutions for decades.
Key Concepts Used:
Relative Strength (RS) - Classical technical analysis concept measuring comparative performance
Multi-Level Hierarchy Analysis - Market → Sector → Industry → Stock comparison
Sector Rotation Analysis - Identifying which sectors are leading or lagging the market
Industry Rotation Analysis - Identifying which industries are leading within their sectors
Multi-period Performance Analysis - Evaluating strength across multiple timeframes
Beta Calculation - Standard statistical measure of volatility relative to a benchmark
DISCLAIMER: This indicator is for educational and informational purposes only. It should not be considered financial advice or a recommendation to buy or sell. Past performance does not guarantee future results. Trading involves risk and may not be suitable for all investors. Always do your own research and consult with a financial advisor before making investment decisions.
with all rows visible - capture when stock has strong RS score (70+) so users can see what a "good" setup looks like]
WHAT THE INDICATOR SHOWS
1. AUTOMATIC ASSET TYPE DETECTION
The indicator automatically identifies what you're analyzing and adjusts accordingly:
Stocks - Compares to sector ETF (XLK, XLF, XLV, etc.) and SPY
Crypto - Compares to Total Crypto Market Cap and Bitcoin
Forex - Compares to relevant currency index (DXY, EXY, etc.)
Commodities - Compares to Gold (GLD) as benchmark
Indices - Compares to broader market indices
How it works: The indicator reads your chart's asset type and ticker, then automatically maps it to the correct sector or benchmark. For stocks, it uses intelligent sector detection (looking at the sector field) to match you with the right sector ETF. For example:
- Technology stocks get compared to XLK (Technology Select Sector SPDR)
- Financial stocks get compared to XLF (Financial Select Sector SPDR)
- Healthcare stocks get compared to XLV (Health Care Select Sector SPDR)
This happens instantly when you add the indicator to any chart - no configuration needed.
2. SECTOR & MARKET BENCHMARKS
What is a Sector ETF?
A sector ETF is an exchange-traded fund that tracks a specific industry group. For example, XLK contains all major technology companies. By comparing your stock to its sector ETF, you can see if your stock is outperforming or underperforming its peers.
The indicator shows three key comparison points:
Stock vs Sector (Benchmark)
This tells you how your stock performs compared to companies in the same industry. Positive numbers mean your stock is beating the sector average. Negative numbers mean it's lagging behind.
Stock vs Market (SPY)
This shows performance against the broader S&P 500 index. This is important because even if a stock beats its sector, the entire sector might be weak. You want stocks that beat both their sector AND the market.
Sector vs Market
This reveals "sector rotation" - whether money is flowing into or out of this sector. When this number is positive, the whole sector is hot and leading the market. This is powerful because strong sectors tend to lift all boats, making it easier to find winners.
3. MULTI-PERIOD PERFORMANCE ANALYSIS
The indicator calculates performance across four timeframes simultaneously:
1 Month (1M) - Recent short-term momentum
3 Months (3M) - Medium-term trend strength
6 Months (6M) - Longer-term positioning
1 Year (1Y) - Full-cycle performance view
Why multiple periods matter:
A stock might look great over 1 month but terrible over 6 months - that's a red flag. The best stocks show consistent strength across all timeframes . When you see positive RS (Relative Strength) values across all four periods, you've found a stock with sustained outperformance.
Each row in the table shows:
- Raw performance percentage for that period
- RS value (the difference compared to benchmark)
- Color coding: Green for positive, red for negative, white for neutral
4. SECTOR LEADER COMPARISON
The indicator automatically identifies and compares your stock to the sector leader - the dominant stock in that industry.
Sector leaders by industry:
Technology: Apple (AAPL)
Healthcare: UnitedHealth (UNH)
Financial: JPMorgan Chase (JPM)
Energy: ExxonMobil (XOM)
Consumer Discretionary: Amazon (AMZN)
Consumer Staples: Walmart (WMT)
And more...
Why this matters:
Comparing to the leader shows you if you're trading a champion or a follower. If your stock consistently beats the sector leader, you've found something special. If it's lagging the leader, you might want to trade the leader instead.
Optional Custom Leader:
You can override the automatic leader and compare to any stock you choose. This is useful if you want to benchmark against a specific competitor or reference stock.
NEW! INDUSTRY ANALYSIS (STOCKS ONLY)
The indicator now provides multi-level analysis by automatically detecting and comparing your stock to its specific industry , not just the broad sector.
Why Industry matters:
Technology sector (XLK) contains many different industries: Software, Semiconductors, Hardware, etc. A software stock might beat the broad tech sector but lag behind other software companies. Industry analysis provides this granular view.
Industry ETF Mapping (30+ industries):
Software/Applications: IGV (iShares Software ETF)
Semiconductors: SMH (VanEck Semiconductor ETF)
Biotech: IBB (iShares Biotechnology ETF)
Pharmaceuticals: XPH (SPDR Pharmaceuticals ETF)
Banks: KBE (SPDR S&P Bank ETF)
Regional Banks: KRE (SPDR Regional Banking ETF)
Oil & Gas Exploration: XOP (SPDR Oil & Gas Exploration ETF)
Homebuilders: XHB (SPDR Homebuilders ETF)
Retail: XRT (SPDR S&P Retail ETF)
Aerospace & Defense: ITA (iShares U.S. Aerospace & Defense ETF)
And many more...
Industry Leader Mapping:
The indicator also identifies the leader within each industry:
Software: Microsoft (MSFT)
Semiconductors: NVIDIA (NVDA)
Biotech: Amgen (AMGN)
Pharmaceuticals: Eli Lilly (LLY)
Banks: JPMorgan (JPM)
Oil Exploration: ConocoPhillips (COP)
And more...
New Table Rows for Stocks:
Industry ETF Performance - How the specific industry performed (green background)
Industry Leader Performance - How the top stock in the industry performed
vs Industry RS - Your stock's outperformance vs its industry ETF
Industry vs Sector RS - Is this industry hot or cold within its sector?
vs Industry Leader RS - Your stock's performance vs the industry's best
Why this is powerful:
A stock that beats both its sector AND its industry is showing strength at every level. This indicates true relative strength, not just riding sector-wide momentum.
Optional Custom Industry:
You can override automatic detection for both Industry ETF and Industry Leader in settings.
5. RS SCORE & GRADING SYSTEM (0-100)
The heart of the indicator is the RS Score - a weighted calculation that distills all the performance data into one clear number from 0 to 100.
How the score is calculated:
FOR STOCKS (with Industry data):
The indicator splits the weight between Sector (60%) and Industry (40%):
SECTOR RS (60% of total weight):
1 Month RS: 24% weight (40% × 0.6)
3 Month RS: 18% weight (30% × 0.6)
6 Month RS: 12% weight (20% × 0.6)
1 Year RS: 6% weight (10% × 0.6)
INDUSTRY RS (40% of total weight):
1 Month RS: 16% weight (40% × 0.4)
3 Month RS: 12% weight (30% × 0.4)
6 Month RS: 8% weight (20% × 0.4)
1 Year RS: 4% weight (10% × 0.4)
FOR OTHER ASSETS (Crypto, Forex, Commodities):
Uses full 100% weight on benchmark:
1 Month RS: 40% weight
3 Month RS: 30% weight
6 Month RS: 20% weight
1 Year RS: 10% weight
It starts at 50 (neutral) and adds or subtracts points based on your asset's relative strength in each period.
Bonus points:
+5 points if the sector is outperforming the market (sector rotation is bullish)
+5 points if the industry is outperforming its sector (hot industry) - STOCKS ONLY
+5 points if RS momentum is improving (getting stronger over time)
-5 points if RS momentum is declining (getting weaker)
The final score is capped between 0-100.
Letter Grade System:
90-100: A+ - Elite performer, crushing the sector
85-89: A - Excellent, strong outperformer
80-84: A- - Very good, above average
75-79: B+ - Good, solid performer
70-74: B - Above average, decent strength
65-69: B- - Slightly above average
60-64: C+ - Average, neutral strength
55-59: C - Below average
50-54: C- - Weak, slight underperformance
45-49: D+ - Concerning weakness
40-44: D - Poor, significant underperformance
0-39: F - Failing, avoid this stock
What scores mean for trading:
- RS Score above 70: Strong stocks worth considering for long positions
- RS Score 50-70: Average stocks, better opportunities elsewhere
- RS Score below 50: Weak stocks, avoid or consider for shorts
6. CONSISTENCY SCORE
This metric shows what percentage of time periods show positive RS .
For STOCKS (with Industry data):
Counts both Sector RS periods AND Industry RS periods (up to 8 total periods):
- If a stock beats both sector and industry in all 4 periods each: Consistency = 100% (8/8)
- If it beats in 6 out of 8 total periods: Consistency = 75%
- If it beats in 4 out of 8 total periods: Consistency = 50%
For OTHER ASSETS:
Counts benchmark periods only (4 total):
- If it beats benchmark in all 4 periods (1M, 3M, 6M, 1Y): Consistency = 100%
- If it beats in 3 out of 4 periods: Consistency = 75%
- If it beats in 2 out of 4 periods: Consistency = 50%
Why consistency matters:
A high RS Score with low consistency might indicate a recent spike that could fade. The best stocks show both high RS Score AND high consistency - they're strong now AND have been strong historically at both the sector AND industry level.
Look for stocks with:
Consistency above 75%: Very reliable strength across all levels
Consistency 50-75%: Decent but check other metrics
Consistency below 50%: Weak or erratic, proceed with caution
7. BETA CALCULATION (Volatility Measure)
Beta measures how much more volatile your stock is compared to its sector.
Beta > 1.2 : High volatility - stock moves more aggressively than sector (marked as "High")
Beta 0.8-1.2 : Normal volatility - moves roughly in line with sector
Beta < 0.8 : Low volatility - stock is more stable than sector (marked as "Low")
Formula used:
Beta = Correlation(Stock, Sector) × (Standard Deviation of Stock / Standard Deviation of Sector)
This uses a 20-period calculation for reliability.
How to use Beta:
- High Beta stocks offer bigger gains but also bigger risks - good for aggressive traders
- Low Beta stocks are more defensive - good for conservative positions
- Match Beta to your risk tolerance and strategy
8. DAYS ABOVE/BELOW SECTOR
This tracks consecutive periods (bars) where your stock outperforms or underperforms its sector.
Days Above Sector:
Counts how many bars in a row your stock has beaten the sector.
10+ days: Strong sustained strength (shown in bright green)
5-9 days: Building momentum (shown in yellow)
1-4 days: Early strength (shown in white)
0 days: Not currently outperforming
Days Below Sector:
Counts how many bars in a row your stock has lagged the sector.
10+ days: Sustained weakness (shown in bright red)
5-9 days: Losing momentum (shown in orange)
1-4 days: Minor weakness (shown in white)
0 days: Not underperforming (this is good!)
Why this matters:
Long streaks show trend persistence. A stock with 15+ days above sector is riding strong momentum. A stock with 15+ days below sector is in a sustained downtrend relative to peers.
9. PRICE VS 52-WEEK HIGH
Shows where current price sits relative to its 52-week high (or equivalent for your timeframe).
95%+ (green) : Stock is near all-time highs - strong positioning
80-94% (yellow) : Stock is in a pullback but still relatively strong
Below 80% : Stock has pulled back significantly from highs
Why this matters:
The strongest stocks stay near their highs. When you see a stock with high RS Score AND price near 52W high, you've found a stock with institutional support and strong buying pressure.
10. RELATIVE VOLUME
Compares current volume to the 20-period average volume.
1.5x+ (green) : High volume - significant interest and participation
Around 1.0x : Average volume - normal trading activity
Below 1.0x : Low volume - less interest or inactive period
Why volume matters:
High relative volume confirms price moves. When a stock makes a strong move on 2x or 3x normal volume, it's more likely to sustain. Low volume moves are often just noise.
11. AVERAGE RS STRENGTH
This calculates the average absolute value of all RS readings across the four timeframes.
It shows the magnitude of divergence from the sector, regardless of direction. A high number means the stock moves very differently from its sector (could be much stronger or much weaker). A low number means it tracks closely with the sector.
High Average RS: Stock has strong character, moves independently
Low Average RS: Stock follows sector closely, lacks individual strength
12. SECTOR ROTATION SIGNAL
This indicator automatically detects when a sector is experiencing bullish rotation - meaning money is flowing into the sector and it's outperforming the broader market.
Condition for bullish rotation:
Sector must be beating SPY (market) in both 1-month AND 3-month periods.
Why this matters:
Stocks in hot sectors tend to perform better because they have tailwinds from sector-wide buying. When sector rotation is bullish and your stock has a high RS Score, you've found an ideal setup.
The indicator adds +5 bonus points to the RS Score when sector rotation is bullish.
13. MOMENTUM DETECTION
The indicator compares 1-month RS to 3-month RS to detect if momentum is improving or declining.
RS Momentum Improving: 1M RS is better than 3M RS - stock is getting stronger (adds +5 to score)
RS Momentum Declining: 1M RS is worse than 3M RS - stock is getting weaker (subtracts -5 from score)
Why momentum matters:
You want to catch stocks as momentum is building, not after it's already peaked. Improving momentum suggests the strength is accelerating, not fading.
14. OVERALL ASSESSMENT & RECOMMENDATION
The indicator provides two quick summary rows:
Overall Rating:
Based on grade and RS Score, you get an instant quality rating:
Strong Leader (A/A+) - Top tier stock, crushing it
Above Average (A-/B+) - Solid performer, better than most
Average (B/B-) - Middle of the pack
Below Average (C/C+) - Struggling, watch carefully
Underperformer (D/F) - Weak stock, underperforming badly
Trading Signal:
Combines multiple factors to give setup quality:
STRONG BUY SETUP - RS Score 70+, Consistency 75+, AND sector rotation bullish. This is the perfect storm - strong stock, consistent strength, hot sector.
BULLISH - RS Score 60+, Consistency 50+. Good quality stock worth considering.
NEUTRAL - RS Score 50+. Okay but not exciting, better opportunities exist.
WEAK - RS Score 40-49. Below average, risky.
AVOID - RS Score below 40. Stay away, too weak.
IMPORTANT: These are educational signals only, not financial advice. Always do your own analysis and risk management.
KEY FEATURES
1. AUTOMATIC EVERYTHING
- Auto-detects asset type (stock, crypto, forex, commodity, index)
- Auto-maps stocks to correct sector ETF (11 sectors covered)
- Auto-maps stocks to correct industry ETF (30+ industries covered)
- Auto-identifies sector leader AND industry leader
- Auto-selects appropriate market benchmark
- Zero configuration required - just add to chart
2. MULTI-ASSET SUPPORT
Works on all asset classes:
US Stocks - Compares to sector ETFs (XLK, XLF, XLV, etc.)
Crypto - Compares to Total Crypto Market Cap
Forex - Compares to currency indices (DXY, EXY, etc.)
Commodities - Compares to Gold (GLD)
Indices - Compares to broader market benchmarks
3. FLEXIBLE DISPLAY
9 table positions (top/middle/bottom, left/center/right)
4 size options (tiny, small, normal, large)
Show/hide table completely
Real-time indicator toggle
4. TIMEFRAME FLEXIBILITY
Choose your analysis timeframe:
Chart Timeframe (default) - Uses whatever timeframe your chart is on
Fixed: 1 Hour, 4 Hours, Daily, Weekly - Forces calculations to specific timeframe
This means you can be on a 5-minute chart but analyze RS on Daily timeframe if you prefer.
5. RS SCORE FILTERING
Set a minimum RS Score threshold to only see strong stocks:
Set to 0 - Shows all stocks
Set to 70 - Only displays stocks with RS Score 70+ (strong stocks only)
Warning message displays if stock doesn't meet threshold
Perfect for screening - quickly scan multiple charts and the indicator only shows tables for stocks that pass your quality filter.
6. CUSTOM LEADER COMPARISON
Override automatic leader detection:
Compare to any ticker you choose
Benchmark against specific competitors
Use your own reference stocks
7. COMPREHENSIVE TOOLTIPS
Every input parameter and every table row has detailed tooltips explaining:
What the metric measures
How to interpret the values
What thresholds indicate strength/weakness
Why it matters for trading
Hover over any element to learn - it's like having a trading coach built in.
8. SMART ALERTS
Built-in alert system for key events:
Divergence Alerts:
Get notified when your stock diverges significantly from its sector.
Bullish Divergence: Stock beating sector by threshold percentage
Bearish Divergence: Stock losing to sector by threshold percentage
Set your threshold (default 5%) - this determines how big a divergence triggers the alert.
RS Score Alerts:
Get notified when RS Score crosses your threshold:
Crossed Above: RS Score went from below to above your threshold (bullish)
Crossed Below: RS Score dropped from above to below threshold (bearish)
Set your threshold (default 70) to focus on strong stocks.
Sector Rotation Alert:
Fires when sector shows bullish rotation (outperforming market).
HOW TO USE THE INDICATOR
FOR SWING TRADERS:
1. Add indicator to your watchlist stocks
2. Look for RS Score 70+ with Consistency 75%+
3. Check if sector rotation is bullish (bonus!)
4. Verify price is near 52W high (95%+)
5. Wait for entry setup on your chart
6. Use stop loss below key support
Example Setup:
Stock shows:
- RS Score: 82 (Grade: A-)
- Consistency: 100% (strong across all periods)
- Sector Rotation: Bullish
- Price vs 52W High: 96%
- Days Above Sector: 12 days
- Relative Volume: 1.8x
This is a textbook strong stock in a hot sector near highs - ideal for swing long.
FOR POSITION TRADERS:
1. Focus on 6-month and 1-year RS values
2. Look for sustained outperformance (Consistency 75%+)
3. Prefer lower Beta stocks (less volatility)
4. Check Days Above Sector for trend persistence
5. Monitor RS Score monthly, exit if drops below 60
FOR ACTIVE TRADERS:
1. Use on intraday timeframes (1H or 4H)
2. Set RS Score filter to 60+ for quick screening
3. Enable Divergence Alerts
4. Watch for momentum improving signal
5. Higher Beta stocks offer more movement
FOR SHORT SELLERS:
1. Look for RS Score below 40 (Grade: D or F)
2. Check for declining momentum
3. Verify Days Below Sector is increasing (10+)
4. Sector rotation should be bearish
5. Price should be well off 52W high
WHAT MAKES A PERFECT SETUP:
The holy grail combination:
RS Score: 75+ (A- or better)
Consistency: 80%+ (strong across time - beats sector AND industry)
Sector Rotation: Bullish (hot sector)
Industry vs Sector: Positive (hot industry within sector)
Days Above Sector: 10+ (sustained strength)
Momentum: Improving (getting stronger)
Price vs 52W High: 90%+ (near highs)
Relative Volume: 1.5x+ (volume confirmation)
When you find this combination, you've located a stock with every advantage in its favor - strong at the stock level, industry level, AND sector level. That's multi-level confirmation of relative strength.
IMPORTANT NOTES
Data Reliability:
All calculations use lookahead=off for anti-repaint protection
Historical values will never change
Real-time indicator toggle only affects the visual clock icon, not data reliability
All security requests are properly configured to prevent future data leakage
Sector Mapping Notes:
Sector detection uses TradingView's sector field
Some stocks may not have sector data - indicator will adapt
Sector ETFs used: XLK, XLF, XLV, XLE, XLY, XLP, XLI, XLB, XLRE, XLU, XLC
Major market ETFs (SPY, QQQ, DIA) are treated as market benchmarks, not stocks
Multi-Asset Notes:
Crypto compares to CRYPTOCAP:TOTAL (total crypto market cap)
Forex compares to relevant currency index based on base currency
Commodities compare to Gold (GLD) as primary commodity benchmark
Custom leaders can be set for any asset type
FREQUENTLY ASKED QUESTIONS
Q: What does RS Score of 75 actually mean?
A: It means your stock is strongly outperforming its sector across multiple timeframes. The score is weighted toward recent performance (1-month gets 40% weight), so 75 indicates sustained relative strength with emphasis on current momentum.
Q: My stock has high RS Score but is going down. Why?
A: RS Score measures relative performance (vs sector/market), not absolute price direction. A stock can fall 5% while its sector falls 10% - that's still positive relative strength. In bear markets or sector corrections, high RS stocks often fall less than peers.
Q: Should I only trade stocks with RS Score above 70?
A: For long positions, yes - focus on 70+ scores. These stocks have proven they can beat their sector. However, for pairs trading or relative value plays, you might also short stocks with scores below 40 while longing stocks above 70.
Q: What if my stock doesn't have a sector?
A: The indicator handles this gracefully. If no sector is detected, it will compare directly to the market (SPY for stocks). Some rows may show N/A, but the indicator will still provide useful market-relative data.
Q: Why does the sector sometimes show N/A?
A: This happens when: 1) Your asset has no sector classification, 2) The stock IS the sector ETF itself, 3) You're analyzing a non-stock asset (crypto, forex, commodity). The indicator adapts by focusing on market-relative metrics instead.
Q: Can I use this on cryptocurrencies?
A: Yes! The indicator automatically detects crypto and compares to the Total Crypto Market Cap (CRYPTOCAP:TOTAL). You can also set a custom leader like Bitcoin (BTCUSD) to compare against the dominant crypto.
Q: What's the difference between RS Score and Consistency?
A: RS Score is the weighted average of how much you're beating the sector (magnitude). Consistency is what percentage of time periods show outperformance (reliability). You want both high - that means strong AND consistent.
Q: Do the alerts repaint?
A: No. All alerts fire only on bar close (barstate.isconfirmed) and use properly configured data with lookahead=off. Once an alert fires, it's final and won't change.
Q: What timeframe should I use?
A: For swing trading: Daily or Weekly. For day trading: 1H or 4H. For position trading: Weekly. Use "Chart Timeframe" mode and switch your chart timeframe to change the analysis period easily.
Q: Why is Days Above Sector showing 0?
A: This means your stock is not currently outperforming its sector. If Days Below Sector is also 0, it means the RS is exactly neutral (very rare). Check the actual RS values to see current standing.
Q: Can I compare to a different market benchmark than SPY?
A: Currently the indicator uses SPY (S&P 500) as the default US stock market benchmark. For crypto it uses CRYPTOCAP:TOTAL, for forex it uses currency indices, etc. The benchmark auto-adjusts based on asset type.
Q: What's a good Beta value?
A: It depends on your strategy. Aggressive traders prefer Beta above 1.2 (more volatility = bigger moves). Conservative traders prefer Beta 0.8-1.0 (more stable). Beta is neutral - it's about matching your risk tolerance.
Q: How often does the table update?
A: With Real-time Indicator enabled: Every tick (constant updates). With it disabled: Only on bar close. Either way, the underlying data is identical and non-repainting - the toggle only affects update frequency and the clock icon display.
Q: My stock is showing "AVOID" but it's up 50% this year. Is the indicator wrong?
A: Not necessarily. The indicator measures RELATIVE performance. If your stock is up 50% but the sector is up 100%, your stock is actually underperforming by 50%. The indicator helps you identify when you should switch to stronger stocks in the same sector.
Q: What does "Strong Buy Setup" really mean?
A: It means three things aligned: 1) RS Score above 70 (strong stock), 2) Consistency above 75% (reliable strength), 3) Sector rotation is bullish (hot sector). This combination historically correlates with stocks that continue outperforming. However, this is NOT financial advice - always do your own analysis.
Q: Can I use this for options trading?
A: Yes! High RS Score stocks make good candidates for call options (bullish bets) while low RS Score stocks may work for puts (bearish bets). Higher Beta stocks will have more volatile options (higher premiums but more movement).
Q: Why is my crypto showing N/A for sector?
A: Cryptocurrencies don't have "sectors" like stocks do. Instead, the indicator compares crypto to the total crypto market cap. This is normal and expected behavior.
Q: What happens if I'm analyzing an ETF?
A: If you're analyzing a sector ETF (like XLK), it will compare to SPY (market). If you're analyzing SPY itself, some comparisons won't be available (can't compare SPY to itself). The indicator intelligently adapts to avoid circular comparisons.
Q: What if my stock doesn't have industry data?
A: Not all stocks are mapped to specific industries (only 30+ major industries are covered). If no industry is detected, the indicator will still work using only sector analysis. The RS Score calculation will use 100% sector weight instead of the 60%/40% split.
Q: Why does Industry vs Sector matter?
A: Industry vs Sector shows if your specific industry is hot or cold within its broader sector. For example, Semiconductors (SMH) might be outperforming Technology sector (XLK) even though both are up. This helps you find not just strong sectors, but the strongest industries within those sectors.
Q: Can I disable Industry analysis?
A: Yes! In the "Industry Analysis" settings group, you can toggle off "Show Industry Analysis in Table" to hide all industry rows. However, even when hidden, industry data still contributes to the RS Score calculation for stocks.
Q: Why is my Consistency Score lower for stocks than other assets?
A: For stocks with industry data, Consistency counts 8 periods (4 Sector + 4 Industry periods) instead of just 4. This means the bar is higher - your stock needs to beat both sector AND industry consistently. A stock that beats sector in all 4 periods but lags industry in 2 periods will show 75% consistency (6/8), not 100%.
BEST PRACTICES
Use as a screening tool - Set RS Score filter to 70+ and quickly scan your watchlist. Only strong stocks will show the table.
Combine with technical analysis - RS Score tells you WHAT to trade, your chart tells you WHEN to enter.
Check multiple timeframes - Switch between Daily and Weekly to see if strength holds across different time horizons.
Monitor sector rotation - When sector goes from bearish to bullish rotation, it's often a great time to enter stocks in that sector.
Watch Industry vs Sector - Stocks in hot industries within hot sectors have double tailwinds. Prioritize Industry vs Sector positive values.
Pay attention to consistency - High RS Score with low consistency might be a spike that fades. Look for 70%+ consistency across BOTH sector and industry.
Use the leader comparison - If your stock consistently beats both sector leader AND industry leader, you may have found the next champion.
Watch days above/below sector - Long streaks (15+ days) indicate strong trends. Look for these in conjunction with high RS Score.
Set alerts on key stocks - Enable RS Score alerts at 70 threshold to get notified when watchlist stocks become strong.
Consider Beta for position sizing - Size smaller positions in high Beta stocks, larger in low Beta stocks for balanced risk.
Exit when RS Score drops - If a stock's RS Score falls below 60, consider reducing or exiting - the strength may be fading.
Leverage industry-level insight - If Industry ETF is weak but stock is strong, that's standout strength. If Industry is hot but stock is lagging, consider switching to the industry leader instead.
SETTINGS EXPLAINED
Display Settings:
Show Performance Table - Master on/off switch for the table
Table Position - 9 positions available (corners, edges, center)
Table Size - 4 sizes (tiny, small, normal, large) for different screen sizes
Timeframe Settings:
Chart Timeframe (recommended) - Dynamic, uses whatever chart TF you're on
Fixed Timeframes - Locks analysis to 1H, 4H, Daily, or Weekly regardless of chart
Filtering Settings:
Minimum RS Score - Set threshold (0-100) for displaying table
Show Warning - When enabled, displays message if stock doesn't meet filter
Alert Settings:
Divergence Alerts - Enable alerts when stock diverges from sector
Threshold (%) - How big a divergence triggers alert (default 5%)
RS Score Alerts - Enable alerts when RS Score crosses threshold
Threshold - What RS Score level triggers alert (default 70)
Sector Analysis Settings:
Use Custom Sector ETF - Override automatic sector ETF detection
Sector ETF Symbol - Enter any sector ETF to compare against
Use Custom Sector Leader - Override automatic sector leader detection
Sector Leader Symbol - Enter any ticker as sector leader
Industry Analysis Settings:
Use Custom Industry ETF - Override automatic industry ETF detection
Industry ETF Symbol - Enter specific industry ETF (e.g., IGV, SMH)
Use Custom Industry Leader - Override automatic industry leader detection
Industry Leader Symbol - Enter specific industry leader
Show Industry Analysis - Toggle all industry rows on/off
Display Settings:
Show Real-time Indicator - Toggle clock icon in header (doesn't affect data)
WHAT THIS INDICATOR DOESN'T DO
To set proper expectations:
Does NOT provide entry/exit signals - this is a strength analyzer, not a trading system
Does NOT predict future price movement - shows current and historical relative strength
Does NOT guarantee profits - strong RS stocks can still decline
Does NOT replace your own analysis - use as one tool among many
Does NOT work on stocks with no sector data - will adapt but some rows show N/A
This indicator is a decision support tool . It helps you identify which stocks are showing relative strength so you can make more informed trading decisions. You still need your own entry strategy, risk management, and position sizing rules.
SUPPORT & CONTACT
Questions or feedback? Use the comments section below or send me a message.
If you find this indicator useful, please give it a boost and share with other traders who might benefit from relative strength analysis.
FINAL REMINDER
This indicator is a tool for analyzing relative strength - it shows you which stocks are outperforming their sector and market. It does NOT provide financial advice or trade signals. Always conduct your own research, manage your risk appropriately, and consult with a financial advisor before making investment decisions.
Past performance of relative strength does not guarantee future results. Strong stocks can become weak, and sectors rotate in and out of favor. Use this indicator as part of a comprehensive trading strategy, not as a standalone decision-making system.
Trade smart, manage risk, and may your RS Scores stay high!
If you got till here and you like my work a BOOST and a COMMENT would make me happy

NBarForwardOdds# N Bar Forward Odds
## Description
Calculates the probability of a closing price exceeding a closing price at a specified interval away from the
current bar. It does this by iterating through a series of intervals (1 to 20) and determining if the closing
price of the current bar is greater than the closing price of the bar at that interval.
## Usage:
Selectable base interval from the input configuration panel is calculated with a value step in a range `1:20` to get the final interval displayed.

Elliott Wave + SMC Fusion # Elliott Wave + SMC Fusion
## TITLE:
Elliott Wave + Smart Money Concepts Fusion
---
## SHORT DESCRIPTION:
Automated Elliott Wave pattern detection with Smart Money Concepts confirmation, EWO oscillator integration, and confluence scoring system.
---
## FULL DESCRIPTION:
### 📊 OVERVIEW
This indicator combines three powerful trading methodologies into a unified system:
- **Elliott Wave Theory** - Automated detection of Wave 1-2 impulse patterns
- **Smart Money Concepts (SMC)** - Order Blocks and Fair Value Gaps for institutional confirmation
- **Elliott Wave Oscillator (EWO)** - Momentum-based signal validation
The core concept is to identify high-probability Wave 3 entries by detecting completed Wave 1-2 structures and validating them with SMC and momentum indicators.
---
### 🔧 HOW IT WORKS
**1. Pattern Detection (ZigZag Method)**
- Uses pivot high/low detection to identify swing points
- Validates Wave 2 retracement using Fibonacci ratios (default: 38.2% - 88.6%)
- Requires minimum wave size to filter noise
- Applies confirmation bars to avoid premature signals
**2. Wave Projections**
- Wave 3 target: Fibonacci extension of Wave 1 (default: 1.618)
- Wave 4 retracement: Percentage of Wave 3 (default: 38.2%)
- Wave 5 projection: Extension of Wave 1 from Wave 4
**3. Smart Money Validation**
- **Order Blocks**: Identifies last opposing candle before breakout (institutional footprint)
- **Fair Value Gaps**: Detects price imbalances for potential support/resistance
**4. EWO Confirmation**
- Calculates momentum: (EMA5 / EMA34 - 1) × 100
- Signal line crossovers confirm trend direction
- Strong signals occur at extremes (< -13 or > 13 threshold)
**5. Confluence Scoring (0-100%)**
Points awarded for:
- Fibonacci quality of Wave 2 retracement (10-30 pts)
- Order Block presence (15 pts)
- Fair Value Gap presence (10 pts)
- Volume confirmation (10-15 pts)
- Trend alignment with EMA50 (10 pts)
- EWO confirmation (10-20 pts)
---
### 🎯 UNIQUE FEATURES
**Pattern Locking System**
- Once a valid pattern is detected, it locks until:
- Pattern invalidates (price breaks Wave 0)
- Pattern completes (Wave 5 reached)
- Auto-timeout (configurable bars)
- Prevents rapid signal flipping and false alerts
**Signal Stability Controls**
- Adjustable cooldown between signals (default: 20 bars)
- Minimum bar distance between wave points
- Direction change requirement option
- Confirmation bars after Wave 2 formation
**Visual Wave Tracking**
- Solid lines for impulse waves (0→1, 2→3, 4→5)
- Dashed lines for corrective waves (1→2, 3→4)
- Numbered labels on each wave point
- Real-time projection lines to targets
**Comprehensive Dashboard**
- Current wave status and lock state
- Pattern grade (A+ to D based on confluence)
- Projected vs actual wave levels (✓ when completed)
- SMC confirmation status
- Risk/Reward ratio calculation
- EWO trend direction
---
### 📈 TRADING APPLICATION
**Entry Strategy**
- Wait for Wave 1-2 pattern detection (diamond signal)
- Check confluence score (>65% = higher probability)
- Verify EWO alignment with pattern direction
- Enter after 30% retracement of Wave 2 (customizable)
**Risk Management**
- Stop Loss: Below Wave 0 (with buffer)
- Take Profit 1: Wave 3 projection
- Take Profit 2: Wave 5 projection
- R:R displayed in dashboard
**Invalidation Rules**
- Price breaks below Wave 0 (bullish) or above (bearish)
- Wave 2 level violated before Wave 3 forms
- Pattern timeout exceeded
---
### ⚙️ KEY SETTINGS
**Elliott Wave**
- ZigZag Length: Pivot detection sensitivity
- Fib Tolerance: Acceptable retracement range
- Min Wave Size: Filter small movements
**Signal Stability**
- Signal Cooldown: Minimum bars between signals
- Lock Pattern Until Invalid: Prevent signal changes
- Confirmation Bars: Wait after Wave 2
**Wave Projection**
- Wave 3/4/5 Fibonacci extensions
- Projection display distance
**EWO Settings**
- Fast/Slow EMA lengths
- Signal smoothing
- Strength threshold
**SMC Settings**
- Order Block lookback period
- FVG minimum size percentage
---
### 🔔 ALERTS
- New bullish/bearish pattern detected
- High confluence setup (>75%)
- Pattern invalidation
- Wave completion
---
### ⚠️ IMPORTANT NOTES
- This indicator identifies **potential** Elliott Wave patterns based on mathematical rules
- Elliott Wave analysis is subjective - patterns may be interpreted differently
- Always combine with other analysis methods and proper risk management
- Past pattern performance does not guarantee future results
- Pattern locking prevents repainting but delays new pattern detection
- Best used on higher timeframes (1H+) for cleaner wave structures
---
### 📚 METHODOLOGY REFERENCES
**Elliott Wave Theory**
- Wave 2 typically retraces 38.2% - 88.6% of Wave 1
- Wave 3 is often the strongest, extending 161.8% of Wave 1
- Wave 4 usually retraces 38.2% of Wave 3
- Wave 5 completes the impulse structure
**Smart Money Concepts**
- Order Blocks represent institutional supply/demand zones
- FVGs indicate price inefficiencies that may act as magnets
**Elliott Wave Oscillator**
- Developed to identify wave momentum
- Crossovers signal potential wave transitions
- Extreme readings often coincide with wave completions
---
### 🎨 VISUAL ELEMENTS
- **Green**: Bullish patterns and projections
- **Red**: Bearish patterns and projections
- **Orange**: Wave projection levels
- **Purple**: Order Block zones
- **Yellow**: Fair Value Gaps
- **Blue**: Entry levels
- **Diamond shapes**: New pattern signals
- **Triangle shapes**: EWO crossover signals
---
### 💡 TIPS FOR BEST RESULTS
1. Use on liquid markets with clear trend behavior
2. Higher timeframes produce more reliable patterns
3. Look for confluence scores above 65%
4. Verify EWO alignment before entry
5. Consider market context (overall trend, key levels)
6. Adjust ZigZag length based on your trading style
7. Increase cooldown period for longer-term signals
---
**Indicator Type**: Overlay
**Markets**: All (Crypto, Forex, Stocks, Commodities)
**Timeframes**: All (1H+ recommended)
**Style**: Pattern Recognition + Momentum + Price Action

indicator CalibrationIndicator Calibration - Multi-Indicator Consensus System
Overview
Indicator Calibration is a powerful consensus-based trading indicator that leverages the MyIndicatorLibrary (NormalizedIndicators) to combine multiple trend-following indicators into a single, actionable signal. By averaging the normalized outputs of up to 8 different trend indicators, this tool provides traders with a clear consensus view of market direction, reducing noise and false signals inherent in single-indicator approaches.
The indicator outputs a value between -1 (strong bearish) and +1 (strong bullish), with 0 representing a neutral market state. This creates an intuitive, easy-to-read oscillator that synthesizes multiple analytical perspectives into one coherent signal.
🎯 Core Concept
Consensus Trading Philosophy
Rather than relying on a single indicator that may give conflicting or premature signals, Indicator Calibration employs a democratic voting system where multiple indicators contribute their normalized opinion:
Each enabled indicator votes: +1 (bullish), -1 (bearish), or 0 (neutral)
The votes are averaged to create a consensus signal
Strong consensus (closer to ±1) indicates high agreement among indicators
Weak consensus (closer to 0) indicates market indecision or transition
Key Benefits
Reduced False Signals: Multiple indicators must agree before strong signals appear
Noise Filtering: Individual indicator quirks are smoothed out by averaging
Customizable: Enable/disable indicators and adjust parameters to suit your trading style
Universal Application: Works across all timeframes and asset classes
Clear Visualization: Simple line oscillator with clear bull/bear zones
📊 Included Indicators
The system can utilize up to 8 normalized trend-following indicators from the library:
1. BBPct - Bollinger Bands Percent
Parameters: Length (default: 20), Factor (default: 2)
Type: Stationary oscillator
Strength: Mean reversion and volatility detection
2. NorosTrendRibbonEMA
Parameters: Length (default: 20)
Type: Non-stationary trend follower
Strength: Breakout detection with momentum confirmation
3. RSI - Relative Strength Index
Parameters: Length (default: 9), SMA Length (default: 4)
Type: Stationary momentum oscillator
Strength: Overbought/oversold with smoothing
4. Vidya - Variable Index Dynamic Average
Parameters: Length (default: 30), History Length (default: 9)
Type: Adaptive moving average
Strength: Volatility-adjusted trend following
5. HullSuite
Parameters: Length (default: 55), Multiplier (default: 1)
Type: Fast-response moving average
Strength: Low-lag trend identification
6. TrendContinuation
Parameters: MA Length 1 (default: 50), MA Length 2 (default: 25)
Type: Dual HMA system
Strength: Trend quality assessment with neutral states
7. LeonidasTrendFollowingSystem
Parameters: Short Length (default: 21), Key Length (default: 10)
Type: Dual EMA crossover
Strength: Simple, reliable trend tracking
8. TRAMA - Trend Regularity Adaptive Moving Average
Parameters: Length (default: 50)
Type: Adaptive trend follower
Strength: Adjusts to trend stability
⚙️ Input Parameters
Source Settings
Source: Choose your price input (default: close)
Can be modified to: open, high, low, close, hl2, hlc3, ohlc4, hlcc4
Indicator Selection
Each indicator can be enabled or disabled via checkboxes:
use_bbpct: Enable/disable Bollinger Bands Percent
use_noros: Enable/disable Noro's Trend Ribbon
use_rsi: Enable/disable RSI
use_vidya: Enable/disable VIDYA
use_hull: Enable/disable Hull Suite
use_trendcon: Enable/disable Trend Continuation
use_leonidas: Enable/disable Leonidas System
use_trama: Enable/disable TRAMA
Parameter Customization
Each indicator has its own parameter group where you can fine-tune:
val 1: Primary period/length parameter
val 2: Secondary parameter (multiplier, smoothing, etc.)
📈 Signal Interpretation
Output Line (Orange)
The main output oscillates between -1 and +1:
+1.0 to +0.5: Strong bullish consensus (all or most indicators agree on uptrend)
+0.5 to +0.2: Moderate bullish bias (bullish indicators outnumber bearish)
+0.2 to -0.2: Neutral zone (mixed signals or transition phase)
-0.2 to -0.5: Moderate bearish bias (bearish indicators outnumber bullish)
-0.5 to -1.0: Strong bearish consensus (all or most indicators agree on downtrend)
Reference Lines
Green line (+1): Maximum bullish consensus
Red line (-1): Maximum bearish consensus
Gray line (0): Neutral midpoint
💡 Trading Strategies
Strategy 1: Consensus Threshold Trading
Entry Rules:
- Long: Output crosses above +0.5 (strong bullish consensus)
- Short: Output crosses below -0.5 (strong bearish consensus)
Exit Rules:
- Exit Long: Output crosses below 0 (consensus lost)
- Exit Short: Output crosses above 0 (consensus lost)
Strategy 2: Zero-Line Crossover
Entry Rules:
- Long: Output crosses above 0 (bullish shift in consensus)
- Short: Output crosses below 0 (bearish shift in consensus)
Exit Rules:
- Exit on opposite crossover
Strategy 3: Divergence Trading
Look for divergences between:
- Price making higher highs while indicator makes lower highs (bearish divergence)
- Price making lower lows while indicator makes higher lows (bullish divergence)
Strategy 4: Extreme Reading Reversal
Entry Rules:
- Long: Output reaches -0.8 or below (extreme bearish consensus = potential reversal)
- Short: Output reaches +0.8 or above (extreme bullish consensus = potential reversal)
Use with caution - best combined with other reversal signals
🔧 Optimization Tips
For Trending Markets
Enable trend-following indicators: Noro's, VIDYA, Hull Suite, Leonidas
Use higher threshold levels (±0.6) to filter out minor retracements
Increase indicator periods for smoother signals
For Range-Bound Markets
Enable oscillators: BBPct, RSI
Use zero-line crossovers for entries
Decrease indicator periods for faster response
For Volatile Markets
Enable adaptive indicators: VIDYA, TRAMA
Use wider threshold levels to avoid whipsaws
Consider disabling fast indicators that may overreact
Custom Calibration Process
Start with all indicators enabled using default parameters
Backtest on your chosen timeframe and asset
Identify which indicators produce the most false signals
Disable or adjust parameters for problematic indicators
Test different threshold levels for entry/exit
Validate on out-of-sample data
📊 Visual Guide
Color Scheme
Orange Line: Main consensus output
Green Horizontal: Bullish extreme (+1)
Red Horizontal: Bearish extreme (-1)
Gray Horizontal: Neutral zone (0)
Reading the Chart
Line above 0: Net bullish sentiment
Line below 0: Net bearish sentiment
Line near extremes: Strong consensus
Line fluctuating near 0: Indecision or transition
Smooth line movement: Stable consensus
Erratic line movement: Conflicting signals
⚠️ Important Considerations
Lag Characteristics
This is a lagging indicator by design (consensus takes time to form)
Best used for trend confirmation rather than early entry
May miss the first portion of strong moves
Reduces false entries at the cost of delayed entries
Number of Active Indicators
More indicators = smoother but slower signals
Fewer indicators = faster but potentially noisier signals
Minimum recommended: 4 indicators for reliable consensus
Optimal: 6-8 indicators for balanced performance
Market Conditions
Best: Strong trending markets (up or down)
Good: Volatile markets with clear directional moves
Poor: Choppy, sideways markets with no clear trend
Worst: Low-volume, range-bound conditions
Complementary Tools
Consider combining with:
Volume analysis for confirmation
Support/resistance levels for entry/exit points
Market structure analysis (higher timeframe trends)
Risk management tools (ATR-based stops)
🎓 Example Use Cases
Swing Trading
Timeframe: Daily or 4H
Enable: All 8 indicators with default parameters
Entry: Consensus > +0.5 or < -0.5
Hold: Until consensus reverses to opposite extreme
Day Trading
Timeframe: 15m or 1H
Enable: Faster indicators (RSI, BBPct, Noro's, Hull Suite)
Entry: Zero-line crossover with volume confirmation
Exit: Opposite crossover or profit target
Position Trading
Timeframe: Weekly or Daily
Enable: Slower indicators (TRAMA, VIDYA, Trend Continuation)
Entry: Strong consensus (±0.7) with higher timeframe confirmation
Hold: Months until consensus weakens significantly
🔬 Technical Details
Calculation Method
1. Each enabled indicator calculates its normalized signal (-1, 0, or +1)
2. All active signals are stored in an array
3. Array.avg() computes the arithmetic mean
4. Result is plotted as a continuous line
Output Range
Theoretical: -1.0 to +1.0
Practical: Typically ranges between -0.8 to +0.8
Rare: All indicators perfectly aligned at ±1.0
Performance
Lightweight calculation (simple averaging)
No repainting (all indicators are non-repainting)
Compatible with all Pine Script features
Works on all TradingView plans
📋 License
This code is subject to the Mozilla Public License 2.0 at mozilla.org
🚀 Quick Start Guide
Add to Chart: Apply indicator to your chart
Choose Timeframe: Select appropriate timeframe for your trading style
Enable Indicators: Start with all 8 enabled
Observe Behavior: Watch how consensus forms during different market conditions
Calibrate: Adjust parameters and indicator selection based on observations
Backtest: Validate your settings on historical data
Trade: Apply with proper risk management
🎯 Key Takeaways
✅ Consensus beats individual indicators - Multiple perspectives reduce errors
✅ Customizable to your style - Enable/disable and tune to preference
✅ Simple interpretation - One line tells the story
✅ Works across markets - Stocks, crypto, forex, commodities
✅ Reduces emotional trading - Clear, objective signal generation
✅ Professional-grade - Built on proven technical analysis principles
Indicator Calibration transforms complex multi-indicator analysis into a single, actionable signal. By harnessing the collective wisdom of multiple proven trend-following systems, traders gain a powerful edge in identifying high-probability trade setups while filtering out market noise.

NormalizedIndicatorsNormalizedIndicators - Comprehensive Trend Normalization Library
Overview
This Pine Script™ library provides an extensive collection of normalized trend-following indicators and calculation functions for technical analysis. The main advantage of this library lies in its unified signal output: All trend indicators are normalized to a standardized format where 1 represents a bullish signal, -1 represents a bearish signal, and 0 (where applicable) represents a neutral signal.
This normalization enables traders to seamlessly combine different indicators, create consensus signals, and develop complex multi-indicator strategies without worrying about different scales and interpretations.
📊 Categories
The library is divided into two main categories:
1. Trend-Following Indicators
2. Calculation Indicators
🔄 Trend-Following Indicators
Stationary Indicators
These oscillate around a fixed value and are not bound to price.
BBPct() - Bollinger Bands Percent
Source: Algoalpha X Sushiboi77
Parameters:
Length: Period for Bollinger Bands
Factor: Standard deviation multiplier
Source: Price source (typical: close)
Logic: Calculates the position of price within the Bollinger Bands as a percentage
Signal:
1 (bullish): when positionBetweenBands > 50
-1 (bearish): when positionBetweenBands ≤ 50
Special Feature: Uses an array to store historical standard deviations for additional analysis
RSI() - Relative Strength Index
Source: TradingView
Parameters:
len: RSI period
src: Price source
smaLen: Smoothing period for RSI
Logic: Classic RSI with additional SMA smoothing
Signal:
1 (bullish): RSI-SMA > 50
-1 (bearish): RSI-SMA < 50
0 (neutral): RSI-SMA = 50
Non-Stationary Indicators
These follow price movement and have no fixed boundaries.
NorosTrendRibbonSMA() & NorosTrendRibbonEMA()
Source: ROBO_Trading
Parameters:
Length: Moving average and channel period
Source: Price source
Logic: Creates a price channel based on the highest/lowest MA value over a specified period
Signal:
1 (bullish): Price breaks above upper band
-1 (bearish): Price breaks below lower band
0 (neutral): Price within channel (maintains last state)
Difference: SMA version uses simple moving averages, EMA version uses exponential
TrendBands()
Source: starlord_xrp
Parameters: src (price source)
Logic: Uses 12 EMAs (9-30 period) and checks if all are rising or falling simultaneously
Signal:
1 (bullish): All 12 EMAs are rising
-1 (bearish): All 12 EMAs are falling
0 (neutral): Mixed signals
Special Feature: Very strict conditions - extremely strong trend filter
Vidya() - Variable Index Dynamic Average
Source: loxx
Parameters:
source: Price source
length: Main period
histLength: Historical period for volatility calculation
Logic: Adaptive moving average that adjusts to volatility
Signal:
1 (bullish): VIDYA is rising
-1 (bearish): VIDYA is falling
VZO() - Volume Zone Oscillator
Parameters:
source: Price source
length: Smoothing period
volumesource: Volume data source
Logic: Combines price and volume direction, calculates the ratio of directional volume to total volume
Signal:
1 (bullish): VZO > 14.9
-1 (bearish): VZO < -14.9
0 (neutral): VZO between -14.9 and 14.9
TrendContinuation()
Source: AlgoAlpha
Parameters:
malen: First HMA period
malen1: Second HMA period
theclose: Price source
Logic: Uses two Hull Moving Averages for trend assessment with neutrality detection
Signal:
1 (bullish): Uptrend without divergence
-1 (bearish): Downtrend without divergence
0 (neutral): Trend and longer MA diverge
LeonidasTrendFollowingSystem()
Source: LeonidasCrypto
Parameters:
src: Price source
shortlen: Short EMA period
keylen: Long EMA period
Logic: Simple dual EMA crossover system
Signal:
1 (bullish): Short EMA < Key EMA
-1 (bearish): Short EMA ≥ Key EMA
ysanturtrendfollower()
Source: ysantur
Parameters:
src: Price source
depth: Depth of Fibonacci weighting
smooth: Smoothing period
bias: Percentage bias adjustment
Logic: Complex system with Fibonacci-weighted moving averages and bias bands
Signal:
1 (bullish): Weighted MA > smoothed MA (with upward bias)
-1 (bearish): Weighted MA < smoothed MA (with downward bias)
0 (neutral): Within bias zone
TRAMA() - Trend Regularity Adaptive Moving Average
Source: LuxAlgo
Parameters:
src: Price source
length: Adaptation period
Logic: Adapts to trend regularity - accelerates in stable trends, slows in consolidations
Signal:
1 (bullish): Price > TRAMA
-1 (bearish): Price < TRAMA
0 (neutral): Price = TRAMA
HullSuite()
Source: InSilico
Parameters:
_length: Base period
src: Price source
_lengthMult: Length multiplier
Logic: Uses Hull Moving Average with lagged comparisons for trend determination
Signal:
1 (bullish): Current Hull > Hull 2 bars ago
-1 (bearish): Current Hull < Hull 2 bars ago
0 (neutral): No change
STC() - Schaff Trend Cycle
Source: shayankm (described as "Better MACD")
Parameters:
length: Cycle period
fastLength: Fast MACD period
slowLength: Slow MACD period
src: Price source
Logic: Combines MACD concepts with stochastic normalization for early trend signals
Signal:
1 (bullish): STC is rising
-1 (bearish): STC is falling
🧮 Calculation Indicators
These functions provide specialized mathematical calculations for advanced analysis.
LCorrelation() - Long-term Correlation
Creator: unicorpusstocks
Parameters:
Input: First time series
Compare: Second time series
Logic: Calculates the average of correlations across 6 different periods (30, 60, 90, 120, 150, 180)
Returns: Correlation value between -1 and 1
Application: Long-term relationship analysis between assets, markets, or indicators
MCorrelation() - Medium-term Correlation
Creator: unicorpusstocks
Parameters:
Input: First time series
Compare: Second time series
Logic: Calculates the average of correlations across 6 different periods (15, 30, 45, 60, 75, 90)
Returns: Correlation value between -1 and 1
Application: Medium-term relationship analysis with higher sensitivity
assetBeta() - Beta Coefficient
Creator: unicorpusstocks
Parameters:
measuredSymbol: The asset to be measured
baseSymbol: The reference asset (e.g., market index)
Logic:
Calculates Beta across 4 different time horizons (50, 100, 150, 200 periods)
Beta = Correlation × (Asset Standard Deviation / Market Standard Deviation)
Returns the average of all 4 Beta values
Returns: Beta value (typically 0-2, can be higher/lower)
Interpretation:
Beta = 1: Asset moves in sync with the market
Beta > 1: Asset more volatile than market
Beta < 1: Asset less volatile than market
Beta < 0: Asset moves inversely to the market
💡 Usage Examples
Example 1: Multi-Indicator Consensus
pinescriptimport unicorpusstocks/MyIndicatorLibrary/1 as lib
// Combine multiple indicators
signal1 = lib.BBPct(20, 2.0, close)
signal2 = lib.RSI(14, close, 5)
signal3 = lib.TRAMA(close, 50)
// Consensus signal: At least 2 of 3 must agree
consensus = (signal1 + signal2 + signal3)
strongBuy = consensus >= 2
strongSell = consensus <= -2
Example 2: Correlation-Filtered Trading
pinescriptimport unicorpusstocks/MyIndicatorLibrary/1 as lib
// Only trade when strong correlation with market exists
spy = request.security("SPY", timeframe.period, close)
correlation = lib.MCorrelation(close, spy)
trendSignal = lib.NorosTrendRibbonEMA(50, close)
// Only bullish signals with positive correlation
tradeBuy = trendSignal == 1 and correlation > 0.5
tradeSell = trendSignal == -1 and correlation > 0.5
Example 3: Beta-Adjusted Position Sizing
pinescriptimport unicorpusstocks/MyIndicatorLibrary/1 as lib
spy = request.security("SPY", timeframe.period, close)
beta = lib.assetBeta(close, spy)
// Adjust position size based on Beta
basePositionSize = 100
adjustedSize = basePositionSize / beta // Less size with high Beta
⚙️ Technical Details
Normalization Standard
Bullish: 1
Bearish: -1
Neutral: 0 (only for selected indicators)
Advantages of Normalization
Simple Aggregation: Signals can be added/averaged
Consistent Interpretation: No confusion about different scales
Strategy Development: Simplified logic for backtesting
Combinability: Seamlessly mix different indicator types
Performance Considerations
All functions are optimized for Pine Script v5
Proper use of var for state management
Efficient array operations where needed
Minimal recursive calls
📋 License
This code is subject to the Mozilla Public License 2.0. More details at: mozilla.org
🎯 Use Cases
This library is ideal for:
Quantitative Traders: Systematic strategy development with unified signals
Multi-Timeframe Analysis: Consensus across different timeframes
Portfolio Managers: Beta and correlation analysis for diversification
Algo Traders: Machine learning with standardized features
Retail Traders: Simplified signal interpretation without deep technical knowledge
🔧 Installation
pinescriptimport unicorpusstocks/MyIndicatorLibrary/1
Then use the functions with your chosen alias:
pinescriptlib.BBPct(20, 2.0, close)
lib.RSI(14, close, 5)
// etc.
⚠️ Important Notes
All indicators are lagging, as is typical for trend-following indicators
Signals should be combined with additional analysis (volume, support/resistance, etc.)
Backtesting is recommended before starting live trading with these signals
Different assets and timeframes may require different parameter optimizations
This library provides a solid foundation for professional trading system design with the flexibility to develop your own complex strategies while abstracting away technical complexity.

Ross Cameron 5 Pillars FilterFirst, I am not Ross Cameron. This indicator is based on his five pillars of stock selection.
ROSS CAMERON 5 PILLARS MOMENTUM FILTER
🎯 OVERVIEW
This indicator automatically checks if the current symbol meets Ross Cameron's famous "5 Pillars" stock selection criteria from Warrior Trading - a proven methodology for identifying high-probability momentum day trading setups.
📊 ROSS CAMERON'S 5 PILLARS
1️⃣ RELATIVE VOLUME ≥5x (Automated ✅)
• Compares current volume to 30-day average
• Minimum 5x confirms institutional/retail interest
• High RVol = high liquidity and momentum potential
2️⃣ DAILY % CHANGE ≥10% (Automated ✅)
• Stock must already be showing momentum
• Default threshold: 10% up from previous close
• Confirms demand is already present
3️⃣ NEWS CATALYST (Manual Check ⚠️)
• Breaking news justifies the price movement
• Look for: earnings, FDA approvals, partnerships, contracts
• 🔥 icon flags stocks with ≥15% momentum (likely news-driven)
4️⃣ PRICE RANGE $1-$20 (Automated ✅)
• Sweet spot for retail trader momentum
• Highly volatile small-cap stocks
• Accessible price range for position building
5️⃣ FLOAT <10 MILLION SHARES (Automated ✅)
• Low float creates supply/demand imbalances
• Enables explosive 50-100%+ intraday moves
• Automatically checked when data available
• Shows actual float with ✅/❌ indicator
🚀 KEY FEATURES
✅ GREEN BACKGROUND HIGHLIGHT
• Visual alert when ALL automated criteria are met
• Instantly identify potential setups while scanning watchlist
📋 DETAILED BREAKDOWN TABLE
• Shows pass/fail status for each pillar
• Displays actual values (RVol, %, Float, etc.)
• Color-coded for quick interpretation
🔥 STRONG MOMENTUM INDICATOR
• Highlights stocks ≥15% (likely have news catalyst)
• Helps prioritize which stocks to research first
🔔 BUILT-IN ALERTS
• "Ross Cameron Criteria Met" - All automated criteria pass
• "Strong Momentum Alert" - Stock showing explosive movement
⚙️ FULLY CUSTOMIZABLE
• Adjust all thresholds to your trading style
• Configurable table position and display
• Toggle volume spike filter on/off
💡 HOW TO USE
BEST WORKFLOW:
1. Build a watchlist of small-cap stocks using TradingView's Stock Screener
2. Add this indicator to your charts
3. Flip through your watchlist - look for GREEN BACKGROUNDS
4. Check the table for detailed breakdown of each pillar
5. VERIFY NEWS CATALYST (required for Pillar 3)
6. If float shows N/A, verify manually on Finviz
7. Execute your trading plan with proper risk management
OPTIMAL TIMING:
• Pre-Market (8:00-9:30 AM ET) - Identify gap-up candidates
• Morning Session (9:30 AM-12:00 PM ET) - Prime momentum window
• Avoid lunch hour (12:00-2:00 PM ET) - Low volume, choppy
ALERT SETUP:
1. Click "Create Alert" on your chart
2. Select "Ross Cameron Criteria Met" condition
3. Get notified when new setups appear real-time
⚙️ CUSTOMIZABLE SETTINGS
PILLAR 1 - RELATIVE VOLUME:
• Min RVol: 5.0x (Ross's minimum, increase for more selective)
• RVol Period: 30 days (industry standard)
PILLAR 2 - MOMENTUM:
• Min Daily %: 10% (increase to 15% for stronger setups)
PILLAR 3 - CATALYST:
• Strong Momentum %: 15% (threshold for 🔥 indicator)
PILLAR 4 - PRICE RANGE:
• Min Price: $1.00 (adjust based on account size)
• Max Price: $20.00 (Ross's sweet spot)
PILLAR 5 - FLOAT:
• Max Float: 10M shares (ultra-aggressive traders use 5M)
ADDITIONAL FILTERS:
• Volume Spike: 2x (Warrior Trading standard)
• Confirms intraday momentum continuation
📈 INTERPRETATION GUIDE
✅ GREEN BACKGROUND = GO!
• All automated criteria are met
• Check news catalyst before trading
• Verify setup on chart (not overextended)
• Follow your risk management plan
❌ NO GREEN BACKGROUND = WAIT
• At least one criterion failed
• Check table to see which pillar(s) failed
• May become valid later if momentum increases
🔥 FLAME ICON = HIGH PRIORITY
• Stock showing very strong momentum (≥15%)
• Likely has significant news catalyst
• Research news IMMEDIATELY
• Often the best setups of the day
⚠️ N/A FOR FLOAT = MANUAL CHECK
• TradingView doesn't have float data for this symbol
• Verify on Finviz.com or similar
• If float >10M, setup is invalid per Ross's criteria
📚 RECOMMENDED STRATEGIES
GAP AND GO:
• Stock gaps up 10%+ on news
• Enters above gap high with volume
• Targets: 20-50% gains
VWAP BOUNCE:
• Pullback to VWAP support
• Enters on bounce with volume confirmation
• Tight stop below VWAP
HIGH OF DAY BREAKOUT:
• New HOD with volume surge
• Momentum continuation play
• Trail stop as it runs
ABCD PATTERN:
• Classic reversal pattern
• Enters on D-point breakout
• Target: A-B distance from C
⚠️ RISK WARNINGS
• DAY TRADING IS HIGHLY RISKY - Most day traders lose money
• This indicator finds setups - YOUR EXECUTION determines success
• Always use proper risk management (1-2% risk per trade)
• Never trade without stop losses
• Paper trade extensively before using real money
• Past performance does not guarantee future results
🔧 TECHNICAL DETAILS
• Pine Script v6
• Works on any timeframe (calculates daily metrics automatically)
• Compatible with TradingView Free, Pro, Premium
• No repainting - all calculations based on confirmed data
• Efficient code - minimal lag
📊 DATA SOURCES
• Relative Volume: Calculated from 30-day volume average
• Daily %: Previous day's close vs current price
• Float: TradingView's shares_outstanding_float data
• Volume Spike: 20-period volume moving average
🎯 WHO THIS IS FOR
IDEAL FOR:
✅ Day traders focused on momentum strategies
✅ Traders who follow Ross Cameron/Warrior Trading methodology
✅ Small-cap stock traders ($1-$20 range)
✅ Scalpers and swing traders seeking high-volatility setups
NOT IDEAL FOR:
❌ Long-term investors
❌ Large-cap stock traders
❌ Options-only traders
❌ Traders who don't monitor news catalysts
💬 USAGE TIPS
1. COMBINE WITH OTHER TOOLS
• Use alongside your charting/technical analysis
• Verify pattern setups (bull flags, ABCD, etc.)
• Check Level 2 / Time & Sales for confirmation
2. MAINTAIN A WATCHLIST
• Update daily with fresh small-cap movers
• Use Finviz Gap Scanner as starting point
• Focus on sectors with momentum
3. RISK MANAGEMENT IS KEY
• Never risk more than 1-2% per trade
• Use 2:1 minimum profit/loss ratio
• Cut losses quickly, let winners run
• Position size based on volatility (ATR)
4. TRACK YOUR RESULTS
• Keep a trading journal
• Note which setups work best for you
• Refine criteria based on your data
• Continuous improvement mindset
📝 DISCLAIMER
This indicator is for EDUCATIONAL PURPOSES ONLY. It is not investment advice, a recommendation to buy/sell securities, or a guarantee of profits. Trading involves substantial risk of loss. Always:
• Conduct your own research and due diligence
• Consult with a licensed financial advisor
• Never risk money you cannot afford to lose
• Understand that most day traders lose money
• Practice in a simulator before trading real money
The creator of this indicator is not affiliated with Ross Cameron or Warrior Trading. This is an independent implementation of publicly available trading methodology.
📈 SUPPORT & FEEDBACK
If you find this indicator helpful, please:
• Give it a thumbs up 👍
• Leave a comment with your experience
• Share with other momentum traders
• Follow for updates and new indicators
For questions or suggestions, leave a comment below!
---
🏆 HAPPY TRADING! Remember: The indicator finds opportunities, but YOUR discipline, risk management, and execution determine your success.
#DayTrading #Momentum #RossCameron #WarriorTrading #SmallCaps #GapAndGo #Scalping #StockScreener

🎯 Wyckoff Order Block Entry System🎯 Wyckoff Order Block Entry System
📝 INDICATOR DESCRIPTION
🎯 Wyckoff Order Block Entry System Short Description:
Professional institutional zone trading combined with Wyckoff methodology. Identifies high-probability entries where smart money meets classic price action patterns.
Full Description:
Wyckoff Order Block Entry System is a precision trading tool that combines two powerful concepts:
Order Blocks - Institutional zones where large players place their orders
Wyckoff Method - Classic price action patterns revealing smart money behavior
🎯 What Makes This Different?
Unlike traditional indicators that flood your chart with signals, this system only triggers entries when BOTH conditions are met:
Price enters an institutional Order Block zone (current timeframe OR higher timeframe)
A Wyckoff pattern occurs (Spring, SOS, Upthrust, or SOW)
This dual-confirmation approach ensures you're trading with institutional flow at optimal entry points.
📊 Key Features:
✅ Order Block Detection
Automatically identifies institutional buying/selling zones
Current timeframe order blocks (solid lines)
Higher timeframe order blocks (dashed lines) for stronger zones
Customizable strength and extension settings
✅ 4 Wyckoff Entry Patterns
SPRING (Bullish Reversal): Fake breakdown below support → Quick recovery
SOS (Sign of Strength): Strong bullish candle after accumulation
UPTHRUST (Bearish Reversal): Fake breakout above resistance → Quick rejection
SOW (Sign of Weakness): Strong bearish candle after distribution
✅ Clean Visual Design
Minimalist approach - only essential information
Color-coded zones (Green = Bullish, Red = Bearish, Cyan/Magenta = HTF)
Clear entry signals with pattern type labels
No chart clutter - focus on what matters
✅ Multi-Timeframe Analysis
Integrates higher timeframe order blocks
HTF signals marked with "+HTF" tag for extra confidence
Fully customizable HTF selection (H1, H4, Daily, etc.)
✅ Smart Alerts
Entry signal alerts (Long/Short)
Order block formation alerts
HTF order block alerts
Customizable alert messages
💡 How To Use:
Setup: Add indicator to your chart, configure HTF timeframe (default H1)
Wait: Let order blocks form (green/red boxes appear)
Watch: Price returns to order block zone
Entry: Signal appears when Wyckoff pattern confirms
Trade: Enter with the signal, stop below/above order block
📈 Best For:
Forex pairs (all majors and crosses)
Gold (XAUUSD)
Crypto (BTC, ETH, etc.)
Indices (SPX, NAS100, etc.)
Stocks
Commodities
⏱️ Recommended Timeframes:
M15 for scalping
M30 for day trading
H1 for swing trading
H4 for position trading
🎯 Win Rate Expectations:
Current TF signals: 60-70%
HTF signals (+HTF tag): 70-80%
Spring/Upthrust patterns: Highest probability
Works on ALL liquid markets
⚙️ Customizable Settings:
Order block detection parameters
HTF timeframe selection
Wyckoff sensitivity (swing length, volume threshold)
Zone extension duration
Color schemes
📚 Trading Strategy:
This indicator works best when:
Trading in the direction of higher timeframe trend
Using proper risk management (1-2% per trade)
Placing stops just outside order block zones
Taking profits at opposite order blocks
Focusing on HTF signals for higher quality
🔒 Risk Management:
Always use stop losses! Recommended placement:
LONG: 10-20 pips below order block
SHORT: 10-20 pips above order block
Target: Minimum 1:2 risk/reward ratio
💎 Why Traders Love This System:
"Finally, an indicator that doesn't spam my chart with useless signals!" - The quality-over-quantity approach means you only get high-probability setups.
"The HTF order blocks changed my trading!" - Multi-timeframe analysis built-in removes the need for manual higher timeframe checks.
"Wyckoff + Order Blocks = Perfect combination!" - Two proven concepts working together create powerful confluence.
📊 Universal Application:
This system works on ANY liquid market with sufficient volume:
✅ Forex (EUR/USD, GBP/USD, USD/JPY, etc.)
✅ Commodities (Gold, Silver, Oil, etc.)
✅ Indices (S&P 500, NASDAQ, DAX, etc.)
✅ Cryptocurrencies (Bitcoin, Ethereum, etc.)
✅ Stocks (Large cap with good liquidity)
🎓 Educational Value:
Beyond just signals, this indicator teaches you:
How institutional traders think
Where smart money places orders
Classic Wyckoff accumulation/distribution patterns
Multi-timeframe analysis techniques
⚡ Performance:
Lightning-fast calculations
No repainting
Real-time signal generation
Clean code, optimized for speed
🚀 Get Started:
Add to your favorite chart
Adjust HTF timeframe to match your trading style
Wait for high-quality signals
Trade with confidence
Remember: Quality beats quantity. This system prioritizes precision over frequency. You might see 2-5 signals per day on M30 - and that's exactly the point. Each signal is carefully filtered for maximum probability.
Ready to trade like institutions?
👉 Add this indicator to your chart now
👉 Configure your preferred HTF timeframe
👉 Start catching high-probability setups
👉 Trade smarter, not harder
Questions or feedback? Drop a comment below!
Found this useful? Hit that ⭐ button and share with fellow traders!
Happy Trading! 🚀📈

ORB + INMERELO ADR + ATRThis indicator provides **two completely different but complementary lines of information** for intraday traders:
# **1. The ORB Line (ADR-Based Context Line)**
The ORB portion of the script focuses on **range expansion** relative to typical daily behavior.
### **What it measures**
* **20-day ADR (Average Daily Range)**
* **Today’s range as a % of ADR**
* **How much of the average range has been “used”** by the time you’re considering an Opening Range Breakout
### **Why it matters for ORB trading**
Successful ORBs thrive when:
* **ADR used% is low** (green) → plenty of fuel left for expansion
* **ADR used% is moderate** (orange) → breakout still possible but less explosive
* **ADR used% is high** (red) → breakout attempts often fail or reverse
### **What the indicator gives you**
A clean, color-coded readout of:
* ADR
* Today’s range
* Used%
* A simple green/orange/red evaluation of ORB quality
This allows a trader to quickly judge whether **conditions favor ORB continuation or mean-reversion reversal**—without manually calculating ranges or switching charts.
---
# **2. The INMERELO Line (ATR Stretch + MA Interaction)**
The INMERELO portion of the script is built around **mean-reversion mechanics**:
the market tends to revert back toward the **first daily MA it crosses under**.
### **How it determines the active MA**
At the start of each session, the script waits for price to cross under:
* **EMA10**
* **EMA21**
* **SMA50**
Whichever MA is crossed first becomes the **active MA** for the day.
If no cross has occurred yet, the indicator shows the **nearest MA**, so traders know exactly what the likely “INMERELO magnet” will be.
### **What it measures**
* **Stretch from the active MA (in ATR units)**
* **20-day ATR regime direction (expanding or contracting)**
* **Daily MA context: E10, E21, or S50**
### **Why it matters for INMERELOs**
This provides:
* The **target MA**
* The **distance to that MA in ATRs**
* A color-coded stretch score:
* **0.6–1.2 ATR** → prime INMERELO zone (Green)
* Moderately stretched → Orange
* Overstretched or dead zone → Red
An up/down arrow shows whether **volatility is expanding or compressing**, which affects expected retrace behavior.
### **What the indicator gives you**
All INMERELO data is displayed in a second compact line:
* Stretch to MA
* Active MA label (E10/E21/S50)
* ATR regime arrow
This allows fast identification of high-probability **mean-reversion trades back to the MA**.
---
# **Summary**
This indicator shows:
### **Line 1 → ORB Context (ADR)**
* Is the stock setup for a powerful breakout?
* How much ADR is left?
* Are you early (good) or late (risky)?
### **Line 2 → INMERELO Context (ATR + MA Stretch)**
* Which MA is in control today (EMA10, EMA21, or SMA50)?
* How many ATRs away from that MA are we?
* Is volatility expanding or contracting?
* Is this a clean INMERELO setup or not?
Together, these two lines give traders the **two most important intraday lenses**:
**range expansion (ORB)** and **mean reversion (INMERELO)**—updated every bar, without clutter.
