PROFIT INDICATORFirst let me tell you which indicators have been used in this script so that you have the confidence while taking the trade:
(a) Bollinger Band with 20 SMA Inside it - Currently it is off, you can turn it on from settings.
(b) HMA 33, I have added the option of using two HMA's simultaneously. You can use HMA, EMA, SMA as per your settings and it would be color trending.
(c) VWAP- you can turn it on from settings
(d) CPR- you can turn it on from settings
(e) EMA's 20, 50, 200. Currently off, you can turn it on from settings.
(d) SMA's 50 and 200. Currently off, yu can turn it on from settings, if you want to use 20 SMA you can use bollinger band basis that is 20 period SMA.
(f) Trend bar at bottom on the basis of 50 EMA.
(g) Half Trend
(h) Trend strength Detector
(d) EMA 50 high and low to show the pac channel. I am not using this however as per request I have added this. Currently, it is trun on and you can turn it off from settings.
(f) Auto Fib levels
Please use a stick note for few days and mention imp notes before taking trade to check if all the conditions are matching to take the trade.
Buy Condition:-
1. Bolling band should be widely open.
2. Check the support and resistance from CPR. Candle should close above support in green.
3. Check the trend bar at bottom, it should be green, if it is grey in colour dont enter in trade.
4. Candle should be closing above EMA 50 and its upto you if you need additional confirmation, you can use EMA 20, 50, 200 and SMA 50 and 200, this is optional.
5. You can use VWAP as support or resistance and you can turn it on from settings.
6. Trending HMA of 33 should be in green for buy.
7. Half trend Indicator should give buy signal.
8. Trend Strength Indicator for checking the strength of the trend, if the arrow is big upside, you can go for buy.
9. Exit from buy trade when it start showing very small arrow which means trend is about to change.
10.Exit buy trade at 61.8 Fib level
Sell Condition:-
1. Bolling band should be widely open.
2. Check the support and resistance from CPR. Candle should close below resistance in red.
3. Check the trend bar at bottom, it should be red, if it is grey in colour dont enter in trade.
4. Candle should be closing below EMA 50 and its upto you if you need additional confirmation, you can use EMA 20, 50, 200 and SMA 50 and 200, this is optional.
5. You can use VWAP as support or resistance and you can turn it on from settings.
6. Trending HMA of 33 should be in red for sell.
7. Half trend Indicator should give sell signal.
8. Trend Strength Indicator for checking the strength of the trend, if the arrow is big downside, you can go for sell.
9. Exit from sell trade when down arrows start showing very small in size which means trend is about to change.
10.Exit sell trade at 61.8 Fib level
Tìm kiếm tập lệnh với "200元+股票大盘"

Time Wolna_2021_iun3[wozdux] Description of the Time_Wolna indicator
The indicator is designed to study the behavior of time. There are many indicators that study just the price, a little less indicators that study the volume of trading and vanishingly few indicators that study time.
This is not an oscillator, it does not have oversold or overbought levels. This indicator has an indefinite beginning and an indefinite end. Its value is not in the absolute values of the indicator, but in relative ones. This indicator calculates the time of price rise and the time of price decline. It clearly shows how long the price rises and how long the price falls.
The initial idea was to use my RSIVol indicator to study the time. Each bar is counted as a unit of time. If the price rises during the period of one bar, then one is added, if the price falls, then one is subtracted. By default, the blue line shows this time movement according to the RsiVol indicator.
The basic RsiVol indicator is shown at the bottom of the diagram. The bill goes along the blue line, which calculates the movement of the volume price. If the blue RSIVol line is above the yellow level, then the blue Time_Wolna time line is colored green. If the blue line in the base RsiVol indicator falls below the lower yellow level, then the blue time line of the Time_Wolna indicator turns red.
The result is a broken line that clearly shows the waves of rising and falling prices. In principle, the time indicator makes it easier to recognize waves.
It is known that time plays an important role in Elliott wave analysis, although in practice this is almost never done. The mention of Elliott is just a lyrical digression.
Time is very difficult to study. This indicator does not give clear buy or sell signals. This is just an analysis tool to help analysts.
In addition to the RsiVol indicator, simply the Rsi from the price and a simple moving average from the price are also used.
So, the settings of this indicator.
"switch Price == close <==> ( High+Low)/2" -- select the base price in all subsequent calculations
"Key EMA=> True=ema(Price); False=ema(Price*Volume)" --The key for switching the moving average from the price or from the volume price.
"T==> EMA(price, T)" --The period for calculating the moving average
" key red==> Yes/No Rsi")--the key turns on or off the RSI line red line
"key green==> Yes/No Orsi") --the key turns on or off the Volume RSI line green line
" key olive==> Yes/No RsiVol200 " -- the key enables or disables the Volumetric RSIVol200 olive line. This is RsiVol minus the 200-period moving average.
"keyVol blue==> Yes/No " - the key enables or disables the base blue line RSIVol
"keyVol blue==> V->tt(RsiVol) ->tt(ema(Price))"—The blue line selection will be calculated as the time from RSIVol or as the time from the moving average EMA.
"keyVol blue==> : 1=Time, 2=Time* price, 3=Time*(Ci-Ck) 4=Time*Volume, 5=Time*price*Volume")- selection for the blue baseline. By default, the time of the price rise or fall is calculated simply. Key=1. But you can investigate the joint influence of time and price and then the key is=2. If we study the combined effect of time and price changes per bar, then the key=3. If we study the joint influence of time and volume, then the key=4. If we study the joint influence of time, price and volume, then the key=5.
"key RsiO red + green==> : 1=Time, 2=Time*Price, 3=Time*(Ci-Ck) 4=Time*Volume, 5=Time*Price*Volume") - - - similar settings for the red green line. By default, the time of the price rise or fall is calculated simply. Key=1. But you can investigate the joint influence of time and price and then the key is=2. If we study the combined effect of time and price changes per bar, then the key=3. If we study the joint influence of time and volume, then the key=4. If we study the joint influence of time, price and volume, then the key=5.
"Key Color – - here you can disable changing the color of the blue line to green or red when the base indicator RsiVol exits above the upper and below the lower levels.
"Level nul ==> * Down Level Rsi - screen configuration in order to raise or lower chart
"Level nul ==> * Down Level ORsi -- beauty setup in order to raise or lower chart
"Level nul ==> * DownLevel RsiVol200 -- beauty setup in order to raise or lower chart
"blue =volume * price" – period for calculation of volumetric rates
"blue => RSIVOL(Volume*price,len) and EMA" – the period for calculating RsiVol
"blue__o1=> ema ( RSIVOL, o1)" – additional smoothing RsiVol
"red=rsi (Price,14)" – the period for calculating Rsi
"red= ema ( RSI ,3)" -- additional smoothing Rsi
"fuchsia__ => RsiVol200 (vp,200)" - the period for calculating RsiVol200
"fuchsia__o2=> ema ( RSIVOL200 , o2)" -- additional smoothing RsiVol200
To study the time between two fixed dates. Setting the start point of the calculation and the end point of the calculation
"Data(0)=Year" – the year of the start date
"Data(0)= Month" – the month of the start date
"Data (0)=Day" the day of the start date
"Data(1)=Year" – the year of the end date.
"Data(1)=Year" – month of the end date.
"Data(1)=Day" -- the day of the end date.
--------русский вариант описания ------
Описание индикатора Time_Wolna
Индикатор призван изучать поведение времени. Есть много индикаторов изучающих просто цену, немного меньше индикаторов изучающих объем торгов и исчезающе мало индикаторов, изучающих время.
Это не осциллятор у него нет уровней перепроданности или перекупленности. Данный индикатор имеет неопределенное начало и неопределенный конец. Ценность его не в абсолютных значениях индикатора, а в относительных. Этот индикатор высчитывает время подъема цены и время снижения цены. Он наглядно показывает сколько времени цена поднимается и сколько времени цена опускается.
Первоначальная идея была использовать мой индикатор RSIVol для изучения времени. Каждый бар считается за единицу времени. Если цена поднимается за период одного бара, то прибавляется единица, если цена опускается, то вычитается единица. По умолчанию голубая линия показывает такое движения времени по индикатору RsiVol.
Внизу на диаграмме показан базовый индикатор RsiVol. Счёт идет по синей линии, которая вычисляет движение объемной цены. Если синяя линия RSIVol находится выше желтого уровня, то голубая линия времени Time_Wolna окрашивается в зеленый цвет. Если синяя линия в базовом индикаторе RsiVol опускается ниже нижнего желтого уровня, то голубая линия времени индикатора Time_Wolna окрашивается в красный цвет.
В результате получается ломанная линия, четко показывающая волны восхождения и снижения цены. В принципе индикатор времени позволяет легче распознавать волны.
Известно, что время играет важную роль в волновом анализе Эллиотта, хотя на практике это почти никогда не делается. Упоминание Эллиотта это просто лирическое отступление.
Время очень трудно изучать. Этот индикатор не дает четких сигналов на покупку или продажу. Это всего лишь инструмент анализа в помощь аналитикам.
Кроме индикатора RsiVol, используются и просто Rsi от цены и простая скользящая средняя от цены.
Итак, настройки данного индикатора.
"switch Price == close <==> ( High+Low)/2" -- выбираем базовую цену во всех последующих вычислениях
"Key EMA=> True=ema(Price); False=ema(Price*Volume)" --Ключ переключения скользящей средней от цены или от объемной цены.
" T==> EMA(price,T)"--Период вычисления скользящей средней
"key red==> Yes/No Rsi")--ключ включает или выключает линию RSI красная линия
"key green==> Yes/No Orsi") --ключ включает или выключает линию Объемной RSI зеленая линия
"key olive==> Yes/No RsiVol200" -- ключ включает или выключает линию Объемной RSIVol200 оливковая линия. Это RsiVol минус 200-периодная скользящая средняя.
"keyVol blue==> Yes/No " – ключ включает или выключает базовую голубую линию RSIVol
"keyVol blue==> V->tt(RsiVol) ->tt(ema(Price))"—выбор голубая линия будет вычисляться как время от RSIVol или как время от скользящей средней EMA.
"keyVol blue==> : 1=Time, 2=Time* price, 3=Time*(Ci-Ck) 4=Time*Volume, 5=Time*price*Volume")—выбор для голубой базовой линии. По умолчанию вычисляется просто время подъема или опускания цены. Ключ=1. Но можно исследовать совместное влияние времени и цены и тогда ключ=2. Если изучаем совместное влияние времени и изменения цены за один бар, то ключ=3. Если изучаем совместное влияние времени и объема, то ключ=4. Если изучаем совместное влияние времени, цены и объема, то ключ=5.
"key RsiO red + green==> : 1=Time, 2=Time*Price, 3=Time*(Ci-Ck) 4=Time*Volume, 5=Time*Price*Volume") ---аналогичные настройки для красной зеленой линии. По умолчанию вычисляется просто время подъема или опускания цены. Ключ=1. Но можно исследовать совместное влияние времени и цены и тогда ключ=2. Если изучаем совместное влияние времени и изменения цены за один бар, то ключ=3. Если изучаем совместное влияние времени и объема, то ключ=4. Если изучаем совместное влияние времени, цены и объема, то ключ=5.
"Key Color" – здесь можно отключить изменение цвета голубой линии на зеленый или красный в моменты выхода базового индикатора RsiVol выше верхнего и ниже нижнего уровней.
"Level nul ==> * Down Level Rsi - косметическая настройка для того, чтобы поднять или опустить график
"Level nul ==> * Down Level ORsi -- косметическая настройка для того, чтобы поднять или опустить график
"Level nul ==> * DownLevel RsiVol200 -- косметическая настройка для того, чтобы поднять или опустить график
" blue =>volume * price" – период для вычисления объемной цены
" blue => RSIVOL(Volume*price,len) and EMA" – период для вычисления RsiVol
"blue__o1=> ema ( RSIVOL, o1)" – дополнительное сглаживание RsiVol
" red=rsi (Price,14)" – период для вычисления Rsi
" red= ema ( RSI ,3)" -- дополнительное сглаживание Rsi
"fuchsia__ => RsiVol200 (vp,200)" -- период для вычисления RsiVol200
"fuchsia__o2=> ema ( RSIVOL200 , o2)" -- дополнительное сглаживание RsiVol200
Для исследования времени между двумя фиксированными датами. Задаем начальную точку вычисления и конечную точку вычисления
"Data(0)=Year" – год начальной даты
"Data(0)= Month" – месяц начальной даты
"Data(0)=Day" день начальной даты
"Data(1)=Year" – год конечной даты.
"Data(1)=Year" – месяц конечной даты.
"Data(1)=Day" -- день конечной даты.

[francrypto® strategy] 4 EMAs, P.SAR & Vol.Prof. (by kv4coins)(ENG)
This script consists of my own strategy for cryptocurrency (but can be adapted very well for stocks, forex, etc.)
Is a combination of:
- Four Exponentials Moving Average (EMA), configurables: by defect are 10, 21, 55 and 200 periods in yellow, aqua, orange and blue each of them
- Parabolic SAR System (PSAR), configurable
- Volume Profile (that has been developed by kv4coins - he has already authorized me to use it under the same OSS Licence Terms: MPL 2.0), configurable: with another default values and bilingual support for Spanish (SPA)
How it works
1) It is always better to detect specifics candlesticks or patrons: doji , pinbar or inverted pinbar , engulfing bars , morning star or evening star , harami , twizzer bottom or top , etc.
2) The 10 and 21 periods EMA help to identify the short-term behavior
3) The 55 periods EMA can be used like a support or resistance in medium-term, as 200 periods EMA in very long-term
4) It will convenient search for a double cross (10 & 21) or a triple cross (10, 21 & 55) to determine the medium-term change Downtrend to UpTrend (or viceversa)
5) Confirm the change patron with the Parabolic SAR and then identify potencials purchases or sales
6) Use Volume profile to detect potential supports or resistances areas, in order to set stop limit/loss and take profit orders.
Hope this helps!
Cheers,
FRANCRYPTO®
–––––– 0 ––––––
(ESP)
Este script consiste en mi propia estrategia para criptomonedas (pero puede adaptarse muy bien para acciones, forex, etc.)
Es la combinación de:
1) Cuatro Medias Móviles Exponenciales (EMA), configurables: por defecto son de 10, 21, 55 y 200 períodos en amarillo, turquesa, naranja y azul cada una de ellas
2) Sistema Parabolic SAR (PSAR), configurable
3) Perfil de Volumen (que fuera desarrollado por kv4coins - que ya me ha autorizado a su uso bajo las mismas condiciones de la Licencia OSS: MPL 2.0), configurable: con otros valores por defecto y soporte bilingüe para Español (SPA)
Cómo funciona
1) Siempre va a resultar mejor detectar velas japonesas específicas o patrones: doji , martillos o martillos invertidos , velas envolventes , patrón amanecer o atardecer , harami , velas gemelas , etcétera
2) La EMA de 10 y 21 períodos ayudan a identificar el comportamiento de corto plazo
3) La EMA de 55 períodos puede ser usada como un soporte o resistencia de mediano plazo, como así también, la EMA de 200 períodos en el muy largo plazo
4) Será conveniente buscar un doble cruce (10 & 21) o un triple cruce (10, 21 & 55) para determinar un cambio de la tendencia de mediano plazo de bajista hacia alcista (o viceversa)
5) Confirmá el patrón de cambio con la Parabólica de SAR y entonces identificá potenciales compras o ventas
6) Usá el perfil de volumen para detectar las potenciales zonas de soporte o resistencia, principalmente para establecer ordenes stop limit/loss o take profit.
¡Espero que pueda serles de utilidad!
Saludos,
FRANCRYPTO®

TV Community AlgoTV Community Algo is a free TradingView script that I designed from the ground to benefit the traders of this community. It has plenty of features that you will enjoy, and I have included documentation for how to use this below!
Settings:
Basic:
Turn the Void Lines on or off
Turn the Dashboard on or off
Turn the Signal Bars on or off
Turn the Support & Resistance Lines on or off
Turn the EMA 8 and EMA 200 on or off
Turn the Buy & Sell Signals on or off
Turn the Fibonacci Retracement Tool on or off
Style:
Change the Dashboard's distance from the price action
Change the Dashboard's Color and Transparency
Change the Dashboard Text Color
Change the Fibonacci Deviation
Make the Fibonacci Retracement Tool reverse
Make the Fibonacci Lines extend left, right, both directions, or none
Turn Fibonacci Prices on or off
Turn Fibonacci Levels on or off and change between percent or value
Change Fibonacci Label Position from the left or the right
Usage:
This algo has many uses including but not limited to:
Finding entries and exits using the EMA 8 and EMA 200 crossovers
Using the Void Lines to identify bounces or reversals
Using the Signal Bars to identify trend and confirmation for entries and exits
Using the Dashboard information for confirmation and informational purposes
In the images below, I give a few examples of the many uses of the TV Community Algo!
VOID LINES
The Void Lines are very helpful when it comes to identifying reversals.
TV COMMUNITY ALGO DASHBOARD
The Dashboard is filled with useful information that all traders can benefit from!
SIGNAL BARS
The colored candles known as Signal Bars inform you of when the price action is above or below the midpoint of the Void Lines.
AUTO SUPPORT & RESISTANCE LINES
These lines help traders find accurate levels of support & resistance on all time frames, and the lines change color depending on if the price is above or below them.
EMA 8 AND 200
The EMA 8 and EMA 200 crossovers can be used as entry and exit signals.
BUY & SELL SIGNALS
The BUY & SELL signals can be used to find optimal entries and exits for trades on any time frame. Smaller time frames are best for scalping, while larger time frames are more suited for longer trades. When combined with the EMA lines and Dashboard information, these signals can produce incredibly profitable trades.
AUTO FIBONACCI RETRACEMENT TOOL
The Auto Fibonacci Retracement Tool allows you to plot perfect Fib Lines every time.
Conclusion:
I truly hope that the TV Community Algo benefits the TradingView community and that you all find some value in it. I worked very hard on this product and I would love to see it put to good use.
with love,
-Lemon 🍋
This work is licensed under a Attribution-NonCommercial-ShareAlike 4.0 International (CC BY-NC-SA 4.0) creativecommons.org

CT Moving Average Crossover IndicatorMoving Average Crossover Indicator
Here I present a moving average indicator with 9 user definable moving averages from which up to 5 pairs can be selected to show what prices would need to be closed at on the current bar to cross each individual pair.
I have put much emphasis here on simplicity of setting the parameters of the moving averages, selecting the crossover pairs and on the clarity of the displayed information in the optional “Moving Average Crossover Level” Information Box.
What Is a Moving Average (MA)?
According to Investopedia - “In statistics, a moving average is a calculation used to analyze data points by creating a series of averages of different subsets of the full data set.
In finance, a moving average (MA) is a stock indicator that is commonly used in technical analysis. The reason for calculating the moving average of a stock is to help smooth out the price data by creating a constantly updated average price.
By calculating the moving average, the impacts of random, short-term fluctuations on the price of a stock over a specified time-frame are mitigated.”
The user can set the color, type (SMA/EMA) and length of each of the 9 moving averages.
Then the user may choose 5 pairs of moving averages from the set of 9.
The script will then calculate the price needed to be crossed by the close of the current bar in order to crossover each of the user defined pairs and outputs the results as optional lineplots and/or an Infobox which shows the relevant information in a very clear way.
The user may switch the moving averages, crossover lineplots and infobox on and off easily with one click boxes in the settings menu.
The number of decimal places shown in the Infobox can be altered in the settings menu.
If the price required to cross a pair of moving averages is zero or less, the crossover level will display “Impossible” and the plots will plot at zero. (this helps ameliorate chart auto-focus issues)
Quoting a variety of online resources …….
Understanding Moving Averages (MA)
Moving averages are a simple, technical analysis tool. Moving averages are usually calculated to identify the trend direction of a stock or to determine its support and resistance levels. It is a trend-following—or lagging—indicator because it is based on past prices.
The longer the time period for the moving average, the greater the lag. So, a 200-day moving average will have a much greater degree of lag than a 20-day MA because it contains prices for the past 200 days. The 50-day and 200-day moving average figures for stocks are widely followed by investors and traders and are considered to be important trading signals.
Moving averages are a totally customizable indicator, which means that an investor can freely choose whatever time frame they want when calculating an average. The most common time periods used in moving averages are 15, 20, 30, 50, 100, and 200 days. The shorter the time span used to create the average, the more sensitive it will be to price changes. The longer the time span, the less sensitive the average will be.
Investors may choose different time periods of varying lengths to calculate moving averages based on their trading objectives. Shorter moving averages are typically used for short-term trading, while longer-term moving averages are more suited for long-term investors.
There is no correct time frame to use when setting up your moving averages. The best way to figure out which one works best for you is to experiment with a number of different time periods until you find one that fits your strategy.
Predicting trends in the stock market is no simple process. While it is impossible to predict the future movement of a specific stock, using technical analysis and research can help you make better predictions.
A rising moving average indicates that the security is in an uptrend, while a declining moving average indicates that it is in a downtrend. Similarly, upward momentum is confirmed with a bullish crossover, which occurs when a short-term moving average crosses above a longer-term moving average. Conversely, downward momentum is confirmed with a bearish crossover, which occurs when a short-term moving average crosses below a longer-term moving average.
Types of Moving Averages
Simple Moving Average (SMA)
The simplest form of a moving average, known as a simple moving average (SMA), is calculated by taking the arithmetic mean of a given set of values. In other words, a set of numbers–or prices in the case of financial instruments–are added together and then divided by the number of prices in the set.
Exponential Moving Average (EMA)
The exponential moving average is a type of moving average that gives more weight to recent prices in an attempt to make it more responsive to new information.
To calculate an EMA, you must first compute the simple moving average (SMA) over a particular time period. Next, you must calculate the multiplier for weighting the EMA (referred to as the "smoothing factor"), which typically follows the formula: 2/(selected time period + 1). So, for a 20-day moving average, the multiplier would be 2/(20+1)= 0.0952. Then you use the smoothing factor combined with the previous EMA to arrive at the current value.
The EMA thus gives a higher weighting to recent prices, while the SMA assigns equal weighting to all values.

Structure AnalyzerA momentum indicator that uses the highest and lowest values for price in three different lookback lengths to find the performance relative to three timeframes.
- The yellow line is the product of the price performance in three different timeframes.
- The red line is 200 EMA of the performance.
- The blue columns represent the same calculation or the volume(OBV based).
- The aqua line is the 200 EMA of the volume performance.
How to use: Whenever the performance crosses above the 200 EMA, the price is in an uptrend.
Important: When in a downtrend, the performance will stay below the 200 EMA for a long time; hence it is important o wait until the crossover.

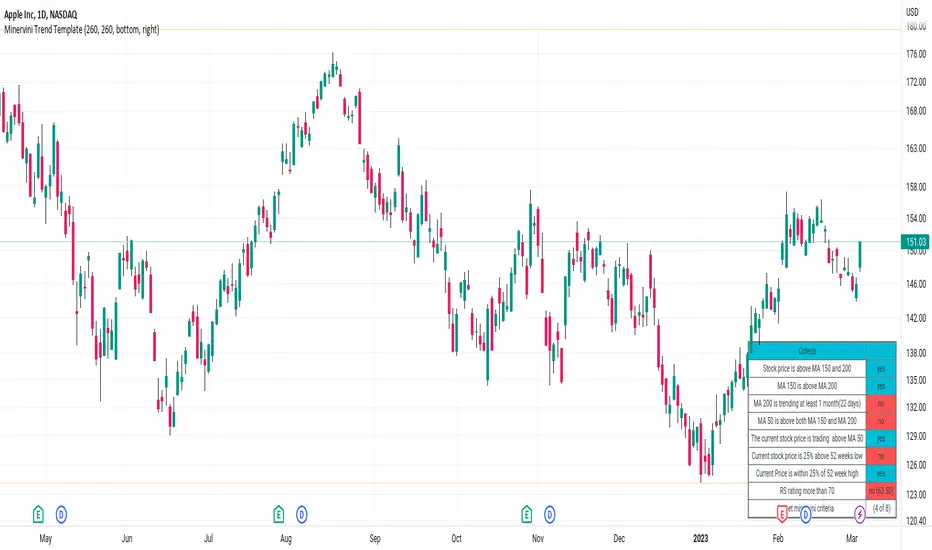
Minervini Trend TemplateMinervini Trend Template
1. Stock price is above MA 150 and 200
2. MA 150 is above MA 200
3. MA 200 is trending at least 1 month(22 days)
4. MA 50 is above both MA 150 and MA 200
5. Current stock price is 25% above 52 weeks low
6. Current Price is within 25% of 52 week high
7. RS Ratings
Xiang Stoch MACD 200EMAStochastic + MACD + 200 EMA indicator
Green flag
1) MACD crossover Signal line
2) Stochastic in oversold region (=80)
3) Below 200 EMA (direction of trend)
I use 200 EMA to determine the direction of the trend, (can ignore point 3 for both flag if you got other ways).
If green flag, high possibility of market going up.
If red flag, high possibility of market going down.

ARI-DPO TrendThis is a new indicator that uses DPO (Detrended Price Oscillator) and calculating its HMA 200 and EMA 200 is able to show the current price direction.
if the line is below 0 the market is in a downtrend in the short term, otherwise, the market is in an uptrend.
if the line is red, the market is in a downtrend in the long term (bearish), otherwise, the market is in a long term uptrend (bullish)
a sequence of red/green lines means that the market is choppy
Currently, I'm using it with cryptocurrencies to assess if the short term price action.
How it works:
the indicator calculates the DPO (default 21 periods) and its HMA (default 200 periods) and EMA (default 200 periods) and shows if the DPO is above both HMA and SMA (indicator line above 0 and green), below both (indicator line below 0 and red) or between (the indicator line and the colour are not matching: e.g. red line above the zero or green line below zero). the latter is the classic situation of a choppy market or a possible short term reversal.
The aim of this indicator is to find a good entry point for long/short positions.
I'm still testing and improving it, please
let me know in the comments if you find this useful. Cheers!

GAURs Polynomial Regression ChannelsThanks to The Sweet Lord , here is the Gaur's Polynomial Regression Channel.
Its a Polynomial Regression Channel but applied a little differently. Wont go into technical details much. Overview of options is as follows-
- - - - - - - - - - - - - - - - - - - - - - - - - - - - - - - - - - - - - - - - - - - - - - - - - - - - - - - - - - - - - - - - - - - - - - - - - - - - - - - - - - - - - - - - - - - - - - - -
Channel Options
- - - - - - - - - - - - - - - - - - - - - - - - - - - - - - - - - - - - - - - - - - - - - - - - - - - - - - - - - - - - - - - - - - - - - - - - - - - - - - - - - - - - - - - - - - - - - - - -
1. Degree of Polynomial: 1/2/3
Default = 3
Defines the degree of polynomials - 1,2,3. Note here, degree 1 will not be a straight line since its applied differently.
Try different degrees for different fits and market conditions.
2. Channel Length:
Default 30 (candles)
You can go beyond 100 or 200 candle lengths but smaller is the usual preference of Poly-Reg-channel traders. It all depends on market conditions and your style of trading. Do your research. I am usually comfortable with a range of 20-50 (in crypto markets).
3. Basis of Channel height/boundries: ATR/Manual
Default: ATR
ATR provides a dynamically adjusted entry/exit bounds of the channels. As ATR changes, the channel bounds also changes its height. It can also be fixed manually. Manual heights wont change automatically.
4. Basis of Y-Value: open/close/ sma / ema / wma /hilow
Default: close
Y- value is the y value of the (x,y) coordinates used while calculating the regression coefficients. Dont worry about it, its nothing serious.
5. Apply channel smoothning using sma?: Yes/No
Default: Yes
Without smoothning, the channel does not "look" good.
6. Shaded Area Height Percentage:
Its the extra margin for the channel. Its in percentage of the total height (defined 3 above) of channels. The shaded area provides an extra allowance for your entries or exits beyond the ATR or manual heights.
7. Plot RSI?: Yes/No
Default: Yes
Plots RSI (orange line in between the channel - its different from the dotted center line) considering the downbound of channels as 0 (oversold) and upbound of channels as 100 (overbought)
8. Plot 200 sma?: Yes/No
Default: Yes
It plots a 200 period fast (green) and 225 period slow (red) sma . I usually use two MAs. Its visually very easy to understand.
- - - - - - - - - - - - - - - - - - - - - - - - - - - - - - - - - - - - - - - - - - - - - - - - - - - - - - - - - - - - - - - - - - - - - - - - - - - - - - - - - - - - - - - - - - - - - - - -
Sample Strategy
- - - - - - - - - - - - - - - - - - - - - - - - - - - - - - - - - - - - - - - - - - - - - - - - - - - - - - - - - - - - - - - - - - - - - - - - - - - - - - - - - - - - - - - - - - - - - - - -
You can develop your own strategy with the channels. But following is just one of the ways you can trade.
Best Application: Ranging markets. But can be happily used in volatile conditions, with a little experience.
1. SMA: -- (this condition is optional really)
If green (200) is above red (225) go only long. If red is above green go only short. Defines long term trend of the market.
2. Channel slope: -- (this stuff needs practice/experience)
Depending on the channel slope, like if its tending to go up or down, you can choose to take only short or long trades. It defines short term momentum of the market.
3. ATR based heights:
Since its ATR based, the channel height are our natural entry and exit points.
Long:
When price touches lower shaded area, consider possible long entry. Exit on price entering the upper shaded area.
Short:
Enter on upper bound shaded area, exit on lower.
4. RSI:
For additional conformations. Again note, the RSI considers the lower bound of channel as 0 and upper as 100. But since, the channel moves up and down, the RSI will also move not only as RSI but also with the channel. Meaning, say if the RSI is valued at 50, then it will be near the center of the channel but since the center changes as time and price changes, the RSI valued at 50 at different times will not be at the same horizontal level respect to the graph, although it will be at the same level (center) respect to the channel.
5. PRC Channel Percentage label:
This label is at the lower side a bit ahead of the current candle. Provides you info on what is the channel percentage. This is especially helpful in crypto markets to gauge your possible percentage profit where profits can be much higher than forex or other instruments. It can also helps you select a suitable market/instrument if the channels are based on ATR.
6. Extra indicators:
I usually use stochastic along with this setup for extra conformations.
- - - - - - - - - - - - - - - - - - - - - - - - - - - - - - - - - - - - - - - - - - - - - - - - - - - - - - - - - - - - - - - - - - - - - - - - - - - - - - - - - - - - - - - - - - - - - - - -
Donate
- - - - - - - - - - - - - - - - - - - - - - - - - - - - - - - - - - - - - - - - - - - - - - - - - - - - - - - - - - - - - - - - - - - - - - - - - - - - - - - - - - - - - - - - - - - - - - - -
Use freely and donate generously if you find value. Your help will really help.
I had earlier provided BTC addresses for donations but it seems to violate TV House rules.
Hope they make TV coins redeemable in future.
- Pranav Joshi
- - - - - - - - - - - - - - - - - - - - - - - - - - - - - - - - - - - - - - - - - - - - - - - - - - - - - - - - - - - - - - - - - - - - - - - - - - - - - - - - - - - - - - - - - - - - - - - -
Extra Info
- - - - - - - - - - - - - - - - - - - - - - - - - - - - - - - - - - - - - - - - - - - - - - - - - - - - - - - - - - - - - - - - - - - - - - - - - - - - - - - - - - - - - - - - - - - - - - - -
// © cpranavjoshi
// special thanks to the "Trading View" people for providing this great platform for free
// ------------------------
// MATH
// ------------------------
// special thanks to an article on the web that provided layman friendly explanation of the maths
// unfortunately i wont be able to provide the link to that article owing to TV restrictions, though i sincerely would have liked to credit the author.
// Google search this phrase, and you should be able to get it in one of the first results - "polynomialregression Mathematics of Polynomial Regression"
// my regression math calculation is a further resolution upon the generalized matrix formula given in the that article.
// the generalized matrix looks scary but in fact its much simpler than one may assume
// the summation sign things are just float numbers that can be easily found out
// so we get a matrix with number of equations equal to the number of unknowns.
// e.g. if its a 3rd degree poly, it has 4 unknowns (c0,c1,c2,c3) with 4 equations as in the generalized matrix
// it can be resolved by simple algebra
// Note: the results have been verified with excel using same input data points.
// pine was difficult for me so i coded it in python first to verify
// ------------------------
// WHY
// ------------------------
// this script was coded because Pranav badly needed Polynomial channels (had used them in mt4 earlier)
// and at the time of this coding, i could not find any readily available script in the trading view public library ( tnx public)
// the complex math was probably the hurdle
// i m not good in maths, but by the Will of the Lord, i could resolve the issue with simple algebra and logic
// ------------------------
// PINE
// ------------------------
// i am just an average (even poor probably) programmer and pine script is not my language
// this is a humble attempt to write my first pine with whatever i could do quickly
// experts - feel free to develop if needed. have used some workarounds in drawings/plottings. rectify them if possible
//
//
// - Pranav Joshi

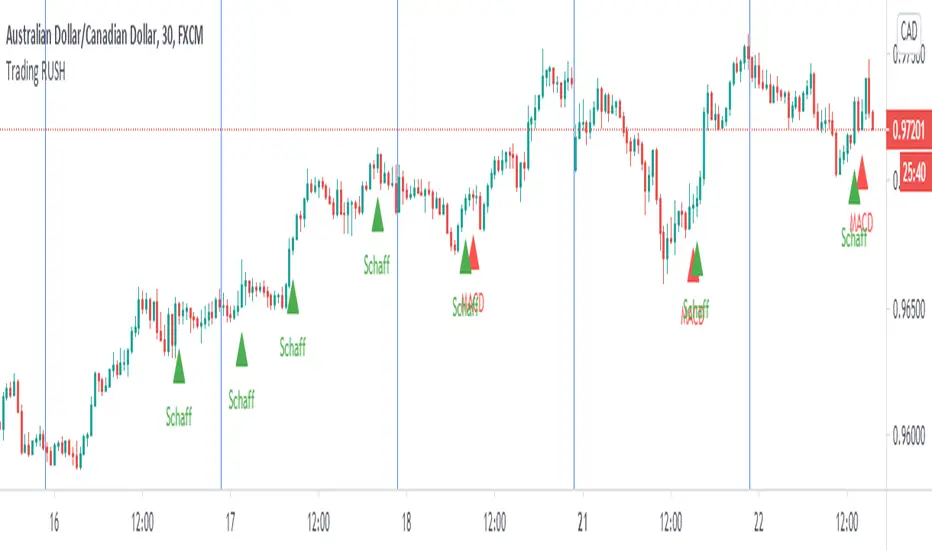
Trading Rush Signals & AlertsThis is an unofficial script for strategies tested on TRADING RUSH Youtube channel. Over time, most successful strategies will be added with an option to set strategy-specific alerts . Trading Rush Signals & Alerts will draw signals on the chart when the entry conditions are met. You can also opt for displaying indicators .
My script is meant for beginners but can be used by veterans too. Just pick only one or two strategies, you don't want to flood your chart with conflicting signals. You may want to support your trades with a proper analysis. If a new signal occurs when there is still an open position, you are not supposed to take another.
The current version includes MACD and Donchian Channels.
MACD strategy:
►Buy, when MACD crosses below the signal line when it is negative. The price must also be above 200 EMA.
►Sell, when MACD crosses above the signal line when it is positive. The price must also be below 200 EMA.
►This strategy was tested on 30-minute charts of EURUSD and EURJPY with reward-to-risk ratio 1,5 and win rate of 62% over 100 trades .
►►►MACD has to be added to your chart separately because it needs a new window. Indicators displaying will not add this indicator to the chart.
Donchian Channels strategy:
►Buy, when the price breaches Donchian to the upside after making a new low. The price must also be above 200 EMA.
►Sell, when the price breaches Donchian to the downside after making a new high. The price must also be below 200 EMA.
►Stop-loss is Donchian bottom for long and Donchian top for shorts. Check the channel for more information.
►This strategy was tested on 30-minute charts of EURUSD with reward-to-risk ratio 1,5 and win rate of 58% over 100 trades .
►►►I programmed alerts for Donchians to come ahead of an actual breach. If you often leave the screen when trading, this will help you. The necessary downside for that is the alerts might come when the signal doesn't trigger in the end. You will see a mark on the chart if the conditions are truly met.
Bear in mind that backtesting performance doesn't guarantee future profitability. • Most systematic strategies are not suitable for any timeframe. • You should perform your own backtest to base your trades on more data & to establish confidence in the selected strategy.
New strategies will be added when I have time. If I see multiple people asking for the same new feature, I might agree to release it with a new version. I am not going to add input options in this script, it could come as a separate script though. I am in no way affiliated with the Youtubechannel , so if you find the script helpful, shot me a message or send me some TradingView coins >)
If you encounter any bug, you can report it in a message or in comments. Support it with screenshot and relevant information such as a time when it occurred and what options were on etc.
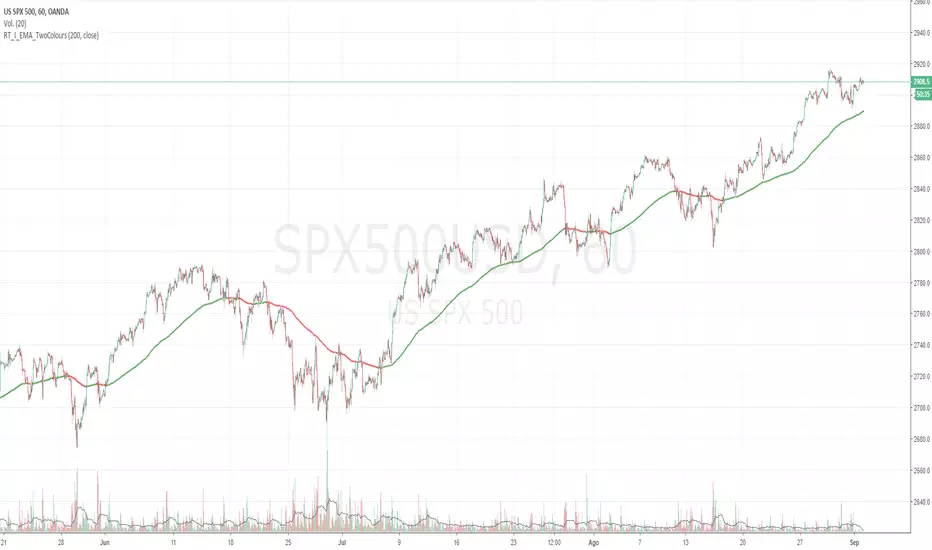
Moving average Two ColoursExponential moving average of 200 periods, which changes color according to the position of the candles.
(200 periods: default configuration Option to change periods allowed)
If the candles are on the EMA, this will have green color, otherwise red color (colors, thickness configurable).
**********************************************************************************************************************************************
Descripción en Español:
Media móvil Exponencial de 200 periodos, la cuál cambia de color según posición de las velas.
(200 periodos: configuración default. Opción de cambio de periodos permitida)
Si las velas están sobre la EMA , esta tendrá color verde, caso contrario color rojo (colores, grosor configurables).
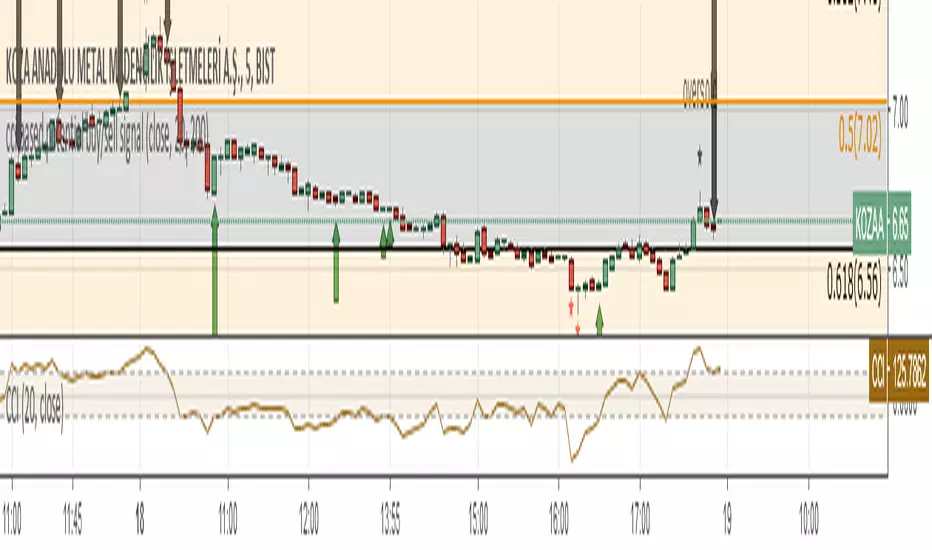
cci based potential buy/sell signal
Commodity Channel Index Potential Buy Signal
Commodity Channel Index (CCI) is below oversold line (-200).
CCI then crosses above -100 line
Commodity Channel Index Potential Sell Signal
Commodity Channel Index (CCI) is above overbought line (+200).
CCI then crosses below +100 line.
Türkçe Açıklama;
CCI Potansiyel Al Sinyali
CCI indikatörünün -200 altında bulunduğu bölgeler aşırı satış bölgeleri,
Sonrasında aşağıdan gelerek -100 çizgisinin üzerine çıktığı yada çıkmak üzere olduğu noktalar al sinyali
CCI Potansiyel Satl Sinyali
CCI indikatörünün +200 üzerinde bulunduğu bölgeler aşırı alım bölgeleri,
Sonrasında yukarıdan inerek +100 çizgisinin altına indiği yada inmek üzere olduğu noktalar sat sinyali
Not: Tek başına kullanılması son derece hatalı sonuçlar verebilir. Sadece olabilirlik potansiyeli taşımaktadır.
Exponential Moving Average (Set of 3) [Krypt] + 13/34 EMAsI took Krypt's script and essentially added on to it.
the 20/50/100/200 EMAs should be used together as support and resistance as normal.
Wait for price to break 200 EMA
Wait for 50 EMA to cross 200 EMA
Wait for pullback to 50 EMA to open position
20 and 100 EMAs are for extra information about moving support and resistance
and 13/34 EMAs should be used in conjunction
When 13 EMA crosses 34 EMA, open position
When price gets far from 13/34, close position (because price will attempt to revert back to mean)
This is better for scalping and swing trades than the 20/50/100/200 setup.
Twitter: @AzorAhai06

ST_Trend_ReversalSTRONG TREND REVERSAL INDICATOR
The code is the percentage difference between the spot price of a given financial asset and its 200-day MA of that period. My standard setup is Daily, and I think it's got very good predictive power at that timeframe.
It can be read in two ways:
1. Values extremely above or below the 200-period MA present chances of buying/selling agains the prevailing trend.
2. Values closely above or below the 200-period MA are make-or-break market periods, where a medium-term trend becomes evident. Breaks above or below the MA are associated with strong chances of directional movements. But it's not fool-proof as false breaks have become commonplace nowadays.
Other way to use it is as confirmation of breakdowns: For example, an asset that loses its 200-day MA and then can't rally above it becomes exposed to steep losses afterwards.
It's also helpful to use in volatility trading: the closer the asset goes to its MA, the lower goes implied vol, and thus better opportiunities to be long volatility on those occasions where direction is hard to predict.
STRI = close/(200dMA)
Values over 100 indicate percentage premiums of spot vs its moving average.
Values below indicate percentage discounts of spot vs its moving average.

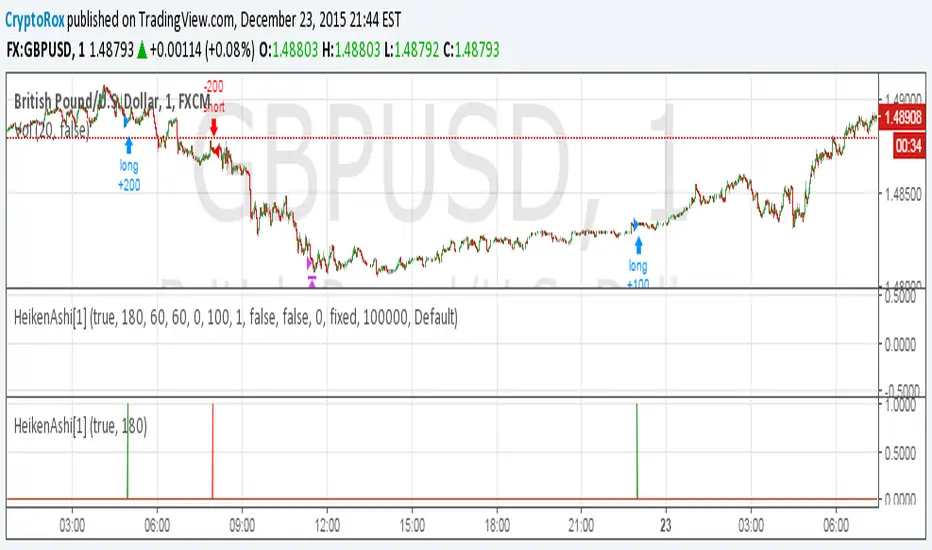
HeikenAshi[1]This is the alert script so you can automate this strategy using AutoView:
Make sure to use
crossing down value 0.9 once per bar (on condition) for this.
For the alert Message if you're using AutoView:
Long GBPUSD
c=order b=short
c=position b=short l=200 t=market
b=long q=0.01 l=200 t=market tp=60 sl=60
Short GBPUSD
c=order b=long
c=position b=long l=200 t=market
b=short q=0.01 l=200 t=market tp=60 sl=60
How to automate this strategy for free using a chrome extension.Hey everyone,
Recently we developed a chrome extension for automating TradingView strategies using the alerts they provide. Initially we were charging a monthly fee for the extension, but we have now decided to make it FREE for everyone. So to display the power of automating strategies via TradingView, we figured we would also provide a profitable strategy along with the custom alert script and commands for the alerts so you can easily cut and paste to begin trading for profit while you sleep.
Step 1:
You are going to need to download the Chrome Extension called AutoView. You can get the extension for free by following this link: bit.ly ( I had to shorten the link as it contains Google and TV automatically converts it to a symbol)
Step 2: Go to your chrome extension page, and under the new extension you'll see a "settings" button. In the setting you will have to connect and give permission to the exchange 1broker allowing the extension to place your orders automatically when triggered by an alert.
Step 3: Setup the strategy and custom script for the alerts in TradingView. The attached script is the strategy, you can play with the settings yourself to try and get better numbers/performance if you please.
This following script is for the custom alerts:
//@version=2
study("4All-Alert", shorttitle="Alerts")
src = close
len = input(4, minval=1, title="Length")
up = rma(max(change(src), 0), len)
down = rma(-min(change(src), 0), len)
rsi = down == 0 ? 100 : up == 0 ? 0 : 100 - (100 / (1 + up / down))
rsin = input(5)
sn = 100 - rsin
ln = 0 + rsin
short = crossover(rsi, sn) ? 1 : 0
long = crossunder(rsi, ln) ? 1 : 0
plot(long, "Long", color=green)
plot(short, "Short", color=red)
Now that you have the extension installed, the custom strategy and alert scripts in place, you simply need to create the alerts.
To get the alerts to communicate with the extension properly, there is a specific syntax that you will need to put in the message of the alert. You can find more details about the syntax here : gist.github.com
For this specific strategy, I use the Alerts script, long/short greater than 0.9 on close.
In the message for a long place this as your message:
Long
c=order b=short
c=position b=short l=200 t=market
b=long q=0.01 l=200 t=market tp=13 sl=25
and for the short...
Short
c=order b=long
c=position b=long l=200 t=market
b=short q=0.01 l=200 t=market tp=13 sl=25
If you'll notice in my above messages, compared to the strategy my tp and sl (take profit and stop loss) vary by a few pips. This is to cover the market opens and spread on 1broker. You can change the tp and sl in the strategy to the above and see that the overall profit will not vary much at all.
I hope this all makes sense and it is enough to not only make some people money, but to show the power of coming up with your own strategy and automating it using TradingView alerts and the free Chrome Extension AutoView.
ps. I highly recommend upgrading your TradingView account so you have access to back testing and multiple alerts.
There is really no reason you won't cover the cost and then some on a monthly basis using the tools provided.
Best of luck and happy trading.
Note: The extension currently allows for automation on 2 exchanges; 1broker and Okcoin. If you do not have accounts there, we'd appreciate you signing up using our referral links.
www.okcoin.com
1broker.com

ICT Order Block Identifier [Eˣ]📦 Order Block Identifier - Free Indicator
Overview
The Order Block Identifier automatically detects and displays institutional order blocks on your charts - the exact zones where banks, hedge funds, and market makers place their orders. Based on ICT (Inner Circle Trader) concepts, this indicator helps you trade alongside smart money by identifying where institutions are likely to defend their positions and where price often finds support or resistance.
━━━━━━━━━━━━━━━━━━━━━━━━━━━━
🎯 What This Indicator Does
Detects Order Blocks:
• 🟢 Bullish Order Blocks (OB+) - Last bearish candle before strong bullish move
• 🔴 Bearish Order Blocks (OB-) - Last bullish candle before strong bearish move
• Automatically identifies institutional buying/selling zones
• Tracks up to 30 order blocks simultaneously
• Works on all timeframes and instruments
Smart Features:
• Auto-Timeframe Adjustment - Optimizes detection for 1min to Weekly charts
• Active Block Highlighting - Shows which OB price is approaching (🎯)
• Mitigation Tracking - Knows when blocks are "used" and no longer valid
• ATR-Based Detection - Adapts to each instrument's volatility
• Strength Filtering - Choose Low/Medium/High to control sensitivity
Visual Display:
• Clean boxes extending from order block to current price
• Color-coded: Green (bullish), Red (bearish), Gray (mitigated)
• OB+ / OB- labels for quick identification
• Active blocks highlighted with 🎯 emoji
• Distance indicator showing how far price is from nearest OB
Statistics Panel:
• Count of active bullish and bearish order blocks
• Market bias based on OB balance
• Distance to nearest order block
• Real-time status updates
━━━━━━━━━━━━━━━━━━━━━━━━━━━━
📚 Understanding Order Blocks
What Are Order Blocks?
Order blocks are the "footprints" left behind by institutional traders (banks, hedge funds, market makers) when they enter large positions. Because institutions can't fill massive orders at once without moving the market, they:
1. Place orders gradually over time
2. Leave zones where their buy/sell orders are concentrated
3. Defend these zones when price returns
4. Create reliable support and resistance levels
The ICT Concept:
Developed by Michael Huddleston (Inner Circle Trader), order block theory states that:
• The last opposite-colored candle before a strong move contains institutional orders
• Price often returns to test these zones before continuing
• These zones act as strong support (bullish OB) or resistance (bearish OB)
• Smart money defends their positions at these levels
Why Order Blocks Work:
• Unfilled Orders: Institutions may still have pending orders in the block
• Position Defense: They protect their entries by adding to positions
• Stop Placement: Retail stops cluster near these zones (liquidity for institutions)
• Market Structure: Price respects these levels due to order flow dynamics
━━━━━━━━━━━━━━━━━━━━━━━━━━━━
🟢 Bullish Order Blocks Explained
How They Form:
1. Price is consolidating or declining
2. Institutions begin accumulating (buying)
3. A strong bullish move erupts
4. The last bearish candle before this move = Bullish Order Block
5. This candle represents where institutions were buying aggressively
Why The Last Bearish Candle?
• Institutions absorbed all selling pressure at this level
• Their buy orders filled as price was declining
• When price returns, they defend this zone with more buying
• It becomes a demand zone / support level
Trading Bullish Order Blocks:
Setup:
• Wait for price to retrace back to bullish OB (green box)
• Look for rejection/reversal pattern (pin bar, engulfing, etc.)
• Enter long when price bounces from the OB zone
• Stop loss: Below the order block
• Target: Recent high or opposite order block
Best Scenarios:
• OB aligns with other support (trendline, fibonacci, round number)
• First touch of OB (unmitigated) has highest probability
• Occurs during high-volume sessions (London/NY)
• Trend is bullish on higher timeframe
Example Trade:
• Bullish OB forms at $50,000 (last red candle before rally)
• Price rallies to $52,000 then retraces
• Price drops back to $50,100 (touching OB)
• Bullish pin bar forms on the OB
• Enter long at $50,200, stop at $49,800
• Target: $52,000+ (previous high)
━━━━━━━━━━━━━━━━━━━━━━━━━━━━
🔴 Bearish Order Blocks Explained
How They Form:
1. Price is consolidating or rising
2. Institutions begin distributing (selling)
3. A strong bearish move erupts
4. The last bullish candle before this move = Bearish Order Block
5. This candle represents where institutions were selling aggressively
Why The Last Bullish Candle?
• Institutions absorbed all buying pressure at this level
• Their sell orders filled as price was rising
• When price returns, they defend this zone with more selling
• It becomes a supply zone / resistance level
Trading Bearish Order Blocks:
Setup:
• Wait for price to retrace back to bearish OB (red box)
• Look for rejection/reversal pattern (shooting star, bearish engulfing)
• Enter short when price rejects from the OB zone
• Stop loss: Above the order block
• Target: Recent low or opposite order block
Best Scenarios:
• OB aligns with other resistance (trendline, fibonacci, round number)
• First touch of OB (unmitigated) has highest probability
• Occurs during high-volume sessions (London/NY)
• Trend is bearish on higher timeframe
Example Trade:
• Bearish OB forms at $48,000 (last green candle before drop)
• Price drops to $46,000 then retraces
• Price rallies back to $47,900 (touching OB)
• Bearish engulfing forms at the OB
• Enter short at $47,800, stop at $48,200
• Target: $46,000- (previous low)
━━━━━━━━━━━━━━━━━━━━━━━━━━━━
📊 How To Use This Indicator
Strategy 1: Order Block Retest (Classic)
Best For: Swing trading, capturing reversals
Timeframes: 15min, 1H, 4H, Daily
Win Rate: 60-70% (first touch)
Entry Rules:
1. Identify unmitigated order block (bright color, not gray)
2. Wait for price to return to the OB zone
3. Look for price action confirmation:
• Bullish OB: Pin bar, bullish engulfing, hammer
• Bearish OB: Shooting star, bearish engulfing, doji
4. Enter in the direction of the OB
5. Stop loss: Beyond the opposite side of OB (20-30 pips)
6. Target: 2-3R or opposite OB
Example:
• Bullish OB at $100-$102
• Price drops to $101.50 (enters OB)
• Bullish pin bar forms with low at $100.80
• Enter long at $102 (OB high), stop at $99.50
• Risk: $2.50, Target: $107.50 (3R)
Strategy 2: Break & Retest
Best For: Trend trading, breakout confirmation
Timeframes: 5min, 15min, 1H
Win Rate: 65-75%
Entry Rules:
1. Price breaks through an order block
2. Wait for pullback to the broken OB
3. The OB now acts as support (if broken up) or resistance (if broken down)
4. Enter when price respects the flipped OB
5. Stop: Inside the OB zone
6. Target: Next OB or structure level
Why It Works: Broken OBs flip polarity - support becomes resistance and vice versa
Strategy 3: Multi-Timeframe Confirmation
Best For: High-probability setups
Timeframes: Combine 1H + 4H or 15min + 1H
Win Rate: 70-80%
Entry Rules:
1. Identify order block on higher timeframe (4H or Daily)
2. Switch to lower timeframe (1H or 15min)
3. Wait for lower TF order block to form within higher TF OB
4. Trade the lower TF OB in direction of higher TF OB
5. Stop: Below lower TF OB
6. Target: Edge of higher TF OB or beyond
Why It Works: Alignment across timeframes = institutional consensus
Strategy 4: Order Block to Order Block
Best For: Range trading, swing entries
Timeframes: 1H, 4H
Win Rate: 55-65%
Entry Rules:
1. Identify both bullish OB below and bearish OB above
2. Price is ranging between these OBs
3. Enter long at bullish OB, target bearish OB
4. Enter short at bearish OB, target bullish OB
5. Stop: Beyond the trading OB
6. Exit at opposite OB
Why It Works: Price moves from one institutional zone to another
Strategy 5: Mitigation Fade
Best For: Aggressive scalping
Timeframes: 5min, 15min
Win Rate: 50-60% (higher risk)
Entry Rules:
1. Price approaches an order block
2. Instead of bouncing, price breaks through (mitigates it)
3. Enter immediately in direction of breakout
4. Stop: Back inside the mitigated OB
5. Quick target: 1-1.5R
Why It Works: When OB fails, it often leads to strong continuation
━━━━━━━━━━━━━━━━━━━━━━━━━━━━
⚙️ Settings Explained
Core Settings
Auto-Adjust for Timeframe (Default: ON)
• Automatically optimizes detection for current chart timeframe
• 1min: 3 bars lookback
• 5min: 4 bars lookback
• 15min: 5 bars lookback
• 1H: 6 bars lookback
• 4H: 8 bars lookback
• Daily+: 10-12 bars lookback
• Recommended: Keep ON for best results
Manual Detection Length (Default: 5)
• Only used when Auto-Adjust is OFF
• Number of bars to look back for the "last opposite candle"
• Lower (2-4): More sensitive, more blocks, more noise
• Higher (6-10): Less sensitive, fewer blocks, higher quality
• Recommended: Use Auto-Adjust instead
Display Settings
Show Bullish/Bearish Order Blocks
• Toggle each type on/off independently
• Customize colors for each OB type
• Tip: Match colors to your chart theme
Max Order Blocks to Display (Default: 10)
• Limits how many OBs are shown at once
• Lower (5-8): Cleaner chart, only recent blocks
• Higher (15-30): More historical context
• Recommended: 8-12 for most trading
Show Order Block Labels (Default: ON)
• Displays "OB+" and "OB-" text on blocks
• Shows 🎯 on active (nearest) block
• Turn OFF for minimal chart appearance
• Recommended: Keep ON for clarity
Extend Blocks (bars) (Default: 50)
• How far to extend OB boxes to the right
• Lower (20-30): Shorter boxes, less clutter
• Higher (100+): Longer boxes, easier to see
• Blocks auto-extend until mitigated or limit reached
• Recommended: 40-60 bars
Filters
Block Strength Filter (Default: Medium)
• Controls how strong a move must be to create an OB
• Low: 0.5x ATR move required - Many blocks, more noise
• Medium: 1x ATR move required - Balanced quality/quantity
• High: 1.5x ATR move required - Only strongest institutional moves
• Recommended for beginners: High
• Recommended for experienced: Medium
• Recommended for scalpers: Low
Min Block Size % (Default: 0.1)
• Minimum size of OB as percentage of price
• Filters out tiny, insignificant blocks
• Crypto: 0.1-0.3%
• Forex: 0.05-0.15%
• Stocks: 0.1-0.5%
• Adjust based on instrument volatility
Advanced Settings
Show Mitigated Blocks (Default: OFF)
• When ON: Shows gray boxes for "used" order blocks
• When OFF: Blocks disappear after mitigation
• Use ON: For learning and analysis
• Use OFF: For clean, active trading
Highlight Active Block (Default: ON)
• Highlights the nearest order block to current price
• Active block shown with 🎯 emoji and brighter color
• Helps focus on most relevant trading opportunity
• Recommended: Keep ON
━━━━━━━━━━━━━━━━━━━━━━━━━━━━
📱 Info Panel Guide
Bullish OB Count
• Number of active (unmitigated) bullish order blocks
• Higher number = More support zones below price
• Multiple bullish OBs = Strong demand structure
Bearish OB Count
• Number of active (unmitigated) bearish order blocks
• Higher number = More resistance zones above price
• Multiple bearish OBs = Strong supply structure
Bias Indicator
• ⬆ Bullish: More bullish OBs than bearish (demand > supply)
• ⬇ Bearish: More bearish OBs than bullish (supply > demand)
• ↔ Neutral: Equal OBs on both sides
• Trade in direction of bias for higher probability
Near Indicator
• Shows which OB price is closest to
• Displays distance as percentage
• Example: "Bull OB 0.85%" = Bullish OB is 0.85% below current price
• Watch for "Near" alerts to time entries
━━━━━━━━━━━━━━━━━━━━━━━━━━━━
📱 Alert Setup
This indicator includes 4 alert types:
1. Price Entering Bullish OB
• Fires when price touches a bullish order block
• Action: Watch for bounce/reversal pattern
• High-probability long setup developing
2. Price Entering Bearish OB
• Fires when price touches a bearish order block
• Action: Watch for rejection/reversal pattern
• High-probability short setup developing
3. New Bullish OB Detected
• Fires when a new bullish order block forms
• Action: Mark the zone for future retest
• New demand zone identified
4. New Bearish OB Detected
• Fires when a new bearish order block forms
• Action: Mark the zone for future retest
• New supply zone identified
To Set Up Alerts:
1. Click "Alert" button (clock icon)
2. Select "Order Block Identifier"
3. Choose your alert condition
4. Configure notification method
5. Click "Create"
Pro Tip: Set "Price Entering" alerts to catch trading opportunities in real-time
━━━━━━━━━━━━━━━━━━━━━━━━━━━━
💎 Pro Tips & Best Practices
✅ DO:
• First touch is best - Unmitigated OBs have highest win rate (60-70%)
• Wait for confirmation - Don't buy/sell just because price touched OB
• Use multiple timeframes - Higher TF OBs are stronger than lower TF
• Combine with structure - OB + trendline/support = high probability
• Trade with the bias - More bullish OBs = favor longs
• Respect mitigation - Once OB is mitigated, it's less reliable
• Use proper stop loss - Always place stops beyond the OB zone
• Consider session timing - OBs work best during London/NY sessions
⚠️ DON'T:
• Don't blindly buy/sell at OBs - Wait for confirmation
• Don't ignore mitigation - Gray blocks are much weaker
• Don't trade every OB - Quality over quantity
• Don't fight strong trends - OBs can be run through in strong momentum
• Don't use alone - Combine with price action, support/resistance
• Don't expect 100% win rate - Even best OBs fail sometimes (30-40% of time)
• Don't overtrade - Wait for A+ setups with confluence
🎯 Best Timeframes By Trading Style:
• Scalpers: 1min, 5min (quick OB touches)
• Day Traders: 5min, 15min, 1H (balanced view)
• Swing Traders: 1H, 4H, Daily (major institutional zones)
• Position Traders: 4H, Daily, Weekly (strongest OBs)
🔥 Best Instruments:
• Excellent: Forex major pairs (EUR/USD, GBP/USD), BTC, ETH, ES, NQ
• Good: Gold, Oil, Major indices, Large-cap stocks
• Moderate: Altcoins, small-cap stocks (more noise)
• Avoid: Very low liquidity instruments (OBs less reliable)
⏰ Best Times To Trade OBs:
• London Session (03:00-12:00 EST): Highest OB respect rate
• NY Session (08:00-17:00 EST): Strong OB reactions
• London-NY Overlap (08:00-12:00 EST): Best probability
• Asian Session: Lower probability, wait for London
━━━━━━━━━━━━━━━━━━━━━━━━━━━━
🎓 Advanced Order Block Concepts
Order Block Flips (Polarity Change)
When price breaks through an OB and closes beyond it:
• Bullish OB that's broken becomes bearish (support becomes resistance)
• Bearish OB that's broken becomes bullish (resistance becomes support)
• Trading: Watch for retest of broken OB from opposite side
Order Block Refinement
When multiple OBs form at similar level:
• Later OB "refines" or "replaces" the earlier one
• Use the most recent OB as the active zone
• Older OBs become less relevant
Order Block Clusters
Multiple OBs stacked close together:
• Creates a "super zone" of institutional interest
• Higher probability of reversal
• Wider zone for entries (more room for confirmation)
Fair Value Gaps + Order Blocks
When OB aligns with Fair Value Gap:
• Extremely high probability setup
• Price is drawn to fill the gap AND test the OB
• Double confluence = institutional magnet
Order Block Mitigation Types
• Full Mitigation: Price fully enters and closes inside OB
• Partial Mitigation: Price wicks into OB but closes outside
• False Mitigation: Quick touch then immediate rejection
• Partial/false mitigation = OB still somewhat valid
━━━━━━━━━━━━━━━━━━━━━━━━━━━━
📈 Common Order Block Patterns
Pattern 1: The Perfect Retest
• OB forms during strong move
• Price continues 100-200+ pips
• Price retraces back to OB
• Clean bounce with confirmation candle
• Highest probability pattern
Pattern 2: The Double Tap
• Price tests OB, bounces weakly
• Price tests same OB again
• Second test produces stronger reaction
• Second touch often better entry
Pattern 3: The Fake-Out
• Price breaks through OB
• Immediately reverses back
• "Stop hunt" or liquidity grab
• Enter after price reclaims OB
Pattern 4: The Ladder
• Multiple OBs stacked like stairs
• Price steps from one OB to next
• Each OB provides support/resistance
• Trade OB-to-OB movements
Pattern 5: The Failed OB
• Price crashes through OB without pause
• OB completely invalidated
• Often signals strong momentum
• Don't fight it, trade the breakout
━━━━━━━━━━━━━━━━━━━━━━━━━━━━
🚀 What Makes This Different?
Unlike basic support/resistance indicators, Order Block Identifier:
• ICT Methodology - Based on proven institutional concepts
• Auto-Timeframe Optimization - Works perfectly on all timeframes
• ATR-Based Detection - Adapts to each instrument's volatility
• Mitigation Tracking - Knows when blocks are no longer valid
• Active Block Highlighting - Shows most relevant opportunity
• Smart Filtering - Only shows high-quality institutional zones
• Visual Clarity - Clean, professional appearance
• Real-Time Updates - Blocks update as price action develops
Based On Professional Concepts:
• ICT Smart Money Concepts (SMC)
• Institutional order flow analysis
• Market maker behavior patterns
• Supply and demand zone theory
━━━━━━━━━━━━━━━━━━━━━━━━━━━━
📈 Upgrade Your Trading Arsenal
This free indicator gives you institutional-level order block analysis. Want more?
🔥 Check out my premium scripts for:
• Automated entries at order blocks with confirmation
• Fair Value Gap detection combined with OBs
• Multi-timeframe order block strategies
• Breaker blocks and advanced ICT concepts
• Complete smart money trading systems
• And much more...
👉 Visit my profile to trade like institutions!
━━━━━━━━━━━━━━━━━━━━━━━━━━━━
📝 Important Notes
• Order blocks are high-probability zones, not guarantees
• Always use confirmation (price action patterns)
• First touch of OB is most reliable (60-70% win rate)
• Mitigated blocks are much weaker (30-40% win rate)
• Works best during high-volume sessions
• Combine with proper risk management (1-2% risk per trade)
• Not all OBs are created equal - look for confluence
• Practice on demo before trading live
• Past performance doesn't guarantee future results
Learning Curve:
• Week 1-2: Learn to identify OBs and wait for retests
• Week 3-4: Practice entry confirmation and risk management
• Month 2-3: Combine with other analysis (MTF, structure, FVGs)
• Month 3+: Develop personal OB trading system
Disclaimer: For educational purposes only. Order block trading requires practice and proper risk management. Always do your own research.
━━━━━━━━━━━━━━━━━━━━━━━━━━━━
🙏 Support This Work
If this indicator helps you trade with institutions:
• ⭐ Give it a thumbs up
• 💬 Share your best order block trades in comments
• 🔔 Follow for more free ICT/SMC tools
• 🚀 Share with traders learning smart money concepts
Questions about order blocks? Drop a comment and I'll explain!
━━━━━━━━━━━━━━━━━━━━━━━━━━━━
Developed with ❤️ for traders who want to see what institutions see
━━━━━━━━━━━━━━━━━━━━━━━━━━━━
Version History
• v1.0 - Initial release with auto-timeframe detection and ATR-based strength filtering

CRR BUY/SELL This is a dual engine (BUY and SELL) for scalping/micro trading on XAUUSD (10–20 pips), all in a single indicator:
Reads 1m, 5m, 15m, 30m (trend + momentum).
It has separate BUY and SELL engines.
It shows you in a central HUD:
Left side → BUY status.
Right side → SELL status.
Bottom → indicators + extra info + NY time.
1️⃣ Internal Engines
🔹 Shared Multi-TF
On 1m, 5m, 15m, 30m it calculates:
EMA 15/30/200 → bullish/bearish trend.
MACD → momentum.
RSI → strength.
From this comes:
t1, t2, t3, t4 =
1 = bullish,
-1 = bearish,
0 = neutral.
bullScore = how many TFs are bullish.
bearScore = how many TFs are bearish.
2️⃣ BUY Engine (BUY BOX)
Own Inputs:
Mode: aggressiveMicroBuy → yes/no.
Sensitivity: Normal / High / Turbo.
Filter for:
strong upward candle (ticks ≈ pips),
minimum ATR in pips,
minimum 1m bullish candle body.
Calculations:
Converts ATR to pips (atrPipsBuy) and validates sufAtrBuy.
Calculates momentumBull1 (1m):
large bullish candle in pips,
MACD bullish,
RSI bullish.
1m Micro signal “BUY WITHOUT PULLBACK” (buyNoPull):
EMA 15 > EMA 30 > EMA 200 (strong bullish trend on 1m),
MACD crosses upwards,
Price above EMA 30 1m.
Multi-TF Bull (multiTfBull):
Normal Mode: 1m bullish and 5-15-30m not against. High/Turbo Mode: bullScore >= 2.
Final BUY condition:
Conservative:
buyNoPull + multiTfBull + sufAtrBuy + momentumBull1
Aggressive:
(t1 == 1 or bigPumpBuy) + 15m not bearish + sufAtrBuy
condBuyFinal chooses between conservative/aggressive based on aggressiveMicroBuy.
3️⃣ SELL Engine (SELL BOX)
It's the bearish mirror of the BUY:
Own inputs:
aggressiveMicroSell, SELL Sensitivity, strong drop in ticks, ATR SELL, minimum bearish body.
Calculations:
ATR → pips (atrPipsSell) and sufAtrSell.
momentumBear1: strong red candle in 1m + MACD bear + RSI bear.
1m Micro signal “SELL WITHOUT PULLBACK” (sellNoPull):
EMA 15 < EMA 30 < EMA 200 (strong bearish trend 1m),
MACD crosses downwards,
Price below EMA 30 1m.
Multi–TF Bear (multiTfBear):
Normal: 1m bearish and 5–15–30m not against.
High/Turbo: bearScore >= 2.
Final SELL condition:
Conservative:
sellNoPull + multiTfBear + sufAtrSell + momentumBear1
Aggressive:
(t1 == -1 or bigDropSell) + 15m not bullish + sufAtrSell
condSellFinal based on aggressiveMicroSell.
4️⃣ Clock and Sessions
Calculates New York time.
Classifies session:
TOKYO (20–03),
LONDON (03–08),
NEW YORK (08–17).
Displays clockText (NY time) in the HUD.
5️⃣ Central HUD (double)
Table at the top center with 6 columns:
Columns 0–2 → BUY
Row 1: STATUS: MICRO BUY / NORMAL BUY / NEUTRAL.
Row 2: Light bulb + text:
STRONG RISE,
MULTI TF BULLISH,
NO SETUP. Columns 3–5 → SELL
Row 1: STATUS: MICRO SELL / NORMAL SELL / NEUTRAL
Row 2: Lightbulb + text:
SHARP DROP,
MULTI TF BEARISH,
NO SETUP.
In BUY, column 2 of the last row shows the NY time.
6️⃣ Footprint on the chart
Only when a new signal appears (not repeated):
buySignal = condBuyFinal and not condBuyFinal .
sellSignal = condSellFinal and not condSellFinal .
Draw:
Bar color:
Green on BUY candle.
Red on SELL candle.
Triangles:
BUY below the candle.
SELL above the candle.
7️⃣ Alerts
CRR BUY SCALPING → when condBuyFinal is true.
CRR SELL SCALPING → when condSellFinal is true.
🧩 In a sentence:
This is your master micro-scalping BUY/SELL panel, which combines multi-timeframe analysis, 1m momentum, ATR in pips, and strong candles, and summarizes it for you in a dual HUD (BUY on the left, SELL on the right) + clear markers on the exact trigger candle.

CRAZY RAY RAY - Dashboard 1-5-15-1D + SMC + Clock + Candles PRO OANDA:XAUUSD This script is essentially your institutional "nuclear power plant" for scalping and swing trading: it combines the 1-5-15-1D dashboard, SMC, PRO candles, money flow times, institutional filters, Bull/Bear 12C, Liquidity HUD, Fibo Move, and Target Trend with SL + 3 TPs into a single indicator. 1. Dashboard 1–5–15–1D (Central HUD)
Calculates across 4 timeframes: 1m, 5m, 15m, and 1D:
Trend with EMAs 15/30/200.
RSI (strength >50 buy, <50 sell).
MACD (crossover in favor or against).
For each timeframe it shows:
TREND → BULLISH / BEARISH / NEUTRAL.
ACTION → BUY / SELL / WAIT.
If all 4 timeframes align:
MODE = BULLISH BUY
MODE = BEARISH SELL
Filters and displays on the HUD if buys or sells are blocked by SMC context (BLOCKED BUY / BLOCKED SELL).
Also draws 2 simple moving averages on the chart:
SMA 20 white (you can use it as a micro-trend).
SMA 200 red (macro trend and institutional reference).
2. Real-Time Clock + Trading Hours
Calculates the real time for:
New York / Miami
London
Tokyo
using current time and real time zone.
Also calculates GMT time to know which session is dominant.
Marks your trading hours:
LONDON 3:00–5:30 (London time) → goodLondon
NY OPEN 8:30–10:00 (NY time) → goodNYOpen
ASIA 20:00–23:00 (Tokyo) → goodAsiaScalp
Displays a message on the HUD:
LONDON 3:00–5:30 (1–2 TRADES)
NY OPEN 8:30–10:00 (1 TRADE)
ASIA 20–23 (SCALP)
NO TRADE ROLL / DEAD / LATE
ONLY A+ SETUPS (when not in strong trading hours).
3. Institutional Power (volume + ATR + session)
Filter that evaluates whether the moment is institutional or retail:
Checks:
If you are in a strong trading session (London / NY). If the volume is above the average × multiplier.
If the ATR is above the average × multiplier.
If it passes the filters → INST ON, otherwise → RETAIL ZONE.
Used internally to block buys/sells and for the HUD.
4. Micro-signal “NO RETRACEMENT” on 1m (BUY SR / SELL SR)
On the 1-minute timeframe, it detects a very aggressive entry:
Clean trend (15/30/200 EMAs aligned).
Price crosses the 200 EMA.
MACD turns in favor.
Marks on the candle:
BUY SR (buys without retracement below the EMA200).
SELL SR (sales without retracement above the EMA200).
This state is also reflected in the HUD as the “SR” row.
5. SMC Block: HH/HL/LH/LL + BMS + ChoCH + Fibo + Zones
This is the SMC brain of the script:
Detects swings with pivots:
Paints HH, HL, LH, LL (if you activate showHHLL).
Marks BOS (break of structure).
Marks BMS and ChoCH (with strong or weak filter using ATR, volume, MACD, gaps).
Draws:
Internal Fibo of the last range (38–50–61).
Fibo entry zone 38–78% as a green discount/premium box.
Institutional mitigation zones (simple OB type green/red boxes).
Current range with dotted yellow lines.
Calculates logic for:
antiStupidBuy: blocks purchases when the context is very bearish (LL–LL–LH, bearish ChoCH, premium, EQH, etc.).
antiStupidSell: symmetrical for sales.
From this comes:
allowBuyInst
allowSellInst
buyBlockerOn / sellBlockerOn
buyTrapDetected (BUY SR signal but context blocks it → BUY TRAP).
All this feeds the HUD and institutional alerts.
6. PRO Candles (candlestick + smart color)
Candlestick pattern system:
Detects:
Hammer, Inverted Hammer. Doji.
Strong bullish/bearish candle.
Bullish/bearish engulfing.
Uses a trend EMA to determine if the pattern is with or against the trend.
Colors the candles according to the pattern (if you enable useColorCandles).
Defines texts:
patternText (pattern name).
biasText (reversal, momentum, indecision).
Updates the HUD with the current pattern (“CANDLE: Engulf Bull”, etc.).
7. Institutional PRO Combo + Reversals
Connects everything:
fullBuySetup:
allowBuyInst TRUE (SMC + Fibo + mitigation OK).
Institutional candles in favor (engulfing, hammer, etc.).
MultiTF aligned (1m, 5m in favor, 15/1D not strongly against).
Strong session (London or NY).
No blockages.
fullSellSetup: the same for sales.
Marks on the chart:
BUY PRO, SELL PRO.
BUY REV LL → reversal from a LL, at Fibo discount, with an institutional candle and above EMA200.
SELL REV HH → reversal from HH, at Fibo premium, with an institutional candle and below EMA200.
And generates alerts for all of this.
8. Dynamic Main HUD
On barstate.islast, updates the HUD:
Changes “BUY / SELL” to:
BUY BLOCK / SELL BLOCK when the context blocks that direction.
Writes:
Current candle pattern.
Time message.
Global status:
BUY TRAP ❌, BUY REV LL ✅, SELL REV HH ✅, BUY PRO ✅, SELL PRO ✅,
BUY BLOCK, SELL BLOCK, BUY/SELL OK.
9. Bull/Bear 12C HUD (Small right HUD)
12-confirmation bull/bear engine:
Calculates:
Sweep, 5th leg, mitigation, HL/LH, strong BOS.
Volume pattern (high-low-high).
ATR rising.
MACD crossover.
Liquidity.
Fear & Greed (SMA50).
Gap/imbalance. Bull/Bear 180 weak.
Count how many are ON:
bullScore /12
bearScore /12
Define a regime:
INSTITUTIONAL → many confirmations + rvol + ATR.
NORMAL
RETAIL
Show on right HUD:
List 1 to 12 with green/red dots BULL / BEAR.
Summary: “Regime: INSTITUTIONAL / NORMAL / RETAIL”.
10. Liquidity HUD XAU SCALP
Calculates RVOL, normalized ATR, spread vs ATR, current range vs average range.
Generates score and classifies:
LOW / MED / HIGH / INS.
Only moves up one level if you are in London/NY session (depending on sessions)

Minho Index | SETUP (Safe Filter 90%)//@version=5
indicator("Minho Index | SETUP (Safe Filter 90%)", shorttitle="Minho Index | SETUP+", overlay=false)
//--------------------------------------------------------
// ⚙️ INPUTS
//--------------------------------------------------------
bullColor = input.color(color.new(color.lime, 0), "Bull Color (Minho Green)")
bearColor = input.color(color.new(color.red, 0), "Bear Color (Red)")
neutralColor = input.color(color.new(color.white, 0), "Neutral Color (White)")
lineWidth = input.int(2, "Line Width")
period = input.int(14, "RSI Period")
centerLine = input.float(50.0, "Central Line (Fixed at 50)")
//--------------------------------------------------------
// 🧠 BASE RSI + INTERNAL SMOOTHING
//--------------------------------------------------------
rsiBase = ta.rsi(close, period)
rsiSmooth = ta.sma(rsiBase, 3) // light smoothing
//--------------------------------------------------------
// 🔍 TREND DETECTION AND NEUTRAL ZONE
//--------------------------------------------------------
trendUp = (rsiSmooth > rsiSmooth ) and (rsiSmooth > rsiSmooth )
trendDown = (rsiSmooth < rsiSmooth ) and (rsiSmooth < rsiSmooth )
slopeUp = (rsiSmooth > rsiSmooth )
slopeDown = (rsiSmooth < rsiSmooth )
lineColor = neutralColor
if trendUp
lineColor := bullColor
else if trendDown
lineColor := bearColor
else if slopeUp or slopeDown
lineColor := neutralColor
//--------------------------------------------------------
// 📈 MAIN INDEX LINE
//--------------------------------------------------------
plot(rsiSmooth, title="Dynamic RSI Line (Safe Filter)", color=lineColor, linewidth=lineWidth)
//--------------------------------------------------------
// ⚪ FIXED CENTRAL LINE
//--------------------------------------------------------
plot(centerLine, title="Central Line (Highlight)", color=neutralColor, linewidth=1)
//--------------------------------------------------------
// 📊 NORMALIZED MOVING AVERAGES (SMA20 and EMA20)
//--------------------------------------------------------
SMA20 = ta.sma(close, 20)
EMA20 = ta.ema(close, 20)
// Normalization 0–100
minPrice = ta.lowest(low, 100)
maxPrice = ta.highest(high, 100)
rangeCalc = maxPrice - minPrice
rangeCalc := rangeCalc == 0 ? 1 : rangeCalc
normSMA = ((SMA20 - minPrice) / rangeCalc) * 100
normEMA = ((EMA20 - minPrice) / rangeCalc) * 100
//--------------------------------------------------------
// 🩶 MOVING AVERAGES PLOTS (GHOST-GREY STYLE)
//--------------------------------------------------------
ghostColor = color.new(color.rgb(200,200,200), 65)
plot(normSMA, title="SMA 20 (Ghost Grey)", color=ghostColor, linewidth=2)
plot(normEMA, title="EMA 20 (Ghost Grey)", color=ghostColor, linewidth=2)
//--------------------------------------------------------
// 🌈 FILL BETWEEN MOVING AVERAGES
//--------------------------------------------------------
bullCond = normSMA < normEMA
bearCond = normSMA > normEMA
fill(
plot(normSMA, display=display.none),
plot(normEMA, display=display.none),
color = bearCond ? color.new(color.red, 55) :
bullCond ? color.new(color.lime, 55) : na
)
//--------------------------------------------------------
// ✅ END OF INDICATOR
//--------------------------------------------------------

VCP Trendline breakoutThe Signal:
Green Triangles indicate the price is approaching the trendline (Watchlist candidate).
Yellow Triangles indicate the price is very tight against the line (Execution imminent).
The Trigger: When price closes above the Grey Dotted Line, the line stops extending. This is your breakout signal.
Indicator Overview
The The VCP Trendline breakout indicator is a sophisticated technical indicator designed for trend followers and breakout traders (O'Neil, Minervini, Wyckoff styles). This script employs a State Machine logic to identify structural Volatility Contraction Patterns (VCP) in real-time.
It automatically detects valid Bases, tracks the "Right Side" construction, identifies nested handles (contractions), and draws precise supply trendlines—while strictly enforcing structural integrity rules (Higher Lows).
Core Logic & Features
1. Smart Base Detection
Trend Filter: The pattern recognition engine only activates when the price is above the 200 SMA, ensuring you are trading with the primary trend.
Base Validation: It identifies a "Base High" (H1) based on a configurable lookback period. It tracks the depth of the base and automatically invalidates the pattern if the drawdown exceeds the user-defined threshold (default 30%).
2. Recursive Nested Trendlines (VCP)
The indicator is capable of drawing Nested Trendlines (recursive resistance). It doesn't just draw a line from the peak; it identifies internal contractions within the base.
H1 (Primary): The main supply line from the top of the base.
H2, H3 (Internal): Trendlines connecting subsequent lower highs (handles) as volatility contracts.
Smart Fan: Includes a "Clean Fan" mode to show only the most relevant, latest trendline per anchor point.
3. Structural Integrity Enforcement (The "Higher Low" Rule)
This is the standout feature of this script. It performs an Anchor Integrity Check on every bar.
In a valid VCP, every contraction must form a Higher Low.
If the price creates a new pivot (H3) but then crashes lower than the previous contraction's floor (H2), the script identifies this as a Structural Failure.
Auto-Deletion: It immediately retroactively deletes the invalid trendlines associated with that failed contraction, keeping your chart clean and free of "ghost" signals.
4. "Right-Side" Logic
Collision Detection: Trendlines are calculated using "Right-Side Clearance." A line is only drawn if the path from the anchor to the new pivot is unobstructed by price action.
Signal Protection: "Watch" and "Near" signals are suppressed during the decline phase (Left Side). They only appear once the "Bottom" (L1) has been confirmed and price is recovering on the Right Side.
5. Proximity Alerts & Breakouts
Watch Zone (Green Triangle): Appears when the Low of the bar is within 8% (configurable) of a valid trendline.
Near Zone (Yellow Triangle): Appears when the Low of the bar is within 4% (configurable) of a valid trendline.
Breakout Stop: Trendlines are dynamic. The moment a bar closes above a trendline, the line stops extending immediately, marking the exact breakout point.
How to Use This Indicator
The Setup: Look for a stock in an uptrend (Price > 200 SMA).
The Construction: Wait for the script to identify the Base High (H1). As the price corrects and begins to recover, you will see Grey Dotted Lines appear, connecting the highs.
The Contraction: Watch for Nested Trendlines. If you see a second or third line form from a lower high (H2, H3), it indicates a tightening of price action (VCP).
Settings Configuration
Moving Averages
21 EMA, 50 SMA, 200 SMA: Built-in reference averages.
Base Settings
H1 Lookback: How many bars back the script looks to find the "Start" of the base (Default: 21). Increase this for longer-term bases.
Sub-High Pivot Bars: Controls the sensitivity of identifying internal highs (handles).
Max Base Depth: If the base drops more than this % (Default: 30%), the structure is considered failed and lines are removed.
Enable Nested Trendlines: Toggle ON to see internal VCP lines (H2, H3). Toggle OFF to see only the main H1 trendline.
Show Only Latest Line: Keeps the chart clean by removing older lines from the same anchor point.
Visuals & Signals
Near/Watch Zone %: Adjust the sensitivity of the Green/Yellow triangles.
Signal Size: Change the size of the triangle markers.
DISCLAIMER
This is an indicator, not a trading system. Apply good risk management and do your own due diligence before putting your hard earned money into anything.
This script is for educational and analytical purposes only. It does not constitute financial advice. Automated pattern recognition has limitations and should always be verified visually.

Multi-Tool VWAP + EMAs (Multi-Timeframe) + Key LevelsDescription
This indicator combines several commonly used technical analysis tools into a single script, especially useful for traders using the free version of TradingView or anyone looking to reduce the number of indicators on their chart.
The goal is to provide clear visual references for trend, structure, and key levels—without generating buy/sell signals or automated trading functions.
Included Features
1. VWAP (session-anchored)
Source: HLC3
Purple line, thickness 2
Useful as a reference for daily institutional average price.
2. EMAs of the current timeframe
EMA 200 (red, thickness 3)
EMA 9 (green, thickness 1)
These EMAs help visualize long-term trend and short-term momentum.
3. Dynamic EMAs (MTF – Multi-Timeframe)
The indicator displays the 200 EMA from higher timeframes as dynamic horizontal levels:
5 minutes
15 minutes
30 minutes
1 hour
4 hours
1 day
Each level includes a descriptive label such as “15 min EMA 200”.
These EMAs serve as reference points for potential support/resistance areas coming from higher timeframes.
4. Automatic Key Levels
The indicator plots several important price levels:
Previous day:
PDH (Previous Day High)
PDL (Previous Day Low)
Previous Day 50% Fibonacci level
Pre-market (04:00–09:30 exchange time):
PMH (Pre-Market High)
PML (Pre-Market Low)
Current session:
Open (session opening price)
Previous Close (prior day’s closing price)
Purpose and Scope
This script is designed to provide basic visual reference points to support discretionary analysis.
It does not generate signals or trading suggestions, and it is not intended to predict future price movements.
How to Use It
Enable or disable each block in the Inputs section according to your analysis style.
Observe how the levels, EMAs, and VWAP interact with market structure.
Use it as a visual complement to your personal technical analysis.
Limitations
This indicator is not a trading system and does not guarantee results.
It does not include alerts, backtesting, or entry/exit logic.
Some values (such as PMH/PML) depend on the symbol’s exchange trading hours.
Credits
Designed as an educational and analytical tool for traders seeking to simplify their charts without losing key information.
