Ichimoku Cloud and ADX with Trailing Stop Loss (by Coinrule)The Ichimoku Cloud is a collection of technical indicators that show support and resistance levels, as well as momentum and trend direction. It does this by taking multiple averages and plotting them on a chart. It also uses these figures to compute a “cloud” that attempts to forecast where the price may find support or resistance in the future.
The Ichimoku Cloud was developed by Goichi Hosoda, a Japanese journalist, and published in the late 1960s. It provides more data points than the standard candlestick chart. While it seems complicated at first glance, those familiar with how to read the charts often find it easy to understand with well-defined trading signals.
The Ichimoku Cloud is composed of five lines or calculations, two of which comprise a cloud where the difference between the two lines is shaded in.
The lines include a nine-period average, a 26-period average, an average of those two averages, a 52-period average, and a lagging closing price line.
The cloud is a key part of the indicator. When the price is below the cloud, the trend is down. When the price is above the cloud, the trend is up.
The above trend signals are strengthened if the cloud is moving in the same direction as the price. For example, during an uptrend, the top of the cloud is moving up, or during a downtrend, the bottom of the cloud is moving down.
DMI is simple to interpret. When +DI > - DI, it means the price is trending up. On the other hand, when -DI > +DI, the trend is weak or moving on the downside. The ADX does not give an indication of the direction but about the strength of the trend.
Typically values of ADX above 25 mean that the trend is steeply moving up or down, based on the -DI and +DI positioning. This script aims to capture swings in the DMI, and thus, in the trend of the asset, using a contrarian approach.
Trading on high values of ADX, the strategy tries to spot extremely oversold and overbought conditions. Values of ADX above 45 may suggest that the trend has overextended and is maybe about to reverse.
This strategy combines the Ichimoku Cloud with the ADX indicator to better enter trades.
Long orders are placed when these basic signals are triggered.
Long Position:
Tenkan-Sen is above the Kijun-Sen
Chikou-Span is above the close of 26 bars ago
Close is above the Kumo Cloud
MACD line crosses over the signal line
-DI is greater than +DI
ADX is greater than 45
Close Position:
3% increase trailing
3% decrease trailing
The script is backtested from December 2022 and provides good returns.
A trading fee of 0.1% is also taken into account and is aligned to the base fee applied on Binance.
Tìm kiếm tập lệnh với "45美元兑换人民币+最新汇率"

Ichimoku Cloud and ADX with Trailing Stop Loss (by Coinrule)The Ichimoku Cloud is a collection of technical indicators that show support and resistance levels, as well as momentum and trend direction. It does this by taking multiple averages and plotting them on a chart. It also uses these figures to compute a “cloud” that attempts to forecast where the price may find support or resistance in the future.
The Ichimoku Cloud was developed by Goichi Hosoda, a Japanese journalist, and published in the late 1960s. It provides more data points than the standard candlestick chart. While it seems complicated at first glance, those familiar with how to read the charts often find it easy to understand with well-defined trading signals.
The Ichimoku Cloud is composed of five lines or calculations, two of which comprise a cloud where the difference between the two lines is shaded in.
The lines include a nine-period average, a 26-period average, an average of those two averages, a 52-period average, and a lagging closing price line.
The cloud is a key part of the indicator. When the price is below the cloud, the trend is down. When the price is above the cloud, the trend is up.
The above trend signals are strengthened if the cloud is moving in the same direction as the price. For example, during an uptrend, the top of the cloud is moving up, or during a downtrend, the bottom of the cloud is moving down.
DMI is simple to interpret. When +DI > - DI, it means the price is trending up. On the other hand, when -DI > +DI , the trend is weak or moving on the downside. The ADX does not give an indication about the direction but about the strength of the trend.
Typically values of ADX above 25 mean that the trend is steeply moving up or down, based on the -DI and +D positioning. This script aims to capture swings in the DMI, and thus, in the trend of the asset, using a contrarian approach.
Trading on high values of ADX, the strategy tries to spot extremely oversold and overbought conditions. Values of ADX above 45 may suggest that the trend has overextended and is may be about to reverse.
This strategy combines the Ichimoku Cloud with the ADX indicator to better enter trades.
Long orders are placed when these basic signals are triggered.
Long Position:
Tenkan-Sen is above the Kijun-Sen
Chikou-Span is above the close of 26 bars ago
Close is above the Kumo Cloud
MACD line crosses over the signal line
-DI is greater than +DI
ADX is greater than 45
Close Position:
3% increase trailing
3% decrease trailing
The script is backtested from 1 January 2018 and provides good returns.
The strategy assumes each order is using 30% of the available coins to make the results more realistic and to simulate you only ran this strategy on 30% of your holdings. A trading fee of 0.1% is also taken into account and is aligned to the base fee applied on Binance.
This script also works well on MATIC (1d timeframe), ETH (1d timeframe), and SOL (1d timeframe).

STD/C-Filtered, N-Order Power-of-Cosine FIR Filter [Loxx]STD/C-Filtered, N-Order Power-of-Cosine FIR Filter is a Discrete-Time, FIR Digital Filter that uses Power-of-Cosine Family of FIR filters. This is an N-order algorithm that turns the following indicator from a static max 16 orders to a N orders, but limited to 50 in code. You can change the top end value if you with to higher orders than 50, but the signal is likely too noisy at that level. This indicator also includes a clutter and standard deviation filter.
See the static order version of this indicator here:
STD/C-Filtered, Power-of-Cosine FIR Filter
Amplitudes for STD/C-Filtered, N-Order Power-of-Cosine FIR Filter:
What are FIR Filters?
In discrete-time signal processing, windowing is a preliminary signal shaping technique, usually applied to improve the appearance and usefulness of a subsequent Discrete Fourier Transform. Several window functions can be defined, based on a constant (rectangular window), B-splines, other polynomials, sinusoids, cosine-sums, adjustable, hybrid, and other types. The windowing operation consists of multipying the given sampled signal by the window function. For trading purposes, these FIR filters act as advanced weighted moving averages.
What is Power-of-Sine Digital FIR Filter?
Also called Cos^alpha Window Family. In this family of windows, changing the value of the parameter alpha generates different windows.
f(n) = math.cos(alpha) * (math.pi * n / N) , 0 ≤ |n| ≤ N/2
where alpha takes on integer values and N is a even number
General expanded form:
alpha0 - alpha1 * math.cos(2 * math.pi * n / N)
+ alpha2 * math.cos(4 * math.pi * n / N)
- alpha3 * math.cos(4 * math.pi * n / N)
+ alpha4 * math.cos(6 * math.pi * n / N)
- ...
Special Cases for alpha:
alpha = 0: Rectangular window, this is also just the SMA (not included here)
alpha = 1: MLT sine window (not included here)
alpha = 2: Hann window (raised cosine = cos^2)
alpha = 4: Alternative Blackman (maximized roll-off rate)
This indicator contains a binomial expansion algorithm to handle N orders of a cosine power series. You can read about how this is done here: The Binomial Theorem
What is Pascal's Triangle and how was it used here?
In mathematics, Pascal's triangle is a triangular array of the binomial coefficients that arises in probability theory, combinatorics, and algebra. In much of the Western world, it is named after the French mathematician Blaise Pascal, although other mathematicians studied it centuries before him in India, Persia, China, Germany, and Italy.
The rows of Pascal's triangle are conventionally enumerated starting with row n = 0 at the top (the 0th row). The entries in each row are numbered from the left beginning with k=0 and are usually staggered relative to the numbers in the adjacent rows. The triangle may be constructed in the following manner: In row 0 (the topmost row), there is a unique nonzero entry 1. Each entry of each subsequent row is constructed by adding the number above and to the left with the number above and to the right, treating blank entries as 0. For example, the initial number in the first (or any other) row is 1 (the sum of 0 and 1), whereas the numbers 1 and 3 in the third row are added to produce the number 4 in the fourth row.
Rows of Pascal's Triangle
0 Order: 1
1 Order: 1 1
2 Order: 1 2 1
3 Order: 1 3 3 1
4 Order: 1 4 6 4 1
5 Order: 1 5 10 10 5 1
6 Order: 1 6 15 20 15 6 1
7 Order: 1 7 21 35 35 21 7 1
8 Order: 1 8 28 56 70 56 28 8 1
9 Order: 1 9 36 34 84 126 126 84 36 9 1
10 Order: 1 10 45 120 210 252 210 120 45 10 1
11 Order: 1 11 55 165 330 462 462 330 165 55 11 1
12 Order: 1 12 66 220 495 792 924 792 495 220 66 12 1
13 Order: 1 13 78 286 715 1287 1716 1716 1287 715 286 78 13 1
For a 12th order Power-of-Cosine FIR Filter
1. We take the coefficients from the Left side of the 12th row
1 13 78 286 715 1287 1716 1716 1287 715 286 78 13 1
2. We slice those in half to
1 13 78 286 715 1287 1716
3. We reverse the array
1716 1287 715 286 78 13 1
This is our array of alphas: alpha1, alpha2, ... alphaN
4. We then pull alpha one from the previous order, order 11, the middle value
11 Order: 1 11 55 165 330 462 462 330 165 55 11 1
The middle value is 462, this value becomes our alpha0 in the calculation
5. We apply these alphas to the cosine calculations
example: + alpha4 * math.cos(6 * math.pi * n / N)
6. We then divide by the sum of the alphas to derive our final coefficient weighting kernel
**This is only useful for orders that are EVEN, if you use odd ordering, the following are the coefficient outputs and these aren't useful since they cancel each other out and result in a value of zero. See below for an odd numbered oder and compare with the amplitude of the graphic posted above of the even order amplitude:
What is a Standard Deviation Filter?
If price or output or both don't move more than the (standard deviation) * multiplier then the trend stays the previous bar trend. This will appear on the chart as "stepping" of the moving average line. This works similar to Super Trend or Parabolic SAR but is a more naive technique of filtering.
What is a Clutter Filter?
For our purposes here, this is a filter that compares the slope of the trading filter output to a threshold to determine whether to shift trends. If the slope is up but the slope doesn't exceed the threshold, then the color is gray and this indicates a chop zone. If the slope is down but the slope doesn't exceed the threshold, then the color is gray and this indicates a chop zone. Alternatively if either up or down slope exceeds the threshold then the trend turns green for up and red for down. Fro demonstration purposes, an EMA is used as the moving average. This acts to reduce the noise in the signal.
Included
Bar coloring
Loxx's Expanded Source Types
Signals
Alerts

Variety N-Tuple Moving Averages w/ Variety Stepping [Loxx]Variety N-Tuple Moving Averages w/ Variety Stepping is a moving average indicator that allows you to create 1- 30 tuple moving average types; i.e., Double-MA, Triple-MA, Quadruple-MA, Quintuple-MA, ... N-tuple-MA. This version contains 2 different moving average types. For example, using "50" as the depth will give you Quinquagintuple Moving Average. If you'd like to find the name of the moving average type you create with the depth input with this indicator, you can find a list of tuples here: Tuples extrapolated
Due to the coding required to adapt a moving average to fit into this indicator, additional moving average types will be added as they are created to fit into this unique use case. Since this is a work in process, there will be many future updates of this indicator. For now, you can choose from either EMA or RMA.
This indicator is also considered one of the top 10 forex indicators. See details here: forex-station.com
Additionally, this indicator is a computationally faster, more streamlined version of the following indicators with the addition of 6 stepping functions and 6 different bands/channels types.
STD-Stepped, Variety N-Tuple Moving Averages
STD-Stepped, Variety N-Tuple Moving Averages is the standard deviation stepped/filtered indicator of the following indicator
Last but not least, a big shoutout to @lejmer for his help in formulating a looping solution for this streamlined version. this indicator is speedy even at 50 orders deep. You can find his scripts here: www.tradingview.com
How this works
Step 1: Run factorial calculation on the depth value,
Step 2: Calculate weights of nested moving averages
factorial(depth) / (factorial(depth - k) * factorial(k); where depth is the depth and k is the weight position
Examples of coefficient outputs:
6 Depth: 6 15 20 15 6
7 Depth: 7 21 35 35 21 7
8 Depth: 8 28 56 70 56 28 8
9 Depth: 9 36 34 84 126 126 84 36 9
10 Depth: 10 45 120 210 252 210 120 45 10
11 Depth: 11 55 165 330 462 462 330 165 55 11
12 Depth: 12 66 220 495 792 924 792 495 220 66 12
13 Depth: 13 78 286 715 1287 1716 1716 1287 715 286 78 13
Step 3: Apply coefficient to each moving average
For QEMA, which is 5 depth EMA , the calculation is as follows
ema1 = ta. ema ( src , length)
ema2 = ta. ema (ema1, length)
ema3 = ta. ema (ema2, length)
ema4 = ta. ema (ema3, length)
ema5 = ta. ema (ema4, length)
In this new streamlined version, these MA calculations are packed into an array inside loop so Pine doesn't have to keep all possible series information in memory. This is handled with the following code:
temp = array.get(workarr, k + 1) + alpha * (array.get(workarr, k) - array.get(workarr, k + 1))
array.set(workarr, k + 1, temp)
After we pack the array, we apply the coefficients to derive the NTMA:
qema = 5 * ema1 - 10 * ema2 + 10 * ema3 - 5 * ema4 + ema5
Stepping calculations
First off, you can filter by both price and/or MA output. Both price and MA output can be filtered/stepped in their own way. You'll see two selectors in the input settings. Default is ATR ATR. Here's how stepping works in simple terms: if the price/MA output doesn't move by X deviations, then revert to the price/MA output one bar back.
ATR
The average true range (ATR) is a technical analysis indicator, introduced by market technician J. Welles Wilder Jr. in his book New Concepts in Technical Trading Systems, that measures market volatility by decomposing the entire range of an asset price for that period.
Standard Deviation
Standard deviation is a statistic that measures the dispersion of a dataset relative to its mean and is calculated as the square root of the variance. The standard deviation is calculated as the square root of variance by determining each data point's deviation relative to the mean. If the data points are further from the mean, there is a higher deviation within the data set; thus, the more spread out the data, the higher the standard deviation.
Adaptive Deviation
By definition, the Standard Deviation (STD, also represented by the Greek letter sigma σ or the Latin letter s) is a measure that is used to quantify the amount of variation or dispersion of a set of data values. In technical analysis we usually use it to measure the level of current volatility .
Standard Deviation is based on Simple Moving Average calculation for mean value. This version of standard deviation uses the properties of EMA to calculate what can be called a new type of deviation, and since it is based on EMA , we can call it EMA deviation. And added to that, Perry Kaufman's efficiency ratio is used to make it adaptive (since all EMA type calculations are nearly perfect for adapting).
The difference when compared to standard is significant--not just because of EMA usage, but the efficiency ratio makes it a "bit more logical" in very volatile market conditions.
See how this compares to Standard Devaition here:
Adaptive Deviation
Median Absolute Deviation
The median absolute deviation is a measure of statistical dispersion. Moreover, the MAD is a robust statistic, being more resilient to outliers in a data set than the standard deviation. In the standard deviation, the distances from the mean are squared, so large deviations are weighted more heavily, and thus outliers can heavily influence it. In the MAD, the deviations of a small number of outliers are irrelevant.
Because the MAD is a more robust estimator of scale than the sample variance or standard deviation, it works better with distributions without a mean or variance, such as the Cauchy distribution.
For this indicator, I used a manual recreation of the quantile function in Pine Script. This is so users have a full inside view into how this is calculated.
Efficiency-Ratio Adaptive ATR
Average True Range (ATR) is widely used indicator in many occasions for technical analysis . It is calculated as the RMA of true range. This version adds a "twist": it uses Perry Kaufman's Efficiency Ratio to calculate adaptive true range
See how this compares to ATR here:
ER-Adaptive ATR
Mean Absolute Deviation
The mean absolute deviation (MAD) is a measure of variability that indicates the average distance between observations and their mean. MAD uses the original units of the data, which simplifies interpretation. Larger values signify that the data points spread out further from the average. Conversely, lower values correspond to data points bunching closer to it. The mean absolute deviation is also known as the mean deviation and average absolute deviation.
This definition of the mean absolute deviation sounds similar to the standard deviation (SD). While both measure variability, they have different calculations. In recent years, some proponents of MAD have suggested that it replace the SD as the primary measure because it is a simpler concept that better fits real life.
For Pine Coders, this is equivalent of using ta.dev()
Bands/Channels
See the information above for how bands/channels are calculated. After the one of the above deviations is calculated, the channels are calculated as output +/- deviation * multiplier
Signals
Green is uptrend, red is downtrend, yellow "L" signal is Long, fuchsia "S" signal is short.
Included:
Alerts
Loxx's Expanded Source Types
Bar coloring
Signals
6 bands/channels types
6 stepping types
Related indicators
3-Pole Super Smoother w/ EMA-Deviation-Corrected Stepping
STD-Stepped Fast Cosine Transform Moving Average
ATR-Stepped PDF MA

STD-Stepped, Variety N-Tuple Moving Averages [Loxx]STD-Stepped, Variety N-Tuple Moving Averages is the standard deviation stepped/filtered indicator of the following indicator
Variety N-Tuple Moving Averages is a moving average indicator that allows you to create 1- 30 tuple moving average types; i.e., Double-MA, Triple-MA, Quadruple-MA, Quintuple-MA, ... N-tuple-MA. This version contains 5 different moving average types including T3. A list of tuples can be found here if you'd like to name the order of the moving average by depth: Tuples extrapolated
STD-Stepped, You'll notice that this is a lot of code and could normally be packed into a single loop in order to extract the N-tuple MA, however due to Pine Script limitations and processing paradigm this is not possible ... yet.
If you choose the EMA option and select a depth of 2, this is the classic DEMA ; EMA with a depth of 3 is the classic TEMA , and so on and so forth this is to help you understand how this indicator works. This version of NTMA is restricted to a maximum depth of 30 or less. Normally this indicator would include 50 depths but I've cut this down to 30 to reduce indicator load time. In the future, I'll create an updated NTMA that allows for more depth levels.
This is considered one of the top ten indicators in forex. You can read more about it here: forex-station.com
How this works
Step 1: Run factorial calculation on the depth value,
Step 2: Calculate weights of nested moving averages
factorial(nemadepth) / (factorial(nemadepth - k) * factorial(k); where nemadepth is the depth and k is the weight position
Examples of coefficient outputs:
6 Depth: 6 15 20 15 6
7 Depth: 7 21 35 35 21 7
8 Depth: 8 28 56 70 56 28 8
9 Depth: 9 36 34 84 126 126 84 36 9
10 Depth: 10 45 120 210 252 210 120 45 10
11 Depth: 11 55 165 330 462 462 330 165 55 11
12 Depth: 12 66 220 495 792 924 792 495 220 66 12
13 Depth: 13 78 286 715 1287 1716 1716 1287 715 286 78 13
Step 3: Apply coefficient to each moving average
For QEMA, which is 5 depth EMA , the caculation is as follows
ema1 = ta. ema ( src , length)
ema2 = ta. ema (ema1, length)
ema3 = ta. ema (ema2, length)
ema4 = ta. ema (ema3, length)
ema5 = ta. ema (ema4, length)
qema = 5 * ema1 - 10 * ema2 + 10 * ema3 - 5 * ema4 + ema5
Included:
Alerts
Loxx's Expanded Source Types
Bar coloring
Signals
Standard deviation stepping

Variety N-Tuple Moving Averages [Loxx]Variety N-Tuple Moving Averages is a moving average indicator that allows you to create 1- 30 tuple moving average types; i.e., Double-MA, Triple-MA, Quadruple-MA, Quintuple-MA, ... N-tuple-MA. This version contains 5 different moving average types including T3. A list of tuples can be found here if you'd like to name the order of the moving average by depth: Tuples extrapolated
You'll notice that this is a lot of code and could normally be packed into a single loop in order to extract the N-tuple MA, however due to Pine Script limitations and processing paradigm this is not possible ... yet.
If you choose the EMA option and select a depth of 2, this is the classic DEMA; EMA with a depth of 3 is the classic TEMA, and so on and so forth this is to help you understand how this indicator works. This version of NTMA is restricted to a maximum depth of 30 or less. Normally this indicator would include 50 depths but I've cut this down to 30 to reduce indicator load time. In the future, I'll create an updated NTMA that allows for more depth levels.
This is considered one of the top ten indicators in forex. You can read more about it here: forex-station.com
How this works
Step 1: Run factorial calculation on the depth value,
Step 2: Calculate weights of nested moving averages
factorial(nemadepth) / (factorial(nemadepth - k) * factorial(k); where nemadepth is the depth and k is the weight position
Examples of coefficient outputs:
6 Depth: 6 15 20 15 6
7 Depth: 7 21 35 35 21 7
8 Depth: 8 28 56 70 56 28 8
9 Depth: 9 36 34 84 126 126 84 36 9
10 Depth: 10 45 120 210 252 210 120 45 10
11 Depth: 11 55 165 330 462 462 330 165 55 11
12 Depth: 12 66 220 495 792 924 792 495 220 66 12
13 Depth: 13 78 286 715 1287 1716 1716 1287 715 286 78 13
Step 3: Apply coefficient to each moving average
For QEMA, which is 5 depth EMA, the caculation is as follows
ema1 = ta.ema(src, length)
ema2 = ta.ema(ema1, length)
ema3 = ta.ema(ema2, length)
ema4 = ta.ema(ema3, length)
ema5 = ta.ema(ema4, length)
qema = 5 * ema1 - 10 * ema2 + 10 * ema3 - 5 * ema4 + ema5
Included:
Alerts
Loxx's Expanded Source Types
Bar coloring

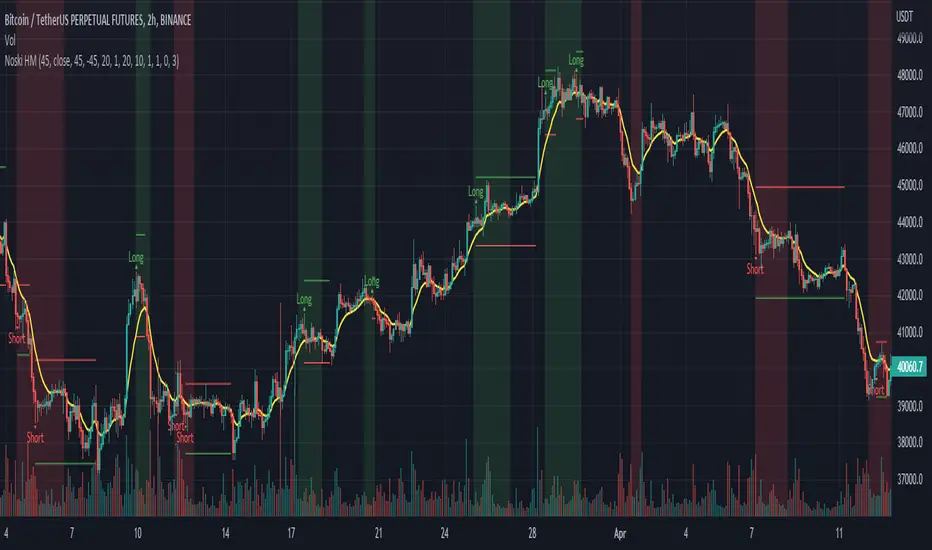
"NoSKi Hammer/Star /w angle of ema Backtester % Applied the angle of ema filter to stars formed in an uptrend, and hammers in a downtrend to try to pick good trading entries
Uses the average angle of the ema over the last 20 bars
(Please note: the angle calculation default value is calibrated for BTCUSD . There is no way currently to code it to be used across multiple pairs. The price to bar ratio has to be adjusted for other trading pairs. Please research price to bar ratio if unfamiliar). I have used a rough calculation so it can be used on other charts but won't be 100% accurate
Strategy uses % take profit and stop loss settings, and only enters one trade at a time (wont show entry if already in a position).
Separate ATR settings for filtering the size of hammer and star candles. (can filter out candles which are too large or small)
Red background colour is for when ema is at or below the set -ve angle slope. Green is for positive angle. Default is set at -45 and 45 degrees.
Big thankyou to ZenAndTheArtOfTrading for hammer and star coding, and Cosmic Angle - by cosmic_indicators for calculating the angle of emas.
Code was borrowed and used directly from these scripts.

Noski - Rob Hoffman_Inventory Retracement BarStrategy taken directly from Rob Hoffman's award winning strategy. Full credit goes to him
Uses the average angle of the ema over the last 20 bars, in combination with Inventory retracement bars (candles that have retraced at least 45%)
(Please note: the angle calculation default value is calibrated for BTCUSD. There is no way currently to code it to be used across multiple pairs. The price to bar ratio has to be adjusted for other trading pairs. Please research price to bar ratio if unfamiliar)
ATR has been included to set take profit and stop loss.
Separate ATR settings for filtering the size of IRB (can filter out candles which are too large or small)
Red background colour is for when ema is at or below the set -ve angle slope. Green is for positive angle. Default is set at -45 and 45 degrees.
Big thankyou to ZenAndTheArtOfTrading and the following two scripts.
Cosmic Angle - by cosmic_indicators
Rob Hoffman's Inventory Retracement Bar - by ucsgears
Code was borrowed and used directly from these scripts
Trade Travel Chill UtilitiesShows Trading Days starting at 5pm (UTC-4 NY Time)
Shows active Asian, UK and US markets by having a different background colours while those markets are open.
Shows possible Brinks hammer/inverted hammers at 03:45 and 09:45

MTF RSI ScannerThis RSI scanner can be use to identify the relative strength of 10 symbols over multiple timeframes
it will give you a quick overview which pair is more bearish or more bullish and also signals tops and bottoms in the AVG row
light red/green cell = weak bearish (RSI = 45-35) / bullish (RSI = 55-65)
medium red/green cell = bearish (RSI = 35-25) / bullish (RSI = 65-75)
dark red/green cell = strong bearish (RSI <= 25) / bullish (RSI >= 75)
gray cell = neutral (RSI= 45-55)
Usage
If AVG (average of all 4 timeframes) falls below 30, the cell will get green, indicating a good time to enter long (buy)
If AVG (average of all 4 timeframes) rises above 70, the cell will get red, indicating a good time to enter short (sell)
Use the "MTF RSI Scanner" in combination with the "MTF Stochastic Scanner"
to find tops (RSI MTF avg >=70 AND Stochastic MTF avg >= 80)
or bottoms (RSI MTF avg <= 30 AND Stochastic MTF avg <= 20)
Here is how the two MTF scanners looked on Nov 08 2021 (ATH) »
and here how the MTF scanners looked on June 21 2022
use TradingViews Replay function to check how it would have worked in the past and when not.
As always… there NOT a single indicator that can show to the top & bottom 100% every single time. So use with caution, with other indicators and/or deeper understanding of technicals analysis ☝️☝️☝️
Settings
You can change the timeframes, symbols, RSI settings, overbought/oversold levels and colors to your liking
Drag the table onto the price chart, if you want to use it as an overlay.
NOTE:
Because of the 4x10 security requests, it can take up to 1 minute for changed settings to take effect! Please be patient 🙃
If you have any idea on how to optimise the code, please feel free to share 🙏
*** Inspired by "Binance CHOP Dashboard" from @Cazimiro and "RSI MTF Table" from @mobester16 ***

RVOL Relative Volume - IntradayHello All,
Relative Volume is one of the most important indicators and Traders should check it while trading/analyzing. it is used to identify whether the volume flows are increasing or decreasing. Relative volume measures current volume in relation to the “usual” volume for this time of the day. What is considered “usual"? For that, we have to use a historical baseline known as the average daily volume. That means how much volume a security does on a daily basis over a defined period. (This scripts runs on the time frames greater or equal 1 minute and less than 1 day)
The common definition for real-time relative volume is: Current volume for this time of day / Average volume for this time of day. It does not mean taking the volume (for example) from 10:30 am to 10:45 am and comparing it to what it does from 10:30 am to 10:45 am every day. What it truly means is to compare cumulative volumes. Therefore, this is the precise definition of real-time relative volume:
Current cumulative volume up to this time of day / Average cumulative volume up to this time of day
What should we understand while checking RVOL;
- Relative volume tell us if volume flows are increasing or decreasing
- A high relative volume tells us that there is increased trading activity in a security today
- Increased volume flows often accompany higher volatility i.e. a significant price move
Let see an example:
P.S. if you want to get more info about RVOL/Relative Volume then you can search it on the net. While developing the script this was used as reference, you can also check it for more info.
Enjoy!

Pythagorean Means of Moving AveragesDESCRIPTION
Pythagorean Means of Moving Averages
1. Calculates a set of moving averages for high, low, close, open and typical prices, each at multiple periods.
Period values follow the Fibonacci sequence.
The "short" set includes moving average having the following periods: 5, 8, 13, 21, 34, 55, 89, 144, 233, 377.
The "mid" set includes moving average having the following periods: 5, 8, 13, 21, 34, 55, 89, 144, 233, 377, 610, 987, 1597.
The "long" set includes moving average having the following periods: 5, 8, 13, 21, 34, 55, 89, 144, 233, 377, 610, 987, 1597, 2584, 4181.
2. User selects the type of moving average: SMA, EMA, HMA, RMA, WMA, VWMA.
3. Calculates the mean of each set of moving averages.
4. User selects the type of mean to be calculated: 1) arithmetic, 2) geometric, 3) harmonic, 4) quadratic, 5) cubic. Multiple mean calculations may be displayed simultaneously, allowing for comparison.
5. Plots the mean for high, low, close, open, and typical prices.
6. User selects which plots to display: 1) high and low prices, 2) close prices, 3) open prices, and/or 4) typical prices.
7. Calculates and plots a vertical deviation from an origin mean--the mean from which the deviation is measured.
8. Deviation = origin mean x a x b^(x/y)/c.
9. User selects the deviation origin mean: 1) high and low prices plot, 2) close prices plot, or 3) typical prices plot.
10. User defines deviation variables a, b, c, x and y.
Examples of deviation:
a) Percent of the mean = 1.414213562 = 2^(1/2) = Pythagoras's constant (default).
b) Percent of the mean = 0.7071067812 = = = sin 45˚ = cos 45˚.
11. Displaces the plots horizontally +/- by a user defined number of periods.
PURPOSE
1. Identify price trends and potential levels of support and resistance.
CREDITS
1. "Fibonacci Moving Average" by Sofien Kaabar: two plots, each an arithmetic mean of EMAs of 1) high prices and 2) low prices, with periods 5, 8, 13, 21, 34, 55, 89, 144, 233, 377, 610, 987, 1597, 2584, 4181.
2. "Solarized" color scheme by Ethan Schoonover.

Multi-period ROCTHe indicator is backtested for the default periods -10 (short), 21(medium) and 45(long). These parameters can be changed using the settings as per your preference.
The indicator allows you to plot three ROC on multiple periods.
Why use this indicator?
A trend is confirmed when its identified as a trend across multiple timeframes or multiple periods.
As all default ROC (10, 21, 45) cross above zero, it marks the beginning of an uptrend. The indicator is backtested on daily timeframe.
Combine your existing bullish strategies with this indicator shall yield improved accuracy as you'd have trend confirmation. Go long only when the ROC is above 0 levels across short, medium and long term periods.
The indicator is inspired by teachings from Mr. Bharat Jhunjhunwala (Founder of ProRSI)

[VJ] Hulk Smash IntraThis is a simple intraday strategy for working on Stocks or commodities based out on Super Trend and ever reliable ADX . You can modify the start time and end time based on your timezones. Session value should be from market start to the time you want to square-off
Important: The end time should be at least 2 minutes before the intraday square-off time set by your broker
Comment below if you get good returns
Strategy: Supertrend and ADX strength (Hulk Smash)
Indicators used :
Super trend is simple and easy to use indicator and gives a precise reading about an on going trend.It is built with two parameters, namely period and multiplier.The Buy and Sell signal modifies once the indicator tosses over the closing price. When the Super trend closes above the Price, a Buy signal is generated, and when the Super trend closes below the Price, a Sell signal is generated. In this case we use it only for direction .
ADX informs a trader when the market is trending.It filters out anti trend trades to help trend chasing indicators from frequent whipsaws
Multiplier is a vital input for Super trend. If the multiplier value is too high, then lesser number of signals is made.
Buying/Selling
• If the price is going UP, and the ADX indicator is also going UP, then we have the case for a bullish trend.
• The same is true if the price is going down and the ADX indicator is going UP. Then we have the case for a bearish trend.
• Value of ADX below 20 is called trading zone which implies non-trending market
• Trade with Strength only if the Super trend is validating
ADX Values
0 - 20 : Non Trending (Range bound market, phase of Accumulation/Distribution)
20-45 : Strong Signal (helpful for traders)
45-60 : Very strong trend (occur rarely, indicate exhaustion)
60 - 100 : Extremely strong trend (very rare, unsustainable trends, be ready for reversals)
Usage & Best setting :
Choose a good volatile stock and a time frame - 5m.
ADX Factor : vary as per info above
ST multiplier : 3
There is stop loss and take profit that can be used to optimise your trade
The template also includes daily square off based on your time.

[Mehrok]-Relative Strength IndexI have attempted to modify existing RSI Model and add some more features to it. Below are the features.
DC High Line - Basis Donchian Channel concept i have added high line. Period can be selected in indicator options. Usage: Let's say i am tracking 90 day High period of RSI which will be shown with orange line on chart. If this orange line is breached it means RSI has made new high. Basis position of RSI we can determine if need to be in trade or exit.
DC Low Line - Basis Donchian Channel concept i have added low line. Period can be selected in indicator options. Usage: Let's say i am tracking 90 day Low period of RSI which will be shown with aqua line on chart. If this aqua line is breached it means RSI has made new low. Basis position of RSI we can determine if we can enter the trade or not.
DC MID Line - DC High + DC LOW / 2 gives a mid line which act as important resistance or support level.
Buy and Sell Zone: I have added two dotted lines which clearly indicate 55 and 45 levels in RSI. Above 55 is considered as sell zone and below 45 as buy zone. You can change the settings basis your need.
Mid Line: Indicator also show mid line at RSI 50 level which makes easier to understand if RSI is above mid line or below. It improves visualization of the indicator.

[JL] Angle of Close StrengthPlaying Angle of Close
This indi is the cumulative sum of Angle
The Angle calculation rules:
- if 1.1 change to 1.2 than change to 1.1, the angle should be -45 degree.
- if 1.2 change to 1.1 then change to 1.2, the angle should be 45 degree.

Fibonacci Extension / Retracement / Pivot Points by DGTFɪʙᴏɴᴀᴄᴄɪ Exᴛᴇɴᴛɪᴏɴ / Rᴇᴛʀᴀᴄᴍᴇɴᴛ / Pɪᴠᴏᴛ Pᴏɪɴᴛꜱ
This study combines various Fibonacci concepts into one, and some basic volume and volatility indications
█ Pɪᴠᴏᴛ Pᴏɪɴᴛꜱ — is a technical indicator that is used to determine the levels at which price may face support or resistance. The Pivot Points indicator consists of a pivot point (PP) level and several support (S) and resistance (R) levels. PP, resistance and support values are calculated in different ways, depending on the type of the indicator, this study implements Fibonacci Pivot Points
The indicator resolution is set by the input of the Pivot Points TF (Timeframe). If the Pivot Points TF is set to AUTO (the default value), then the increased resolution is determined by the following algorithm:
for intraday resolutions up to and including 5 min, 4HOURS (4H) is used
for intraday resolutions more than 5 min and up to and including 45 min, DAY (1D) is used
for intraday resolutions more than 45 min and up to and including 4 hour, WEEK (1W) is used
for daily resolutions MONTH is used (1M)
for weekly resolutions, 3-MONTH (3M) is used
for monthly resolutions, 12-MONTH (12M) is used
If the Pivot Points TF is set to User Defined, users may choose any higher timeframe of their preference
█ Fɪʙ Rᴇᴛʀᴀᴄᴇᴍᴇɴᴛ — Fibonacci retracements is a popular instrument used by technical analysts to determine support and resistance areas. In technical analysis, this tool is created by taking two extreme points (usually a peak and a trough) on the chart and dividing the vertical distance by the key Fibonacci coefficients equal to 23.6%, 38.2%, 50%, 61.8%, and 100%. This study implements an automated method of identifying the pivot lows/highs and automatically draws horizontal lines that are used to determine possible support and resistance levels
█ Fɪʙᴏɴᴀᴄᴄɪ Exᴛᴇɴꜱɪᴏɴꜱ — Fibonacci extensions are a tool that traders can use to establish profit targets or estimate how far a price may travel AFTER a retracement/pullback is finished. Extension levels are also possible areas where the price may reverse. This study implements an automated method of identifying the pivot lows/highs and automatically draws horizontal lines that are used to determine possible support and resistance levels.
IMPORTANT NOTE: Fibonacci extensions option may require to do further adjustment of the study parameters for proper usage. Extensions are aimed to be used when a trend is present and they aim to measure how far a price may travel AFTER a retracement/pullback. I will strongly suggest users of this study to check the education post for further details, where to use extensions and where to use retracements
Important input options for both Fibonacci Extensions and Retracements
Deviation, is a multiplier that affects how much the price should deviate from the previous pivot in order for the bar to become a new pivot. Increasing its value is one way to get higher timeframe Fib Retracement Levels
Depth, affects the minimum number of bars that will be taken into account when building
█ Volume / Volatility Add-Ons
High Volatile Bar Indication
Volume Spike Bar Indication
Volume Weighted Colored Bars
This study benefits from build-in auto fib retracement tv study and modifications applied to get extentions and also to fit this combo
Disclaimer:
Trading success is all about following your trading strategy and the indicators should fit within your trading strategy, and not to be traded upon solely
The script is for informational and educational purposes only. Use of the script does not constitute professional and/or financial advice. You alone have the sole responsibility of evaluating the script output and risks associated with the use of the script. In exchange for using the script, you agree not to hold dgtrd TradingView user liable for any possible claim for damages arising from any decision you make based on use of the script

Medium Term Weighted Stochastic (STPMT) by DGTLa Stochastique Pondérée Moyen Terme (STPMT) , or Mᴇᴅɪᴜᴍ Tᴇʀᴍ Wᴇɪɢʜᴛᴇᴅ Sᴛᴏᴄʜᴀꜱᴛɪᴄꜱ created by Eric Lefort in 1999, a French trader and author of trading books
█ The STPMT indicator is a tool which concerns itself with both the direction and the timing of the market. The STPMT indicator helps the trader with:
The general trend by observing the level around which the indicator oscillates
The changes of direction in the market
The timing to open or close a position by observing the oscillations and by observing the relative position of the STPMT versus its moving average
STPMT Calculation
stpmt = (4,1 * stoch(5, 3) + 2,5 * stoch(14, 3) + stoch(45, 14) + 4 * stoch(75, 20)) / 11.6
Where the first argument of the stoch function representation above is period (length) of K and second argument smoothing period of K. The result series is then plotted as red line and its moving average as blue line. By default disabled gray lines are the components of the STPMT
The oscillations of the STPMT around its moving average define the timing to open a position as crossing of STMP line and moving average line in case when both trends have same direction. The moving average determines the direction.
Long examples
█ Tʜᴇ CYCLE Iɴᴅɪᴄᴀᴛᴏʀ is derived from the STPMT. It is
cycle = stpmt – stpmt moving average
It is indicates more clearly all buy and sell opportunities. On the other hand it does not give any information on market direction. The Cycle indicator is a great help in timing as it allows the trader to more easily see the median length of an oscillation around the average point. In this way the traders can simply use the time axis to identify both a favorable price and a favorable moment. The Cycle Indicator is presented as histogram
The Lefort indicators are not a trading strategy. They are tools for different purposes which can be combined and which can serve for trading all instruments (stocks, market indices, forex, commodities…) in a variety of time frames. Hence they can be used for both day trading and swing trading.
👉 For whom that would like simple version of the Cycle indicator on top of the main price chart with signals as presented below.
Please note that in the following code STMP moving average direction is not considered and will plot signals regardless of the direction of STMP moving average. It is not a non-repainting version too.
here is pine code for the overlay version
// © dgtrd
//@version=4
study("Medium Term Weighted Stochastic (STPMT) by DGT", "STPMT ʙʏ DGT ☼☾", true, format.price, 2, resolution="")
i_maLen = input(9 , "Stoch MA Length", minval=1)
i_periodK1 = input(5 , "K1" , minval=1)
i_smoothK1 = input(3 , "Smooth K1", minval=1)
i_weightK1 = input(4.1 , "Weight K1", minval=1, step=.1)
i_periodK2 = input(14 , "K2" , minval=1)
i_smoothK2 = input(3 , "Smooth K2", minval=1)
i_weightK2 = input(2.5 , "Weight K2", minval=1, step=.1)
i_periodK3 = input(45 , "K3" , minval=1)
i_smoothK3 = input(14 , "Smooth K3", minval=1)
i_weightK3 = input(1. , "Weight K3", minval=1, step=.1)
i_periodK4 = input(75 , "K4" , minval=1)
i_smoothK4 = input(20 , "Smooth K4", minval=1)
i_weightK4 = input(4. , "Weight K4", minval=1, step=.1)
i_data = input(false, "Components of the STPMT")
//------------------------------------------------------------------------------
// stochastic function
f_stoch(_periodK, _smoothK) => sma(stoch(close, high, low, _periodK), _smoothK)
//------------------------------------------------------------------------------
// calculations
// La Stochastique Pondérée Moyen Terme (STPMT) or Medium Term Weighted Stochastics calculation
stpmt = (i_weightK1 * f_stoch(i_periodK1, i_smoothK1) + i_weightK2 * f_stoch(i_periodK2, i_smoothK2) + i_weightK3 * f_stoch(i_periodK3, i_smoothK3) + i_weightK4 * f_stoch(i_periodK4, i_smoothK4)) / (i_weightK1 + i_weightK2 + i_weightK3 + i_weightK4)
stpmt_ma = sma(stpmt, i_maLen) // STPMT Moving Average
cycle = stpmt - stpmt_ma // Cycle Indicator
//------------------------------------------------------------------------------
// plotting
plotarrow(change(sign(cycle)), "STPMT Signals", color.green, color.red, 0, maxheight=41)
alertcondition(cross(cycle, 0), title="Trading Opportunity", message="STPMT Cycle : Probable Trade Opportunity\n{{exchange}}:{{ticker}}->\nPrice = {{close}},\nTime = {{time}}")

Universal Global SessionUniversal Global Session
This Script combines the world sessions of: Stocks, Forex, Bitcoin Kill Zones, strategic points, all configurable, in a single Script, to capitalize the opening and closing times of global exchanges as investment assets, becoming an Universal Global Session .
It is based on the great work of @oscarvs ( BITCOIN KILL ZONES v2 ) and the scripts of @ChrisMoody. Thank you Oscar and Chris for your excellent judgment and great work.
At the end of this writing you can find all the internet references of the extensive documentation that I present here. To maximize your benefits in the use of this Script, I recommend that you read the entire document to create an objective and practical criterion.
All the hours of the different exchanges are presented at GMT -6. In Market24hClock you can adjust it to your preferences.
After a deep investigation I have been able to show that the different world sessions reveal underlying investment cycles, where it is possible to find sustained changes in the nominal behavior of the trend before the passage from one session to another and in the natural overlaps between the sessions. These underlying movements generally occur 15 minutes before the start, close or overlap of the session, when the session properly starts and also 15 minutes after respectively. Therefore, this script is designed to highlight these particular trending behaviors. Try it, discover your own conclusions and let me know in the notes, thank you.
Foreign Exchange Market Hours
It is the schedule by which currency market participants can buy, sell, trade and speculate on currencies all over the world. It is open 24 hours a day during working days and closes on weekends, thanks to the fact that operations are carried out through a network of information systems, instead of physical exchanges that close at a certain time. It opens Monday morning at 8 am local time in Sydney —Australia— (which is equivalent to Sunday night at 7 pm, in New York City —United States—, according to Eastern Standard Time), and It closes at 5pm local time in New York City (which is equivalent to 6am Saturday morning in Sydney).
The Forex market is decentralized and driven by local sessions, where the hours of Forex trading are based on the opening range of each active country, becoming an efficient transfer mechanism for all participants. Four territories in particular stand out: Sydney, Tokyo, London and New York, where the highest volume of operations occurs when the sessions in London and New York overlap. Furthermore, Europe is complemented by major financial centers such as Paris, Frankfurt and Zurich. Each day of forex trading begins with the opening of Australia, then Asia, followed by Europe, and finally North America. As markets in one region close, another opens - or has already opened - and continues to trade in the currency market. The seven most traded currencies in the world are: the US dollar, the euro, the Japanese yen, the British pound, the Australian dollar, the Canadian dollar, and the New Zealand dollar.
Currencies are needed around the world for international trade, this means that operations are not dominated by a single exchange market, but rather involve a global network of brokers from around the world, such as banks, commercial companies, central banks, companies investment management, hedge funds, as well as retail forex brokers and global investors. Because this market operates in multiple time zones, it can be accessed at any time except during the weekend, therefore, there is continuously at least one open market and there are some hours of overlap between the closing of the market of one region and the opening of another. The international scope of currency trading means that there are always traders around the world making and satisfying demands for a particular currency.
The market involves a global network of exchanges and brokers from around the world, although time zones overlap, the generally accepted time zone for each region is as follows:
Sydney 5pm to 2am EST (10pm to 7am UTC)
London 3am to 12 noon EST (8pm to 5pm UTC)
New York 8am to 5pm EST (1pm to 10pm UTC)
Tokyo 7pm to 4am EST (12am to 9am UTC)
Trading Session
A financial asset trading session refers to a period of time that coincides with the daytime trading hours for a given location, it is a business day in the local financial market. This may vary according to the asset class and the country, therefore operators must know the hours of trading sessions for the securities and derivatives in which they are interested in trading. If investors can understand market hours and set proper targets, they will have a much greater chance of making a profit within a workable schedule.
Kill Zones
Kill zones are highly liquid events. Many different market participants often come together and perform around these events. The activity itself can be event-driven (margin calls or option exercise-related activity), portfolio management-driven (asset allocation rebalancing orders and closing buy-in), or institutionally driven (larger players needing liquidity to complete the size) or a combination of any of the three. This intense cross-current of activity at a very specific point in time often occurs near significant technical levels and the established trends emerging from these events often persist until the next Death Zone approaches or enters.
Kill Zones are evolving with time and the course of world history. Since the end of World War II, New York has slowly invaded London's place as the world center for commercial banking. So much so that during the latter part of the 20th century, New York was considered the new center of the financial universe. With the end of the cold war, that leadership appears to have shifted towards Europe and away from the United States. Furthermore, Japan has slowly lost its former dominance in the global economic landscape, while Beijing's has increased dramatically. Only time will tell how these death zones will evolve given the ever-changing political, economic, and socioeconomic influences of each region.
Financial Markets
New York
New York (NYSE Chicago, NASDAQ)
7:30 am - 2:00 pm
It is the second largest currency platform in the world, followed largely by foreign investors as it participates in 90% of all operations, where movements on the New York Stock Exchange (NYSE) can have an immediate effect (powerful) on the dollar, for example, when companies merge and acquisitions are finalized, the dollar can instantly gain or lose value.
A. Complementary Stock Exchanges
Brazil (BOVESPA - Brazilian Stock Exchange)
07:00 am - 02:55 pm
Canada (TSX - Toronto Stock Exchange)
07:30 am - 02:00 pm
New York (NYSE - New York Stock Exchange)
08:30 am - 03:00 pm
B. North American Trading Session
07:00 am - 03:00 pm
(from the beginning of the business day on NYSE and NASDAQ, until the end of the New York session)
New York, Chicago and Toronto (Canada) open the North American session. Characterized by the most aggressive trading within the markets, currency pairs show high volatility. As the US markets open, trading is still active in Europe, however trading volume generally decreases with the end of the European session and the overlap between the US and Europe.
C. Strategic Points
US main session starts in 1 hour
07:30 am
The euro tends to drop before the US session. The NYSE, CHX and TSX (Canada) trading sessions begin 1 hour after this strategic point. The North American session begins trading Forex at 07:00 am.
This constitutes the beginning of the overlap of the United States and the European market that spans from 07:00 am to 10:35 am, often called the best time to trade EUR / USD, it is the period of greatest liquidity for the main European currencies since it is where they have their widest daily ranges.
When New York opens at 07:00 am the most intense trading begins in both the US and European markets. The overlap of European and American trading sessions has 80% of the total average trading range for all currency pairs during US business hours and 70% of the total average trading range for all currency pairs during European business hours. The intersection of the US and European sessions are the most volatile overlapping hours of all.
Influential news and data for the USD are released between 07:30 am and 09:00 am and play the biggest role in the North American Session. These are the strategically most important moments of this activity period: 07:00 am, 08:00 am and 08:30 am.
The main session of operations in the United States and Canada begins
08:30 am
Start of main trading sessions in New York, Chicago and Toronto. The European session still overlaps the North American session and this is the time for large-scale unpredictable trading. The United States leads the market. It is difficult to interpret the news due to speculation. Trends develop very quickly and it is difficult to identify them, however trends (especially for the euro), which have developed during the overlap, often turn the other way when Europe exits the market.
Second hour of the US session and last hour of the European session
09:30 am
End of the European session
10:35 am
The trend of the euro will change rapidly after the end of the European session.
Last hour of the United States session
02:00 pm
Institutional clients and very large funds are very active during the first and last working hours of almost all stock exchanges, knowing this allows to better predict price movements in the opening and closing of large markets. Within the last trading hours of the secondary market session, a pullback can often be seen in the EUR / USD that continues until the opening of the Tokyo session. Generally it happens if there was an upward price movement before 04:00 pm - 05:00 pm.
End of the trade session in the United States
03:00 pm
D. Kill Zones
11:30 am - 1:30 pm
New York Kill Zone. The United States is still the world's largest economy, so by default, the New York opening carries a lot of weight and often comes with a huge injection of liquidity. In fact, most of the world's marketable assets are priced in US dollars, making political and economic activity within this region even more important. Because it is relatively late in the world's trading day, this Death Zone often sees violent price swings within its first hour, leading to the proven adage "never trust the first hour of trading in America. North.
---------------
London
London (LSE - London Stock Exchange)
02:00 am - 10:35 am
Britain dominates the currency markets around the world, and London is its main component. London, a central trading capital of the world, accounts for about 43% of world trade, many Forex trends often originate from London.
A. Complementary Stock Exchange
Dubai (DFM - Dubai Financial Market)
12:00 am - 03:50 am
Moscow (MOEX - Moscow Exchange)
12:30 am - 10:00 am
Germany (FWB - Frankfurt Stock Exchange)
01:00 am - 10:30 am
Afríca (JSE - Johannesburg Stock Exchange)
01:00 am - 09:00 am
Saudi Arabia (TADAWUL - Saudi Stock Exchange)
01:00 am - 06:00 am
Switzerland (SIX - Swiss Stock Exchange)
02:00 am - 10:30 am
B. European Trading Session
02:00 am - 11:00 am
(from the opening of the Frankfurt session to the close of the Order Book on the London Stock Exchange / Euronext)
It is a very liquid trading session, where trends are set that start during the first trading hours in Europe and generally continue until the beginning of the US session.
C. Middle East Trading Session
12:00 am - 06:00 am
(from the opening of the Dubai session to the end of the Riyadh session)
D. Strategic Points
European session begins
02:00 am
London, Frankfurt and Zurich Stock Exchange enter the market, overlap between Europe and Asia begins.
End of the Singapore and Asia sessions
03:00 am
The euro rises almost immediately or an hour after Singapore exits the market.
Middle East Oil Markets Completion Process
05:00 am
Operations are ending in the European-Asian market, at which time Dubai, Qatar and in another hour in Riyadh, which constitute the Middle East oil markets, are closing. Because oil trading is done in US dollars, and the region with the trading day coming to an end no longer needs the dollar, consequently, the euro tends to grow more frequently.
End of the Middle East trading session
06:00 am
E. Kill Zones
5:00 am - 7:00 am
London Kill Zone. Considered the center of the financial universe for more than 500 years, Europe still has a lot of influence in the banking world. Many older players use the European session to establish their positions. As such, the London Open often sees the most significant trend-setting activity on any trading day. In fact, it has been suggested that 80% of all weekly trends are set through the London Kill Zone on Tuesday.
F. Kill Zones (close)
2:00 pm - 4:00 pm
London Kill Zone (close).
---------------
Tokyo
Tokyo (JPX - Tokyo Stock Exchange)
06:00 pm - 12:00 am
It is the first Asian market to open, receiving most of the Asian trade, just ahead of Hong Kong and Singapore.
A. Complementary Stock Exchange
Singapore (SGX - Singapore Exchange)
07:00 pm - 03:00 am
Hong Kong (HKEx - Hong Kong Stock Exchange)
07:30 pm - 02:00 am
Shanghai (SSE - Shanghai Stock Exchange)
07:30 pm - 01:00 am
India (NSE - India National Stock Exchange)
09:45 pm - 04:00 am
B. Asian Trading Session
06:00 pm - 03:00 am
From the opening of the Tokyo session to the end of the Singapore session
The first major Asian market to open is Tokyo which has the largest market share and is the third largest Forex trading center in the world. Singapore opens in an hour, and then the Chinese markets: Shanghai and Hong Kong open 30 minutes later. With them, the trading volume increases and begins a large-scale operation in the Asia-Pacific region, offering more liquidity for the Asian-Pacific currencies and their crosses. When European countries open their doors, more liquidity will be offered to Asian and European crossings.
C. Strategic Points
Second hour of the Tokyo session
07:00 pm
This session also opens the Singapore market. The commercial dynamics grows in anticipation of the opening of the two largest Chinese markets in 30 minutes: Shanghai and Hong Kong, within these 30 minutes or just before the China session begins, the euro usually falls until the same moment of the opening of Shanghai and Hong Kong.
Second hour of the China session
08:30 pm
Hong Kong and Shanghai start trading and the euro usually grows for more than an hour. The EUR / USD pair mixes up as Asian exporters convert part of their earnings into both US dollars and euros.
Last hour of the Tokyo session
11:00 pm
End of the Tokyo session
12:00 am
If the euro has been actively declining up to this time, China will raise the euro after the Tokyo shutdown. Hong Kong, Shanghai and Singapore remain open and take matters into their own hands causing the growth of the euro. Asia is a huge commercial and industrial region with a large number of high-quality economic products and gigantic financial turnover, making the number of transactions on the stock exchanges huge during the Asian session. That is why traders, who entered the trade at the opening of the London session, should pay attention to their terminals when Asia exits the market.
End of the Shanghai session
01:00 am
The trade ends in Shanghai. This is the last trading hour of the Hong Kong session, during which market activity peaks.
D. Kill Zones
10:00 pm - 2:00 am
Asian Kill Zone. Considered the "Institutional" Zone, this zone represents both the launch pad for new trends as well as a recharge area for the post-American session. It is the beginning of a new day (or week) for the world and as such it makes sense that this zone often sets the tone for the remainder of the global business day. It is ideal to pay attention to the opening of Tokyo, Beijing and Sydney.
--------------
Sidney
Sydney (ASX - Australia Stock Exchange)
06:00 pm - 12:00 am
A. Complementary Stock Exchange
New Zealand (NZX - New Zealand Stock Exchange)
04:00 pm - 10:45 pm
It's where the global trading day officially begins. While it is the smallest of the megamarkets, it sees a lot of initial action when markets reopen Sunday afternoon as individual traders and financial institutions are trying to regroup after the long hiatus since Friday afternoon. On weekdays it constitutes the end of the current trading day where the change in the settlement date occurs.
B. Pacific Trading Session
04:00 pm - 12:00 am
(from the opening of the Wellington session to the end of the Sydney session)
Forex begins its business hours when Wellington (New Zealand Exchange) opens local time on Monday. Sydney (Australian Stock Exchange) opens in 2 hours. It is a session with a fairly low volatility, configuring itself as the calmest session of all. Strong movements appear when influential news is published and when the Pacific session overlaps the Asian Session.
C. Strategic Points
End of the Sydney session
12:00 am
---------------
Conclusions
The best time to trade is during overlaps in trading times between open markets. Overlaps equate to higher price ranges, creating greater opportunities.
Regarding press releases (news), it should be noted that these in the currency markets have the power to improve a normally slow trading period. When a major announcement is made regarding economic data, especially when it goes against the predicted forecast, the coin can lose or gain value in a matter of seconds. In general, the more economic growth a country produces, the more positive the economy is for international investors. Investment capital tends to flow to countries that are believed to have good growth prospects and subsequently good investment opportunities, leading to the strengthening of the country's exchange rate. Also, a country that has higher interest rates through its government bonds tends to attract investment capital as foreign investors seek high-yield opportunities. However, stable economic growth and attractive yields or interest rates are inextricably intertwined. It's important to take advantage of market overlaps and keep an eye out for press releases when setting up a trading schedule.
References:
www.investopedia.com
www.investopedia.com
www.investopedia.com
www.investopedia.com
market24hclock.com
market24hclock.com

Price Action Trading System v0.3 by JustUncleL with modifcationsThe base of this script is the Price Action Trading System from JustUncle .
I have first combined it with script ADX and DI by BeikabuOyaji to indicate when the +DI is above the -DI and the ADX is above 20. This is represented by crosses at the top of the page: green indicating that the +DI is above the -DI and ADX above 20, and red if -DI is above the +DI and ADX above 20. If the ADX is increasing in slope while the +DI is above the -DI, an up green arrow is shown at the bottom of the page, indicating an increase in this trend, and the slope of the ADX is increasing and the -DI is above the +DI, a down arrow is shown at the bottom. One could think to a green cross with a green up arrow as a potential buy opportunity, and a red cross with a red down arrow as a potential sell opportunity.
Next, I have combined this script with the Indicator: WaveTrend Oscillator from Lazybear . If the oscillator has readings below -45 and the slope of the line is increasing, a green diamond appears above the chart. This indicates a potential buy opportunity. If the oscillator has readings above 50 and the slope of the line is decreasing, a red diamond appears above the chart. This indicates a potential sell opportunity. Now if the slope of the oscillator is rising significantly but does not hit the -45 threshold to start its increase, but is negative in value, a green flag appears at the top of the page. This represents a potential buy opportunity. If the slope of the oscillator is significantly decreasing and is positive in value, a red flag appears at the bottom of the page. This represents a potential sell opportunity.
The base of this script, the Price Action Trading System v0.3 by JustUncle , has many of its own features that I have kept. If the MACD is positive, the background colour is green. If it is negative, the colour is red. If the CCI and RSI indicate an oversold opportunity and the MACD is positive, you get an up olive arrow below the chart. If they indicate an overbought opportunity and the MACD is negative, you get a red down arrow above the chart. If the CCI value stays oversold after a green arrow, the candle chart turns turquoise, and if overbought, turns black after a red arrow.
You can use these indicators in combination to help you with your trading strategy.

RVC-Daily_PivotsPurpose: Fibonacci Pivot levels + Gann levels calculation and display on Chart automatically.
Mainly expected to use these for intraday trading on NIFTY and BankNifty
Display R1/R2/R3 - Pivot - S1/S2/S3 levels
Also display GANN Levels of
720- / 540- / 360- / 270-/ 180- / 90- / 45-
45+ / 90+ / 180+ / 270+ / 360+ /540+ /720 +
Same pivot levels are useful for any equity - support and resistance levels.
Levels indicated are only for reference and not meant for trading purpose.

RSI MTF by PeterOThis is my take on reaching Higher TimeFrame charts, what is usually helpful when determining the trend. On the example of RSI.
So imagine you want to check RSI from higher timeframe. 15x higher for example. There are 3 ways to do it.
1. security(tickerid,"15",rsi(close,14))
DON'T!!! I strongly advise against this method. Security() function is buggy in PineScript, leads to so-called "repainting" issues. Repainting is caused by creating leak from future data and leads to abnormally fantastic strategy backtest results like the one in Open Close Cross Strategy. Theoretically speaking if security() used correctly - with Pine version3 and barmerge.lookahead_off - you should encounter no repainting, but I could swear I saw scripts repaint even with security() implemented properly.
Even assuming security() implemented correctly will not repaint - it will create delay in your script. I'm using "15" multiplier in my example, and this means, I have to wait for 15 candles to close to produce indicators value. If a strong move happens in the meantime, I'm blind, because I have to wait anyway.
So for your own security, stay away from security() at all times.
2. rsi(close,14*15)
This will produce RSI plot with no delay, but a very flattened one. RSI will move between 45 and 45, never even reaching 30 or 70 levels. So pretty useless.
3. Dig-in-the-formula way.
Doing a bit more math produces RSI line, which is not delayed, not repainting and moving in full 0-100 RSI range. Actually - looking almost identical to the one from the higher timeframe. Which was the goal of this script.

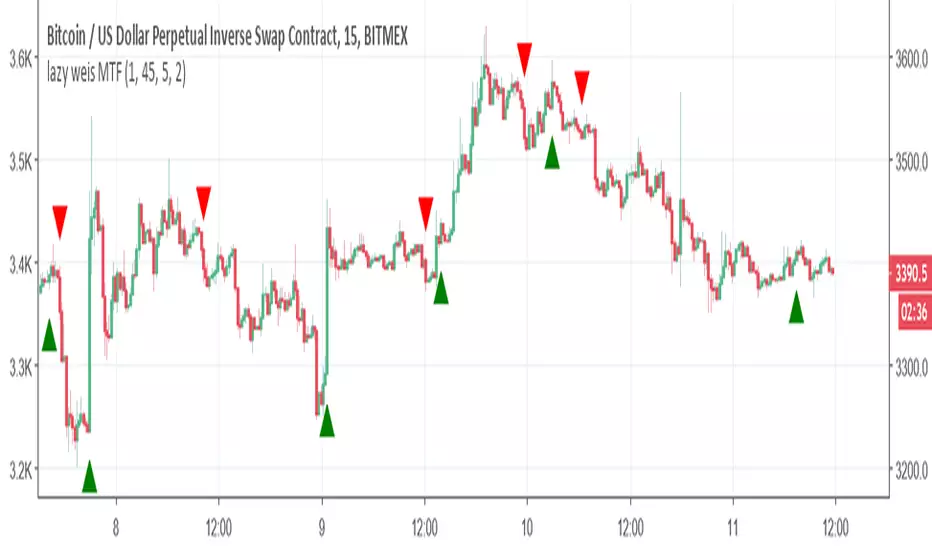
lazy weis MTFSo here was my problem and the way we fix it . We all know lazy bear weis model of volume . if we make it to MTF then we use security and it will repaint all over . since its hard to convert it to version 3 in order to fix the problem ,then it was impossible so far to make it a good MTF model.
By changing the length to time function we do not need to use the security and by this we can create an MTF model with no repaint ( i hope).
Now in setting you see int2 (now its on 60 min) , this you can change to any min value that you want. TV will consider it as length and not as time and by this way you can manipulate it to be an MTF model of your choosing . The int1 is minimum min always need to be smaller then int2
lets say you want 5 min chart and on 10 min time frame. so set it as int1=1 and int=15. if you want 45 min frame on the 5 min so set int 2 to 45
if you want it to be daily just set it to 1440 ,
I hope you like this solution