Enhanced Cycle IndicatorEnhanced Cycle Indicator Guide
DISCLAIMER
"This PineScript indicator evolved from a foundational algorithm designed to visualize cycle-based center average differentials. The original concept has been significantly enhanced and optimized through collaborative refinement with AI, resulting in improved functionality, performance, and visualization capabilities while maintaining the core mathematical principles of the original design"
Overview
The Enhanced Cycle Indicator is designed to identify market cycles with minimal lag while ensuring the cycle lows and highs correspond closely with actual price bottoms and tops. This indicator transforms price data into observable cycles that help you identify when a market is likely to change direction.
Core Principles
Cycle Detection: Identifies natural market rhythms using multiple timeframes
Dynamic Adaptation: Adjusts to changing market conditions for consistent performance
Precise Signals: Provides clear entry and exit points aligned with actual market turns
Reduced Lag: Uses advanced calculations to minimize delay in cycle identification
How To Use
1. Main Cycle Interpretation
Green Histogram Bars: Bullish cycle phase (upward momentum)
Red Histogram Bars: Bearish cycle phase (downward momentum)
Cycle Extremes: When the histogram reaches extreme values (+80/-80), the market is likely approaching a turning point
Zero Line: Crossovers often indicate a shift in the underlying market direction
2. Trading Signals
Green Triangle Up (bottom of chart): Strong bullish signal - ideal for entries or covering shorts
Red Triangle Down (top of chart): Strong bearish signal - ideal for exits or short entries
Diamond Shapes: Indicate divergence between price and cycle - early warning of potential reversals
Small Circles: Minor cycle turning points - useful for fine-tuning entries/exits
3. Optimal Signal Conditions
Bullish Signals Work Best When:
The cycle is deeply oversold (below -60)
RSI is below 40 or turning up
Price is near a significant low
Multiple confirmation bars have occurred
Bearish Signals Work Best When:
The cycle is heavily overbought (above +60)
RSI is above 60 or turning down
Price is near a significant high
Multiple confirmation bars have occurred
4. Parameter Adjustments
For Shorter Timeframes: Reduce cycle periods and smoothing factor for faster response
For Daily/Weekly Charts: Increase cycle periods and smoothing for smoother signals
For Volatile Markets: Reduce cycle responsiveness to filter noise
For Trending Markets: Increase signal confirmation requirement to avoid false signals
Recommended Settings
Default (All-Purpose)
Main Cycle: 50
Half Cycle: 25
Quarter Cycle: 12
Smoothing Factor: 0.5
RSI Filter: Enabled
Signal Confirmation: 2 bars
Faster Response (Day Trading)
Main Cycle: 30
Half Cycle: 15
Quarter Cycle: 8
Smoothing Factor: 0.3
Cycle Responsiveness: 1.2
Signal Confirmation: 1 bar
Smoother Signals (Swing Trading)
Main Cycle: 80
Half Cycle: 40
Quarter Cycle: 20
Smoothing Factor: 0.7
Cycle Responsiveness: 0.8
Signal Confirmation: 3 bars
Advanced Features
Adaptive Period
When enabled, the indicator automatically adjusts cycle periods based on recent price volatility. This is particularly useful in markets that alternate between trending and ranging behaviors.
Momentum Filter
Enhances cycle signals by incorporating price momentum, making signals more responsive during strong trends and less prone to whipsaws during consolidations.
RSI Filter
Adds an additional confirmation layer using RSI, helping to filter out lower-quality signals and improve overall accuracy.
Divergence Detection
Identifies situations where price makes a new high/low but the cycle doesn't confirm, often preceding significant market reversals.
Best Practices
Use the indicator in conjunction with support/resistance levels
Look for signal clusters across multiple timeframes
Reduce position size when signals appear far from cycle extremes
Pay special attention to signals that coincide with divergences
Customize cycle periods to match the natural rhythm of your traded instrument
Troubleshooting
Too Many Signals: Increase signal confirmation bars or reduce cycle responsiveness
Missing Major Turns: Decrease smoothing factor or increase cycle responsiveness
Signals Too Late: Decrease cycle periods and smoothing factor
False Signals: Enable RSI filter and increase signal confirmation requirement
Tìm kiếm tập lệnh với "Cycle"

Optimized Future Time CyclesThis script is based on time cycles and visually displays the cyclical fluctuations of the past and future, helping to predict trend reversal points and market turning points. Below, I will explain the main functions of this indicator and how to interpret it.
1. Main Features of the Indicator
Time Cycle Settings:
Users can set different time cycles (e.g., 9 days, 17 days, 26 days), and each cycle is visually distinguished by colors and labels.
A specific date is set as the reference date, from which the cycles are calculated. The cycles appear as vertical lines on the chart, both in the past and future, allowing you to spot trend reversals.
Future and Past Cycles:
Future cycles help predict when trend changes will occur in the future. Based on the set cycles, you can anticipate turning points in market trends.
Past cycles allow you to examine historical cycles, providing insights into past market movements, which can serve as a basis for predicting future patterns. This helps identify similar patterns from the past that might repeat.
2. How to Use and Interpret the Indicator
Reference Date Setting:
The reference date is a crucial factor in this indicator. For example, if you set the reference date as an important market turning point in the past, you can obtain a more accurate analysis.
If the reference date is too recent, multiple cycles may overlap on the chart, but this is a normal phenomenon. In this case, it is recommended to set the reference date further back in time for a clearer chart.
Cycle Analysis:
Each cycle represents cyclical market volatility. Shorter cycles like 9-day, 17-day, and 26-day cycles represent different timeframes' volatility. When multiple cycles overlap, this could indicate a significant trend reversal.
Pay attention to points where cycles overlap, as these could signal stronger trend changes.
Importance of Future Cycles:
It’s especially important to pay attention to future cycles as they provide insights into potential trend reversals. Future cycles can indicate likely points of trend reversal, helping you prepare in advance.
3. Additional Considerations
Vertical Line and Label Spacing:
Since multiple cycles are displayed on the chart simultaneously, you can customize the spacing of the vertical lines and labels. If the chart becomes too crowded, you can adjust the line style (solid, dotted, etc.) to reduce visual clutter.
Short-Term vs. Long-Term Cycles:
Short-term cycles (e.g., 9-day cycles) are useful for predicting short-term volatility, while long-term cycles (e.g., 200-day cycles) help predict larger trend changes. You can combine short and long cycles for deeper analysis.
4. Recommended Combination: With Moving Average Wave Indicator
This time cycle indicator works well in combination with the Moving Average Wave Indicator. While the time cycle indicator identifies timing for trend changes, the Moving Average Wave Indicator visually shows the direction of the trend. When used together, they offer precise entry and exit points for trades.
Time Cycles indicate when a trend change might occur, and Moving Average Waves show the direction of that trend at those specific points. Combining both helps you identify strong buy/sell signals.
5. Conclusion
This indicator uses time cycles to help you predict past and future market volatility. The reference date plays a critical role, and when multiple cycles overlap, you can expect strong trend reversals. Focusing on future cycles and combining this with the Moving Average Wave Indicator allows you to grasp both the timing and direction of trend changes, making this a powerful tool for market analysis.
"It is recommended to combine it with the Ichimoku Wave Oscillator with Custom MA indicator."
이 스크립트는 **시간 주기(Time Cycle)**에 기반한 지표로, 과거 및 미래의 주기적 변동을 시각적으로 보여주어 추세 변화의 시점과 시장 변곡점을 예측하는 데 도움을 줍니다. 이 지표의 주요 기능과 해석 방법을 중심으로 자세히 설명드리겠습니다.
1. 지표의 주요 기능
시간 주기 설정:
각기 다른 시간 주기(9일, 17일, 26일 등)를 사용자가 설정할 수 있으며, 각 주기는 색상과 레이블로 시각적으로 구분됩니다.
특정 날짜를 **기준 날짜(reference date)**로 설정하여 그 날짜부터 주기들이 계산됩니다. 기준 날짜를 기반으로 과거와 미래의 주기가 차트에 수직선과 함께 나타나며, 이를 통해 추세의 변곡점을 확인할 수 있습니다.
미래 주기 및 과거 주기:
미래 주기는 미래의 추세 변화 시점을 예측하는 데 도움이 됩니다. 각 주기가 설정된 기준에 따라 추세 변곡점이 언제 도래할지 미리 알 수 있습니다.
과거 주기는 과거 시장에서의 주기적 변동을 확인하여, 앞으로의 시장 움직임을 예측하는 데 참고할 수 있습니다. 이를 통해 과거와 유사한 패턴을 포착할 수 있습니다.
2. 지표 사용 및 해석 방법
기준 날짜 설정:
이 지표의 기준 날짜는 매우 중요한 요소입니다. 예를 들어, 시장에서 중요한 변동이 있었던 날짜를 기준으로 설정하면 더 정확한 분석이 가능합니다.
기준 날짜가 너무 최근일 경우, 여러 주기들이 차트 상에서 겹칠 수 있는데 이는 정상적인 현상입니다. 이 경우, 기준 날짜를 더 과거로 설정하면 차트가 좀 더 깔끔하게 보일 수 있습니다.
주기 분석:
각 주기는 시장 변동성의 주기적 패턴을 나타냅니다. 9일, 17일, 26일 등의 주기는 각기 다른 시간대의 변동성을 나타내며, 주기가 겹칠 때 추세 전환 시점이 강하게 나타날 수 있습니다.
주기가 겹치는 시점에서 변동이 강해질 가능성이 있으며, 이때는 추세 변화에 주목할 필요가 있습니다.
미래 주기의 중요성:
특히 미래 주기를 확인하는 것이 중요한데, 미래에 어떤 시점에서 변곡점이 나타날지 예측하는 데 사용할 수 있기 때문입니다. 미래 주기는 추세 전환 가능성이 높은 시점을 알려줄 수 있으므로, 미리 준비하고 대응할 수 있게 도와줍니다.
3. 추가적으로 고려할 사항
수직선과 레이블 간격:
여러 주기들이 한꺼번에 차트에 표시되기 때문에, 수직선이나 레이블 간의 간격을 커스터마이징할 수 있습니다. 특히, 차트가 혼잡할 경우 선 스타일(실선, 점선 등)을 조정하여 시각적으로 덜 복잡하게 설정할 수 있습니다.
단기 vs. 장기 주기:
**단기 주기(예: 9일)**는 빠른 변동성을 예측하는 데 유리하며, **장기 주기(예: 200일)**는 더 큰 추세 변화를 예측하는 데 도움이 됩니다. 두 주기 간의 상호작용을 고려하여 분석의 깊이를 더할 수 있습니다.
4. 결합 사용 추천: 이평선 파동 지표와 함께
이 시간 주기 지표는 이평선 파동 지표와 결합하여 사용할 때 추세의 방향성과 변곡점을 동시에 분석하는 데 매우 유용합니다.
시간 주기는 추세 변곡점의 시점을 알려주고, 이평선 파동은 그 시점에서의 추세 방향성을 시각적으로 나타내므로, 두 지표를 함께 사용하면 정확한 매매 타이밍을 잡는 데 큰 도움이 됩니다.
5. 결론
이 지표는 **시간 주기(Time Cycle)**를 활용하여 과거 및 미래의 시장 변동성을 예측할 수 있도록 도와줍니다. 특히, 기준 날짜 설정이 매우 중요하며, 여러 주기가 겹치는 시점에서는 강한 추세 전환을 예상할 수 있습니다. 미래 주기를 중점적으로 분석하고, 이평선 파동 지표와 결합하여 사용하면 추세 변화의 방향성과 시점을 동시에 잡아낼 수 있어 매우 유용합니다. "Ichimoku Wave Oscillator with Custom MA 지표와 결합해서 사용하면 좋습니다."

Momentum Cycle Oscillator (MCO)1. Concept and Inspiration
The Momentum Cycle Oscillator (MCO) is a unique indicator designed to combine volatility and momentum into a unified tool for identifying market cycles. Traditional indicators often isolate either momentum (e.g., RSI) or volatility (e.g., Bollinger Bands), but the MCO bridges the gap by synthesizing these dimensions into one oscillating signal. By measuring price acceleration (momentum) and range consistency (volatility), the MCO aims to detect when a price cycle is shifting from contraction to expansion or vice versa, signaling potential trend reversals or continuations. Its zero-centered design provides a clear demarcation between bullish and bearish cycles.
2. Mathematical Structure
The MCO is built on two foundational components: the volatility factor and the momentum factor. The volatility factor quantifies the price range over a defined period, highlighting market consistency and expansion. Meanwhile, the momentum factor assesses the rate of change in smoothed closing prices, revealing directional acceleration. These two factors are multiplied to create the raw MCO value, which is further smoothed to reduce noise and improve readability. The resulting oscillator fluctuates around zero, with positive values indicating upward cycles and negative values signaling downward cycles.
3. Practical Applications
The MCO excels in identifying cycle turning points, where the market transitions from a bearish phase to a bullish phase or vice versa. Traders can use the zero line as a reference: a crossover from below to above zero suggests a potential buy signal, while a crossover from above to below zero indicates a sell signal. The MCO’s unique blend of volatility and momentum also helps detect shifts in trend strength, making it valuable in both trending and ranging markets. Its histogram visualization further aids traders by emphasizing the magnitude and direction of market momentum.
4. Innovative Features
What sets the MCO apart is its ability to adapt dynamically to market conditions. By fusing two dimensions of market behavior—volatility and momentum—it provides a holistic view of price action. Unlike traditional indicators that rely heavily on recursion (e.g., EMA), the MCO’s straightforward calculation reduces lag, ensuring timely signals. Furthermore, its use of normalized components allows it to function effectively across diverse assets and timeframes without extensive parameter tuning. This makes it particularly versatile for both intraday traders and long-term investors.
5. Limitations and Potential
While the MCO is robust, it is not immune to challenges. In highly choppy or low-volume markets, the indicator may generate false signals, as volatility and momentum can be erratic. Additionally, its performance depends on proper parameter calibration, with periods requiring adjustment to align with the asset’s behavior. However, its creative approach to combining volatility and momentum offers immense potential for refinement and customization. With proper backtesting and optimization, the MCO could become a staple tool for traders seeking a comprehensive yet simple way to interpret market cycles.

Quarterly Cycles by [M1rage]Quarterly Cycles by — Indicator Description (English)
Purpose
“Quarterly Cycles by ” is a multi-time-frame tool that visualizes recurring market rhythms—from 90-minute sessions up to annual cycles—and highlights Seasonal & Session-to-Session Market Transitions (SSMT).
It helps discretionary and quantitative traders:
See where the current bar sits inside intraday, daily, weekly, monthly, and yearly cycles.
Spot fresh highs/lows relative to the previous cycle and immediately know whether the move is confirmed across correlated assets.
Detect potential reversals via automated divergence markup (positive vs negative extremes in the same swing).
Core Logic
Cycle Engine
Computes cycle starts from a fixed reference (1972-12-31 23:00 GMT+3, adjustable via the Time Offset input).
Draws one of nine cycle layers depending on the active chart resolution:
Time-frame Cycle(s) Rendered Box Style
5 min / 15 min 90 min & 6 h 90 m boxes: filled, 6 h boxes: border only
60 min 6 h & 1 day 6 h boxes: filled, 1 D boxes: border
4 h 1 day & 1 week 1 D boxes: filled, 1 W boxes: border
1 D 22.5 day (quarter inside a 90-day period) border
1 W 3-month, 1-year 3 M filled, 1 Y border
Color Scheme
Four-color palette (gray → red → green → blue) cycles every quarter; colors are reused consistently across all layers so you can correlate quickly.
Dynamic Boxes
Each box expands in real-time until the cycle completes, then freezes; a limited history (maxCycleBoxes, default = 250) is retained to save CPU.
SSMT Divergence Scanner
For every completed cycle the script compares new highs/lows with the previous cycle for (a) the main chart symbol and (b) up to three optional symbols.
If the main asset makes a higher high and at least one satellite asset makes a lower high (or vice-versa), the indicator draws:
A solid line between the two swing extremes.
A circle label with a tooltip listing the diverging asset symbols.
Works independently on the 90 m, 6 h, 1 D, and 1 W cycle layers.
Toggle historic marks with Show History to avoid clutter.
Inputs Overview
Group Key Settings Function
Time Settings Time Offset Shift all cycle anchors by ±12 h in 1-h steps to sync with custom sessions.
Cycle Settings Show Quarter Cycles, Box Limit, Line Style, Line / BG Transparency, Label Font & Colors Visual customization.
SSMT Settings Up to 3 correlated assets (Asset 2 / 3 / 4) with optional inversion; Show History, Markup Line Width, Label Size Controls divergence detection.
Practical Tips
Lower time-frames (<15 m) are ideal for intraday scalping around 90-minute and 6-hour boxes.
1 D / 1 W layers expose where the current swing sits inside monthly or quarterly structure—useful for swing entries at box extremes.
Combine the label tooltips with your watch-list: when GBPUSD is listed as an opposite asset to EURUSD, watch for mean-reversion setups.
Setting Time Offset = -5 hours aligns the 90-minute cycle start with New-York midnight (useful for FX traders).
Disclaimer
This script is provided for educational purposes only and does not constitute financial advice. Past cyclical behavior does not guarantee future performance. Always test on a demo account or in TradingView’s replay mode before risking capital.

Hosoda Time Cycles (Forward + Backward)Hosoda Time Cycles
Market Timing Projection Tool
The Hosoda Time Cycles indicator is inspired by the legendary Japanese trader Ichimoku Hosoda, who emphasized the power of time in forecasting market behavior. This tool visualizes forward and backward time cycles based on significant price pivots, enabling traders to anticipate potential trend shifts, consolidations, or continuations with high precision.
Key Features:
Forward & Backward Cycles: Projects future and past time intervals based on selected pivots to reveal cyclical patterns.
Manual & Auto Pivot Selection: Choose between automatic detection or manually selected swing highs/lows.
Cycle Ratios: Includes traditional Hosoda counts such as 9, 17, 26, 33, 42, and 65 — key numbers in Ichimoku time theory.
Multi-Timeframe Utility: Effective across intraday, swing, and long-term charts.
Minimalist Overlay: Clean design to avoid clutter while providing powerful cycle insights.
Customizable Visuals: Adjustable line styles, colors, and cycle projection lengths for clarity and personalization.
Ideal For:
Traders focused on time-based confluence, cycle forecasting, and market rhythm detection, especially those who blend price action with Japanese trading techniques.

Bitcoin: Price projection from previous cycles onto 2024 cycleAn indicator for displaying the BITFINEX:BTCUSD price movement pattern from previous cycles onto the 2024–2025 cycle.
Best checked on Bitfinex or the “Brave New Coin – Bitcoin Liquid Index” (though that one has gone offline).
Next time it should be done with embedded constants rather than by copying candles from previous cycles.
Publishing to share the idea.

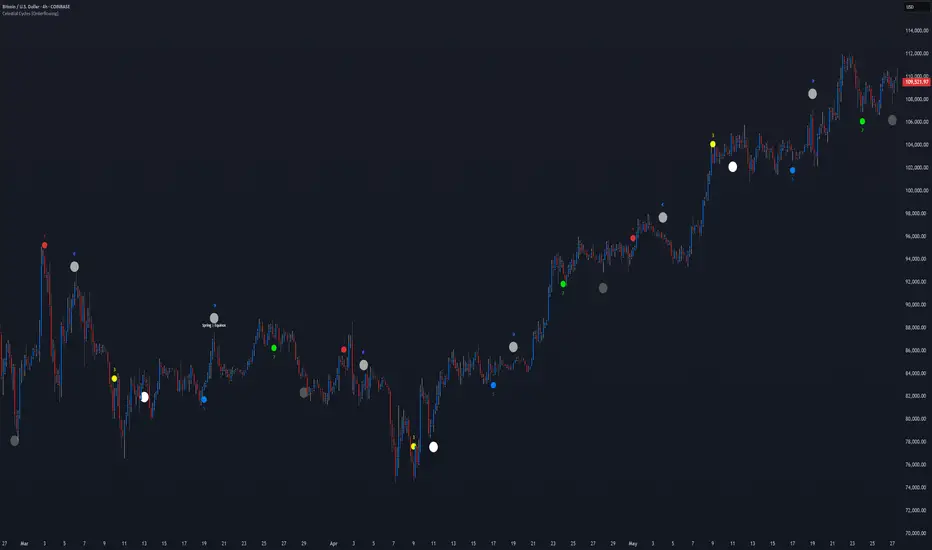
Celestial Cycles [Orderflowing]Astronomical Calculations | Moon Phases | Lunar Cycles & Rare Events | Solar Eclipses & Seasonal Markers | Mercury Retrograde Analysis | Momentum-Based Trend Coloration | Moon Information Table | Customizable Alerts
Built using Pine Script V6
Introduction
The Celestial Cycles indicator is a simple yet complex script that merges the timeless influence of astronomical events with modern technical analysis. By plotting key celestial phenomena, such as moon phases, seasonal markers, and Mercury retrograde periods onto your price chart, this indicator offers traders a fresh perspective on market cycles.
If you like financial astrology or seeking a creative edge, it provides a visually intuitive way to explore potential correlations between celestial events and market behavior.
This indicator is ideal for traders of all experience levels looking to integrate the celestial cycle into their strategies, complementing traditional technical tools with a unique layer of analysis.
Innovation and Inspiration
Inspired by financial astrology. The notion that celestial events, like moon phases or planetary retrogrades, might influence human psychology and market dynamics has intrigued traders for a long time. "Millionaires don’t use astrology, billionaires do." (allegedly): ~J.P. Morgan
This indicator modernizes that concept with astronomical calculations, plotting these events on your chart.
Core Features
Moon Phases: Displays new moons, full moons, and quarter moons, with optional micro phases (1/8, 3/8, 5/8, 7/8) for detailed analysis.
Special Moons: Highlights rare events like blood moons (lunar eclipses) and blue moons with distinct markers.
Solar Eclipses: Marks solar eclipses during new moon phases when enabled.
Seasonal Events: Plots "Spring | Equinox," "Summer | Solstice," "Autumn | Equinox," and "Winter | Solstice" for cyclical context.
Mercury Retrograde: Visualizes current and future Mercury retrograde periods with background highlights and labels.
Trend Coloration: Colors price bars based on momentum to aid trend visualization (optional).
Information Table: Shows real-time moon age and phase details in a table.
Customizable Alerts: Set up alerts for moon phases, special moon events, seasonal events, and Mercury retrograde transitions to stay informed about key celestial occurrences.
Customization and User Inputs
Celestial Cycles is customizable, allowing you to adjust it to your liking:
Event Toggles: Show or hide specific events (e.g., moon phases, special moons, eclipses, seasonal events, Mercury retrograde).
Visual Adjustments: Set colors and positions (above or below bars) for each event type.
Phase Timing: Fine-tune moon phase detection with hour-based adjustments for precision.
Trend Settings: Enable/disable trend coloration and adjust the momentum calculation period.
Mercury Retrograde Options: Display current retrogrades and up to 10 future periods, with customizable visibility.
Alert Settings: Enable or disable alerts for specific celestial events, including moon phases, special moons, seasonal events, and Mercury retrograde starts and ends.
These options ensure a clean, focused chart highlighting only the elements most relevant to your analysis.
How It Works
The indicator leverages code to show celestial events:
Moon Phases: Calculated using Julian dates and ecliptic coordinates to determine moon age and phase transitions.
Special Events: Detects eclipses and rare moons by analyzing lunar and solar positions relative to the ecliptic plane.
Seasonal Markers: Identifies "Spring | Equinox," "Summer | Solstice," "Autumn | Equinox," and "Winter | Solstice".
Mercury Retrograde: Approximates retrograde cycles and projects future periods based on a simplified orbital model.
Trend Coloration: Applies a momentum oscillator to color bars, reflecting potential bullish or bearish trend.
Analysis and Interpretation
Traders can use Celestial Cycles to explore intriguing market hypotheses:
Moon Phases: New and full moons may align with volatility spikes or trend reversals.
Eclipses: Eclipses might signal significant market shifts.
Seasonal Events: Equinoxes and solstices could highlight cyclical turning points.
Mercury Retrograde: Periods of potential disruption or reversal, often linked to communication and technology challenges.
Trend Coloration: Visual cues to confirm potential momentum alongside celestial events.
Usage and Applications
Long-Term Trends: High Timeframe (HTF) charts to study celestial impacts on major cycles.
Short-Term Trends: Apply to intraday timeframes (LTF) for event correlations.
Confluence: Pair with technical indicators for stronger signals.
Research: Backtest historical data to uncover patterns specific to your chosen market. Use the adjustment periods to fine-tune.
Why Use This Indicator?
Unique Perspective: Combines celestial and technical analysis.
Free Access: Enjoy a premium script with lots of features at no cost.
Customization: Personalize every aspect to suit your preferences.
Educational: Learn about astronomical cycles.
Stay Informed: Set up customizable alerts to receive event notifications.
Conclusion
Celestial Cycles is an exploration of how the cosmos might intersect with the markets. By overlaying key astronomical events on your chart and offering alerts, it invites you to see trading through a new lens. While not a crystal ball, it’s a compelling addition to a trader’s toolkit.
Disclaimer: This indicator is for informational, educational and analytical purposes only. Celestial correlations are speculative and should not be the sole basis for trading decisions. Always combine with other analysis methods and manage risk appropriately.
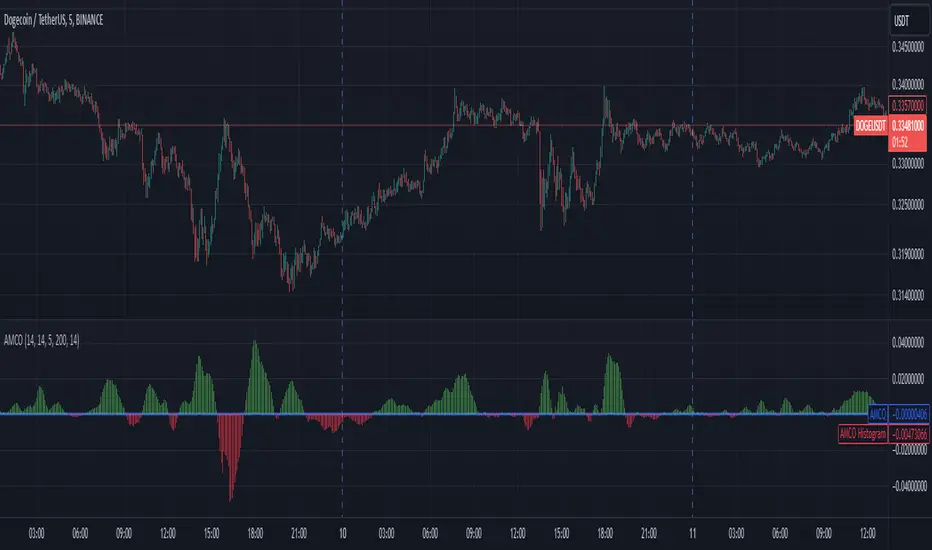
Adaptive Momentum Cycle Oscillator (AMCO)1. Concept and Foundation
The Adaptive Momentum Cycle Oscillator (AMCO) is an advanced indicator designed to dynamically adjust to varying market conditions while identifying price cycles and trends. It combines momentum and volatility into a single, oscillating signal that helps traders detect turning points in price movements. By incorporating adaptive periods and trend filtering, AMCO ensures relevance across different asset classes and timeframes. This innovation bridges the gap between traditional oscillators and trending indicators, providing a comprehensive tool for both cycle identification and trend confirmation.
2. Dynamic Adaptation to Market Conditions
A standout feature of AMCO is its ability to adapt its sensitivity based on market volatility. Using the ATR (Average True Range) as a measure of current volatility, AMCO adjusts its calculation periods dynamically. During periods of high volatility, it extends its lookback periods to smooth out noise and avoid false signals. Conversely, in low-volatility environments, it shortens its periods to remain responsive to smaller price fluctuations. This adaptability ensures that AMCO remains effective and reliable in both trending and ranging markets.
3. Trend Awareness and Directional Weighting
AMCO integrates a trend filter based on a long-term moving average, such as SMA(200), to align its signals with the broader market direction. This filter ensures that buy signals are prioritized during uptrends and sell signals during downtrends, reducing counter-trend trades. Additionally, a directional weighting mechanism amplifies momentum signals that align with the prevailing trend. This dual-layer approach significantly enhances the accuracy of signals, making AMCO especially useful in markets with clear directional bias.
4. Normalized Visualization for Clarity
The AMCO includes a normalized histogram that provides a clear visual representation of momentum strength relative to recent volatility. By dividing the raw AMCO value by the ATR, the histogram ensures consistency across assets with varying price ranges and volatility levels. Positive bars indicate bullish momentum, while negative bars signify bearish momentum. This intuitive visualization makes it easier for traders to interpret market dynamics and act on actionable signals, regardless of asset type or timeframe.
5. Practical and Actionable Signals
AMCO generates practical signals based on zero-line crossovers, allowing traders to easily identify shifts between bullish and bearish cycles. Positive values above the zero line suggest upward momentum, signaling potential buying opportunities, while negative values below the zero line indicate downward momentum, signaling potential sell opportunities. By combining adaptive behavior, trend filtering, and momentum-strength normalization, AMCO offers traders a robust framework for navigating complex markets with confidence. Its versatility makes it suitable for scalping, swing trading, and even longer-term investing.
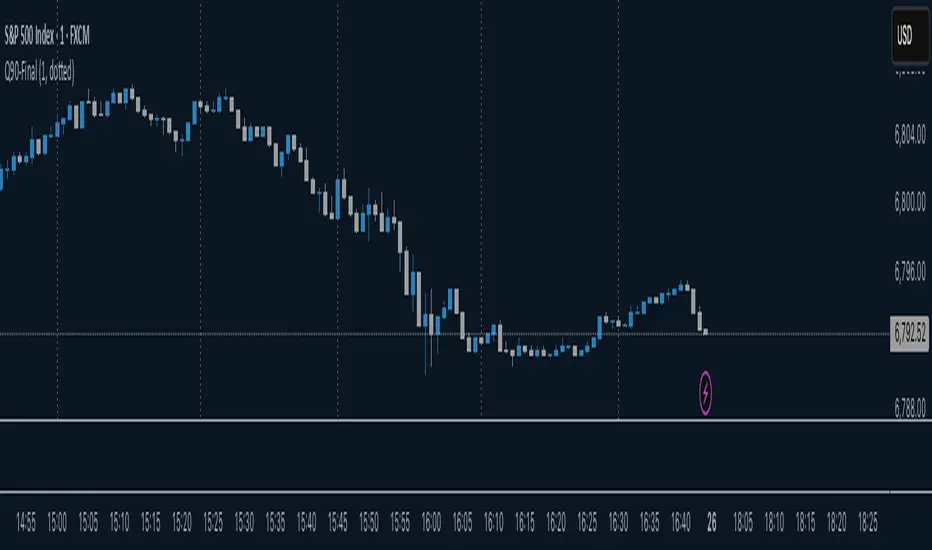
Micro cycle0-Minute Quarter Cycle Indicator (Q90-Final)
This indicator plots vertical lines marking the four quarters (Q1,Q2,Q3,Q4) of a continuous 90-minute cycle.
It is designed for traders who utilize time-based cycles for market analysis and entry/exit timing.
So you can easy identify the cycles off the micro cycles Q1,Q2,Q3 and Q4
Time CyclesUses Zeussy's time and price cycles. This shows the Asia and London sessions, and has the PM session broken into 90 minute cycles with the option of toggling 30m cycles within them.

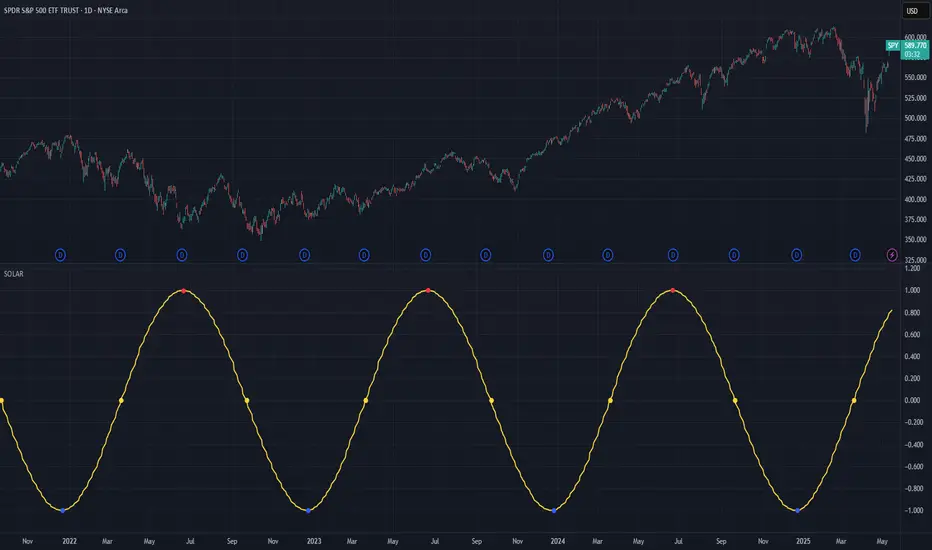
Solar Cycle (SOLAR)SOLAR: SOLAR CYCLE
🔍 OVERVIEW AND PURPOSE
The Solar Cycle indicator is an astronomical calculator that provides precise values representing the seasonal position of the Sun throughout the year. This indicator maps the Sun's position in the ecliptic to a normalized value ranging from -1.0 (winter solstice) through 0.0 (equinoxes) to +1.0 (summer solstice), creating a continuous cycle that represents the seasonal progression throughout the year.
The implementation uses high-precision astronomical formulas that include orbital elements and perturbation terms to accurately calculate the Sun's position. By converting chart timestamps to Julian dates and applying standard astronomical algorithms, this indicator achieves significantly greater accuracy than simplified seasonal approximations. This makes it valuable for traders exploring seasonal patterns, agricultural commodities trading, and natural cycle-based trading strategies.
🧩 CORE CONCEPTS
Seasonal cycle integration: Maps the annual solar cycle (365.242 days) to a continuous wave
Continuous phase representation: Provides a normalized -1.0 to +1.0 value
Astronomical precision: Uses perturbation terms and high-precision constants for accurate solar position
Key points detection: Identifies solstices (±1.0) and equinoxes (0.0) automatically
The Solar Cycle indicator differs from traditional seasonal analysis tools by incorporating precise astronomical calculations rather than using simple calendar-based approximations. This approach allows traders to identify exact seasonal turning points and transitions with high accuracy.
⚙️ COMMON SETTINGS AND PARAMETERS
Pro Tip: While the indicator itself doesn't have adjustable parameters, it's most effective when used on higher timeframes (daily or weekly charts) to visualize seasonal patterns. Consider combining it with commodity price data to analyze seasonal correlations.
🧮 CALCULATION AND MATHEMATICAL FOUNDATION
Simplified explanation:
The Solar Cycle indicator calculates the Sun's ecliptic longitude and transforms it into a sine wave that peaks at the summer solstice and troughs at the winter solstice, with equinoxes at the zero crossings.
Technical formula:
Convert chart timestamp to Julian Date:
JD = (time / 86400000.0) + 2440587.5
Calculate Time T in Julian centuries since J2000.0:
T = (JD - 2451545.0) / 36525.0
Calculate the Sun's mean longitude (L0) and mean anomaly (M), including perturbation terms:
L0 = (280.46646 + 36000.76983T + 0.0003032T²) % 360
M = (357.52911 + 35999.05029T - 0.0001537T² - 0.00000025T³) % 360
Calculate the equation of center (C):
C = (1.914602 - 0.004817T - 0.000014*T²)sin(M) +
(0.019993 - 0.000101T)sin(2M) +
0.000289sin(3M)
Calculate the Sun's true longitude and convert to seasonal value:
λ = L0 + C
seasonal = sin(λ)
🔍 Technical Note: The implementation includes terms for the equation of center to account for the Earth's elliptical orbit. This provides more accurate timing of solstices and equinoxes compared to simple harmonic approximations.
📈 INTERPRETATION DETAILS
The Solar Cycle indicator provides several analytical perspectives:
Summer Solstice (+1.0): Maximum solar elevation, longest day
Winter Solstice (-1.0): Minimum solar elevation, shortest day
Vernal Equinox (0.0 crossing up): Day and night equal length, spring begins
Autumnal Equinox (0.0 crossing down): Day and night equal length, autumn begins
Transition rates: Steepest near equinoxes, flattest near solstices
Cycle alignment: Market cycles that align with seasonal patterns may show stronger trends
Confirmation points: Solstices and equinoxes often mark important seasonal turning points
⚠️ LIMITATIONS AND CONSIDERATIONS
Geographic relevance: Solar cycle timing is most relevant for temperate latitudes
Market specificity: Seasonal effects vary significantly across different markets
Timeframe compatibility: Most effective for longer-term analysis (weekly/monthly)
Complementary tool: Should be used alongside price action and other indicators
Lead/lag effects: Market reactions to seasonal changes may precede or follow astronomical events
Statistical significance: Seasonal patterns should be verified across multiple years
Global markets: Consider opposite seasonality in Southern Hemisphere markets
📚 REFERENCES
Meeus, J. (1998). Astronomical Algorithms (2nd ed.). Willmann-Bell.
Hirshleifer, D., & Shumway, T. (2003). Good day sunshine: Stock returns and the weather. Journal of Finance, 58(3), 1009-1032.
Hong, H., & Yu, J. (2009). Gone fishin': Seasonality in trading activity and asset prices. Journal of Financial Markets, 12(4), 672-702.
Bouman, S., & Jacobsen, B. (2002). The Halloween indicator, 'Sell in May and go away': Another puzzle. American Economic Review, 92(5), 1618-1635.
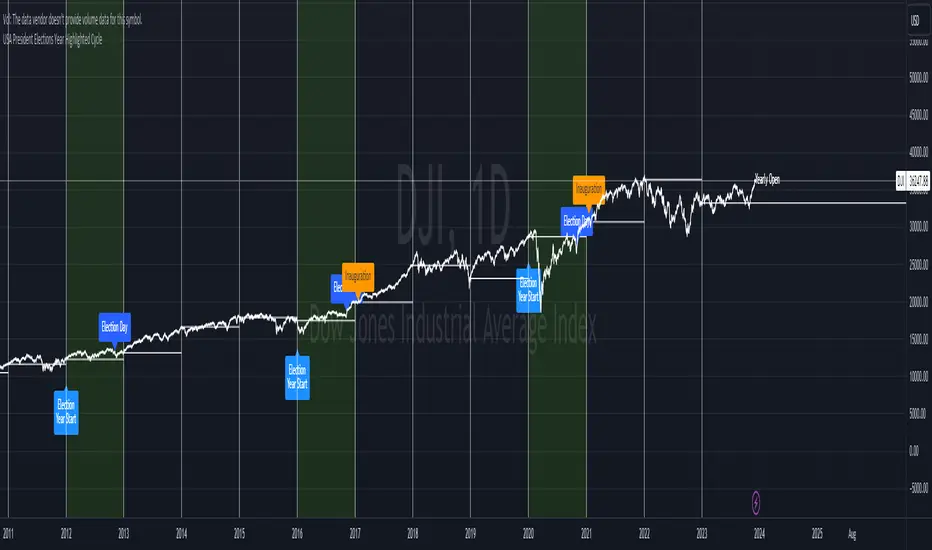
USA President Elections Year Highlighted CycleUSA President year highlighted , years separated by white vertical lines, horizontal white line is yearly open. Can be used to analyze yearly performance related to 4 year cycle.
Time Cycles_FAHelps identify cycles for all types of scripts. Use it cautiously to identify next trends.

(VIX Spread-BTC Cycle Timing Strategy)A multi-asset cycle timing strategy that constructs a 0-100 oscillator using the absolute 10Y-2Y U.S. Treasury yield spread multiplied by the inverse of VIX squared. It integrates BTC’s deviation from its 100-day MA and 10Y Treasury’s MA position as dual filters, with clear entry rules: enter bond markets when the oscillator exceeds 80 (hiking cycles) and enter BTC when it drops below 20 (easing cycles).
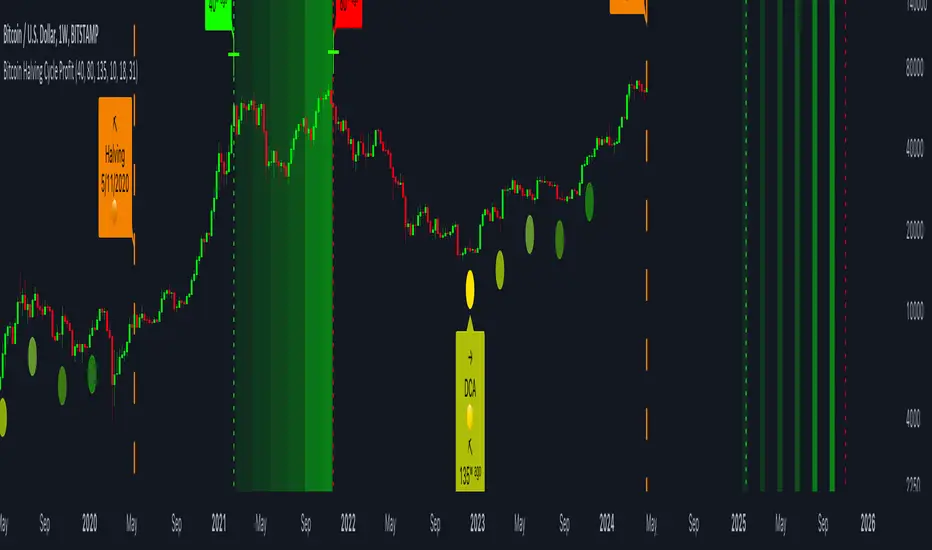
Bitcoin Halving Cycle ProfitThe Bitcoin Halving Cycle Profit indicator, developed by Kevin Svenson , unveils a consistent and predetermined profit-taking cycle triggered by each Bitcoin halving event. This indicator streamlines the analysis of halving occurrences, providing explicit signals for both profit-taking and Dollar-Cost Averaging strategies.
Following each Bitcoin halving event, a fixed number of weeks consistently mark the period of maximum profitability for profit-taking:
🔄 Halving Cycle Profit Timeline Explained:
• 40 Weeks (Post-Halving) = Start of the optimal profit-taking zone.
• 80 Weeks (Post-Halving) = "Last Call" for profit-taking before the onset of a bear market.
• 125 Weeks (Post-Halving) = The optimal timeframe to begin Dollar-Cost Averaging.
(Bitcoin Weekly Chart using Halving Cycle Profit)
One standout feature of this indicator is its inherent clarity and comprehensive labeling. This quality makes it exceptionally easy to discern the locations of key factors and turning points, enhancing your understanding of the market dynamics it highlights.
(Bitcoin Daily Chart using Halving Cycle Profit)
🚀 This indicator doesn't limit its effectiveness to just Bitcoin; it seamlessly integrates with top blue-chip altcoins like Ethereum and most household names in the crypto industry.
( Ethereum Weekly Chart using Halving Cycle Profit)
🛠️ Customizable display options are availible. Users have the flexibility to toggle/adjust labels, lines, and color fills according to their preferences.
📑 In summary, the Bitcoin Halving Cycle Profit indicator is a versatile and user-friendly tool, offering clarity and customization for traders navigating both Bitcoin and top altcoins.
⚠️ It's important to note that while the Bitcoin Halving Cycle Profit indicator provides historical insights, past performance does not guarantee future results. Timing profitability in the cryptocurrency market involves inherent risks, and this indicator should not be construed as financial advice. Users are encouraged to exercise caution, conduct thorough research, and make informed decisions based on their individual risk tolerance and financial goals.
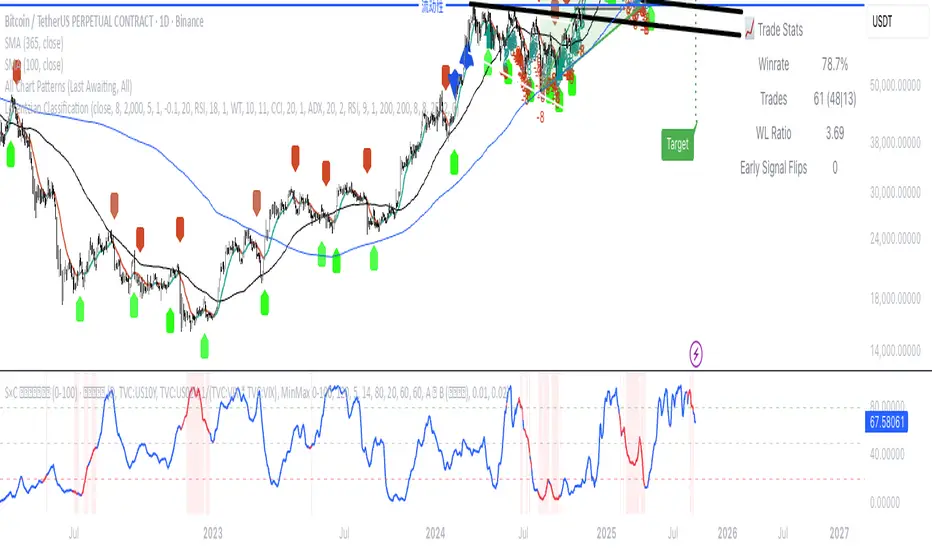
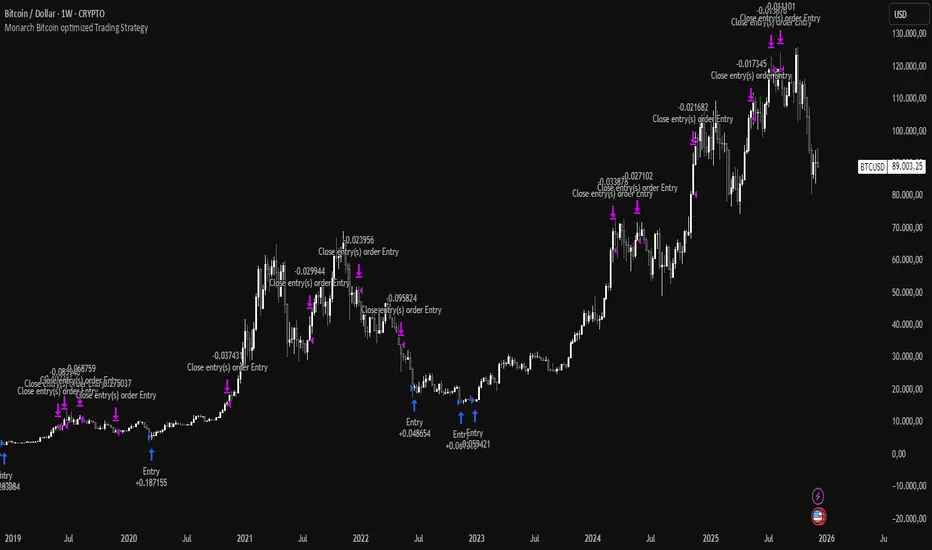
Monarch Strategies BTC Optimized Cycle & Trend Strategy (1W)The "BTC Optimized Cycle & Trend Strategy (1W)" is a high-quality, long-term optimized trading strategy for BTC/USD, designed for traders and investors who want to systematically trade major market cycles — without overtrading, without emotions, and without unnecessary complexity.
The strategy is specifically built for the weekly timeframe (1W) and focuses on what Bitcoin has historically done best: strong, multi-year trend movements.
Z-Scored Pi Cycle Top & BottomThis indicator calculates the Z-score of the Pi Cycle Top & Bottom indicator to identify potential market cycle tops and bottoms. It uses the relationship between two EMAs (111 and 350) to assess the price action and applies a Z-score to determine how far the current value deviates from the mean, providing a normalized measure of overbought and oversold conditions.
Summary:
The Z-Scored Pi Cycle Top & Bottom indicator is designed to help traders identify significant market cycle extremes by applying a Z-score to the Pi Cycle Top & Bottom ratio (EMA 111/EMA 350). This normalized score ranges between -2.99 and 2.99, with values near the extremes suggesting potential market tops or bottoms. Green shading indicates a positive Z-score (potential top), while red shading indicates a negative Z-score (potential bottom).
Use this indicator to gauge where the market stands relative to historical tops and bottoms, allowing for more informed decision-making in both bull and bear markets. The indicator also displays the absolute value of the Z-score in the label, helping traders easily visualize how far the current market is from historical extremes.
**I did not come up with or create this indicator I have just z scored it and made it easier for myself to use.***

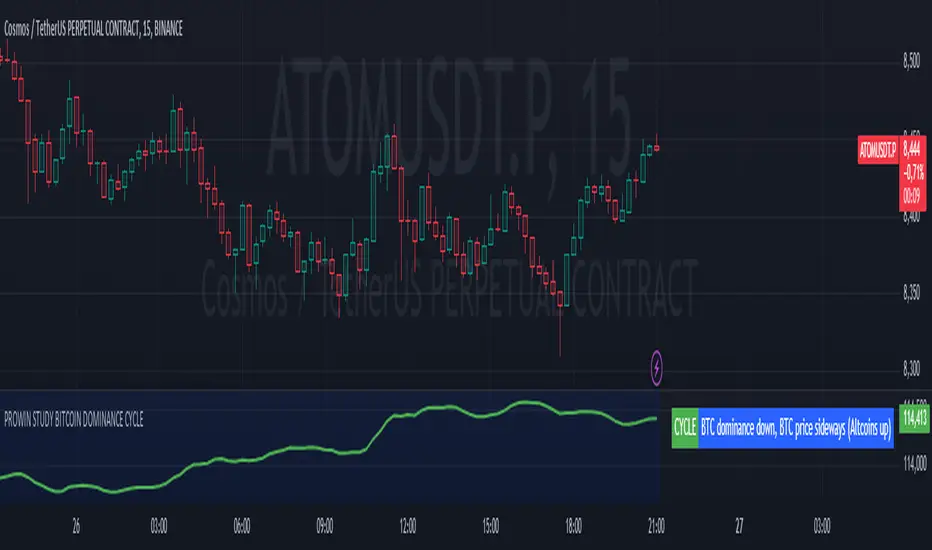
PROWIN STUDY BITCOIN DOMINANCE CYCLE**Title: PROWIN STUDY BITCOIN DOMINANCE CYCLE**
**Overview:**
This TradingView script analyzes the relationship between Bitcoin dominance and Bitcoin price movements, as well as the performance of altcoins. It categorizes market conditions into different scenarios based on the movements of Bitcoin dominance and Bitcoin price, and plots the Exponential Moving Average (EMA) of the altcoins index.
**Key Components:**
1. **Bitcoin Dominance:**
- `dominanceBTC`: Fetches the Bitcoin dominance from the "CRYPTOCAP:BTC.D" symbol for the current timeframe.
2. **Bitcoin Price:**
- `priceBTC`: Uses the closing price of Bitcoin from the current chart (assumed to be BTC/USD).
3. **Altcoins Index:**
- `altcoinsIndex`: Fetches the total market cap of altcoins (excluding Bitcoin) from the "CRYPTOCAP:TOTAL2" symbol.
4. **EMA of Altcoins:**
- `emaAltcoins`: Calculates the 20-period Exponential Moving Average (EMA) of the altcoins index.
**Conditions:**
1. **Bitcoin Dominance and Price Up:**
- `dominanceBTC_up`: Bitcoin dominance crosses above its 20-period Simple Moving Average (SMA).
- `priceBTC_up`: Bitcoin price crosses above its 20-period SMA.
2. **Bitcoin Dominance Up and Price Down:**
- `priceBTC_down`: Bitcoin price crosses below its 20-period SMA.
3. **Bitcoin Dominance Up and Price Sideways:**
- `priceBTC_lateral`: Bitcoin price change is less than 5% of its 10-period average change.
4. **Altseason:**
- `altseason_condition`: Bitcoin dominance crosses below its 20-period SMA while Bitcoin price crosses above its 20-period SMA.
5. **Dump:**
- `dump_altcoins_condition`: Bitcoin dominance crosses below its 20-period SMA while Bitcoin price crosses below its 20-period SMA.
6. **Altcoins Up:**
- `altcoins_up_condition`: Bitcoin dominance crosses below its 20-period SMA while Bitcoin price moves sideways.
**Current Condition:**
- Determines the current market condition based on the above scenarios and stores it in the `currentCondition` variable.
**Plotting:**
- Plots the EMA of the altcoins index on the chart in green with a linewidth of 2.
- Displays the current market condition in a table at the top-right of the chart, with appropriate background and text colors.
**Background Color:**
- Sets a semi-transparent blue background color for the chart.
This script helps traders visualize and understand the market dynamics between Bitcoin dominance, Bitcoin price, and altcoin performance, providing insights into different market cycles and potential trading opportunities.
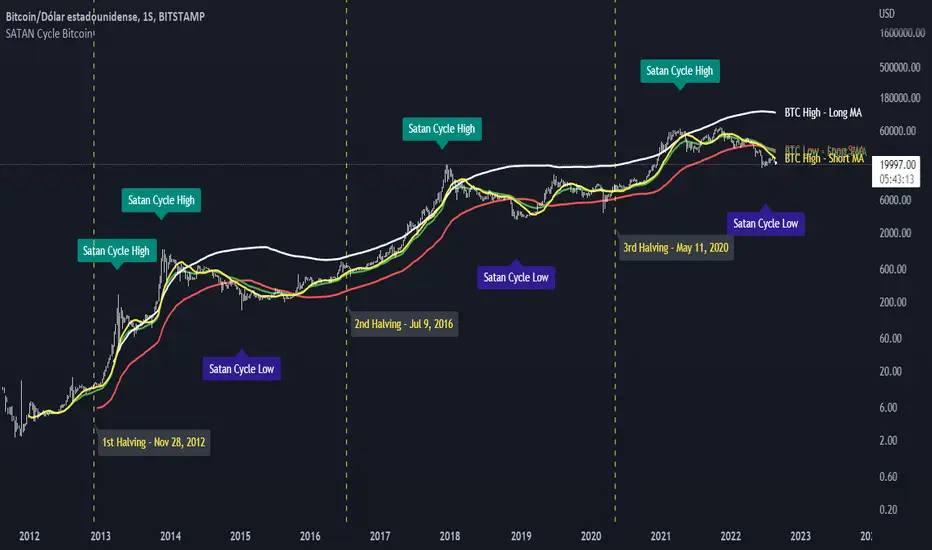
SATAN Cycle BitcoinWith this indicator I want to dismantle the Pi Cycle Bitcoin indicator since the community thinks that it has a mathematical basis based on the Pi number, nothing is further from reality, the indicator uses averages which, divided, result in the Pi number but in the code uses some multipliers to adjust the crossing of averages and I demonstrate it with this indicator in which if you add the averages you get the number 666, is the demon behind the Bitcoin cycles? NO, it is only an adjustment of averages and multipliers. With this I only intend to alert the community that the indicator is 0% reliable.
Cosmic Pi Troll CycleBased on the Cosmic Pi cycle for BTC, but this indicator also includes the cycles for ETH and LINK.
All credits to cosmic_indicators for the initial idea.

CyclesThis is a modified Stochastic indicator. Modifications include:
1. The output is now centered on "0" and the scale is from -50 to +50, so that histograms and columns can be used to plot the output.
2. Added visual trade setup triggers. A trigger to the up side is a cycle high and indicates a "sell signal". A trigger to the down side is a cycle low and indicates a "buy" signal.
3. Added an alert trigger to be used to setup alerts. Selecting "Alert" to be Greater Than (>) Value = 0.00 will trigger an alert if either the buy or sell triggers occur.
4. Added a force indicator output. This indicates the rate of change in "D", or mathematically "dD/dt", as was done in the Power Analyzer indicator. When Force and D are in-phase, the maximum power is achieved.
5. Added "Slow Average Momentum" and "Slow Average Force" as was done in the Power Analyzer indicator.
6. Added an internal MACD and EMA as part of the trade setup trigger equation. There is a new input variable for the EMA length.
7. Added an input variable for the "Trigger Threshold", which ranges from -50 to 50, to be used as a screening filter.

Time Cycle linesTime cycles are recurring patterns or intervals in which market movements tend to repeat. Traders use them to identify potential turning points in price action. By analyzing historical highs, lows, and key time intervals, time cycles help forecast future market behavior and improve timing for entries and exits.

Periodic CycleAllows visualizing a periodic cycle based on startdate, cycle period and part of cycle to be highlighed.
