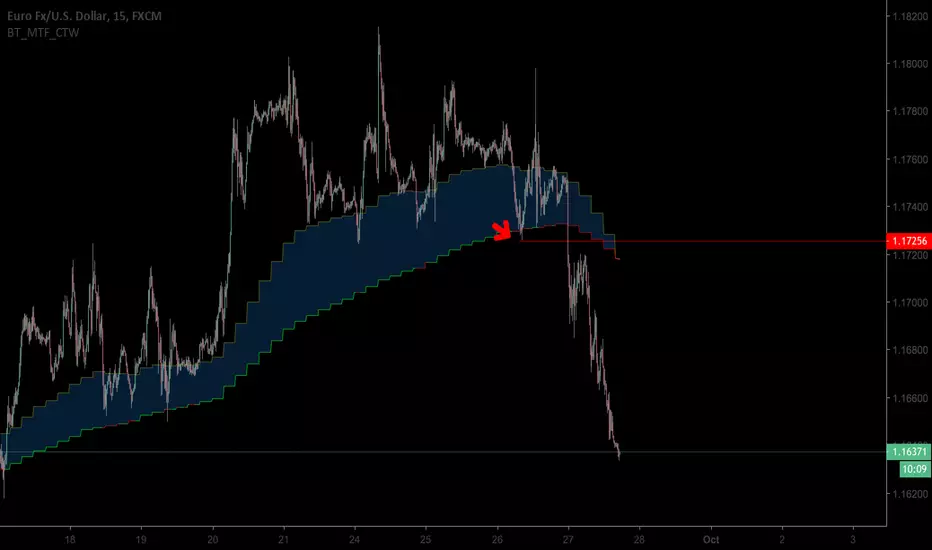
BullTrading MTF Chaos Trend WaveRecently I have received very positive private messages about the "BullTrading MTF Chaos Trend Wave"
So I decided to add Multi Time Frame capabilities. For example, for intraday trading (15') you can use the 240´timeframe as a reference for choosing your technical bias.
If you are not familiar with the previous version BullTrading Chaos Trend Wave is used to trade fractal breakouts like the "Alligator"
The difference is that it combines smoothed and reactive algorithms to plot nice moving averages for trend recognition but at the same time filtering the most significant fractals for reversal levels.
Note: Modifying the standard settings except for the timeframe resolution is not recommended
Tìm kiếm tập lệnh với "Fractal"
FILBFILBv3- Components:
1)
EMA 8 moves above 24: Candles Flip Green
EMA 8 moves Below 24: Candles Flip Pink
2)
Bull Div - Blue Candle
Bear Div - Red Candle
(On Mac D)
3)
Williams Fractals
Was designed on the 6 Hour Chart.
- Settings need to be adjusted:
Deslect the normal candles by right clicking the chart description in the top left and select "hide"
Hide the EMAs (i sometimes show the EMA 24) in the FILBFILB settings
Select the wick colour to grey in the FILBFILB settings
The Way i use this to:
- Use Stops based on Fractal points
- Enter Trades Long when flip Green Bear when flip Pink
- Hedge on Red Candles when in bull trend, unhedge when Blue (vica - versa in bear trend)

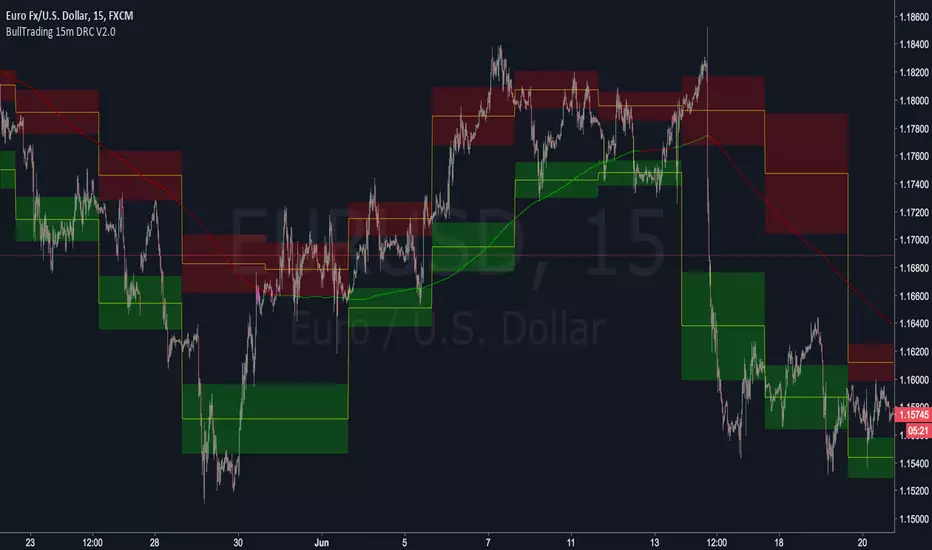
BullTrading 15 Min Daily Retracement Channel V2.0Hi Traders, I have been received tons of private messages asking me access to my previous scripts. Please let me apologize for not being able to answer all messages. Once you publish a script in Tradingview you can manage individual access to the script but there is no option to open the script after being published.
For that reason I decided to open this script for you, this indicator implements many of the best features contained in previous "invite only scripts". It is designed to display alerts for day trading and short term swings using the 15m Timeframe.
How to use "BullTrading 15 Min Daily Retracement Channel V2.0" indicator?
This indicator is experimental but works if the trader applies good judgment and risk management. Neither myself or BullTrading Asset Management is or will be responsible for any live trading loss using this script, so please use it on Demo.
ALWAYS USE PENDING ORDERS!! It is always much better to wait price using your Fibonacci Retracement tool or the indicator reference lines.
Set Buy signals AT THE CLOSE of yellow candlesticks.
Set Sell signals AT THE CLOSE of fuchsia candlesticks.
Most of the time Buy/Sell signals will react with too much anticipation so you can wait for the price to form enough fractals in order to analyze your entry levels, risk management, SL's and TP's.
AVOID AT ALL COSTS to enter the market immediately after a signal. WAIT for fractal formations to confirm reversals. I will say it AGAIN: Use only pending orders and AVOID market execution orders!
If your order is already filled and the moving average changes color or the price consolidates in your entry level it is better to trail tight your SL, exit the trade with small loss or Break Even instead of waiting for a full Stop Loss exit (this conditions usually indicate trend continuations against the indicator signals).
If the market goes against the signal, THINK and use the indicator lines and channels to match a level using your Fib retracement tool. Applying this criteria will lead for better entry levels in the opposite direction.
Feel free to comment suggestions.
Best Regards
GustavoRubi
Phantom Trend IndicatorOverview
The Phantom Trend Indicator (PTI) is a streamlined tool for identifying trend direction and strength. It blends zigzag-based trend detection with a volume profile to display a histogram showing price distance from the Point of Control (POC). Six distinct colors highlight trend states, with background highlights for extreme price zones. Ideal for stocks, forex, crypto, and futures across any timeframe.
Features:
Trend Detection: Uses zigzag fractals to identify uptrends and downtrends.
Histogram Colors: Six colors for trend strength (low, high, extreme for up/down trends) or neutral (gray).
Dynamic Levels: Plots POC, Value Area Low (VAL), and High (VAH) via volume profile.
Background Colors: Highlights overbought (above VAH) or oversold (below VAL) zones.
Alerts: Signals new trends.
How It Works:
Trends: Zigzag fractals define trend ranges, with price position setting histogram colors (low, high, or extreme).
Histogram: Shows price deviation from POC.
Background: Colors extreme zones outside VAL/VAH.
This indicator builds on traditional trend detectors and volume profiles by integrating them into a single, cohesive tool. Unlike standard momentum indicators that rely on moving averages, PTI uses zigzag fractals for more responsive trend identification, reducing lag in volatile markets. Compared to basic volume profile scripts, it adds trend-based color coding and background alerts for extremes, providing clearer visual cues for overbought/oversold conditions. The six distinct colors indicate trend strength, and customizable thresholds allow fine-tuning for different assets and timeframes, enhancing adaptability. Traders benefit from combined momentum and liquidity insights, helping spot reversals or continuations more reliably—making PTI a valuable, standalone addition for both novice and experienced users.
Settings
Trend Detector: Toggle alerts, adjust zigzag sensitivity, and set thresholds for low-to-high and extreme color transitions.
Dynamic Levels: Configure volume profile period, multiplier, accuracy, value area percent, and ATR-based channel width.
Visuals: Customize POC, VAL, VAH, and area fill colors.
Read Histogram: Uptrend colors show early, strong, or overextended moves; downtrend colors indicate early, weakening, or oversold conditions; gray for consolidation.
Background: Monitor for overbought/oversold color-coded signals.
Tune: Adjust zigzag or period settings for your timeframe/asset.
Tips
Shorten period for intraday, extend for swing trading.
Pair with other indicators for confirmation.
Notes:
Requires sufficient chart data for volume profile.
Test settings for low-volatility assets.
For informational use only, not financial advice. Test thoroughly, and happy trading!

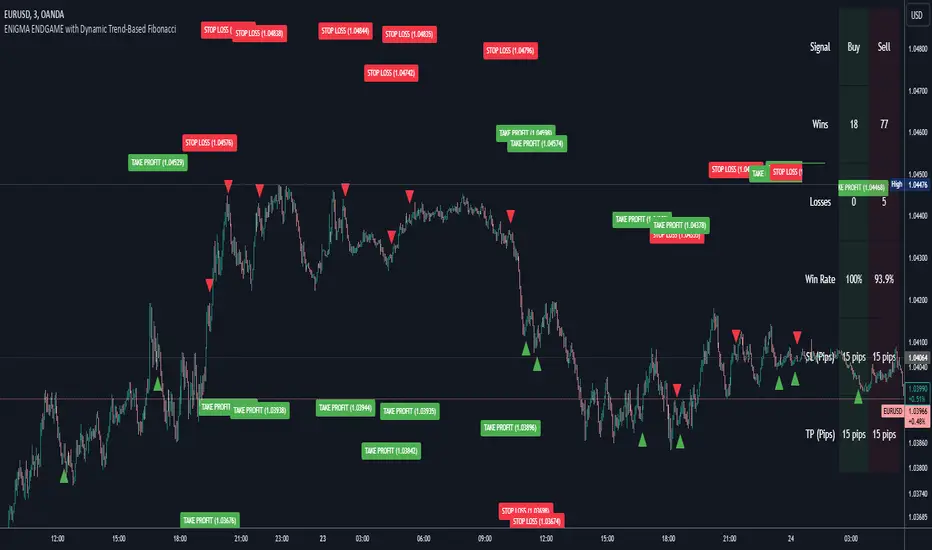
Enigma Endgame with Dynamic Trend-Based FibonacciThe Enigma Endgame script combines dynamic trend-based Fibonacci levels with the core principles of the ENIGMA strategy. It provides traders with actionable signals by identifying key levels of fractal support and resistance and highlighting opportunities to trade with market momentum. This tool is designed for multi-timeframe analysis and is especially effective during high-volatility sessions like London and New York.
Purpose and Usefulness
This script was developed to simplify complex market dynamics by integrating Fibonacci principles with ENIGMA's logic of fractal support and resistance. Traders can use it to:
- Identify key breakout and retracement levels dynamically.
- Understand the shift between support and resistance as price action evolves.
- Gain confidence in their entries with real-time signals derived from logical fractal behavior.
By merging Fibonacci levels with fractal-based trading insights, this script offers a unique and comprehensive approach to analyzing market structure.
How It Works
The script uses a dual approach to provide insights:
1. Dynamic Fibonacci Levels:
- Automatically plots Fibonacci retracement and extension levels based on recent high and low swings, adjusting dynamically to current market trends.
- Allows traders to visualize key levels where price might reverse or extend.
2. Fractal Support and Resistance Logic:
- The script identifies fractal support and resistance by analyzing candle formations.
- When a candle body closes below the low of a previous candle, the previous low, which was fractal support, now becomes fractal resistance. The script generates a bearish signal, encouraging traders to look for sell opportunities at or above the previous low.
- Conversely, when a candle body closes above the high of a previous candle, the previous high, which was fractal resistance, becomes fractal support. The script generates a bullish signal, encouraging traders to look for buy opportunities at or below the previous high.
Real-Time Signals
The script marks these transitions with arrows on the chart:
- Bearish arrows indicate broken fractal support turning into resistance.
- Bullish arrows** indicate broken fractal resistance turning into support.
These signals help traders stay aligned with the trend and trade with market momentum.
Key Features
1. Session-Based Analysis: Focuses on high-probability setups by allowing traders to customize session times, such as London or US sessions.
2. Multi-Timeframe Support: Works seamlessly across multiple timeframes for both scalpers and swing traders.
3. Real-Time Alerts: Sends customizable alerts when price interacts with critical Fibonacci levels or fractal support/resistance shifts.
How to Use the Script
1. Apply the script to a clean chart for clear visualization. Avoid combining it with other scripts unless necessary.
2. Use the arrows to identify shifts in fractal support and resistance and validate opportunities for buy/sell trades.
3. Monitor the dynamic Fibonacci levels to find confluence with key price areas.
4. Customize session times to focus on high-probability trading hours.
Key Notes for Traders
- This script provides insights based on logical market structure but should be used alongside proper risk management and trading plans.
- The fractal-based approach works well in conjunction with dynamic Fibonacci levels, helping traders build confidence in their strategy.
- Adapt the script settings to match your unique trading style and timeframe preferences.
By offering a seamless integration of fractal logic and Fibonacci principles, Enigma Endgame empowers traders with actionable insights to navigate markets effectively.
Market Structure [Truth Indie]Market Structure
Market structure is a crucial component of various trading methodologies. If you can accurately map the market structure, tailored to the volatility or assets you are trading, it helps you identify trends clearly and enhances the accuracy of your trading strategies.
This indicator facilitates easy and swift mapping of market structure for traders. The market structure in this indicator consists of 3 types:
1.Fractal structure
2.Internal structure
3.External structure
FRACTAL STRUCTURE MAPPING
-Wick breaks are sufficient for a Fractal break of structure.
-The precise moment when the price breaks a Fractal high or low confirms the break.
BULLISH & BEARISH FRACTAL STRUCTURE
Bullish Fractal Structure:
-A Fractal high is validated when the subsequent candle fails to surpass its high (fractal pullback).
-A Fractal higher low is validated once the price breaches the Fractal high (always identify the NEAREST Fractal low). This will be the most recent candle that was unable to exceed the high of the previous candle.
Bearish Fractal Structure:
-A Fractal low is validated when the following candle fails to break its low (fractal pullback).
-A Fractal lower high is validated once the price breaks the Fractal low (always identify the NEAREST Fractal high). This will be the most recent candle that was unable to surpass the low of the previous candle.
Settings
-Show or hide text and lines, including adjusting the color of text and lines.
-Adjust the size of text, and change the type of lines, including modifying text when there is a BoS and CHoCH.
-Mark swing when there is a valid pullback, adjust the size and color.
INTERNAL STRUCTURE MAPPING
Body breaks confirm an internal structure break.
BULLISH & BEARISH INTERNAL STRUCTURE
Bullish Internal Structure:
-An internal high is validated with 4 optional criteria.
-An internal higher low is validated when the internal high structure is broken. A higher low refers to the lowest price.
Bearish Internal Structure:
-An internal low is validated with 4 optional criteria.
-An internal lower high is validated when the internal high structure is broken. A lower high refers to the highest price.
Settings
-Show or hide text and lines, including adjusting the color of text and lines.
-Adjust the size of text, and change the type of lines, including modifying text when there is a BoS and CHoCH.
-Mark swing when there is a valid pullback, adjust the size and color.
Validation of pullback has 4 options for exploration, with the default value set to Fractal CHoCH 1 time:
1.Fractal CHoCH 1 time.
2.Fractal CHoCH and wait for Fractal BoS/Fractal CHoCH 3 times in a row.
3.PIP Rule, using PIP to determine the distance of a valid pullback.
-Show or hide lines and values. This option will only display results when you activate the PIP Rule. Change the style of lines and change the color of lines.
-In the PIP field, enter the PIP value you want to explore. In the 1 PIP Size field, enter the decimal places in the asset you are trading. For example, for the EUR/USD pair with decimals at position 4.
4.ATR Rule, utilizing ATR multiples to establish the range of a valid pullback.
-Show or hide lines and values. This option will only display results when you activate the ATR Rule. Change the style of lines and change the color of lines.
-ATR type allows you to choose from 5 ma types. ATR Period adjusts the backward-looking average value you want to explore. Multiple: Enter a multiplier value for ATR to match the volatility or asset you are trading.
If you choose only ATR Rule, the result is the validation of the pullback with ATR Rule only. If you choose more than 1 option, whichever condition is true, the validation pullback occurs immediately. If you don't choose anything, the default value is Internal CHoCH 1 time.
Swing internal structure
-Show or hide text and lines, including adjusting the color of text and lines.
-Adjust the size of text, and change the type of lines, including modifying text.
Equilibrium internal
-Show or hide text and lines, including adjusting the color of text and lines.
-Adjust the size of text, and change the type of lines, including modifying text.
-Adjust the percentage of Equilibrium.
EXTERNAL STRUCTURE MAPPING
Body breaks confirm an internal structure break.
BULLISH & BEARISH EXTERNAL STRUCTURE
Bullish external Structure:
-An external high is validated with 4 optional criteria.
-An external higher low is validated when the external high structure is broken. A higher low refers to the lowest price.
Bearish external Structure:
-An external low is validated with 4 optional criteria.
-An external lower high is validated when the external high structure is broken. A lower high refers to the highest price.
Settings
-Show or hide text and lines, including adjusting the color of text and lines.
-Adjust the size of text, and change the type of lines, including modifying text when there is a BoS and CHoCH.
-Mark swing when there is a valid pullback, adjust the size and color.
Validation of pullback has 4 options for exploration, with the default value set to Internal CHoCH 1 time:
1.Internal CHoCH 1 time.
2.Internal CHoCH and wait for Internal BoS/Internal CHoCH 3 times in a row.
3.PIP Rule, using PIP to determine the distance of a valid pullback.
-Show or hide lines and values. This option will only display results when you activate the PIP Rule. Change the style of lines and change the color of lines.
-In the PIP field, enter the PIP value you want to explore. In the 1 PIP Size field, enter the decimal places in the asset you are trading. For example, for the EUR/USD pair with decimals at position 4.
4.ATR Rule, utilizing ATR multiples to establish the range of a valid pullback.
-Show or hide lines and values. This option will only display results when you activate the ATR Rule. Change the style of lines and change the color of lines.
-ATR type allows you to choose from 5 ma types. ATR Period adjusts the backward-looking average value you want to explore. Multiple: Enter a multiplier value for ATR to match the volatility or asset you are trading.
If you choose only ATR Rule, the result is the validation of the pullback with ATR Rule only. If you choose more than 1 option, whichever condition is true, the validation pullback occurs immediately. If you don't choose anything, the default value is Internal CHoCH 1 time.
Swing external structure
-Show or hide text and lines, including adjusting the color of text and lines.
-Adjust the size of text, and change the type of lines, including modifying text.
Equilibrium external
-Show or hide text and lines, including adjusting the color of text and lines.
-Adjust the size of text, and change the type of lines, including modifying text.
-Adjust the percentage of Equilibrium.
The values of these 4 options are: 1. PIP Rule in the internal structure 2. ATR Rule in the internal structure 3. PIP Rule in the external structure 4. ATR Rule in the external structure
These 4 options will be displayed only when the rule is selected along with choosing to display the value.
DISCLAIMER
All investments involve risks. Profit or loss depends on your knowledge, understanding, and decisions.
My scripts/indicators/strategies are created for researching past price behavior only. They are not investment advice, and future results are not guaranteed.

Scalping PullBack Tool R1 by JustUncleLDescription
This study project is a Scalping Pullback trading Tool that incorporates the majority of the indicators needed to analyse and scalp Trends for Pull Backs and reversals on 1min, 5min or 15min charts. The set up utilies Heikin Ashi candle charts. Incorporated within this tool are the following indicators:
1. Major industry (Banks) recognised important EMAs in an EMA Ribbon:
Green = EMA89
Blue = EMA200
Black = EMA633
2. The 36EMA (default) High/Low+Close Price Action Channel (PAC).
3. Fractals
4. HH, LH, LL, HL finder to help with drawing Trend lines and mini Trend Lines.
5. Coloured coded Bar high lighting based on the PAC:
blue = bar closed above PAC
red = bar closed below PAC
gray = bar closed inside PAC
red line = EMA36 of bar close
Setup and hints:
Set the chart to Heikin Ashi Candles.
Add "Sweetspot Gold10" indicator to the chart as well to help with support and resistance finding and shows where the important "00" and "0" lines are.
When price is above the PAC(blue bars) we are only looking to buy as price comes back to the PAC
When price is below the PAC(red bars), we are only looking to sell when price comes back to the PAC
What we’re looking for when price comes back into the PAC we draw mini Trendlines utilising the Fractals and HH/LL points to guide your TL drawing.
Now look for the trend to pull back and break the drawn TL. That's is when we place the scalp trade.
So we are looking for continuation signals in terms of a strong, momentum driven pullbacks (normally short term 10-20 pips) of the EMA36.
The other EMAs are there to check for other Pullbacks when EMA36 is broken.
Other than the SweetSpot Gold10 indicator, you should not need any other indicator to scalp the pullbacks.
References:
Fractals V8 by RicardoSantos
Price Action Trading System v0.3 by JustUncleL
SweetSpot Gold10 R1 by JustUncleL
www.swing-trade-stocks.com
www.forexstrategiesresources.com

Мой скриптinputs:
window(1),
type(0), // 0: close, 1: high low, 2: fractals up down, 3: new fractals
persistent(False),
exittype(1),
nbars(160),
adxthres(40),
nstop(3000);
vars:
currentSwingLow(0),
currentSwingHigh(0),
trailStructureValid(false),
downFractal(0),
upFractal(0),
breakStructureHigh(0),
breakStructureLow(0),
BoS_H(0),
BoS_L(0),
Regime(0),
Last_BoS_L(0),
Last_BoS_H(0),
PeakfilterX(false);
BoS(window,persistent,type,Bos_H,BoS_L,upFractal,downFractal,breakStructureHigh,breakStructureLow);
//BOS Regime
If BoS_H <> 0 then begin
Regime = 1; // Bullish
Last_BoS_H = BoS_H ;
end;
If BoS_L <> 0 Then begin
Regime = -1; // Bearish
Last_BoS_L = BoS_L ;
end;
//Entry Logic: if we are in BoS regime then wait for break swing to entry
if ADX(5) of data2 < adxthres then begin
if time>900 and Regime = 1 and EntriesToday(date)= 0 and Last_BoS_H upFractal then buy next bar at market;
end;
if time>900 and EntriesToday(date)= 0 and Regime = -1 and Last_BoS_L>downFractal then
begin
if close < downFractal then sellshort next bar at market;
end;
end;
// Exits: nbars or stoploss or at the end of the day
if marketposition <> 0 and barssinceentry >nbars then begin
sell next bar at market;
buytocover next bar at market;
end;
setstoploss(nstop);
setexitonclose;

Holographic Market Microstructure | AlphaNattHolographic Market Microstructure | AlphaNatt
A multidimensional, holographically-rendered framework designed to expose the invisible forces shaping every candle — liquidity voids, smart money footprints, order flow imbalances, and structural evolution — in real time.
---
📘 Overview
The Holographic Market Microstructure (HMS) is not a traditional indicator. It’s a visual architecture built to interpret the true anatomy of the market — a living data structure that fuses price, volume, and liquidity into one coherent holographic layer.
Instead of reacting to candles, HMS visualizes the market’s underlying micro-dynamics : where liquidity hides, where volume flows, and how structure morphs as smart money accumulates or distributes.
Designed for system-based traders, volume analysts, and liquidity theorists who demand to see the unseen — the invisible grid driving every price movement.
---
🔬 Core Analytical Modules
Microstructure Analysis
Deconstructs each bar’s internal composition to identify imbalance between aggressive buying and selling. Using a configurable Imbalance Ratio and Liquidity Threshold , the algorithm marks low-liquidity zones and price inefficiencies as “liquidity voids.”
• Detects hidden supply/demand gaps.
• Quantifies micro-level absorption and exhaustion.
• Reveals flow compression and expansion phases.
Smart Money Tracking
Applies advanced volume-rate-of-change and price momentum relationships to map institutional activity.
• Accumulation Zones – Where price rises on expanding volume.
• Distribution Zones – Where price declines on rising volume.
• Automatically visualized as glowing boxes, layered through time to simulate footprint persistence.
Fractal Structure Mapping
Reveals the recursive nature of price formation. HMS detects fractal highs/lows, then connects them into an evolving structure.
• Defines nested market structure across multiple scales.
• Maps trend progression and transition points.
• Renders with adaptive glow lines to reflect depth and strength.
Volume Heat Map
Transforms historical volume data into a 3D holographic heat projection.
• Each band represents a volume-weighted price level.
• Gradient brightness = relative participation intensity.
• Helps identify volume nodes, voids, and liquidity corridors.
HUD Display System
Real-time analytical dashboard summarizing the system’s internal metrics directly on the chart.
• Flow, Structure, Smart$, Liquidity, and Divergence — all live.
• Designed for both scalpers and swing traders to assess micro-context instantly.
---
🧠 Smart Money Intelligence Layer
The Smart Money Index dynamically evaluates the harmony (or conflict) between price momentum and volume acceleration. When institutions accumulate or distribute discreetly, volume surges ahead of price. HMS detects this divergence and overlays it as glowing smart money zones.
◈ ACCUM → Institutional absorption, early uptrend formation.
◈ DISTRIB → Distribution and top-heavy conditions.
○ IDLE → Neutral flow equilibrium.
Divergences between price and volume are signaled using holographic alerts ( ⚠ ALERT ) to highlight exhaustion or trap conditions — often precursors to structural reversals.
---
🌀 Fractal Market Structure Engine
The fractal subsystem recursively identifies local pivot symmetry, connecting micro-structural highs and lows into a holographic skeleton.
• Bullish Structure — Higher highs & higher lows align (▲ BULLISH).
• Bearish Structure — Lower highs & lower lows dominate (▼ BEARISH).
• Ranging — Fractal symmetry balance (◆ RANGING).
Each transition is visually represented through adaptive glow intensity, producing a living contour of market evolution .
---
🔥 Volume Heat Map Projection
The heatmap acts as a volumetric X-ray of the recent 100–300 bars. Each horizontal segment reflects liquidity density, rendered with gradient opacity from cold (inactive) to hot (highly active).
• Detects hidden accumulation shelves and distribution ridges.
• Identifies imbalanced liquidity corridors (voids).
• Reveals the invisible scaffolding of the order book.
When combined with smart money zones and structure lines, it creates a multi-layered holographic perspective — allowing traders to see liquidity clusters and their interaction with evolving structure in real time.
---
💎 Holographic Visual Engine
Every element of HMS is dynamically color-mapped to its visual theme . Each theme carries a distinct personality:
Aeon — Neon blue plasma aesthetic; futuristic and fluid.
Cyber — High-contrast digital energy; circuit-like clarity.
Quantum — Deep space gradients; reflective of non-linear flow.
Neural — Organic transitions; biological intelligence simulation.
Plasma — Vapor-bright gradients; high-energy reactive feedback.
Crystal — Minimalist, transparent geometry; pristine data visibility.
Optional Glow Effects and Pulse Animations create a living hologram that responds to real-time market conditions.
---
🧭 HUD Analytics Table
A live data matrix placed anywhere on-screen (top, middle, or side). It summarizes five critical systems:
Flow: Order flow bias — ▲ BUYING / ▼ SELLING / ◆ NEUTRAL.
Struct: Microstructure direction — ▲ BULLISH / ▼ BEARISH / ◆ RANGING.
Smart$: Institutional behavior — ◈ ACCUM / ◈ DISTRIB / ○ IDLE.
Liquid: Market efficiency — ⚡ VOID / ● NORMAL.
Diverg: Price/Volume correlation — ⚠ ALERT / ✓ CLEAR.
Each metric’s color dynamically adjusts according to live readings, effectively serving as a neural HUD layer for rapid interpretation.
---
🚨 Alert Conditions
Stay informed in real time with built-in alerts that trigger under specific structural or liquidity conditions.
Liquidity Void Detected — Market inefficiency or thin volume region identified.
Strong Order Flow Detected — Aggressive buying or selling momentum shift.
Smart Money Activity — Institutional accumulation or distribution underway.
Price/Volume Divergence — Volume fails to confirm price trend.
Market Structure Shift — Fractal structure flips directional bias.
---
⚙️ Customization Parameters
Adjustable Microstructure Depth (20–200 bars).
Configurable Imbalance Ratio and Liquidity Threshold .
Adaptive Smart Money Sensitivity via Accumulation Threshold (%).
Multiple Fractal Depth Layers for precise structural analysis.
Scalable Heatmap Resolution (5–20 levels) and opacity control.
Selectable HUD Position to suit personal layout preferences.
Each parameter adjusts the balance between visual clarity and data density , ensuring optimal performance across intraday and macro timeframes alike.
---
🧩 Trading Application
Identify early signs of institutional activity before breakouts.
Track structure transitions with fractal precision.
Locate hidden liquidity voids and high-value areas.
Confirm strength of trends using order-flow bias.
Detect volume-based divergences that often precede reversals.
HMS is designed not just for observation — but for contextual understanding . Its purpose is to help traders anchor strategies in liquidity and flow dynamics rather than surface-level price action.
---
🪞 Philosophy
Markets are holographic. Each candle contains a reflection of every other candle — a fractal within a fractal, a structure within a structure. The HMS is built to reveal that reflection, allowing traders to see through the market’s multidimensional fabric.
---
Developed by: AlphaNatt
Version: v6
Category: Market Microstructure | Volume Intelligence
Framework: PineScript v6 | Holographic Visualization System
Not financial advice

Manifold Singularity EngineManifold Singularity Engine: Catastrophe Theory Detection Through Multi-Dimensional Topology Analysis
The Manifold Singularity Engine applies catastrophe theory from mathematical topology to multi-dimensional price space analysis, identifying potential reversal conditions by measuring manifold curvature, topological complexity, and fractal regime states. Unlike traditional reversal indicators that rely on price pattern recognition or momentum oscillators, this system reconstructs the underlying geometric surface (manifold) that price evolves upon and detects points where this topology undergoes catastrophic folding—mathematical singularities that correspond to forced directional changes in price dynamics.
The indicator combines three analytical frameworks: phase space reconstruction that embeds price data into a multi-dimensional coordinate system, catastrophe detection that measures when this embedded manifold reaches critical curvature thresholds indicating topology breaks, and Hurst exponent calculation that classifies the current fractal regime to adaptively weight detection sensitivity. This creates a geometry-based reversal detection system with visual feedback showing topology state, manifold distortion fields, and directional probability projections.
What Makes This Approach Different
Phase Space Embedding Construction
The core analytical method reconstructs price evolution as movement through a three-dimensional coordinate system rather than analyzing price as a one-dimensional time series. The system calculates normalized embedding coordinates: X = normalize(price_velocity, window) , Y = normalize(momentum_acceleration, window) , and Z = normalize(volume_weighted_returns, window) . These coordinates create a trajectory through phase space where price movement traces a path across a geometric surface—the market manifold.
This embedding approach differs fundamentally from traditional technical analysis by treating price not as a sequential data stream but as a dynamical system evolving on a curved surface in multi-dimensional space. The trajectory's geometric properties (curvature, complexity, folding) contain information about impending directional changes that single-dimension analysis cannot capture. When this manifold undergoes rapid topological deformation, price must respond with directional change—this is the mathematical basis for catastrophe detection.
Statistical normalization using z-score transformation (subtracting mean, dividing by standard deviation over a rolling window) ensures the coordinate system remains scale-invariant across different instruments and volatility regimes, allowing identical detection logic to function on forex, crypto, stocks, or indices without recalibration.
Catastrophe Score Calculation
The catastrophe detection formula implements a composite anomaly measurement combining multiple topology metrics: Catastrophe_Score = 0.45×Curvature_Percentile + 0.25×Complexity_Ratio + 0.20×Condition_Percentile + 0.10×Gradient_Percentile . Each component measures a distinct aspect of manifold distortion:
Curvature (κ) is computed using the discrete Laplacian operator: κ = √ , which measures how sharply the manifold surface bends at the current point. High curvature values indicate the surface is folding or developing a sharp corner—geometric precursors to catastrophic topology breaks. The Laplacian measures second derivatives (rate of change of rate of change), capturing acceleration in the trajectory's path through phase space.
Topological Complexity counts sign changes in the curvature field over the embedding window, measuring how chaotically the manifold twists and oscillates. A smooth, stable surface produces low complexity; a highly contorted, unstable surface produces high complexity. This metric detects when the geometric structure becomes informationally dense with multiple local extrema, suggesting an imminent topology simplification event (catastrophe).
Condition Number measures the Jacobian matrix's sensitivity: Condition = |Trace| / |Determinant|, where the Jacobian describes how small changes in price produce changes in the embedding coordinates. High condition numbers indicate numerical instability—points where the coordinate transformation becomes ill-conditioned, suggesting the manifold mapping is approaching a singularity.
Each metric is converted to percentile rank within a rolling window, then combined using weighted sum. The percentile transformation creates adaptive thresholds that automatically adjust to each instrument's characteristic topology without manual recalibration. The resulting 0-100% catastrophe score represents the current bar's position in the distribution of historical manifold distortion—values above the threshold (default 65%) indicate statistically extreme topology states where reversals become geometrically probable.
This multi-metric ensemble approach prevents false signals from isolated anomalies: all four geometric features must simultaneously indicate distortion for a high catastrophe score, ensuring only true manifold breaks trigger detection.
Hurst Exponent Regime Classification
The Hurst exponent calculation implements rescaled range (R/S) analysis to measure the fractal dimension of price returns: H = log(R/S) / log(n) , where R is the range of cumulative deviations from mean and S is the standard deviation. The resulting value classifies market behavior into three fractal regimes:
Trending Regime (H > 0.55) : Persistent price movement where future changes are positively correlated with past changes. The manifold exhibits directional momentum with smooth topology evolution. In this regime, catastrophe signals receive 1.2× confidence multiplier because manifold breaks in trending conditions produce high-magnitude directional changes.
Mean-Reverting Regime (H < 0.45) : Anti-persistent price movement where future changes tend to oppose past changes. The manifold exhibits oscillatory topology with frequent small-scale distortions. Catastrophe signals receive 0.8× confidence multiplier because reversal significance is diminished in choppy conditions where the manifold constantly folds at minor scales.
Random Walk Regime (H ≈ 0.50) : No statistical correlation in returns. The manifold evolution is geometrically neutral with moderate topology stability. Standard 1.0× confidence multiplier applies.
This adaptive weighting system solves a critical problem in reversal detection: the same geometric catastrophe has different trading implications depending on the fractal regime. A manifold fold in a strong trend suggests a significant reversal opportunity; the same fold in mean-reversion suggests a minor oscillation. The Hurst-based regime filter ensures detection sensitivity automatically adjusts to market character without requiring trader intervention.
The implementation uses logarithmic price returns rather than raw prices to ensure
stationarity, and applies the calculation over a configurable window (default 5 bars) to balance responsiveness with statistical validity. The Hurst value is then smoothed using exponential moving average to reduce noise while maintaining regime transition detection.
Multi-Layer Confirmation Architecture
The system implements five independent confirmation filters that must simultaneously validate
before any singularity signal generates:
1. Catastrophe Threshold : The composite anomaly score must exceed the configured threshold (default 0.65 on 0-1 scale), ensuring the manifold distortion is statistically extreme relative to recent history.
2. Pivot Structure Confirmation : Traditional swing high/low patterns (using ta.pivothigh and ta.pivotlow with configurable lookback) must form at the catastrophe bar. This ensures the geometric singularity coincides with observable price structure rather than occurring mid-swing where interpretation is ambiguous.
3. Swing Size Validation : The pivot magnitude must exceed a minimum threshold measured in ATR units (default 1.5× Average True Range). This filter prevents signals on insignificant price jiggles that lack meaningful reversal potential, ensuring only substantial swings with adequate risk/reward ratios generate signals.
4. Volume Confirmation : Current volume must exceed 1.3× the 20-period moving average, confirming genuine market participation rather than low-liquidity price noise. Manifold catastrophes without volume support often represent false topology breaks that don't translate to sustained directional change.
5. Regime Validity : The market must be classified as either trending (ADX > configured threshold, default 30) or volatile (ATR expansion > configured threshold, default 40% above 30-bar average), and must NOT be in choppy/ranging state. This critical filter prevents trading during geometrically unfavorable conditions where edge deteriorates.
All five conditions must evaluate true simultaneously for a signal to generate. This conjunction-based logic (AND not OR) dramatically reduces false positives while preserving true reversal detection. The architecture recognizes that geometric catastrophes occur frequently in noisy data, but only those catastrophes that align with confirming evidence across price structure, participation, and regime characteristics represent tradable opportunities.
A cooldown mechanism (default 8 bars between signals) prevents signal clustering at extended pivot zones where the manifold may undergo multiple small catastrophes during a single reversal process.
Direction Classification System
Unlike binary bull/bear systems, the indicator implements a voting mechanism combining four
directional indicators to classify each catastrophe:
Pivot Vote : +1 if pivot low, -1 if pivot high, 0 otherwise
Trend Vote : Based on slow frequency (55-period EMA) slope—+1 if rising, -1 if falling, 0 if flat
Flow Vote : Based on Y-gradient (momentum acceleration)—+1 if positive, -1 if negative, 0 if neutral
Mid-Band Vote : Based on price position relative to medium frequency (21-period EMA)—+1 if above, -1 if below, 0 if at
The total vote sum classifies the singularity: ≥2 votes = Bullish , ≤-2 votes = Bearish , -1 to +1 votes = Neutral (skip) . This majority-consensus approach ensures directional classification requires alignment across multiple timeframes and analysis dimensions rather than relying on a single indicator. Neutral signals (mixed voting) are displayed but should not be traded, as they represent geometric catastrophes without clear directional resolution.
Core Calculation Methodology
Embedding Coordinate Generation
Three normalized phase space coordinates are constructed from price data:
X-Dimension (Velocity Space):
price_velocity = close - close
X = (price_velocity - mean) / stdev over hurstWindow
Y-Dimension (Acceleration Space):
momentum = close - close
momentum_accel = momentum - momentum
Y = (momentum_accel - mean) / stdev over hurstWindow
Z-Dimension (Volume-Weighted Space):
vol_normalized = (volume - mean) / stdev over embedLength
roc = (close - close ) / close
Z = (roc × vol_normalized - mean) / stdev over hurstWindow
These coordinates define a point in 3D phase space for each bar. The trajectory connecting these points is the reconstructed manifold.
Gradient Field Calculation
First derivatives measure local manifold slope:
dX/dt = X - X
dY/dt = Y - Y
Gradient_Magnitude = √
The gradient direction indicates where the manifold is "pushing" price. Positive Y-gradient suggests upward topological pressure; negative Y-gradient suggests downward pressure.
Curvature Tensor Components
Second derivatives measure manifold bending using discrete Laplacian:
Laplacian_X = X - 2×X + X
Laplacian_Y = Y - 2×Y + Y
Laplacian_Magnitude = √
This is then normalized:
Curvature_Normalized = (Laplacian_Magnitude - mean) / stdev over embedLength
High normalized curvature (>1.5) indicates sharp manifold folding.
Complexity Accumulation
Sign changes in curvature field are counted:
Sign_Flip = 1 if sign(Curvature ) ≠ sign(Curvature ), else 0
Topological_Complexity = sum(Sign_Flip) over embedLength window
This measures oscillation frequency in the geometry. Complexity >5 indicates chaotic topology.
Condition Number Stability Analysis
Jacobian matrix sensitivity is approximated:
dX/dp = dX/dt / (price_change + epsilon)
dY/dp = dY/dt / (price_change + epsilon)
Jacobian_Determinant = (dX/dt × dY/dp) - (dX/dp × dY/dt)
Jacobian_Trace = dX/dt + dY/dp
Condition_Number = |Trace| / (|Determinant| + epsilon)
High condition numbers indicate numerical instability near singularities.
Catastrophe Score Assembly
Each metric is converted to percentile rank over embedLength window, then combined:
Curvature_Percentile = percentrank(abs(Curvature_Normalized), embedLength)
Gradient_Percentile = percentrank(Gradient_Magnitude, embedLength)
Condition_Percentile = percentrank(abs(Condition_Z_Score), embedLength)
Complexity_Ratio = clamp(Topological_Complexity / embedLength, 0, 1)
Final score:
Raw_Anomaly = 0.45×Curvature_P + 0.25×Complexity_R + 0.20×Condition_P + 0.10×Gradient_P
Catastrophe_Score = Raw_Anomaly × Hurst_Multiplier
Values are clamped to range.
Hurst Exponent Calculation
Rescaled range analysis on log returns:
Calculate log returns: r = log(close) - log(close )
Compute cumulative deviations from mean
Find range: R = max(cumulative_dev) - min(cumulative_dev)
Calculate standard deviation: S = stdev(r, hurstWindow)
Compute R/S ratio
Hurst = log(R/S) / log(hurstWindow)
Clamp to and smooth with 5-period EMA
Regime Classification Logic
Volatility Regime:
ATR_MA = SMA(ATR(14), 30)
Vol_Expansion = ATR / ATR_MA
Is_Volatile = Vol_Expansion > (1.0 + minVolExpansion)
Trend Regime (Corrected ADX):
Calculate directional movement (DM+, DM-)
Smooth with Wilder's RMA(14)
Compute DI+ and DI- as percentages
Calculate DX = |DI+ - DI-| / (DI+ + DI-) × 100
ADX = RMA(DX, 14)
Is_Trending = ADX > (trendStrength × 100)
Chop Detection:
Is_Chopping = NOT Is_Trending AND NOT Is_Volatile
Regime Validity:
Regime_Valid = (Is_Trending OR Is_Volatile) AND NOT Is_Chopping
Signal Generation Logic
For each bar:
Check if catastrophe score > topologyStrength threshold
Verify regime is valid
Confirm Hurst alignment (trending or mean-reverting with pivot)
Validate pivot quality (price extended outside spectral bands then re-entered)
Confirm volume/volatility participation
Check cooldown period has elapsed
If all true: compute directional vote
If vote ≥2: Bullish Singularity
If vote ≤-2: Bearish Singularity
If -1 to +1: Neutral (display but skip)
All conditions must be true for signal generation.
Visual System Architecture
Spectral Decomposition Layers
Three harmonic frequency bands visualize entropy state:
Layer 1 (Surface Frequency):
Center: EMA(8)
Width: ±0.3 × 0.5 × ATR
Transparency: 75% (most visible)
Represents fast oscillations
Layer 2 (Mid Frequency):
Center: EMA(21)
Width: ±0.5 × 0.5 × ATR
Transparency: 85%
Represents medium cycles
Layer 3 (Deep Frequency):
Center: EMA(55)
Width: ±0.7 × 0.5 × ATR
Transparency: 92% (most transparent)
Represents slow baseline
Convergence of layers indicates low entropy (stable topology). Divergence indicates high entropy (catastrophe building). This decomposition reveals how different frequency components of price movement interact—when all three align, the manifold is in equilibrium; when they separate, topology is unstable.
Energy Radiance Fields
Concentric boxes emanate from each singularity bar:
For each singularity, 5 layers are generated:
Layer n: bar_index ± (n × 1.5 bars), close ± (n × 0.4 × ATR)
Transparency gradient: inner 75% → outer 95%
Color matches signal direction
These fields visualize the "energy well" of the catastrophe—wider fields indicate stronger topology distortion. The exponential expansion creates a natural radiance effect.
Singularity Node Geometry
N-sided polygon (default hexagon) at each signal bar:
Vertices calculated using polar coordinates
Rotation angle: bar_index × 0.1 (creates animation)
Radius: ATR × singularity_strength × 2
Connects vertices with colored lines
The rotating geometric primitive marks the exact catastrophe bar with visual prominence.
Gradient Flow Field
Directional arrows display manifold slope:
Spawns every 3 bars when gradient_magnitude > 0.1
Symbol: "↗" if dY/dt > 0.1, "↘" if dY/dt < -0.1, "→" if neutral
Color: Bull/bear/neutral based on direction
Density limited to flowDensity parameter
Arrows cluster when gradient is strong, creating intuitive topology visualization.
Probability Projection Cones
Forward trajectory from each singularity:
Projects 10 bars forward
Direction based on vote classification
Center line: close + (direction × ATR × 3)
Uncertainty width: ATR × singularity_strength × 2
Dashed boundaries, solid center
These are mathematical projections based on current gradient, not price targets. They visualize expected manifold evolution if topology continues current trajectory.
Dashboard Metrics Explanation
The real-time control panel displays six core metrics plus regime status:
H (Hurst Exponent):
Value: Current Hurst (0-1 scale)
Label: TREND (>0.55), REVERT (<0.45), or RANDOM (0.45-0.55)
Icon: Direction arrow based on regime
Purpose: Shows fractal character—only trade when favorable
Σ (Catastrophe Score):
Value: Current composite anomaly (0-100%)
Bar gauge shows relative strength
Icon: ◆ if above threshold, ○ if below
Purpose: Primary signal strength indicator
κ (Curvature):
Value: Normalized Laplacian magnitude
Direction arrow shows sign
Color codes severity (green<0.8, yellow<1.5, red≥1.5)
Purpose: Shows manifold bending intensity
⟳ (Topology Complexity):
Value: Count of sign flips in curvature
Icon: ◆ if >3, ○ otherwise
Color codes chaos level
Purpose: Indicates geometric instability
V (Volatility Expansion):
Value: ATR expansion percentage above 30-bar average
Icon: ● if volatile, ○ otherwise
Purpose: Confirms energy present for reversal
T (Trend Strength):
Value: ADX reading (0-100)
Icon: ● if trending, ○ otherwise
Purpose: Shows directional bias strength
R (Regime):
Label: EXPLOSIVE / TREND / VOLATILE / CHOP / NEUTRAL
Icon: ✓ if valid, ✗ if invalid
Purpose: Go/no-go filter for trading
STATE (Bottom Display):
Shows: "◆ BULL SINGULARITY" (green), "◆ BEAR SINGULARITY" (red), "◆ WEAK/NEUTRAL" (orange), or "— Monitoring —" (gray)
Purpose: Current signal status at a glance
How to Use This Indicator
Initial Setup and Configuration
Apply the indicator to your chart with default settings as a starting point. The default parameters (21-bar embedding, 5-bar Hurst window, 2.5σ singularity threshold, 0.65 topology confirmation) are optimized for balanced detection across most instruments and timeframes. For very fast markets (scalping crypto, 1-5min charts), consider reducing embedding depth to 13-15 bars and Hurst window to 3 bars for more responsive detection. For slower markets (swing trading stocks, 4H-Daily charts), increase embedding depth to 34-55 bars and Hurst window to 8-10 bars for more stable topology measurement.
Enable the dashboard (top right recommended) to monitor real-time metrics. The control panel is your primary decision interface—glancing at the dashboard should instantly communicate whether conditions favor trading and what the current topology state is. Position and size the dashboard to remain visible but not obscure price action.
Enable regime filtering (strongly recommended) to prevent trading during choppy/ranging conditions where geometric edge deteriorates. This single setting can dramatically improve overall performance by eliminating low-probability environments.
Reading Dashboard Metrics for Trade Readiness
Before considering any trade, verify the dashboard shows favorable conditions:
Hurst (H) Check:
The Hurst Exponent reading is your first filter. Only consider trades when H > 0.50 . Ideal conditions show H > 0.60 with "TREND" label—this indicates persistent directional price movement where manifold catastrophes produce significant reversals. When H < 0.45 (REVERT label), the market is mean-reverting and catastrophes represent minor oscillations rather than substantial pivots. Do not trade in mean-reverting regimes unless you're explicitly using range-bound strategies (which this indicator is not optimized for). When H ≈ 0.50 (RANDOM label), edge is neutral—acceptable but not ideal.
Catastrophe (Σ) Monitoring:
Watch the Σ percentage build over time. Readings consistently below 50% indicate stable topology with no imminent reversals. When Σ rises above 60-65%, manifold distortion is approaching critical levels. Signals only fire when Σ exceeds the configured threshold (default 65%), so this metric pre-warns you of potential upcoming catastrophes. High-conviction setups show Σ > 75%.
Regime (R) Validation:
The regime classification must read TREND, VOLATILE, or EXPLOSIVE—never trade when it reads CHOP or NEUTRAL. The checkmark (✓) must be present in the regime cell for trading conditions to be valid. If you see an X (✗), skip all signals until regime improves. This filter alone eliminates most losing trades by avoiding geometrically unfavorable environments.
Combined High-Conviction Profile:
The strongest trading opportunities show simultaneously:
H > 0.60 (strong trending regime)
Σ > 75% (extreme topology distortion)
R = EXPLOSIVE or TREND with ✓
κ (Curvature) > 1.5 (sharp manifold fold)
⟳ (Complexity) > 4 (chaotic geometry)
V (Volatility) showing elevated ATR expansion
When all metrics align in this configuration, the manifold is undergoing severe distortion in a favorable fractal regime—these represent maximum-conviction reversal opportunities.
Signal Interpretation and Entry Logic
Bullish Singularity (▲ Green Triangle Below Bar):
This marker appears when the system detects a manifold catastrophe at a price low with bullish directional consensus. All five confirmation filters have aligned: topology score exceeded threshold, pivot low structure formed, swing size was significant, volume/volatility confirmed participation, and regime was valid. The green color indicates the directional vote totaled +2 or higher (majority bullish).
Trading Approach: Consider long entry on the bar immediately following the signal (bar after the triangle). The singularity bar itself is where the geometric catastrophe occurred—entering after allows you to see if price confirms the reversal. Place stop loss below the singularity bar's low (with buffer of 0.5-1.0 ATR for volatility). Initial target can be the previous swing high, or use the probability cone projection as a guide (though not a guarantee). Monitor the dashboard STATE—if it flips to "◆ BEAR SINGULARITY" or Hurst drops significantly, consider exiting even if target not reached.
Bearish Singularity (▼ Red Triangle Above Bar):
This marker appears when the system detects a manifold catastrophe at a price high with bearish directional consensus. Same five-filter confirmation process as bullish signals. The red color indicates directional vote totaled -2 or lower (majority bearish).
Trading Approach: Consider short entry on the bar following the signal. Place stop loss above the singularity bar's high (with buffer). Target previous swing low or use cone projection as reference. Exit if opposite signal fires or Hurst deteriorates.
Neutral Signal (● Orange Circle at Price Level):
This marker indicates the catastrophe detection system identified a topology break that passed catastrophe threshold and regime filters, but the directional voting system produced a mixed result (vote between -1 and +1). This means the four directional components (pivot, trend, flow, mid-band) are not in agreement about which way the reversal should resolve.
Trading Approach: Skip these signals. Neutral markers are displayed for analytical completeness but should not be traded. They represent geometric catastrophes without clear directional resolution—essentially, the manifold is breaking but the direction of the break is ambiguous. Trading neutral signals dramatically increases false signal rate. Only trade green (bullish) or red (bearish) singularities.
Visual Confirmation Using Spectral Layers
The three colored ribbons (spectral decomposition layers) provide entropy visualization that helps confirm signal quality:
Divergent Layers (High Entropy State):
When the three frequency bands (fast 8-period, medium 21-period, slow 55-period) are separated with significant gaps between them, the manifold is in high entropy state—different frequency components of price movement are pulling in different directions. This geometric tension precedes catastrophes. Strong signals often occur when layers are divergent before the signal, then begin reconverging immediately after.
Convergent Layers (Low Entropy State):
When all three ribbons are tightly clustered or overlapping, the manifold is in equilibrium—all frequency components agree. This stable geometry makes catastrophe detection more reliable because topology breaks clearly stand out against the baseline stability. If you see layers converge, then a singularity fires, then layers diverge, this pattern suggests a genuine regime transition.
Signal Quality Assessment:
High-quality singularity signals should show:
Divergent layers (high entropy) in the 5-10 bars before signal
Singularity bar occurs when price has extended outside at least one of the spectral bands (shows pivot extended beyond equilibrium)
Close of singularity bar re-enters the spectral band zone (shows mean reversion starting)
Layers begin reconverging in 3-5 bars after signal (shows new equilibrium forming)
This pattern visually confirms the geometric narrative: manifold became unstable (divergence), reached critical distortion (extended outside equilibrium), broke catastrophically (singularity), and is now stabilizing in new direction (reconvergence).
Using Energy Fields for Trade Management
The concentric glowing boxes around each singularity visualize the topology distortion
magnitude:
Wide Energy Fields (5+ Layers Visible):
Large radiance indicates strong catastrophe with high manifold curvature. These represent significant topology breaks and typically precede larger price moves. Wide fields justify wider profit targets and longer hold times. The outer edge of the largest box can serve as a dynamic support/resistance zone—price often respects these geometric boundaries.
Narrow Energy Fields (2-3 Layers):
Smaller radiance indicates moderate catastrophe. While still valid signals (all filters passed), expect smaller follow-through. Use tighter profit targets and be prepared for quicker exit if momentum doesn't develop. These are valid but lower-conviction trades.
Field Interaction Zones:
When energy fields from consecutive signals overlap or touch, this indicates a prolonged topology distortion region—often corresponds to consolidation zones or complex reversal patterns (head-and-shoulders, double tops/bottoms). Be more cautious in these areas as the manifold is undergoing extended restructuring rather than a clean catastrophe.
Probability Cone Projections
The dashed cone extending forward from each singularity is a mathematical projection, not a
price target:
Cone Direction:
The center line direction (upward for bullish, downward for bearish, flat for neutral) shows the expected trajectory based on current manifold gradient and singularity direction. This is where the topology suggests price "should" go if the catastrophe completes normally.
Cone Width:
The uncertainty band (upper and lower dashed boundaries) represents the range of outcomes given current volatility (ATR-based). Wider cones indicate higher uncertainty—expect more price volatility even if direction is correct. Narrower cones suggest more constrained movement.
Price-Cone Interaction:
Price following near the center line = catastrophe resolving as expected, geometric projection accurate
Price breaking above upper cone = stronger-than-expected reversal, consider holding for larger targets
Price breaking below lower cone (for bullish signal) = catastrophe failing, manifold may be re-folding in opposite direction, consider exit
Price oscillating within cone = normal reversal process, hold position
The 10-bar projection length means cones show expected behavior over the next ~10 bars. Don't confuse this with longer-term price targets.
Gradient Flow Field Interpretation
The directional arrows (↗, ↘, →) scattered across the chart show the manifold's Y-gradient (vertical acceleration dimension):
Upward Arrows (↗):
Positive Y-gradient indicates the momentum acceleration dimension is pushing upward—the manifold topology has upward "slope" at this location. Clusters of upward arrows suggest bullish topological pressure building. These often appear before bullish singularities fire.
Downward Arrows (↘):
Negative Y-gradient indicates downward topological pressure. Clusters precede bearish singularities.
Horizontal Arrows (→):
Neutral gradient indicates balanced topology with no strong directional pressure.
Using Flow Field:
The arrows provide real-time topology state information even between singularity signals. If you're in a long position from a bullish singularity and begin seeing increasing downward arrows appearing, this suggests manifold gradient is shifting—consider tightening stops. Conversely, if arrows remain upward or neutral, topology supports continuation.
Don't confuse arrow direction with immediate price direction—arrows show geometric slope, not price prediction. They're confirmatory context, not entry signals themselves.
Parameter Optimization for Your Trading Style
For Scalping / Fast Trading (1m-15m charts):
Embedding Depth: 13-15 bars (faster topology reconstruction)
Hurst Window: 3 bars (responsive fractal detection)
Singularity Threshold: 2.0-2.3σ (more sensitive)
Topology Confirmation: 0.55-0.60 (lower barrier)
Min Swing Size: 0.8-1.2 ATR (accepts smaller moves)
Pivot Lookback: 3-4 bars (quick pivot detection)
This configuration increases signal frequency for active trading but requires diligent monitoring as false signal rate increases. Use tighter stops.
For Day Trading / Standard Approach (15m-4H charts):
Keep default settings (21 embed, 5 Hurst, 2.5σ, 0.65 confirmation, 1.5 ATR, 5 pivot)
These are balanced for quality over quantity
Best win rate and risk/reward ratio
Recommended for most traders
For Swing Trading / Position Trading (4H-Daily charts):
Embedding Depth: 34-55 bars (stable long-term topology)
Hurst Window: 8-10 bars (smooth fractal measurement)
Singularity Threshold: 3.0-3.5σ (only extreme catastrophes)
Topology Confirmation: 0.75-0.85 (high conviction only)
Min Swing Size: 2.5-4.0 ATR (major moves only)
Pivot Lookback: 8-13 bars (confirmed swings)
This configuration produces infrequent but highly reliable signals suitable for position sizing and longer hold times.
Volatility Adaptation:
In extremely volatile instruments (crypto, penny stocks), increase Min Volatility Expansion to 0.6-0.8 to avoid over-signaling during "always volatile" conditions. In stable instruments (major forex pairs, blue-chip stocks), decrease to 0.3 to allow signals during moderate volatility spikes.
Trend vs Range Preference:
If you prefer trading only strong trends, increase Min Trend Strength to 0.5-0.6 (ADX > 50-60). If you're comfortable with volatility-based trading in weaker trends, decrease to 0.2 (ADX > 20). The default 0.3 balances both approaches.
Complete Trading Workflow Example
Step 1 - Pre-Session Setup:
Load chart with MSE indicator. Check dashboard position is visible. Verify regime filter is enabled. Review recent signals to gauge current instrument behavior.
Step 2 - Market Assessment:
Observe dashboard Hurst reading. If H < 0.45 (mean-reverting), consider skipping this session or using other strategies. If H > 0.50, proceed. Check regime shows TREND, VOLATILE, or EXPLOSIVE with checkmark—if CHOP, wait for regime shift alert.
Step 3 - Signal Wait:
Monitor catastrophe score (Σ). Watch for it climbing above 60%. Observe spectral layers—look for divergence building. If you see curvature (κ) rising above 1.0 and complexity (⟳) increasing, catastrophe is building. Do not anticipate—wait for the actual signal marker.
Step 4 - Signal Recognition:
▲ Bullish or ▼ Bearish triangle appears at a bar. Dashboard STATE changes to "◆ BULL/BEAR SINGULARITY". Energy field appears around the signal bar. Check signal quality:
Was Σ > 70% at signal? (Higher quality)
Are energy fields wide? (Stronger catastrophe)
Did layers diverge before and reconverge after? (Clean break)
Is Hurst still > 0.55? (Good regime)
Step 5 - Entry Decision:
If signal is green/red (not orange neutral), all confirmations look strong, and no immediate contradicting factors appear, prepare entry on next bar open. Wait for confirmation bar to form—ideally it should close in the signal direction (bullish signal → bar closes higher, bearish signal → bar closes lower).
Step 6 - Position Entry:
Enter at open or shortly after open of bar following signal bar. Set stop loss: for bullish signals, place stop at singularity_bar_low - (0.75 × ATR); for bearish signals, place stop at singularity_bar_high + (0.75 × ATR). The buffer accommodates volatility while protecting against catastrophe failure.
Step 7 - Trade Management:
Monitor dashboard continuously:
If Hurst drops below 0.45, consider reducing position
If opposite singularity fires, exit immediately (manifold has re-folded)
If catastrophe score drops below 40% and stays there, topology has stabilized—consider partial profit taking
Watch gradient flow arrows—if they shift to opposite direction persistently, tighten stops
Step 8 - Profit Taking:
Use probability cone as a guide—if price reaches outer cone boundary, consider taking partial profits. If price follows center line cleanly, hold for larger target. Traditional technical targets work well: previous swing high/low, round numbers, Fibonacci extensions. Don't expect precision—manifold projections give direction and magnitude estimates, not exact prices.
Step 9 - Exit:
Exit on: (a) opposite signal appears, (b) dashboard shows regime became invalid (checkmark changes to X), (c) technical target reached, (d) Hurst deteriorates significantly, (e) stop loss hit, or (f) time-based exit if using session limits. Never hold through opposite singularity signals—the manifold has broken in the other direction and your trade thesis is invalidated.
Step 10 - Post-Trade Review:
After exit, review: Did the probability cone projection align with actual price movement? Were the energy fields proportional to move size? Did spectral layers show expected reconvergence? Use these observations to calibrate your interpretation of signal quality over time.
Best Performance Conditions
This topology-based approach performs optimally in specific market environments:
Favorable Conditions:
Well-Developed Swing Structure: Markets with clear rhythm of advances and declines where pivots form at regular intervals. The manifold reconstruction depends on swing formation, so instruments that trend in clear waves work best. Stocks, major forex pairs during active sessions, and established crypto assets typically exhibit this characteristic.
Sufficient Volatility for Topology Development: The embedding process requires meaningful price movement to construct multi-dimensional coordinates. Extremely quiet markets (tight consolidations, holiday trading, after-hours) lack the volatility needed for manifold differentiation. Look for ATR expansion above average—when volatility is present, geometry becomes meaningful.
Trending with Periodic Reversals: The ideal environment is not pure trend (which rarely reverses) nor pure range (which reverses constantly at small scale), but rather trending behavior punctuated by occasional significant counter-trend reversals. This creates the catastrophe conditions the system is designed to detect: manifold building directional momentum, then undergoing sharp topology break at extremes.
Liquid Instruments Where EMAs Reflect True Flow: The spectral layers and frequency decomposition require that moving averages genuinely represent market consensus. Thinly traded instruments with sporadic orders don't create smooth manifold topology. Prefer instruments with consistent volume where EMA calculations reflect actual capital flow rather than random tick sequences.
Challenging Conditions:
Extremely Choppy / Whipsaw Markets: When price oscillates rapidly with no directional persistence (Hurst < 0.40), the manifold undergoes constant micro-catastrophes that don't translate to tradable reversals. The regime filter helps avoid these, but awareness is important. If you see multiple neutral signals clustering with no follow-through, market is too chaotic for this approach.
Very Low Volatility Consolidation: Tight ranges with ATR below average cause the embedding coordinates to compress into a small region of phase space, reducing geometric differentiation. The manifold becomes nearly flat, and catastrophe detection loses sensitivity. The regime filter's volatility component addresses this, but manually avoiding dead markets improves results.
Gap-Heavy Instruments: Stocks that gap frequently (opening outside previous close) create discontinuities in the manifold trajectory. The embedding process assumes continuous evolution, so gaps introduce artifacts. Most gaps don't invalidate the approach, but instruments with daily gaps >2% regularly may show degraded performance. Consider using higher timeframes (4H, Daily) where gaps are less proportionally significant.
Parabolic Moves / Blowoff Tops: When price enters an exponential acceleration phase (vertical rally or crash), the manifold evolves too rapidly for the standard embedding window to track. Catastrophe detection may lag or produce false signals mid-move. These conditions are rare but identifiable by Hurst > 0.75 combined with ATR expansion >2.0× average. If detected, consider sitting out or using very tight stops as geometry is in extreme distortion.
The system adapts by reducing signal frequency in poor conditions—if you notice long periods with no signals, the topology likely lacks the geometric structure needed for reliable catastrophe detection. This is a feature, not a bug: it prevents forced trading during unfavorable environments.
Theoretical Justification for Approach
Why Manifold Embedding?
Traditional technical analysis treats price as a one-dimensional time series: current price is predicted from past prices in sequential order. This approach ignores the structure of price dynamics—the relationships between velocity, acceleration, and participation that govern how price actually evolves.
Dynamical systems theory (from physics and mathematics) provides an alternative framework: treat price as a state variable in a multi-dimensional phase space. In this view, each market condition corresponds to a point in N-dimensional space, and market evolution is a trajectory through this space. The geometry of this space (its topology) constrains what trajectories are possible.
Manifold embedding reconstructs this hidden geometric structure from observable price data. By creating coordinates from velocity, momentum acceleration, and volume-weighted returns, we map price evolution onto a 3D surface. This surface—the manifold—reveals geometric relationships that aren't visible in price charts alone.
The mathematical theorem underlying this approach (Takens' Embedding Theorem from dynamical systems theory) proves that for deterministic or weakly stochastic systems, a state space reconstruction from time-delayed observations of a single variable captures the essential dynamics of the full system. We apply this principle: even though we only observe price, the embedded coordinates (derivatives of price) reconstruct the underlying dynamical structure.
Why Catastrophe Theory?
Catastrophe theory, developed by mathematician René Thom (Fields Medal 1958), describes how continuous systems can undergo sudden discontinuous changes when control parameters reach critical values. A classic example: gradually increasing force on a beam causes smooth bending, then sudden catastrophic buckling. The beam's geometry reaches a critical curvature where topology must break.
Markets exhibit analogous behavior: gradual price changes build tension in the manifold topology until critical distortion is reached, then abrupt directional change occurs (reversal). Catastrophes aren't random—they're mathematically necessary when geometric constraints are violated.
The indicator detects these geometric precursors: high curvature (manifold bending sharply), high complexity (topology oscillating chaotically), high condition number (coordinate mapping becoming singular). These metrics quantify how close the manifold is to a catastrophic fold. When all simultaneously reach extreme values, topology break is imminent.
This provides a logical foundation for reversal detection that doesn't rely on pattern recognition or historical correlation. We're measuring geometric properties that mathematically must change when systems reach critical states. This is why the approach works across different instruments and timeframes—the underlying geometry is universal.
Why Hurst Exponent?
Markets exhibit fractal behavior: patterns at different time scales show statistical self-similarity. The Hurst exponent quantifies this fractal structure by measuring long-range dependence in returns.
Critically for trading, Hurst determines whether recent price movement predicts future direction (H > 0.5) or predicts the opposite (H < 0.5). This is regime detection: trending vs mean-reverting behavior.
The same manifold catastrophe has different trading implications depending on regime. In trending regime (high Hurst), catastrophes represent significant reversal opportunities because the manifold has been building directional momentum that suddenly breaks. In mean-reverting regime (low Hurst), catastrophes represent minor oscillations because the manifold constantly folds at small scales.
By weighting catastrophe signals based on Hurst, the system adapts detection sensitivity to the current fractal regime. This is a form of meta-analysis: not just detecting geometric breaks, but evaluating whether those breaks are meaningful in the current fractal context.
Why Multi-Layer Confirmation?
Geometric anomalies occur frequently in noisy market data. Not every high-curvature point represents a tradable reversal—many are artifacts of microstructure noise, order flow imbalances, or low-liquidity ticks.
The five-filter confirmation system (catastrophe threshold, pivot structure, swing size, volume, regime) addresses this by requiring geometric anomalies to align with observable market evidence. This conjunction-based logic implements the principle: extraordinary claims require extraordinary evidence .
A manifold catastrophe (extraordinary geometric event) alone is not sufficient. We additionally require: price formed a pivot (visible structure), swing was significant (adequate magnitude), volume confirmed participation (capital backed the move), and regime was favorable (trending or volatile, not chopping). Only when all five dimensions agree do we have sufficient evidence that the geometric anomaly represents a genuine reversal opportunity rather than noise.
This multi-dimensional approach is analogous to medical diagnosis: no single test is conclusive, but when multiple independent tests all suggest the same condition, confidence increases dramatically. Each filter removes a different category of false signals, and their combination creates a robust detection system.
The result is a signal set with dramatically improved reliability compared to any single metric alone. This is the power of ensemble methods applied to geometric analysis.
Important Disclaimers
This indicator applies mathematical topology and catastrophe theory to multi-dimensional price space reconstruction. It identifies geometric conditions where manifold curvature, topological complexity, and coordinate singularities suggest potential reversal zones based on phase space analysis. It should not be used as a standalone trading system.
The embedding coordinates, catastrophe scores, and Hurst calculations are deterministic mathematical formulas applied to historical price data. These measurements describe current and recent geometric relationships in the reconstructed manifold but do not predict future price movements. Past geometric patterns and singularity markers do not guarantee future market behavior will follow similar topology evolution.
The manifold reconstruction assumes certain mathematical properties (sufficient embedding dimension, quasi-stationarity, continuous dynamics) that may not hold in all market conditions. Gaps, flash crashes, circuit breakers, news events, and other discontinuities can violate these assumptions. The system attempts to filter problematic conditions through regime classification, but cannot eliminate all edge cases.
The spectral decomposition, energy fields, and probability cones are visualization aids that represent mathematical constructs, not price predictions. The probability cone projects current gradient forward assuming topology continues current trajectory—this is a mathematical "if-then" statement, not a forecast. Market topology can and does change unexpectedly.
All trading involves substantial risk. The singularity markers represent analytical conditions where geometric mathematics align with threshold criteria, not certainty of directional change. Use appropriate risk management for every trade: position sizing based on account risk tolerance (typically 1-2% maximum risk per trade), stop losses placed beyond recent structure plus volatility buffer, and never risk capital needed for living expenses.
The confirmation filters (pivot, swing size, volume, regime) are designed to reduce false signals but cannot eliminate them entirely. Markets can produce geometric anomalies that pass all filters yet fail to develop into sustained reversals. This is inherent to probabilistic systems operating on noisy real-world data.
No indicator can guarantee profitable trades or eliminate losses. The catastrophe detection provides an analytical framework for identifying potential reversal conditions, but actual trading outcomes depend on numerous factors including execution, slippage, spreads, position sizing, risk management, psychological discipline, and market conditions that may change after signal generation.
Use this tool as one component of a comprehensive trading plan that includes multiple forms of analysis, proper risk management, emotional discipline, and realistic expectations about win rates and drawdowns. Combine catastrophe signals with additional confirmation methods such as support/resistance analysis, volume patterns, multi-timeframe alignment, and broader market context.
The spacing filter, cooldown mechanism, and regime validation are designed to reduce noise and over-signaling, but market conditions can change rapidly and render any analytical signal invalid. Always use stop losses and never risk capital you cannot afford to lose. Past performance of detection accuracy does not guarantee future results.
Technical Implementation Notes
All calculations execute on closed bars only—signals and metric values do not repaint after bar close. The indicator does not use any lookahead bias in its calculations. However, the pivot detection mechanism (ta.pivothigh and ta.pivotlow) inherently identifies pivots with a lag equal to the lookback parameter, meaning the actual pivot occurred at bar but is recognized at bar . This is standard behavior for pivot functions and is not repainting—once recognized, the pivot bar never changes.
The normalization system (z-score transformation over rolling windows) requires approximately 30-50 bars of historical data to establish stable statistics. Values in the first 30-50 bars after adding the indicator may show instability as the rolling means and standard deviations converge. Allow adequate warmup period before relying on signals.
The spectral layer arrays, energy field boxes, gradient flow labels, and node geometry lines are subject to TradingView drawing object limits (500 lines, 500 boxes, 500 labels per indicator as specified in settings). The system implements automatic cleanup by deleting oldest objects when limits approach, but on very long charts with many signals, some historical visual elements may be removed to stay within limits. This does not affect signal generation or dashboard metrics—only historical visual artifacts.
Dashboard and visual rendering update only on the last bar to minimize computational overhead. The catastrophe detection logic executes on every bar, but table cells and drawing objects refresh conditionally to optimize performance. If experiencing chart lag, reduce visual complexity: disable spectral layers, energy fields, or flow field to improve rendering speed. Core signal detection continues to function with all visual elements disabled.
The Hurst calculation uses logarithmic returns rather than raw price to ensure stationarity, and implements clipping to range to handle edge cases where R/S analysis produces invalid values (which can occur during extended periods of identical prices or numerical overflow). The 5-period EMA smoothing reduces noise while maintaining responsiveness to regime transitions.
The condition number calculation adds epsilon (1e-10) to denominators to prevent division by zero when Jacobian determinant approaches zero—which is precisely the singularity condition we're detecting. This numerical stability measure ensures the indicator doesn't crash when detecting the very phenomena it's designed to identify.
The indicator has been tested across multiple timeframes (5-minute through daily) and multiple asset classes (forex majors, stock indices, individual equities, cryptocurrencies, commodities, futures). It functions identically across all instruments due to the adaptive normalization approach and percentage-based metrics. No instrument-specific code or parameter sets are required.
The color scheme system implements seven preset themes plus custom mode. Color assignments are applied globally and affect all visual elements simultaneously. The opacity calculation system multiplies component-specific transparency with master opacity to create hierarchical control—adjusting master opacity affects all visuals proportionally while maintaining their relative transparency relationships.
All alert conditions trigger only on bar close to prevent false alerts from intrabar fluctuations. The regime transition alerts (VALID/INVALID) are particularly useful for knowing when trading edge appears or disappears, allowing traders to adjust activity levels accordingly.
— Dskyz, Trade with insight. Trade with anticipation.

[Yorsh] BJN Liquidity Matrix v1.0Indicator Analysis & Performance Report: BJN Liquidity Matrix v1.0
1. Executive Summary
The BJN Liquidity Matrix v1.0 is a sophisticated, professional-grade trading indicator for TradingView, built on the modern PineScript v6. It is designed to provide traders with a comprehensive and highly customizable view of market liquidity, time-based events, and price structure.
Its primary differentiator in a crowded market is its performance-first architecture. While most multi-feature indicators cause significant chart lag and slow performance, this tool is meticulously engineered to be lightweight, fast, and reliable, ensuring that your trading analysis is never compromised by technical bottlenecks. It delivers a full suite of institutional trading concepts without sacrificing speed.
2. Core Features Overview
The indicator seamlessly integrates several key analytical concepts into a single, cohesive toolkit.
A. Advanced Time Analysis
Customizable Killzone Boxes: Automatically draws key trading sessions (Asia, London, NY AM, NY Lunch, NY PM) on the chart. This helps visualize the high and low of each session, which often act as critical support and resistance levels.
Session High/Low Lines: Extends horizontal lines from the identified highs and lows of each Killzone, allowing you to track these liquidity points throughout the trading day.
Macro Time Highlighting: Visually alerts you when the market enters specific "macro" time windows, which are often periods of increased volatility and algorithmic activity.
B. Multi-Layered Liquidity & Price Structure
Current Timeframe (CTF) Swings: Automatically identifies and plots short-term swing highs and lows on your active chart, providing a clear map of immediate liquidity pools.
Higher Timeframe (HTF) Liquidity: Plots key fractals from the 1-hour timeframe directly onto your chart, tagged as "1H
". This saves you from constantly switching timeframes to find significant swing points.
Previous Day High/Low (PDH/PDL): Clearly marks the previous day's high and low with clean, auto-adjusting labels. These are fundamental levels watched by all market participants.
C. Integrated Market Bias Tools
Daily BIAS: Draws a dynamic equilibrium price (50% level) based on the current day's developing range. This acts as a simple but powerful bias filter: favoring longs below it and shorts above it.
Probabilistic Hourly Bias: A unique feature that analyzes the closing price of the previous hourly candle to provide a statistical probability of the market taking out the previous hour's high or low.
D. The "Smart Status" Information Hub
This is the indicator's central dashboard. Instead of cluttering your chart with dozens of lines, this dynamic table intelligently sorts and displays the most relevant, un-taken liquidity levels above and below the current price. It automatically updates as levels are breached, providing a clean, at-a-glance view of:
Nearest Buy-Side & Sell-Side Liquidity
Untouched Session Highs/Lows
Active PDH/PDL levels
The Hourly Bias probability (when active and not taken)
3. The Performance Advantage: A Smoother Trading Experience
This indicator was engineered to outperform its competitors by focusing on computational efficiency. This is not just a feature; it is the core design philosophy.
Efficient Drawing Management: Most indicators slow down charts by continuously drawing thousands of objects over historical data. The BJN Liquidity Matrix uses an advanced system to only draw what is necessary. It intelligently limits drawings to a recent, user-defined period (e.g., the last 2 days), preventing historical clutter that cripples browser performance.
Smart De-Cluttering: Broken liquidity levels are not left on the chart indefinitely. The script will automatically hide old, irrelevant lines after a set number of hours, keeping your workspace clean and focused on current market structure.
Minimal Data Requests: The script uses internal caching for data like in example the Previous Day Highs/Lows. This means it fetches the data once and reuses it, drastically reducing requests to TradingView's servers and resulting in faster script loading times and reloads.
On-Demand Table Refresh: The comprehensive "Smart Status" table—a feature that would typically cause constant lag—is programmed to only perform its heavy recalculations on the very last bar. This means it doesn't slow down historical data or cause screen-tearing while the market is active.
In summary, you get all the analytical power without the lag, freezing, or slow loading times that plague other "all-in-one" liquidity indicators.
4. Ideal User Profile
This indicator is an ideal tool for:
Day Traders & Scalpers: Who rely on session liquidity and intraday price structure.
SMC / ICT Traders: Who base their strategies on concepts like liquidity grabs, fractals, and time-based models.
Performance-Conscious Traders: Anyone who uses multiple indicators or trades on a less powerful computer and cannot afford chart lag.

Quantum Market Harmonics [QMH]# Quantum Market Harmonics - TradingView Script Description
## 📊 OVERVIEW
Quantum Market Harmonics (QMH) is a comprehensive multi-dimensional trading indicator that combines four independent analytical frameworks to generate high-probability trading signals with quantifiable confidence scores. Unlike simple indicator combinations that display multiple tools side-by-side, QMH synthesizes temporal analysis, inter-market correlations, behavioral psychology, and statistical probabilities into a unified confidence scoring system that requires agreement across all dimensions before generating a confirmed signal.
---
## 🎯 WHAT MAKES THIS SCRIPT ORIGINAL
### The Core Innovation: Weighted Confidence Scoring
Most indicators provide binary signals (buy/sell) or display multiple indicators separately, leaving traders to interpret conflicting information. QMH's originality lies in its weighted confidence scoring system that:
1. **Combines Four Independent Methods** - Each framework (described below) operates independently and contributes points to an overall confidence score
2. **Requires Multi-Dimensional Agreement** - Signals only fire when multiple frameworks align, dramatically reducing false positives
3. **Quantifies Signal Strength** - Every signal includes a numerical confidence rating (0-100%), allowing traders to filter by quality
4. **Adapts to Market Conditions** - Different market regimes activate different component combinations
### Why This Combination is Useful
Traditional approaches suffer from:
- **Single-dimension bias**: RSI shows oversold, but trend is still down
- **Conflicting signals**: MACD says buy, but volume is weak
- **No prioritization**: All signals treated equally regardless of strength
QMH solves these problems by requiring multiple independent confirmations and weighting each component's contribution to the final signal. This multi-dimensional approach mirrors how professional traders analyze markets - not relying on one indicator, but waiting for multiple pieces of evidence to align.
---
## 🔬 THE FOUR ANALYTICAL FRAMEWORKS
### 1. Temporal Fractal Resonance (TFR)
**What It Does:**
Analyzes trend alignment across four different timeframes simultaneously (15-minute, 1-hour, 4-hour, and daily) to identify periods of multi-timeframe synchronization.
**How It Works:**
- Uses `request.security()` with `lookahead=barmerge.lookahead_off` to retrieve confirmed price data from each timeframe
- Calculates "fractal strength" for each timeframe using this formula:
```
Fractal Strength = (Rate of Change / Standard Deviation) × 100
```
This creates a momentum-to-volatility ratio that measures trend strength relative to noise
- Computes a Resonance Index when all four timeframes show the same directional bias
- The index averages the absolute strength values when all timeframes align
**Why This Method:**
Fractal Market Hypothesis suggests that price patterns repeat across different time scales. When trends align from short-term (15m) to long-term (Daily), the probability of trend continuation increases substantially. The momentum/volatility ratio filters out low-conviction moves where volatility dominates direction.
**Contribution to Confidence Score:**
- TFR Bullish = +25 points
- TFR Bearish = +25 points (to bearish confidence)
- No alignment = 0 points
---
### 2. Cross-Asset Quantum Entanglement (CAQE)
**What It Does:**
Analyzes correlation patterns between the current asset and three reference markets (Bitcoin, US Dollar Index, and Volatility Index) to identify both normal correlation behavior and anomalous breakdowns that often precede significant moves.
**How It Works:**
- Retrieves price data from BTC (BINANCE:BTCUSDT), DXY (TVC:DXY), and VIX (TVC:VIX) using confirmed bars
- Calculates Pearson correlation coefficient between the main asset and each reference:
```
Correlation = Covariance(X,Y) / (StdDev(X) × StdDev(Y))
```
- Computes an Intermarket Pressure Index by weighting each reference asset's momentum by its correlation strength:
```
Pressure = (Corr₁ × ROC₁ + Corr₂ × ROC₂ + Corr₃ × ROC₃) / 3
```
- Detects "correlation breakdowns" when average correlation drops below 0.3
**Why This Method:**
Markets don't operate in isolation. Inter-market analysis (developed by John Murphy) recognizes that:
- Crypto assets often correlate with Bitcoin
- Risk assets inversely correlate with VIX (fear gauge)
- Dollar strength affects commodity and crypto prices
When these normal correlations break down, it signals potential regime changes. The term "quantum" reflects the interconnected nature of these relationships - like quantum entanglement where distant particles influence each other.
**Contribution to Confidence Score:**
- CAQE Bullish (positive pressure, stable correlations) = +25 points
- CAQE Bearish (negative pressure, stable correlations) = +25 points (to bearish)
- Correlation breakdown = Warning marker (potential reversal zone)
---
### 3. Adaptive Market Psychology Matrix (AMPM)
**What It Does:**
Classifies the current market emotional state into six distinct categories by analyzing the interaction between momentum (RSI), volume behavior, and volatility acceleration (ATR change).
**How It Works:**
The system evaluates three metrics:
1. **RSI (14-period)**: Measures overbought/oversold conditions
2. **Volume Analysis**: Compares current volume to 20-period average
3. **ATR Rate of Change**: Detects volatility acceleration
Based on these inputs, the market is classified into:
- **Euphoria**: RSI > 80, volume spike present, volatility rising (extreme bullish emotion)
- **Greed**: RSI > 70, normal volume (moderate bullish emotion)
- **Neutral**: RSI 40-60, declining volatility (balanced state)
- **Fear**: RSI 40-60, low volatility (uncertainty without panic)
- **Panic**: RSI < 30, volume spike present, volatility rising (extreme bearish emotion)
- **Despair**: RSI < 20, normal volume (capitulation phase)
**Why This Method:**
Behavioral finance principles (Kahneman, Tversky) show that markets follow predictable emotional cycles. Extreme psychological states often mark reversal points because:
- At Euphoria/Greed peaks, everyone bullish has already bought (no buyers left)
- At Panic/Despair bottoms, everyone bearish has already sold (no sellers left)
AMPM provides contrarian signals at these extremes while respecting trends during Fear and Greed intermediate states.
**Contribution to Confidence Score:**
- Psychology Bullish (Panic/Despair + RSI < 35) = +15 points
- Psychology Bearish (Euphoria/Greed + RSI > 65) = +15 points
- Neutral states = 0 points
---
### 4. Time-Decay Probability Zones (TDPZ)
**What It Does:**
Creates dynamic support and resistance zones based on statistical probability distributions that adapt to changing market volatility, similar to Bollinger Bands but with enhancements for trend environments.
**How It Works:**
- Calculates a 20-period Simple Moving Average as the basis line
- Computes standard deviation of price over the same period
- Creates four probability zones:
- **Extreme Upper**: Basis + 2.5 standard deviations (≈99% probability boundary)
- **Upper Zone**: Basis + 1.5 standard deviations
- **Lower Zone**: Basis - 1.5 standard deviations
- **Extreme Lower**: Basis - 2.5 standard deviations (≈99% probability boundary)
- Dynamically adjusts zone width based on ATR (Average True Range):
```
Adjusted Upper = Upper Zone + (ATR × adjustment_factor)
Adjusted Lower = Lower Zone - (ATR × adjustment_factor)
```
- The adjustment factor increases during high volatility, widening the zones
**Why This Method:**
Traditional support/resistance levels are static and don't account for volatility regimes. TDPZ zones are probability-based and mean-reverting:
- Price has ≈99% probability of staying within extreme zones in normal conditions
- Touches to extreme zones represent statistical outliers (high-probability reversal opportunities)
- Zone expansion/contraction reflects volatility regime changes
- ATR adjustment prevents false signals during unusual volatility
The "time-decay" concept refers to mean reversion - the further price moves from the basis, the higher the probability of eventual return.
**Contribution to Confidence Score:**
- Price in Lower Extreme Zone = +15 points (bullish reversal probability)
- Price in Upper Extreme Zone = +15 points (bearish reversal probability)
- Price near basis = 0 points
---
## 🎯 HOW THE CONFIDENCE SCORING SYSTEM WORKS
### Signal Generation Formula
QMH calculates separate Bullish and Bearish confidence scores each bar:
**Bullish Confidence (0-100%):**
```
Base Score: 20 points
+ TFR Bullish: 25 points (if all 4 timeframes aligned bullish)
+ CAQE Bullish: 25 points (if intermarket pressure positive)
+ AMPM Bullish: 15 points (if Panic/Despair contrarian signal)
+ TDPZ Bullish: 15 points (if price in lower probability zones)
─────────
Maximum Possible: 100 points
```
**Bearish Confidence (0-100%):**
```
Base Score: 20 points
+ TFR Bearish: 25 points (if all 4 timeframes aligned bearish)
+ CAQE Bearish: 25 points (if intermarket pressure negative)
+ AMPM Bearish: 15 points (if Euphoria/Greed contrarian signal)
+ TDPZ Bearish: 15 points (if price in upper probability zones)
─────────
Maximum Possible: 100 points
```
### Confirmed Signal Requirements
A **QBUY** (Quantum Buy) signal generates when:
1. Bullish Confidence ≥ User-defined threshold (default 60%)
2. Bullish Confidence > Bearish Confidence
3. No active sell signal present
A **QSELL** (Quantum Sell) signal generates when:
1. Bearish Confidence ≥ User-defined threshold (default 60%)
2. Bearish Confidence > Bullish Confidence
3. No active buy signal present
### Why This Approach Is Different
**Example Comparison:**
Traditional RSI Strategy:
- RSI < 30 → Buy signal
- Result: May buy into falling knife if trend remains bearish
QMH Approach:
- RSI < 30 → Psychology shows Panic (+15 points)
- But requires additional confirmation:
- Are all timeframes also showing bullish reversal? (+25 points)
- Is intermarket pressure turning positive? (+25 points)
- Is price at a statistical extreme? (+15 points)
- Only when total ≥ 60 points does a QBUY signal fire
This multi-layer confirmation dramatically reduces false signals while maintaining sensitivity to genuine opportunities.
---
## 🚫 NO REPAINT GUARANTEE
**QMH is designed to be 100% repaint-free**, which is critical for honest backtesting and reliable live trading.
### Technical Implementation:
1. **All Multi-Timeframe Data Uses Confirmed Bars**
```pinescript
tf1_close = request.security(syminfo.tickerid, "15", close , lookahead=barmerge.lookahead_off)
```
Using `close ` instead of `close ` ensures we only reference the previous confirmed bar, not the current forming bar.
2. **Lookahead Prevention**
```pinescript
lookahead=barmerge.lookahead_off
```
This parameter prevents the function from accessing future data that wouldn't be available in real-time.
3. **Signal Timing**
Signals appear on the bar AFTER all conditions are met, not retroactively on the bar where conditions first appeared.
### What This Means for Users:
- **Backtest Accuracy**: Historical signals match exactly what you would have seen in real-time
- **No Disappearing Signals**: Once a signal appears, it stays (though price may move against it)
- **Honest Performance**: Results reflect true predictive power, not hindsight optimization
- **Live Trading Reliability**: Alerts fire at the same time signals appear on the chart
The dashboard displays "✓ NO REPAINT" to confirm this guarantee.
---
## 📖 HOW TO USE THIS INDICATOR
### Basic Trading Strategy
**For Trend Followers:**
1. **Wait for Signal Confirmation**
- QBUY label appears below a bar = Confirmed bullish entry opportunity
- QSELL label appears above a bar = Confirmed bearish entry opportunity
2. **Check Confidence Score**
- 60-70%: Moderate confidence (consider smaller position size)
- 70-85%: High confidence (standard position size)
- 85-100%: Very high confidence (consider larger position size)
3. **Enter Trade**
- Long entry: Market or limit order near signal bar
- Short entry: Market or limit order near signal bar
4. **Set Targets Using Probability Zones**
- Long trades: Target the adjusted upper zone (lime line)
- Short trades: Target the adjusted lower zone (red line)
- Alternatively, target the basis line (yellow) for conservative exits
5. **Set Stop Loss**
- Long trades: Below recent swing low minus 1 ATR
- Short trades: Above recent swing high plus 1 ATR
**For Mean Reversion Traders:**
1. **Wait for Extreme Zones**
- Price touches extreme lower zone (dotted red line below)
- Price touches extreme upper zone (dotted lime line above)
2. **Confirm with Psychology**
- At lower extreme: Look for Panic or Despair state
- At upper extreme: Look for Euphoria or Greed state
3. **Wait for Confidence Build**
- Monitor dashboard until confidence exceeds threshold
- Requires patience - extreme touches don't always reverse immediately
4. **Enter Reversal**
- Target: Return to basis line (yellow SMA 20)
- Stop: Beyond the extreme zone
**For Position Traders (Longer Timeframes):**
1. **Use Daily Timeframe**
- Set chart to daily for longer-term signals
- Signals will be less frequent but higher quality
2. **Require High Confidence**
- Filter setting: Min Confidence Score 80%+
- Only take the strongest multi-dimensional setups
3. **Confirm with Resonance Background**
- Green tinted background = All timeframes bullish aligned
- Red tinted background = All timeframes bearish aligned
- Only enter when background tint matches signal direction
4. **Hold for Major Targets**
- Long trades: Hold until extreme upper zone or opposite signal
- Short trades: Hold until extreme lower zone or opposite signal
---
## 📊 DASHBOARD INTERPRETATION
The QMH Dashboard (top-right corner) provides real-time market analysis across all four dimensions:
### Dashboard Elements:
1. **✓ NO REPAINT**
- Green confirmation that signals don't repaint
- Always visible to remind users of signal integrity
2. **SIGNAL: BULL/BEAR XX%**
- Shows dominant direction (whichever confidence is higher)
- Displays current confidence percentage
- Background color intensity reflects confidence level
3. **Psychology: **
- Current market emotional state
- Color coded:
- Orange = Euphoria (extreme bullish emotion)
- Yellow = Greed (moderate bullish emotion)
- Gray = Neutral (balanced state)
- Purple = Fear (uncertainty)
- Red = Panic (extreme bearish emotion)
- Dark red = Despair (capitulation)
4. **Resonance: **
- Multi-timeframe alignment strength
- Positive = All timeframes bullish aligned
- Negative = All timeframes bearish aligned
- Near zero = Timeframes not synchronized
- Emoji indicator: 🔥 (bullish resonance) ❄️ (bearish resonance)
5. **Intermarket: **
- Cross-asset pressure measurement
- Positive = BTC/DXY/VIX correlations supporting upside
- Negative = Correlations supporting downside
- Warning ⚠️ if correlation breakdown detected
6. **RSI: **
- Current RSI(14) reading
- Background colors: Red (>70 overbought), Green (<30 oversold)
- Status: OB (overbought), OS (oversold), or • (neutral)
7. **Status: READY BUY / READY SELL / WAIT**
- Quick trade readiness indicator
- READY BUY: Confidence ≥ threshold, bias bullish
- READY SELL: Confidence ≥ threshold, bias bearish
- WAIT: Confidence below threshold
### How to Use Dashboard:
**Before Entering a Trade:**
- Verify Status shows READY (not WAIT)
- Check that Resonance matches signal direction
- Confirm Psychology isn't contradicting (e.g., buying during Euphoria)
- Note Intermarket value - breakdowns (⚠️) suggest caution
**During a Trade:**
- Monitor Psychology shifts (e.g., from Fear to Greed in a long)
- Watch for Resonance changes that could signal exit
- Check for Intermarket breakdown warnings
---
## ⚙️ CUSTOMIZATION SETTINGS
### TFR Settings (Temporal Fractal Resonance)
- **Enable/Disable**: Turn TFR analysis on/off
- **Fractal Sensitivity** (5-50, default 14):
- Lower values = More responsive to short-term changes
- Higher values = More stable, slower to react
- Recommendation: 14 for balanced, 7 for scalping, 21 for position trading
### CAQE Settings (Cross-Asset Quantum Entanglement)
- **Enable/Disable**: Turn CAQE analysis on/off
- **Asset 1** (default BTC): Reference asset for correlation analysis
- **Asset 2** (default DXY): Second reference asset
- **Asset 3** (default VIX): Third reference asset
- **Correlation Length** (10-100, default 20):
- Lower values = More sensitive to recent correlation changes
- Higher values = More stable correlation measurements
- Recommendation: 20 for most assets, 50 for less volatile markets
### Psychology Settings (Adaptive Market Psychology Matrix)
- **Enable/Disable**: Turn AMPM analysis on/off
- **Volume Spike Threshold** (1.0-5.0x, default 2.0):
- Lower values = Detect smaller volume increases as spikes
- Higher values = Only flag major volume surges
- Recommendation: 2.0 for stocks, 1.5 for crypto
### Probability Settings (Time-Decay Probability Zones)
- **Enable/Disable**: Turn TDPZ visualization on/off
- **Probability Lookback** (20-200, default 50):
- Lower values = Zones adapt faster to recent price action
- Higher values = Zones based on longer statistical history
- Recommendation: 50 for most uses, 100 for position trading
### Filter Settings
- **Min Confidence Score** (40-95%, default 60%):
- Lower threshold = More signals, more false positives
- Higher threshold = Fewer signals, higher quality
- Recommendation: 60% for active trading, 75% for selective trading
### Visual Settings
- **Show Entry Signals**: Toggle QBUY/QSELL labels on chart
- **Show Probability Zones**: Toggle zone visualization
- **Show Psychology State**: Toggle dashboard display
---
## 🔔 ALERT CONFIGURATION
QMH includes four alert conditions that can be configured via TradingView's alert system:
### Available Alerts:
1. **Quantum Buy Signal**
- Fires when: Confirmed QBUY signal generates
- Message includes: Confidence percentage
- Use for: Entry notifications
2. **Quantum Sell Signal**
- Fires when: Confirmed QSELL signal generates
- Message includes: Confidence percentage
- Use for: Entry notifications or exit warnings
3. **Market Panic**
- Fires when: Psychology state reaches Panic
- Use for: Contrarian opportunity alerts
4. **Market Euphoria**
- Fires when: Psychology state reaches Euphoria
- Use for: Reversal warning alerts
### How to Set Alerts:
1. Right-click on chart → "Add Alert"
2. Condition: Select "Quantum Market Harmonics"
3. Choose alert type from dropdown
4. Configure expiration, frequency, and notification method
5. Create alert
**Recommendation**: Set alerts for Quantum Buy/Sell signals with "Once Per Bar Close" frequency to avoid intra-bar false triggers.
---
## 💡 BEST PRACTICES
### For All Users:
1. **Backtest First**
- Test on your specific market and timeframe before live trading
- Different assets may perform better with different confidence thresholds
- Verify that the No Repaint guarantee works as described
2. **Paper Trade**
- Practice with signals on a demo account first
- Understand typical signal frequency for your timeframe
- Get comfortable with the dashboard interpretation
3. **Risk Management**
- Never risk more than 1-2% of capital per trade
- Use proper stop losses (not just mental stops)
- Position size based on confidence score (larger size at higher confidence)
4. **Consider Context**
- QMH signals work best in clear trends or at extremes
- During tight consolidation, false signals increase
- Major news events can invalidate technical signals
### Optimal Use Cases:
**QMH Works Best When:**
- ✅ Markets are trending (up or down)
- ✅ Volatility is normal to elevated
- ✅ Price reaches probability zone extremes
- ✅ Multiple timeframes align
- ✅ Clear inter-market relationships exist
**QMH Is Less Effective When:**
- ❌ Extremely low volatility (zones contract too much)
- ❌ Sideways choppy markets (conflicting timeframes)
- ❌ Flash crashes or news events (correlations break down)
- ❌ Very illiquid assets (irregular price action)
### Session Considerations:
- **24/7 Markets (Crypto)**: Works on all sessions, but signals may be more reliable during high-volume periods (US/European trading hours)
- **Forex**: Best during London/New York overlap when volume is highest
- **Stocks**: Most reliable during regular trading hours (not pre-market/after-hours)
---
## ⚠️ LIMITATIONS AND RISKS
### This Indicator Cannot:
- **Predict Black Swan Events**: Sudden unexpected events invalidate technical analysis
- **Guarantee Profits**: No indicator is 100% accurate; losses will occur
- **Replace Risk Management**: Always use stop losses and proper position sizing
- **Account for Fundamental Changes**: Company news, economic data, etc. can override technical signals
- **Work in All Market Conditions**: Less effective during extreme low volatility or major news events
### Known Limitations:
1. **Multi-Timeframe Lag**: Uses confirmed bars (`close `), so signals appear one bar after conditions met
2. **Correlation Dependency**: CAQE requires sufficient history; may be less reliable on newly listed assets
3. **Computational Load**: Multiple `request.security()` calls may cause slower performance on older devices
4. **Repaint of Dashboard**: Dashboard updates every bar (by design), but signals themselves don't repaint
### Risk Warnings:
- Past performance doesn't guarantee future results
- Backtesting results may not reflect actual trading results due to slippage, commissions, and execution delays
- Different markets and timeframes may produce different results
- The indicator should be used as a tool, not as a standalone trading system
- Always combine with your own analysis, risk management, and trading plan
---
## 🎓 EDUCATIONAL CONCEPTS
This indicator synthesizes several established financial theories and technical analysis concepts:
### Academic Foundations:
1. **Fractal Market Hypothesis** (Edgar Peters)
- Markets exhibit self-similar patterns across time scales
- Implemented via multi-timeframe resonance analysis
2. **Behavioral Finance** (Kahneman & Tversky)
- Investor psychology drives market inefficiencies
- Implemented via market psychology state classification
3. **Intermarket Analysis** (John Murphy)
- Asset classes correlate and influence each other predictably
- Implemented via cross-asset correlation monitoring
4. **Mean Reversion** (Statistical Arbitrage)
- Prices tend to revert to statistical norms
- Implemented via probability zones and standard deviation bands
5. **Multi-Timeframe Analysis** (Technical Analysis Standard)
- Higher timeframe trends dominate lower timeframe noise
- Implemented via fractal resonance scoring
### Learning Resources:
To better understand the concepts behind QMH:
- Read "Intermarket Analysis" by John Murphy (for CAQE concepts)
- Study "Thinking, Fast and Slow" by Daniel Kahneman (for psychology concepts)
- Review "Fractal Market Analysis" by Edgar Peters (for TFR concepts)
- Learn about Bollinger Bands (for TDPZ foundation)
---
## 🔄 VERSION HISTORY AND UPDATES
**Current Version: 1.0**
This is the initial public release. Future updates will be published using TradingView's Update feature (not as separate publications). Planned improvements may include:
- Additional reference assets for CAQE
- Optional machine learning-based weight optimization
- Customizable psychology state definitions
- Alternative probability zone calculations
- Performance metrics tracking
Check the "Updates" tab on the script page for version history.
---
## 📞 SUPPORT AND FEEDBACK
### How to Get Help:
1. **Read This Description First**: Most questions are answered in the detailed sections above
2. **Check Comments**: Other users may have asked similar questions
3. **Post Comments**: For general questions visible to the community
4. **Use TradingView Messaging**: For private inquiries (if available)
### Providing Useful Feedback:
When reporting issues or suggesting improvements:
- Specify your asset, timeframe, and settings
- Include a screenshot if relevant
- Describe expected vs. actual behavior
- Check if issue persists with default settings
### Continuous Improvement:
This indicator will evolve based on user feedback and market testing. Constructive suggestions for improvements are always welcome.
---
## ⚖️ DISCLAIMER
This indicator is provided for **educational and informational purposes only**. It does **not constitute financial advice, investment advice, trading advice, or any other type of advice**.
**Important Disclaimers:**
- You should **not** rely solely on this indicator to make trading decisions
- Always conduct your own research and due diligence
- Past performance is not indicative of future results
- Trading and investing involve substantial risk of loss
- Only trade with capital you can afford to lose
- Consider consulting with a licensed financial advisor before trading
- The author is not responsible for any trading losses incurred using this indicator
**By using this indicator, you acknowledge:**
- You understand the risks of trading
- You take full responsibility for your trading decisions
- You will use proper risk management techniques
- You will not hold the author liable for any losses
---
## 🙏 ACKNOWLEDGMENTS
This indicator builds upon the collective knowledge of the technical analysis and trading community. While the specific implementation and combination are original, the underlying concepts draw from:
- The Pine Script community on TradingView
- Academic research in behavioral finance and market microstructure
- Classical technical analysis methods developed over decades
- Open-source indicators that demonstrate best practices in Pine Script coding
Special thanks to TradingView for providing the platform and Pine Script language that make indicators like this possible.
---
## 📚 ADDITIONAL RESOURCES
**Pine Script Documentation:**
- Official Pine Script Manual: www.tradingview.com
**Related Concepts to Study:**
- Multi-timeframe analysis techniques
- Correlation analysis in financial markets
- Behavioral finance principles
- Mean reversion strategies
- Bollinger Bands methodology
**Recommended TradingView Tools:**
- Strategy Tester: To backtest signal performance
- Bar Replay: To see how signals develop in real-time
- Alert System: To receive notifications of new signals
---
**Thank you for using Quantum Market Harmonics. Trade safely and responsibly.**

3CRGANG - SUPPLY/DEMAND ZONESOverview
The "3CRGANG - SUPPLY/DEMAND ZONES" indicator is a sophisticated tool designed to identify, classify, and visualize dynamic supply (resistance) and demand (support) zones on your TradingView charts. It goes beyond basic level plotting by incorporating a state-based system that tracks how zones evolve based on price interactions, helping traders anticipate potential reversals, continuations, or breakdowns at key levels. Zones are categorized into states like Untested, Verified, Weak, Flipped, and Broken, providing contextual insights into their strength and reliability. This indicator is particularly useful for swing traders, scalpers, and position traders who rely on price action around institutional levels, as it filters noise and highlights actionable zones with customizable alerts and visual aids.
Built on Pine Script v6, it overlays directly on your chart with semi-transparent boxes for zones, optional labels for quick reference, and alert triggers for zone tests. The invite-only access ensures users benefit from its proprietary enhancements, making it a premium alternative to generic zone indicators.
How It's Built: Core Concepts and Calculations
At its foundation, the indicator detects potential supply and demand zones using a fractal-based pivot detection method, which identifies local highs and lows by comparing a central bar's price to surrounding bars within a validation window. This window is dynamically adjusted via a "Fractal Sensitivity Factor" (default 6.0), which scales the lookback period relative to your chart's timeframe—ensuring zones adapt to market volatility without over- or under-fitting. For example, on a 15-minute chart, this might equate to checking 18-24 bars around a candidate pivot for confirmation.
Once a fractal pivot is confirmed:
Zone Boundaries: The zone is constructed around the pivot high/low, extended by a fraction of the Average True Range (ATR, period 7) using the "Zone Boundary ATR Multiplier" (default 0.3). This creates a band that accounts for typical price fluctuations, preventing overly tight or loose zones. A subtle "Zone Fuzz Factor" (default 0.15) adds a minor buffer to the ATR-derived extension, allowing for fine-tuning in choppy markets without altering the core range.
Merging Overlaps: To avoid clutter, overlapping zones of the same type (or flipped counterparts) are intelligently merged through up to 2-3 passes (configurable via "Max Merge Passes"). This consolidation increases the "test count" for the resulting zone, reflecting cumulative price rejections and enhancing its perceived strength.
Zone Testing and Classification: Price interactions with zones are evaluated using one of two methods:
Dynamic - Bars: Counts tests when price wicks into the zone from outside or closes out after entering, with a minimum gap (0-2 bars) to prevent rapid-fire counts in ranging markets.
Mechanical - Pivots: Enhances the dynamic method by requiring a mechanical pivot (e.g., via TradingView's built-in pivothigh/pivotlow) within the zone during the test, adding a layer of confirmation for more conservative signals. Tests are tallied with a "Weak Zone Test Threshold" (default 1), classifying zones as:
Untested: No interactions yet—fresh levels with high potential.
Weak: 1 or fewer meaningful tests—early signals that may fade.
Verified: Multiple tests (above threshold)—strong, repeatedly respected levels.
Flipped: A broken zone that reverses role (e.g., resistance becomes support), based on a decisive close beyond the boundary.
Broken: Permanently invalidated by a strong breakout, optionally displayed for historical context.
Time and Session Integration: Zones are timestamped and limited to a "Back Limit" (default 500 bars) for performance. It incorporates a custom holiday library (importing from RotemB's LIBRARY_3CRGANG_Holidays_Library) to detect closures across major exchanges (NYSE, LSE, FSE, SSX, TSE, HKSE), adjusting session times for half-days and full holidays. Alerts are filtered by user-selected sessions, weekends, and a "Do Not Disturb" (DND) mode with timezone-aware scheduling (e.g., UTC+3 Jerusalem default, selectable from 90+ global options).
This combination of fractal detection, ATR-based sizing, multi-pass merging, and test-driven state evolution draws from classic supply/demand principles but refines them with proprietary logic to handle real-world market dynamics, such as volatility clustering and institutional session biases.
Why It’s Useful
Supply and demand zones are foundational to price action trading, representing areas where large orders accumulate and cause reversals or pauses. This indicator streamlines the process by automating zone discovery and maintenance, saving time compared to manual drawing. Its state system adds predictive value: Verified zones often signal high-probability bounces, while Flipped ones highlight role reversals for trend continuation trades. Alerts notify you of tests in real-time, ideal for multi-chart monitoring, and session/holiday filters reduce false signals during low-liquidity periods (e.g., no alerts on Christmas for NYSE-linked assets).
Traders benefit from reduced emotional bias—zones "age out" beyond the back limit, focusing on recent action—and customizable visuals prevent chart overload. In volatile markets like forex or crypto, the ATR-adjusted boundaries adapt better than fixed-percentage methods, while the test count helps gauge exhaustion (e.g., over-tested Weak zones may signal impending breaks). Overall, it enhances decision-making by providing not just levels, but their evolving context.
How to Use It
Add to Chart:
Search for "3CRGANG - SUPPLY/DEMAND ZONES" in TradingView's invite-only scripts (access required). Apply to any timeframe from 1-minute to yearly, though it shines on intraday (15M-4H) for active trading.
Configure Inputs:
Test Mode: Choose "Dynamic - Bars" for sensitive, wick-focused testing or "Mechanical - Pivots" for stricter, pivot-confirmed interactions. Adjust "Minimum Test Gap" (0-2) to filter rapid tests and "Weak Zone Test Threshold" (1-3) to define strength tiers.
Pivot Filters: Tune "Fractal Sensitivity Factor" (5-14) for fewer/more zones—higher values for smoother trends, lower for chop.
Zone Width: Set "Zone Boundary ATR Multiplier" (0-1) for tighter/wider bands; use "Zone Fuzz Factor" (0-1) sparingly for boundary tweaks.
Visual: Select zone style (Solid/Dashed/Dotted), linewidth (1-3), and horizontal extension (None/Right/Both). Toggle visibility per state (e.g., hide Broken for cleaner charts).
Labels: Enable "Show Labels" for state/type info; add "Show Zone Size" (in pips/$) and "Show Test Count" for details. Adjust shift for positioning.
Alerts: Enable per state (Untested/Weak/Verified/Flipped). Filter by sessions (e.g., enable NYSE for US equities), holidays, weekends, and DND (set time ranges in your timezone to mute notifications).
Colors: Customize per state/type for intuitive visuals (e.g., red shades for resistance).
Trading Application:
Entries: Buy at Verified Demand (green) tests, sell at Verified Supply (red). Use Flipped zones for breakout confirmation.
Exits/Risk: Place stops beyond zone boundaries; trail profits on Weak/Flipped signals indicating fading strength.
Alerts Setup: In TradingView's alert dialog, select this indicator and configure for "alert() function calls only" to receive zone-test notifications.
Multi-Timeframe: View higher-TF zones on lower charts for confluence (e.g., daily zones on 1H).
Best Practices: Combine with volume or oscillators; backtest on your asset to optimize sensitivity.
Chart Example: XAG/USD (m5 timeframe)
Chart Notes
The chart displays zones on XAGUSD (M5 timeframe), presenting a clear price action structure with three distinct zones. A green Verified Support zone, marked with a translucent green box, indicates a robust demand level that has been tested multiple times and held firm. A blue Weak Support zone, outlined with a lighter blue box, reflects a less-tested support level with fewer rejections, suggesting lower reliability. A gold Flipped Resistance zone, highlighted with a golden box, initially acted as a resistance with rejections before breaking through and retesting as a support zone, showcasing its transition. Labels appear to the right of each zone, displaying details such as "VERIFIED SUPPORT (6.72 points, T=3)" for the Verified zone, "WEAK SUPPORT (6.9 points, T=1)" for the Weak zone, and "FLIPPED SUPPORT (3.85 points, T=10)" for the Flipped zone, with sizes in dollars (or pips if under $1) and test counts included. Zones extend horizontally to the right based on the user-defined shift setting, with customizable dashed or dotted borders for enhanced visual clarity.
Requires 500 bars of history for optimal performance. Alerts are muted during holidays (e.g., Lunar New Year) or Do Not Disturb periods.
Settings
Test Mode: Choose method (Dynamic - Bars or Mechanical - Pivots), set minimum test gap (0-2 bars), and weak zone threshold (1-3 tests).
General: Adjust back limit (250-1000 bars).
Pivot Filters: Set fractal sensitivity factor (5-14) and max merge passes (1-3).
Zone Width: Define ATR multiplier (0-1) and fuzz factor (0-1).
Visual: Select zone style (Solid, Dashed, Dotted), line width (1-3), shift end right (1-50 bars), and extension (None, Right, Both).
Visibility: Toggle display for each state (Untested, Verified, Weak, Flipped, Broken).
Labels: Enable labels, set shift (1-50 bars), size, and show size/test counts.
Alerts: Enable alerts by state (Untested, Weak, Verified, Flipped).
DND Settings: Set timezone, Do Not Disturb hours, and weekend alerts.
Sessions Alerts: Filter alerts by exchange (NYSE, LSE, etc.) and holiday settings.
Colors: Assign colors to each zone state and type.
Why It's Unique and Worth Invite-Only Access
While supply/demand indicators exist, this one stands out through its integrated ecosystem: adaptive fractal pivots with sensitivity scaling, multi-pass overlap merging that preserves test history, and a nuanced state machine that evolves zones based on configurable test mechanics—far beyond simple high/low plotting or basic breakouts. The proprietary blending of ATR fuzzing, retroactive test validation during zone creation, and global exchange holiday/session filtering (with half-day adjustments) minimizes irrelevant alerts, a common pain point in public scripts. It doesn't rely solely on built-ins or educational code; instead, it enhances them with custom logic for zone lifecycle management, making it resilient across assets and timeframes.
This originality justifies its closed-source nature—revealing the full interplay of fractal windowing, merge algorithms, and alert conditioning could dilute its edge. As an invite-only script, it provides clear value through premium features like timezone-aware DND, comprehensive holiday integration (e.g., Lunar New Year for HKSE), and state-aware alerts, which aren't replicated in free alternatives. Traders seeking an efficient, low-noise tool for institutional-level analysis will find it worth the access, as it delivers actionable insights that generic indicators overlook.
Disclaimer
This indicator assists in zone identification but does not guarantee success. Trading involves risk, and past performance is not indicative of future results. Always use proper risk management.

Sniper Divergence M.AtaogluSNIPER DIVERGENCE PRO - ADVANCED MULTI-TIMEFRAME DIVERGENCE DETECTOR
DESCRIPTION:
Sniper Divergence Pro is a sophisticated technical analysis indicator that combines RSI-based calculations with fractal analysis to detect both regular and hidden divergences across multiple timeframes. This advanced tool provides traders with precise entry and exit signals through its innovative Sniper algorithm and comprehensive visual feedback system.
KEY FEATURES:
1. SNIPER ALGORITHM:
- Custom RSI-based oscillator with fractal peak/valley detection
- Uses Relative Moving Average (RMA) for smooth signal generation
- Calculates momentum changes with mathematical precision
- Provides real-time divergence analysis with minimal lag
2. DIVERGENCE DETECTION:
- Regular Bullish Divergence: Price makes lower lows while indicator makes higher lows
- Regular Bearish Divergence: Price makes higher highs while indicator makes lower highs
- Hidden Bullish Divergence: Price makes higher lows while indicator makes lower lows
- Hidden Bearish Divergence: Price makes lower highs while indicator makes higher highs
- Configurable sensitivity levels for both bullish and bearish signals
3. MULTI-TIMEFRAME ANALYSIS:
- Simultaneous analysis across 6 timeframes: 15m, 45m, 4h, 1D, 1W, 1M
- Real-time signal tracking with "bars ago" information
- Comprehensive signal table showing current status across all timeframes
- Sniper value display for each timeframe for trend confirmation
4. VISUAL ENHANCEMENTS:
- Neon color scheme optimized for dark themes
- Dynamic color-coded Sniper line based on market conditions
- Background fill areas for overbought/oversold zones
- Peak and valley point markers for fractal analysis
- Horizontal reference lines with clear level indicators
5. ALERT SYSTEM:
- Four distinct alert conditions for different signal types
- Real-time notification system for immediate signal detection
- Professional-grade alert messages for trading automation
TECHNICAL SPECIFICATIONS:
CALCULATION METHOD:
The indicator uses a modified RSI calculation with fractal analysis:
- Source: Close price (configurable)
- Period: 21 (default, adjustable 1-1000)
- Algorithm: RMA-based momentum calculation with fractal peak/valley detection
- Divergence Logic: Price vs. indicator comparison using fractal points
SIGNAL LEVELS:
- Super Buy Zone: 0-12 (Strong bullish momentum)
- Strong Buy Zone: 12-20 (Moderate bullish momentum)
- Neutral Lower: 20-30 (Weak bullish to neutral)
- Neutral Upper: 30-40 (Weak bearish to neutral)
- Strong Sell Zone: 40-50 (Moderate bearish momentum)
- Super Sell Zone: 50+ (Strong bearish momentum)
DIVERGENCE SETTINGS:
- Bullish Divergence Level: 12 (Minimum level for detection)
- Bearish Divergence Level: 35 (Maximum level for detection)
- Hidden Divergence: Enabled by default for professional signals
USAGE INSTRUCTIONS:
1. BASIC SETUP:
- Apply to any chart timeframe
- Default settings work well for most markets
- Adjust RSI period for different market conditions
2. SIGNAL INTERPRETATION:
- Green triangles: Bullish divergence signals (buy opportunities)
- Red triangles: Bearish divergence signals (sell opportunities)
- X-cross symbols: Hidden divergence signals (stronger signals)
- Circle markers: Fractal peak/valley points
3. MULTI-TIMEFRAME CONFIRMATION:
- Enable signal table for comprehensive analysis
- Look for signal alignment across multiple timeframes
- Use "NOW" indicators for current signal detection
- Monitor Sniper values for trend confirmation
4. RISK MANAGEMENT:
- Use divergences as confirmation, not standalone signals
- Combine with other technical analysis tools
- Set appropriate stop-loss levels
- Consider market context and volatility
ADVANTAGES:
1. ACCURACY: Fractal-based detection reduces false signals
2. VERSATILITY: Works across all market types and timeframes
3. VISIBILITY: Clear visual feedback with neon color scheme
4. COMPREHENSIVE: Multi-timeframe analysis in single indicator
5. PROFESSIONAL: Advanced algorithms suitable for serious traders
6. CUSTOMIZABLE: Extensive parameter adjustment options
LIMITATIONS:
1. LAG: Higher RSI periods may introduce signal delay
2. FALSE SIGNALS: Market noise can generate occasional false positives
3. CONTEXT DEPENDENT: Requires market condition consideration
4. LEARNING CURVE: Advanced features require understanding
RECOMMENDED MARKETS:
- Forex pairs (all timeframes)
- Cryptocurrencies (4h and daily preferred)
- Stock indices (daily and weekly)
- Commodities (4h and daily)
RISK DISCLAIMER:
This indicator is for educational and informational purposes only. Past performance does not guarantee future results. Always conduct your own analysis and use proper risk management. Trading involves substantial risk of loss and is not suitable for all investors.
TECHNICAL REQUIREMENTS:
- TradingView Pro or higher recommended
- Pine Script v6 compatible
- Stable internet connection for real-time data
- Sufficient chart history for accurate calculations
This indicator represents a significant advancement in divergence detection technology, combining traditional RSI concepts with modern fractal analysis to provide traders with a comprehensive tool for identifying high-probability trading opportunities across multiple timeframes.

Uptrick: FRAMA Matrix RSIUptrick: FRAMA Matrix RSI
Introduction
The Uptrick: FRAMA Matrix RSI is a momentum-based indicator that integrates the Relative Strength Index (RSI) with the Fractal Adaptive Moving Average (FRAMA). By applying FRAMA's adaptive smoothing to RSI—and further refining it with a Zero-Lag Moving Average (ZLMA)—this script creates a refined and reliable momentum oscillator. The indicator now includes enhanced divergence detection, potential reversal signals, customizable buy/sell signal options, an internal stats table, and a fully customizable bar coloring system for an enhanced visual trading experience.
Why Combine RSI with FRAMA
Traditional RSI is a well-known momentum indicator but has several limitations. It is highly sensitive to price fluctuations, often generating false signals in choppy or volatile markets. FRAMA, in contrast, adapts dynamically to price changes by adjusting its smoothing factor based on market conditions.
By integrating FRAMA into RSI calculations, this indicator reduces noise while preserving RSI's ability to track momentum, adapts to volatility by reducing lag in trending markets and smoothing out choppiness in ranging conditions, enhances trend-following capability for more reliable momentum shifts, and refines overbought and oversold signals by adjusting to the current market structure.
With the new enhancements, such as a manual alpha input, noise filtering, divergence detection, and multiple buy/sell signal options, the indicator offers even greater flexibility and precision for traders. This combination improves the standard RSI by making it more adaptive and responsive to market changes.
Originality
This indicator is unique because it applies FRAMA's adaptive smoothing technique to RSI, creating a dynamic momentum oscillator that adjusts to different market conditions. Many traditional RSI-based indicators either use fixed smoothing methods like exponential moving averages or employ basic RSI calculations without adjusting for volatility.
This script stands out by integrating several elements, including the fractal dimension-based smoothing of FRAMA to reduce noise while retaining responsiveness, the use of Zero-Lag Moving Average smoothing to enhance trend sensitivity and reduce lag, divergence detection to highlight mismatches between price action and RSI momentum, a noise filter and manual alpha option to prevent minor fluctuations from generating false signals, customizable buy/sell signal options that let traders choose between ZLMA-based or FRAMA RSI-based signals, an internal stats table displaying real-time FRAMA calculations such as fractal dimension and the adaptive alpha factor, and a fully customizable bar coloring system to visually distinguish bullish, bearish, and neutral conditions.
Features
Adaptive FRAMA RSI
The indicator applies FRAMA to RSI values, making the momentum oscillator adaptive to volatility while filtering out noise. Unlike a traditional RSI that reacts equally to all price movements, FRAMA RSI adjusts its smoothing factor based on market structure, making it more effective for identifying true momentum shifts.
Zero-Lag Moving Average (ZLMA)
A smoothing technique that minimizes lag while preserving the responsiveness of price movements. It is applied to the FRAMA RSI to further refine signals and ensure smoother trend detection.
Bullish and Bearish Threshold Crossovers
This system compares FRAMA RSI to a user-defined threshold (default is 50). When FRAMA RSI moves above the threshold, it indicates bullish momentum, while movement below signals bearish conditions. The enhanced noise filter ensures that only significant moves trigger signals.
Noise Filter and Manual Alpha
A new noise filter input prevents tiny fluctuations from triggering false signals. In addition, a manual alpha option allows traders to override the automatically computed smoothing factor with a custom value, providing extra control over the indicator’s sensitivity.
Divergence Detection
The indicator identifies divergence patterns by comparing FRAMA RSI pivots to price action. Bullish divergence occurs when price makes a lower low while FRAMA RSI makes a higher low, and bearish divergence occurs when price makes a higher high while FRAMA RSI makes a lower high. These signals can help traders anticipate potential reversals.
Reversal Signals
Labels appear on the chart when FRAMA RSI confirms classic RSI overbought (70) or oversold (30) conditions, providing visual cues for potential trend reversals.
Buy and Sell Signal Options
Traders can now choose between two signal-generation methods. ZLMA-based signals trigger when the ZLMA of FRAMA RSI crosses key overbought (70) or oversold (30) levels, while FRAMA RSI-based signals trigger when FRAMA RSI itself crosses these levels. This added flexibility allows users to tailor the indicator to their preferred trading style.
ZLMA:
FRAMA:
Customizable Alerts
Alerts notify traders when FRAMA RSI crosses key levels, divergence signals occur, reversal conditions are met, or buy/sell signals trigger. This ensures that important trading events are not missed.
Fully Customizable Bar Coloring System
Users can color bars based on different conditions, enhancing visual clarity. Bar coloring modes include: FRAMA RSI threshold (bars change color based on whether FRAMA RSI is above or below the threshold), ZLMA crossover (bars change when ZLMA crosses overbought or oversold levels), buy/sell signals (bars change when official signals trigger), divergence (bars highlight when bullish or bearish divergence is detected), and reversals (bars indicate when RSI reaches overbought or oversold conditions confirmed by FRAMA RSI). The system also remembers the last applied bar color, ensuring a smooth visual transition.
Input Parameters and Features
Core Inputs
RSI Length (default: 14) defines the period for RSI calculations.
FRAMA Lookback (default: 16) determines the length for the FRAMA smoothing function.
RSI Bull Threshold (default: 50) sets the level above which the market is considered bullish and below which it is bearish.
Noise Filter (default: 1.0) ensures that small fluctuations do not trigger false bullish or bearish signals.
Additional Features
Show Bull and Bear Alerts (default: true) enables notifications when FRAMA RSI crosses the threshold.
Enable Divergence Detection (default: false) highlights bullish and bearish divergences based on price and FRAMA RSI pivots.
Show Potential Reversal Signals (default: false) identifies overbought (70) and oversold (30) levels as possible trend reversal points.
Buy and Sell Signal Option (default: ZLMA) allows traders to choose between ZLMA-based signals or FRAMA RSI-based signals for trade entry.
ZLMA Enhancements
ZLMA Length (default: 14) determines the period for the Zero-Lag Moving Average applied to FRAMA RSI.
Visualization Options
Show Internal Stats Table (default: false) displays real-time FRAMA calculations, including fractal dimension and the adaptive alpha smoothing factor.
Show Threshold FRAMA Signals (default: false) plots buy and sell labels when FRAMA RSI crosses the threshold level.
How It Works
FRAMA Calculation
FRAMA dynamically adjusts smoothing based on the price fractal dimension. The alpha smoothing factor is derived from the fractal dimension or can be set manually to maintain responsiveness.
RSI with FRAMA Smoothing
RSI is calculated using the user-defined lookback period. FRAMA is then applied to the RSI to make it more adaptive to volatility. Optionally, ZLMA is applied to further refine the signals and reduce lag.
Bullish and Bearish Threshold Crosses
A bullish condition occurs when FRAMA RSI crosses above the threshold, while a bearish condition occurs when it falls below. The noise filter ensures that only significant trend shifts generate signals.
Buy and Sell Signal Options
Traders can choose between ZLMA crossovers or FRAMA RSI crossovers as the basis for buy and sell signals, offering flexibility in trade entry timing.
Divergence Detection
The indicator identifies divergences where price action and FRAMA RSI momentum do not align, potentially signaling upcoming reversals.
Reversal Signal Labels
When classic RSI overbought or oversold levels are confirmed by FRAMA RSI conditions, reversal labels are added on the chart to highlight potential exhaustion points.
Bar Coloring System
Bars are dynamically colored based on various conditions such as RSI thresholds, ZLMA crossovers, buy/sell signals, divergence, and reversals, allowing traders to quickly interpret market sentiment.
Alerts and Internal Stats
Customizable alerts notify traders of key events, and an optional internal stats table displays real-time calculations (fractal dimension, alpha value, and RSI values) to help users understand the underlying dynamics of the indicator.
Summary
The Uptrick: FRAMA Matrix RSI offers an enhanced approach to momentum analysis by combining RSI with adaptive FRAMA smoothing and additional layers of signal refinement. The indicator now includes adaptive RSI smoothing to reduce noise and improve responsiveness, Zero-Lag Moving Average filtering to minimize lag, divergence and reversal detection to identify potential turning points, customizable buy/sell signal options that let traders choose between different signal methodologies, a fully customizable bar coloring system to visually distinguish market conditions, and an internal stats table for real-time insight into FRAMA calculation parameters.
Whether used for trend confirmation, divergence detection, or momentum-based strategies, this indicator provides a powerful and adaptive approach to trading.
Disclaimer
This script is for informational and educational purposes only. Trading involves risk, and past performance does not guarantee future results. Always conduct proper research and consult with a financial advisor before making trading decisions.

Trend Matrix - XTrend Matrix - X: Advanced Market Trend Analysis
Introduction: Trend Matrix - X is a powerful indicator designed to provide a comprehensive view of market trends, state transitions, and dynamics. By integrating advanced algorithms, statistical methods, and smoothing techniques, it identifies Bullish, Bearish, or Ranging market states while offering deep insights into trend behavior.
This indicator is ideal for traders seeking a balance between noise reduction and real-time responsiveness, with configurations that adapt dynamically to market conditions.
How It Works?
The indicator combines K-Median Clustering, Kalman Filtering, Fractal Dimension Analysis, and various regression techniques to provide actionable insights.
Market State Detection
- Divides data into three clusters: Bullish, Bearish, and Ranging.
- Uses K-Median Clustering to partition data based on medians, ensuring robust state classification even in volatile markets.
- Slope-Based Trend Analysis: Calculates trend slopes using Linear, Polynomial, or Exponential Regression. The slope represents the trend direction and strength, updated dynamically based on market conditions. It can apply Noise Reduction with Kalman Filter to balance stability and sensitivity
Dynamic Lookback Adjustment
- Automatically adjusts the analysis window length based on market stability, volatility, skewness, and kurtosis.
- This feature ensures the indicator remains responsive in fast-moving markets while providing stability in calmer conditions.
Fractal Dimension Measurement
- Calculates Katz Fractal Dimension to assess market roughness and choppiness.
- Helps identify periods of trend consistency versus noisy, range-bound markets.
Why Use Trend Matrix - X?
- Actionable Market States: Quickly determine whether the market is Bullish, Bearish, or Ranging.
- Advanced Smoothing: Reduces noise while maintaining trend-following precision.
- Dynamic Adaptation: Automatically adjusts to market conditions for consistent performance across varying environments.
- Customization: Configure regression type, lookback dynamics, and smoothing to suit your trading style.
- Integrated Visualization: Displays trend states, fractal dimensions, and cluster levels directly on the chart.
Configuration Options
Matrix Type (Raw or Filtered)
- Raw shows the unfiltered slope for real-time precision.
- Filtered applies Kalman smoothing for long-term trend clarity.
Regression Type
- Choose Linear, Polynomial, or Exponential Regression to calculate slopes based on your market strategy.
Dynamic Lookback Adjustment
- Enable Gradual Adjustment to smoothly adapt lookback periods in response to market volatility.
Noise Smoothing
- Toggle Smooth Market Noise to apply advanced filtering, balancing stability with responsiveness.
Cluster State Detection
- Visualize the current state of the market by coloring the candles to match the detected state.
How to Use the Trend Matrix - X Indicator
Step-by-Step Guide
Add the Indicator to Your Chart
- Once applied, it will display: Trend line (Trend Matrix) for identifying market direction, A state table showing the current market state (Bullish, Bearish, or Ranging), Cluster levels (High, Mid, and Low) for actionable price areas, Fractal dimension metrics to assess market choppiness or trend consistency.
Configure Your Settings
- Matrix Source (Raw vs. Filtered): Raw Matrix : Displays real-time, unsmoothed slope values for immediate precision. Ideal for fast-moving markets where rapid changes need to be tracked. Filtered Matrix : Applies advanced smoothing (Kalman Filter) for a clearer trend representation. Recommended for longer-term analysis or noisy markets
- Regression Type (Choose how the trend slope is calculated): Linear Regression : Tracks the average linear rate of change. Best for stable, straightforward trends. Polynomial Regression : Captures accelerating or decelerating trends with a curved fit. Ideal for dynamic, cyclical markets. Exponential Regression : Highlights compounding growth or decay rates. Perfect for parabolic trends or exponential moves.
- Market Noise Smoothing: Applies an adaptive (no lag) smoothing technique to the Matrix Source.
- Gradual Lookback Adjustment: Enable "Gradually Adjust Lookback" to allow the indicator to dynamically adapt its analysis window. (Indicator already does an automatic window, this just refines it).
Read the Outputs
- Trend Matrix Line: Upward Line (Bullish): Market is trending upward; look for buy opportunities. Downward Line (Bearish): Market is trending downward; look for sell opportunities.
- Cluster Levels: High Level (Cluster 0): Represents the upper bound of the trend, often used as a resistance level. Mid Level (Cluster 2): Serves as a key equilibrium point in the trend. Low Level (Cluster 1): Indicates the lower bound of the trend, often used as a support level.
- Market State Table: Displays the current state of the market. Bullish State: Strong upward trend, suitable for long positions. Bearish State: Strong downward trend, suitable for short positions. Ranging State: Sideways market, suitable for range-bound strategies.
- Fractal Dimension Analysis: Low Fractal Dimension (< 1.6): Indicates strong trend behavior; look for trend-following setups. High Fractal Dimension (> 1.6): Suggests choppy, noisy markets; focus on range-trading strategies.
Advanced Usage
- Adaptive Clustering: The indicator uses K-Median Clustering to dynamically identify Bullish, Bearish, and Ranging states based on market data. For traders interested in state transitions, monitor the cluster levels and the state table for actionable changes.
Trading Strategies
- Trend-Following: Use the Filtered Matrix and Fractal Dimension (< 1.6) to identify and follow strong trends. Enter long positions in Bullish States and short positions in Bearish States.
Disclaimer
I am not a professional market analyst, financial advisor, or trading expert. This indicator, Trend Matrix - X, is the result of personal research and development, created with the intention of contributing something that the trading community might find helpful.
It is important to note that this tool is experimental and provided "as-is" without any guarantees of accuracy, profitability, or suitability for any particular trading strategy. Trading involves significant financial risk, and past performance is not indicative of future results.
Users should exercise caution and use their own discretion when incorporating this indicator into their trading decisions. Always consult with a qualified financial advisor before making any financial or trading decisions.
By using this indicator, you acknowledge and accept full responsibility for your trading activities and outcomes. This tool is intended for educational and informational purposes only.

Pivot Points LIVE [CHE]Title:
Pivot Points LIVE Indicator
Subtitle:
Advanced Pivot Point Analysis for Real-Time Trading
Presented by:
Chervolino
Date:
September 24, 2024
Introduction
What are Pivot Points?
Definition:
Pivot Points are technical analysis indicators used to determine potential support and resistance levels in financial markets.
Purpose:
They help traders identify possible price reversal points and make informed trading decisions.
Overview of Pivot Points LIVE :
A comprehensive indicator designed for real-time pivot point analysis.
Offers advanced features for enhanced trading strategies.
Key Features
Pivot Points LIVE Includes:
Dynamic Pivot Highs and Lows:
Automatically detects and plots pivot high (HH, LH) and pivot low (HL, LL) points.
Customizable Visualization:
Multiple options to display markers, price labels, and support/resistance levels.
Fractal Breakouts:
Identifies and marks breakout and breakdown events with symbols.
Line Connection Modes:
Choose between "All Separate" or "Sequential" modes for connecting pivot points.
Pivot Extension Lines:
Extends lines from the latest pivot point to the current bar for trend analysis.
Alerts:
Configurable alerts for breakout and breakdown events.
Inputs and Configuration
Grouping Inputs for Easy Customization:
Source / Length Left / Length Right:
Pivot High Source: High price by default.
Pivot Low Source: Low price by default.
Left and Right Lengths: Define the number of bars to the left and right for pivot detection.
Colors: Customizable colors for pivot high and low markers.
Options:
Display Settings:
Show HH, LL, LH, HL markers and price labels.
Display support/resistance level extensions.
Option to show levels as a fractal chaos channel.
Enable fractal breakout/down symbols.
Line Connection Mode:
Choose between "All Separate" or "Sequential" for connecting lines.
Line Management:
Set maximum number of lines to display.
Customize line colors, widths, and styles.
Pivot Extension Line:
Visibility: Toggle the display of the last pivot extension line.
Customization: Colors, styles, and width for extension lines.
How It Works - Calculating Pivot Points
Pivot High and Pivot Low Detection:
Pivot High (PH):
Identified when a high price is higher than a specified number of bars to its left and right.
Pivot Low (PL):
Identified when a low price is lower than a specified number of bars to its left and right.
Higher Highs, Lower Highs, Higher Lows, Lower Lows:
Higher High (HH): Current PH is higher than the previous PH.
Lower High (LH): Current PH is lower than the previous PH.
Higher Low (HL): Current PL is higher than the previous PL.
Lower Low (LL): Current PL is lower than the previous PL.
Visual Elements
Markers and Labels:
Shapes:
HH and LH: Downward triangles above the bar.
HL and LL: Upward triangles below the bar.
Labels:
Optionally display the price levels of HH, LH, HL, and LL on the chart.
Support and Resistance Levels:
Extensions:
Lines extending from pivot points to indicate potential support and resistance zones.
Chaos Channels:
Display levels as a fractal chaos channel for enhanced trend analysis.
Fractal Breakout Symbols:
Buy Signals: Upward triangles below the bar.
Sell Signals: Downward triangles above the bar.
Slide 7: Line Connection Modes
All Separate Mode:
Description:
Connects pivot highs with pivot highs and pivot lows with pivot lows separately.
Use Case:
Ideal for traders who want to analyze highs and lows independently.
Sequential Mode:
Description:
Connects all pivot points in the order they occur, regardless of being high or low.
Use Case:
Suitable for identifying overall trend direction and momentum.
Pivot Extension Lines
Purpose:
Trend Continuation:
Visualize the continuation of the latest pivot point's price level.
Customization:
Colors:
Differentiate between bullish and bearish extensions.
Styles:
Solid, dashed, or dotted lines based on user preference.
Width:
Adjustable line thickness for better visibility.
Dynamic Updates:
The extension line updates in real-time as new bars form, providing ongoing trend insights.
Alerts and Notifications
Configurable Alerts:
Fractal Break Arrow:
Triggered when a breakout or breakdown occurs.
Long and Short Signals:
Specific alerts for bullish breakouts (Long) and bearish breakdowns (Short).
Benefits:
Timely Notifications:
Stay informed of critical market movements without constant monitoring.
Automated Trading Strategies:
Integrate with trading bots or automated systems for executing trades based on alerts.
Customization and Optimization
User-Friendly Inputs:
Adjustable Parameters:
Tailor pivot detection sensitivity with left and right lengths.
Color and Style Settings:
Match the indicator aesthetics to personal or platform preferences.
Line Management:
Maximum Lines Displayed:
Prevent chart clutter by limiting the number of lines.
Dynamic Line Handling:
Automatically manage and delete old lines to maintain chart clarity.
Flexibility:
Adapt to Different Markets:
Suitable for various financial instruments including stocks, forex, and cryptocurrencies.
Scalability:
Efficiently handles up to 500 labels and 100 lines for comprehensive analysis.
Practical Use Cases
Identifying Key Support and Resistance:
Entry and Exit Points:
Use pivot levels to determine optimal trade entry and exit points.
Trend Confirmation:
Validate market trends through the connection of pivot points.
Breakout and Breakdown Strategies:
Trading Breakouts:
Enter long positions when price breaks above pivot highs.
Trading Breakdowns:
Enter short positions when price breaks below pivot lows.
Risk Management:
Setting Stop-Loss and Take-Profit Levels:
Utilize pivot levels to place strategic stop-loss and take-profit orders.
Slide 12: Benefits for Traders
Real-Time Analysis:
Provides up-to-date pivot points for timely decision-making.
Enhanced Visualization:
Clear markers and lines improve chart readability and analysis efficiency.
Customizable and Flexible:
Adapt the indicator to fit various trading styles and strategies.
Automated Alerts:
Stay ahead with instant notifications on key market events.
Comprehensive Toolset:
Combines pivot points with fractal analysis for deeper market insights.
Conclusion
Pivot Points LIVE is a robust and versatile indicator designed to enhance your trading strategy through real-time pivot point analysis. With its advanced features, customizable settings, and automated alerts, it equips traders with the tools needed to identify key market levels, execute timely trades, and manage risks effectively.
Ready to Elevate Your Trading?
Explore Pivot Points LIVE and integrate it into your trading toolkit today!
Q&A
Questions?
Feel free to ask any questions or request further demonstrations of the Pivot Points LIVE indicator.

Harish Algo 2The script "Harish Algo 2" is a Pine Script-based TradingView indicator that automatically identifies significant trendlines based on fractal points and tracks price interactions with those trendlines. Key features include:
Fractal Detection: The script identifies fractal highs and lows, using a configurable fractal period, to serve as pivot points for generating trendlines. Fractal highs are marked in blue, and fractal lows are marked in red.
Dynamic Trendlines: It draws trendlines between consecutive fractal points, with a limit on the maximum number of active trendlines. The trendlines can be extended either in both directions or to the right, as per user input. The line width can also be customized.
Support/Resistance Counting: Each trendline tracks how many times the price interacts with it. If the price approaches the line from above and touches or stays near it, the line is considered a support. If the price approaches from below, it is considered a resistance. These counts are used to modify the trendline's color and appearance.
Trendlines with 2 support interactions turn green.
Trendlines with 2 resistance interactions turn red.
Trendlines with 3 or more interactions turn black.
Trendline Styling: Trendlines that extend over a long period (more than 100 bars) change to a dotted style to highlight their persistence.
Break Detection: The script monitors if the price crosses a trendline, signaling a potential breakout or breakdown. Once a trendline is broken, it stops extending further.
Trendline Removal: The script ensures that only a limited number of trendlines are active at a time. If the maximum number of trendlines is reached, the oldest trendline is removed to make space for new ones.
This indicator is designed to help traders visualize important trendlines, spot potential support and resistance levels, and detect breakouts or breakdowns based on price movement.

Butterfly Harmonic Pattern [TradingFinder] Harmonic Detector🔵 Introduction
The Butterfly Harmonic Pattern is a sophisticated and highly regarded tool in technical analysis, utilized by traders to identify potential reversal points in the financial markets. This pattern is distinguished by its reliance on Fibonacci ratios and geometric configurations, which aid in predicting price movements with remarkable precision.
The origin of the Butterfly Harmonic Pattern can be traced back to the pioneering work of Bryce Gilmore, who is credited with discovering this pattern. Gilmore's extensive research and expertise in Fibonacci ratios laid the groundwork for the identification and application of this pattern in technical analysis.
The Butterfly pattern, like other harmonic patterns, is based on the principle that market movements are not random but follow specific structures and ratios.
The pattern is characterized by a distinct "M" shape in bullish scenarios and a "W" shape in bearish scenarios, each indicating a potential reversal point. These formations are identified by specific Fibonacci retracement and extension levels, making the Butterfly pattern a powerful tool for traders seeking to capitalize on market turning points.
The precise nature of the Butterfly pattern allows for the accurate prediction of target prices and the establishment of strategic entry and exit points, making it an indispensable component of a trader's analytical arsenal.
Bullish :
Bearish :
🔵 How to Use
Like other harmonic patterns, the Butterfly pattern is categorized based on how it forms at the end of an uptrend or downtrend. Unlike the Gartley and Bat patterns, the Butterfly pattern, similar to the Crab pattern, forms outside the wave 3 range at the end of a rally.
🟣 Types of Butterfly Harmonic Patterns
🟣 Bullish Butterfly Pattern
This pattern forms at the end of a downtrend and leads to a trend reversal from a downtrend to an uptrend.
🟣 Bearish Butterfly Pattern
In contrast to the Bullish Butterfly pattern, this pattern forms at the end of an uptrend and warns analysts of a trend reversal to a downtrend. In this case, traders are encouraged to shift their trading stance from buy trades to sell trades.
Advantages and Limitations of the Butterfly Pattern in Technical Analysis :
The Butterfly pattern is considered one of the precise and stable tools in financial market analysis. However, it is always important to pay special attention to the advantages and limitations of each pattern.
Here, we review the advantages and disadvantages of using the Butterfly harmonic pattern :
The main advantage of the Butterfly pattern is providing very accurate signals.
Using Fibonacci golden ratios and geometric rules, the Butterfly pattern identifies patterns accurately and systematically. (This high accuracy significantly helps investors in making trading decisions.)
Identifying this pattern requires expertise and experience in technical analysis.
Recognizing the Butterfly pattern might be complex for beginner traders. (Correct identification of the pattern necessitates mastery over geometric principles and Fibonacci ratios.)
The Butterfly harmonic pattern might issue false trading signals. (Traders usually combine the Butterfly pattern with other technical tools to confirm buy and sell signals.)
🔵 Setting
🟣 Logical Setting
ZigZag Pivot Period : You can adjust the period so that the harmonic patterns are adjusted according to the pivot period you want. This factor is the most important parameter in pattern recognition.
Show Valid Forma t: If this parameter is on "On" mode, only patterns will be displayed that they have exact format and no noise can be seen in them. If "Off" is, the patterns displayed that maybe are noisy and do not exactly correspond to the original pattern.
Show Formation Last Pivot Confirm : if Turned on, you can see this ability of patterns when their last pivot is formed. If this feature is off, it will see the patterns as soon as they are formed. The advantage of this option being clear is less formation of fielded patterns, and it is accompanied by the latest pattern seeing and a sharp reduction in reward to risk.
Period of Formation Last Pivot : Using this parameter you can determine that the last pivot is based on Pivot period.
🟣 Genaral Setting
Show : Enter "On" to display the template and "Off" to not display the template.
Color : Enter the desired color to draw the pattern in this parameter.
LineWidth : You can enter the number 1 or numbers higher than one to adjust the thickness of the drawing lines. This number must be an integer and increases with increasing thickness.
LabelSize : You can adjust the size of the labels by using the "size.auto", "size.tiny", "size.smal", "size.normal", "size.large" or "size.huge" entries.
🟣 Alert Setting
Alert : On / Off
Message Frequency : This string parameter defines the announcement frequency. Choices include: "All" (activates the alert every time the function is called), "Once Per Bar" (activates the alert only on the first call within the bar), and "Once Per Bar Close" (the alert is activated only by a call at the last script execution of the real-time bar upon closing). The default setting is "Once per Bar".
Show Alert Time by Time Zone : The date, hour, and minute you receive in alert messages can be based on any time zone you choose. For example, if you want New York time, you should enter "UTC-4". This input is set to the time zone "UTC" by default.

Advanced Volatility-Adjusted Momentum IndexAdvanced Volatility-Adjusted Momentum Index (AVAMI)
The AVAMI is a powerful and versatile trading index which enhances the traditional momentum readings by introducing a volatility adjustment. This results in a more nuanced interpretation of market momentum, considering not only the rate of price changes but also the inherent volatility of the asset.
Settings and Parameters:
Momentum Length: This parameter sets the number of periods used to calculate the momentum, which is essentially the rate of change of the asset's price. A shorter length value means the momentum calculation will be more sensitive to recent price changes. Conversely, a longer length will yield a smoother and more stabilized momentum value, thereby reducing the impact of short-term price fluctuations.
Volatility Length: This parameter is responsible for determining the number of periods to be considered in the calculation of standard deviation of returns, which acts as the volatility measure. A shorter length will result in a more reactive volatility measure, while a longer length will produce a more stable, but less sensitive measure of volatility.
Smoothing Length: This parameter sets the number of periods used to apply a moving average smoothing to the AVAMI and its signal line. The purpose of this is to minimize the impact of volatile periods and to make the indicator's lines smoother and easier to interpret.
Lookback Period for Scaling: This is the number of periods used when rescaling the AVAMI values. The rescaling process is necessary to ensure that the AVAMI values remain within a consistent and interpretable range over time.
Overbought and Oversold Levels: These levels are thresholds at which the asset is considered overbought (potentially overvalued) or oversold (potentially undervalued), respectively. For instance, if the AVAMI exceeds the overbought level, traders may consider it as a possible selling opportunity, anticipating a price correction. Conversely, if the AVAMI falls below the oversold level, it could be seen as a buying opportunity, with the expectation of a price bounce.
Mid Level: This level represents the middle ground between the overbought and oversold levels. Crossing the mid-level line from below can be perceived as an increasing bullish momentum, and vice versa.
Show Divergences and Hidden Divergences: These checkboxes give traders the option to display regular and hidden divergences between the AVAMI and the asset's price. Divergences are crucial market structures that often signal potential price reversals.
Index Logic:
The AVAMI index begins with the calculation of a simple rate of change momentum indicator. This raw momentum is then adjusted by the standard deviation of log returns, which acts as a measure of market volatility. This adjustment process ensures that the resulting momentum index encapsulates not only the speed of price changes but also the market's volatility context.
The raw AVAMI is then smoothed using a moving average, and a signal line is generated as an exponential moving average (EMA) of this smoothed AVAMI. This signal line serves as a trigger for potential trading signals when crossed by the AVAMI.
The script also includes an algorithm to identify 'fractals', which are distinct price patterns that often act as potential market reversal points. These fractals are utilized to spot both regular and hidden divergences between the asset's price and the AVAMI.
Application and Strategy Concepts:
The AVAMI is a versatile tool that can be integrated into various trading strategies. Traders can utilize the overbought and oversold levels to identify potential reversal points. The AVAMI crossing the mid-level line can signify a change in market momentum. Additionally, the identification of regular and hidden divergences can serve as potential trading signals:
Regular Divergence: This happens when the asset's price records a new high/low, but the AVAMI fails to follow suit, suggesting a possible trend reversal. For instance, if the asset's price forms a higher high but the AVAMI forms a lower high, it's a regular bearish divergence, indicating potential price downturn.
Hidden Divergence: This is observed when the price forms a lower high/higher low, but the AVAMI forms a higher high/lower low, suggesting the continuation of the prevailing trend. For example, if the price forms a lower low during a downtrend, but the AVAMI forms a higher low, it's a hidden bullish divergence, signaling the potential continuation of the downtrend.
As with any trading tool, the AVAMI should not be used in isolation but in conjunction with other technical analysis tools and within the context of a well-defined trading plan.

GKD-C CFB-Adaptive Gann HiLo Activator Histogram [Loxx]Giga Kaleidoscope GKD-C CFB-Adaptive Gann HiLo Activator Histogram is a Confirmation module included in Loxx's "Giga Kaleidoscope Modularized Trading System".
█ Giga Kaleidoscope Modularized Trading System
What is Loxx's "Giga Kaleidoscope Modularized Trading System"?
The Giga Kaleidoscope Modularized Trading System is a trading system built on the philosophy of the NNFX (No Nonsense Forex) algorithmic trading.
What is the NNFX algorithmic trading strategy?
The NNFX (No-Nonsense Forex) trading system is a comprehensive approach to Forex trading that is designed to simplify the process and remove the confusion and complexity that often surrounds trading. The system was developed by a Forex trader who goes by the pseudonym "VP" and has gained a significant following in the Forex community.
The NNFX trading system is based on a set of rules and guidelines that help traders make objective and informed decisions. These rules cover all aspects of trading, including market analysis, trade entry, stop loss placement, and trade management.
Here are the main components of the NNFX trading system:
1. Trading Philosophy: The NNFX trading system is based on the idea that successful trading requires a comprehensive understanding of the market, objective analysis, and strict risk management. The system aims to remove subjective elements from trading and focuses on objective rules and guidelines.
2. Technical Analysis: The NNFX trading system relies heavily on technical analysis and uses a range of indicators to identify high-probability trading opportunities. The system uses a combination of trend-following and mean-reverting strategies to identify trades.
3. Market Structure: The NNFX trading system emphasizes the importance of understanding the market structure, including price action, support and resistance levels, and market cycles. The system uses a range of tools to identify the market structure, including trend lines, channels, and moving averages.
4. Trade Entry: The NNFX trading system has strict rules for trade entry. The system uses a combination of technical indicators to identify high-probability trades, and traders must meet specific criteria to enter a trade.
5. Stop Loss Placement: The NNFX trading system places a significant emphasis on risk management and requires traders to place a stop loss order on every trade. The system uses a combination of technical analysis and market structure to determine the appropriate stop loss level.
6. Trade Management: The NNFX trading system has specific rules for managing open trades. The system aims to minimize risk and maximize profit by using a combination of trailing stops, take profit levels, and position sizing.
Overall, the NNFX trading system is designed to be a straightforward and easy-to-follow approach to Forex trading that can be applied by traders of all skill levels.
Core components of an NNFX algorithmic trading strategy
The NNFX algorithm is built on the principles of trend, momentum, and volatility. There are six core components in the NNFX trading algorithm:
1. Volatility - price volatility; e.g., Average True Range, True Range Double, Close-to-Close, etc.
2. Baseline - a moving average to identify price trend
3. Confirmation 1 - a technical indicator used to identify trends
4. Confirmation 2 - a technical indicator used to identify trends
5. Continuation - a technical indicator used to identify trends
6. Volatility/Volume - a technical indicator used to identify volatility/volume breakouts/breakdown
7. Exit - a technical indicator used to determine when a trend is exhausted
What is Volatility in the NNFX trading system?
In the NNFX (No Nonsense Forex) trading system, ATR (Average True Range) is typically used to measure the volatility of an asset. It is used as a part of the system to help determine the appropriate stop loss and take profit levels for a trade. ATR is calculated by taking the average of the true range values over a specified period.
True range is calculated as the maximum of the following values:
-Current high minus the current low
-Absolute value of the current high minus the previous close
-Absolute value of the current low minus the previous close
ATR is a dynamic indicator that changes with changes in volatility. As volatility increases, the value of ATR increases, and as volatility decreases, the value of ATR decreases. By using ATR in NNFX system, traders can adjust their stop loss and take profit levels according to the volatility of the asset being traded. This helps to ensure that the trade is given enough room to move, while also minimizing potential losses.
Other types of volatility include True Range Double (TRD), Close-to-Close, and Garman-Klass
What is a Baseline indicator?
The baseline is essentially a moving average, and is used to determine the overall direction of the market.
The baseline in the NNFX system is used to filter out trades that are not in line with the long-term trend of the market. The baseline is plotted on the chart along with other indicators, such as the Moving Average (MA), the Relative Strength Index (RSI), and the Average True Range (ATR).
Trades are only taken when the price is in the same direction as the baseline. For example, if the baseline is sloping upwards, only long trades are taken, and if the baseline is sloping downwards, only short trades are taken. This approach helps to ensure that trades are in line with the overall trend of the market, and reduces the risk of entering trades that are likely to fail.
By using a baseline in the NNFX system, traders can have a clear reference point for determining the overall trend of the market, and can make more informed trading decisions. The baseline helps to filter out noise and false signals, and ensures that trades are taken in the direction of the long-term trend.
What is a Confirmation indicator?
Confirmation indicators are technical indicators that are used to confirm the signals generated by primary indicators. Primary indicators are the core indicators used in the NNFX system, such as the Average True Range (ATR), the Moving Average (MA), and the Relative Strength Index (RSI).
The purpose of the confirmation indicators is to reduce false signals and improve the accuracy of the trading system. They are designed to confirm the signals generated by the primary indicators by providing additional information about the strength and direction of the trend.
Some examples of confirmation indicators that may be used in the NNFX system include the Bollinger Bands, the MACD (Moving Average Convergence Divergence), and the MACD Oscillator. These indicators can provide information about the volatility, momentum, and trend strength of the market, and can be used to confirm the signals generated by the primary indicators.
In the NNFX system, confirmation indicators are used in combination with primary indicators and other filters to create a trading system that is robust and reliable. By using multiple indicators to confirm trading signals, the system aims to reduce the risk of false signals and improve the overall profitability of the trades.
What is a Continuation indicator?
In the NNFX (No Nonsense Forex) trading system, a continuation indicator is a technical indicator that is used to confirm a current trend and predict that the trend is likely to continue in the same direction. A continuation indicator is typically used in conjunction with other indicators in the system, such as a baseline indicator, to provide a comprehensive trading strategy.
What is a Volatility/Volume indicator?
Volume indicators, such as the On Balance Volume (OBV), the Chaikin Money Flow (CMF), or the Volume Price Trend (VPT), are used to measure the amount of buying and selling activity in a market. They are based on the trading volume of the market, and can provide information about the strength of the trend. In the NNFX system, volume indicators are used to confirm trading signals generated by the Moving Average and the Relative Strength Index. Volatility indicators include Average Direction Index, Waddah Attar, and Volatility Ratio. In the NNFX trading system, volatility is a proxy for volume and vice versa.
By using volume indicators as confirmation tools, the NNFX trading system aims to reduce the risk of false signals and improve the overall profitability of trades. These indicators can provide additional information about the market that is not captured by the primary indicators, and can help traders to make more informed trading decisions. In addition, volume indicators can be used to identify potential changes in market trends and to confirm the strength of price movements.
What is an Exit indicator?
The exit indicator is used in conjunction with other indicators in the system, such as the Moving Average (MA), the Relative Strength Index (RSI), and the Average True Range (ATR), to provide a comprehensive trading strategy.
The exit indicator in the NNFX system can be any technical indicator that is deemed effective at identifying optimal exit points. Examples of exit indicators that are commonly used include the Parabolic SAR, the Average Directional Index (ADX), and the Chandelier Exit.
The purpose of the exit indicator is to identify when a trend is likely to reverse or when the market conditions have changed, signaling the need to exit a trade. By using an exit indicator, traders can manage their risk and prevent significant losses.
In the NNFX system, the exit indicator is used in conjunction with a stop loss and a take profit order to maximize profits and minimize losses. The stop loss order is used to limit the amount of loss that can be incurred if the trade goes against the trader, while the take profit order is used to lock in profits when the trade is moving in the trader's favor.
Overall, the use of an exit indicator in the NNFX trading system is an important component of a comprehensive trading strategy. It allows traders to manage their risk effectively and improve the profitability of their trades by exiting at the right time.
How does Loxx's GKD (Giga Kaleidoscope Modularized Trading System) implement the NNFX algorithm outlined above?
Loxx's GKD v1.0 system has five types of modules (indicators/strategies). These modules are:
1. GKD-BT - Backtesting module (Volatility, Number 1 in the NNFX algorithm)
2. GKD-B - Baseline module (Baseline and Volatility/Volume, Numbers 1 and 2 in the NNFX algorithm)
3. GKD-C - Confirmation 1/2 and Continuation module (Confirmation 1/2 and Continuation, Numbers 3, 4, and 5 in the NNFX algorithm)
4. GKD-V - Volatility/Volume module (Confirmation 1/2, Number 6 in the NNFX algorithm)
5. GKD-E - Exit module (Exit, Number 7 in the NNFX algorithm)
(additional module types will added in future releases)
Each module interacts with every module by passing data between modules. Data is passed between each module as described below:
GKD-B => GKD-V => GKD-C(1) => GKD-C(2) => GKD-C(Continuation) => GKD-E => GKD-BT
That is, the Baseline indicator passes its data to Volatility/Volume. The Volatility/Volume indicator passes its values to the Confirmation 1 indicator. The Confirmation 1 indicator passes its values to the Confirmation 2 indicator. The Confirmation 2 indicator passes its values to the Continuation indicator. The Continuation indicator passes its values to the Exit indicator, and finally, the Exit indicator passes its values to the Backtest strategy.
This chaining of indicators requires that each module conform to Loxx's GKD protocol, therefore allowing for the testing of every possible combination of technical indicators that make up the six components of the NNFX algorithm.
What does the application of the GKD trading system look like?
Example trading system:
Backtest: Strategy with 1-3 take profits, trailing stop loss, multiple types of PnL volatility, and 2 backtesting styles
Baseline: Hull Moving Average
Volatility/Volume: Hurst Exponent
Confirmation 1: CFB-Adaptive Gann HiLo Activator Histogram as shown on the chart above
Confirmation 2: Williams Percent Range
Continuation: Fisher Transform
Exit: Rex Oscillator
Each GKD indicator is denoted with a module identifier of either: GKD-BT, GKD-B, GKD-C, GKD-V, or GKD-E. This allows traders to understand to which module each indicator belongs and where each indicator fits into the GKD protocol chain.
Giga Kaleidoscope Modularized Trading System Signals (based on the NNFX algorithm)
Standard Entry
1. GKD-C Confirmation 1 Signal
2. GKD-B Baseline agrees
3. Price is within a range of 0.2x Volatility and 1.0x Volatility of the Goldie Locks Mean
4. GKD-C Confirmation 2 agrees
5. GKD-V Volatility/Volume agrees
Baseline Entry
1. GKD-B Baseline signal
2. GKD-C Confirmation 1 agrees
3. Price is within a range of 0.2x Volatility and 1.0x Volatility of the Goldie Locks Mean
4. GKD-C Confirmation 2 agrees
5. GKD-V Volatility/Volume agrees
6. GKD-C Confirmation 1 signal was less than 7 candles prior
Continuation Entry
1. Standard Entry, Baseline Entry, or Pullback; entry triggered previously
2. GKD-B Baseline hasn't crossed since entry signal trigger
3. GKD-C Confirmation Continuation Indicator signals
4. GKD-C Confirmation 1 agrees
5. GKD-B Baseline agrees
6. GKD-C Confirmation 2 agrees
1-Candle Rule Standard Entry
1. GKD-C Confirmation 1 signal
2. GKD-B Baseline agrees
3. Price is within a range of 0.2x Volatility and 1.0x Volatility of the Goldie Locks Mean
Next Candle:
1. Price retraced (Long: close < close or Short: close > close )
2. GKD-B Baseline agrees
3. GKD-C Confirmation 1 agrees
4. GKD-C Confirmation 2 agrees
5. GKD-V Volatility/Volume agrees
1-Candle Rule Baseline Entry
1. GKD-B Baseline signal
2. GKD-C Confirmation 1 agrees
3. Price is within a range of 0.2x Volatility and 1.0x Volatility of the Goldie Locks Mean
4. GKD-C Confirmation 1 signal was less than 7 candles prior
Next Candle:
1. Price retraced (Long: close < close or Short: close > close )
2. GKD-B Baseline agrees
3. GKD-C Confirmation 1 agrees
4. GKD-C Confirmation 2 agrees
5. GKD-V Volatility/Volume Agrees
PullBack Entry
1. GKD-B Baseline signal
2. GKD-C Confirmation 1 agrees
3. Price is beyond 1.0x Volatility of Baseline
Next Candle:
1. Price is within a range of 0.2x Volatility and 1.0x Volatility of the Goldie Locks Mean
3. GKD-C Confirmation 1 agrees
4. GKD-C Confirmation 2 agrees
5. GKD-V Volatility/Volume Agrees
█ GKD-C CFB-Adaptive Gann HiLo Activator Histogram
What is Composite Fractal Behavior?
Composite Fractal Behavior is a technical analysis concept developed by Mark Jurik that describes the behavior of financial markets as a combination of various fractal patterns.
Fractal patterns are repeating patterns that occur at different scales and are present in many natural and man-made systems. In financial markets, fractal patterns can be observed in the price movements of various timeframes, from short-term intraday movements to long-term trends.
The concept of Composite Fractal Behavior suggests that by analyzing and combining different fractal patterns from various timeframes, a more accurate prediction of market behavior can be made. Jurik developed various indicators and algorithms based on this concept, such as the JMA (Jurik Moving Average) and the JFB (Jurik Fractal Bands) indicator.
What is the Gann HiLo Activator?
The Gann HiLo Activator is a trend-following indicator that is used to identify the direction of a trend and to generate trading signals based on the price movements. The indicator was created by W.D. Gann, a famous trader and analyst, who developed a number of technical analysis tools and trading strategies.
The Gann HiLo Activator is based on the principle of moving averages and is designed to provide a visual representation of the trend. It consists of two lines, the Gann HiLo Activator line and the Gann HiLo Activator offset line. The Gann HiLo Activator line is calculated by taking the average of the high and low prices for a given period, and the offset line is calculated by taking the difference between the Gann HiLo Activator line and a moving average of the Gann HiLo Activator line.
The Gann HiLo Activator line acts as a signal line, and when the price is above the Gann HiLo Activator line, the trend is considered to be bullish, and when the price is below the Gann HiLo Activator line, the trend is considered to be bearish. The offset line is used to generate trading signals, and when the price crosses above the offset line, it is considered to be a buy signal, and when the price crosses below the offset line, it is considered to be a sell signal.
The Gann HiLo Activator is used by traders and analysts to identify trends and to generate trading signals based on the price movements. It is a popular indicator among technical analysts and is used in a variety of trading strategies, including swing trading, trend following, and momentum trading. The indicator can be used on any time frame and can be applied to any market, including stocks, futures, currencies, and commodities.
What is CFB-Adaptive Gann HiLo Activator Histogram?
This indicator makes the Gann HiLo Activator fractal-adaptive by injecting Composite Fractal Behavior measured periods into the Activator. These period inputs vary bar-by-bar.
Requirements
Inputs
Confirmation 1 and Solo Confirmation: GKD-V Volatility / Volume indicator
Confirmation 2: GKD-C Confirmation indicator
Outputs
Confirmation 2 and Solo Confirmation Complex: GKD-E Exit indicator
Confirmation 1: GKD-C Confirmation indicator
Continuation: GKD-E Exit indicator
Solo Confirmation Simple: GKD-BT Backtest strategy
Additional features will be added in future releases.
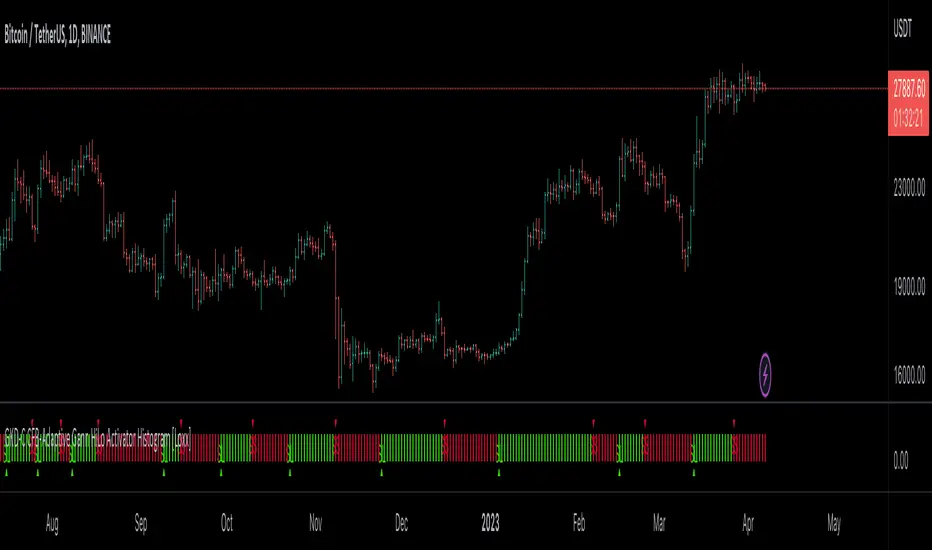
Immediate Trend - VHXIMMEDIATE TREND - VULNERABLE_HUMAN_X
This indicator is used to identify the immediate trend in the market.
When a Short Term High (STH) is engulfed and closed above, we consider that as a bullish trend.
And Similarly, when a Short Term Low (STL) is engulfed and closed below, we consider that as a bullish trend.
STH - A candle that is higher than the one candle towards it's left and one candle towards it's right.
STL - A candle that is lower than the one candle towards it's left and one candle towards it's right.
HOW TO USE:
1. Do not take trades purely based on the immediate trend showcased by the indicator. Rather, use them as confluence with your trading strategy.
2. When you are expecting price to reverse at your point of interest (Denamd/Supply zone), this indicator can help you predict the reversal by showcasing the current trend.
3. Using this indicator you can travel the trend as long as there is a change of trend predicted by this indicator.
