GKD-M Stepped Baseline Optimizer [Loxx]The Giga Kaleidoscope GKD-M Stepped Baseline Optimizer is a Metamorphosis module included in the "Giga Kaleidoscope Modularized Trading System."
█ Introduction
The GKD-M Stepped Baseline Optimizer is an advanced component of the Giga Kaleidoscope Modularized Trading System (GKD), designed to enhance trading strategy development by dynamically optimizing Baseline moving averages. This tool allows traders to evaluate over 65 moving averages, adjusting them across multiple periods to identify which settings yield the highest win rates for their trading strategies. The optimizer systematically tests these moving averages across specified timeframes and intervals, offering insights into net profit, total closed trades, win percentages, and other critical metrics for both long and short positions. Traders can define the initial period and incrementally adjust this value to explore a wide range of periods, thus fine-tuning their strategies with precision. What sets the GKD-M Stepped Baseline Optimizer apart is its unique capability to adapt the baseline moving average according to the highest win rates identified during backtesting, at each trading candle. This win-rate adaptive approach ensures that the trading system is always aligned with the most effective period settings for the selected moving average, enhancing the system's overall performance. Moreover, the 'stepped' aspect of this optimizer introduces a filtering process based ons, significantly reducing market noise and ensuring that identified trends are both significant and reliable. This feature is critical for traders looking to mitigate the risks associated with volatile market conditions and to capitalize on genuine market movements.In essence, the GKD-M Stepped Baseline Optimizer is tailored for traders who utilize the GKD trading system, offering a sophisticated tool to refine their baseline indicators dynamically, ensuring that their trading strategies are continuously optimized for maximum efficacy.
**the backtest data rendered to the chart above uses $5 commission per trade and 10% equity per trade with $1 million initial capital. Each backtest result for each ticker assumes these same inputs. The results are NOT cumulative, they are separate and isolated per ticker and trading side, long or short**
█ Core Features
Stepped Baseline for Noise Reduction
One of the hallmark features of the GKD-M Stepped Baseline Optimizer is its stepped baseline capability. This advanced functionality employs volatility filters to refine the selection of moving averages, significantly reducing market noise. The optimizer ensures that only substantial and reliable trends are considered, eliminating the false signals often caused by minor price fluctuations. This stepped approach to baseline optimization is critical for traders aiming to develop strategies that are both resilient and responsive to genuine market movements.
Dynamic Win Rate Adaptive Capability
Another cornerstone feature is the optimizer’s dynamic win rate adaptive capability. This unique aspect allows the optimizer to adjust the moving average period settings in real-time, based on the highest win rates derived from backtesting over a predefined range. At every trading candle, the optimizer evaluates a comprehensive set of backtesting data to ascertain the optimal period settings for the moving average in use. To perform the backtesting, the trader selects an initial period input (default is 60) and a skip value that increments the initial period input up to seven times. For instance, if a skip value of 5 is chosen, the Baseline Optimizer will run the backtest for the selected moving average on periods such as 60, 65, 70, 75, and so on, up to 90. If the user selects an initial period input of 45 and a skip value of 2, the Baseline Optimizer will conduct backtests for the chosen moving average on periods like 45, 47, 49, 51, and so forth, up to 57. The GKD-M Stepped Baseline Optimizer then exports the baseline with the highest cumulative win rate per candle to any baseline-enabled GKD backtest. This ensures that the baseline indicator remains continually aligned with the most efficacious parameters, dynamically adapting to changing market conditions.
Comprehensive Moving Averages Evaluation
The optimizer’s ability to test over 65 different moving averages across multiple periods stands as a testament to its comprehensive analytical capability. Traders have the flexibility to explore a wide array of moving averages, from traditional ones like the Simple Moving Average (SMA) and Exponential Moving Average (EMA) to more complex types such as the Hull Moving Average (HMA) and Adaptive Moving Average (AMA). This extensive evaluation allows traders to pinpoint the moving average that best aligns with their trading strategy and market conditions, further enhancing the system’s adaptability and effectiveness.
Volatility Filtering and Ticker Volatility Types
Incorporating a wide range of volatility types, including the option to utilize external volatility tickers like the VIX for filtering, adds another layer of sophistication to the optimizer. This feature allows traders to calibrate their baseline according to externals, providing an additional dimension of customization. Whether using standard deviation, ATR, or external volatility indices, traders can fine-tune their strategies to be responsive to the broader market sentiment and volatility trends.
█ Key Inputs
Baseline Settings
• Baseline Source: Determines the price data (Open, High, Low, Close) used for moving average calculations.
• Baseline Period: The starting period for moving average calculation.
• Backtest Skip: Incremental steps for period adjustments in the optimization process.
• Baseline Filter Type: Selection from over 65 moving averages for baseline calculation.
Volatility and Filter Settings
• Price Filter Type & Moving Average Filter Type: Defines thement applied to the price or the moving average, enhancing filter specificity.
• Filter Options: Allows users to select the application area of the volatility filter (price, moving average, or both).
• Filter Multiplier & Period: Configures the intensity and temporal scope of the filter, fine-tuning sensitivity to market volatility.
Backtest Configuration
• Window Period: Specifies the length of the backtesting window in days.
• Backtest Type: Chooses between a fixed window or cumulative data approach for backtesting.
• Initial Capital, Order Size, & Type: Sets the financial parameters for backtesting, including starting equity and the scale of trades.
• Commission per Order: Accounts for trading costs within backtest profitability calculations.
Date and Time Range
• From/Thru Year/Month/Day: Defines the historical period for strategy testing.
• Entry Time: Specifies the time frame during which trades can be initiated, crucial for strategies sensitive to market timing.
Volatility Measurements for Goldie Locks Volatility Qualifiers
• Mean Type & Period: Chooses the moving average type and period for volatility assessment.
• Inner/Outer Volatility Qualifier Multipliers: Adjusts the boundaries for volatility-based trade qualification.
• Activate Qualifier Boundaries: Enables or disables the upper and lower volatility qualifiers.
Advanced Volatility Inputs
• Volatility Ticker Selection & Trading Days: Incorporates external volatility indices (e.g., VIX) into the strategy, adjusting for market volatility.
• Static Percent, MAD Internal Filter Period, etc.: Provides fixed or adaptive volatility thresholds for filtering.
UI Customization
• Baseline Width & Table Display Options: Customizes the visual representation of the baseline and the display of optimization results.
• Table Header/Content Color & Text Size: Enhances readability and user interface aesthetics.
Export Options
• Export Data: Selects the specific metric to be exported from the script, such as net profit or average profit per trade.
Moving Average Specific Parameters
Specific inputs tailored to the characteristics of selected moving averages (e.g., Fractal Adjusted (FRAMA), Least Squares Moving Average (LSMA), T3, etc.), allowing users to fine-tune the behavior of these averages based on unique formula requirements.
█ Indicator UI
• Long and Short Baselines: The optimizer differentiates trends through two distinct baselines: a green line for long (uptrend) baselines and a red line for short (downtrend) baselines. These baselines alternate activation based on the current trend direction as determined by the moving average plus length combination for the candle in view.
Ambiguity in market direction, when an uptrend and downtrend are concurrently indicated, is visually represented by yellow lines.
• Stepping Mechanism for Trend Visualization: Adjusting the source input and the moving average output based on volatility, the indicator exhibits a stepped appearance on the chart. This mechanism ensures that only substantial market movements, surpassing a specified volatility threshold, are recognized as trend changes.
Stepping Activated
• Goldilocks Zone: Beyond the long and short baselines, the Goldilocks zone introduces a distinct moving average that closely follows the selected price or source input, aiming to strike the perfect balance between not too much and not too little market movement for trading. The upper limit of the Goldilocks zone indicates a market stretch too far for advantageous trading (overextension), while the lower limit suggests inadequate market movement for entry (underextension). Trading within the Goldilocks zone is deemed optimal, as it signifies sufficient but not excessive volatility for entering trades, aligning with either the long or short baseline recommendations. Moreover, the mean of the Goldilocks zone serves as a critical indicator, offering a median reference point that aligns closely with the market's current state. This mean is pivotal for traders, as it represents a 'just right' condition for market entry, embodying the essence of the Goldilocks principle in financial trading strategies.
• Signal Indicators and Entry Points: The chart includes with green or red dots to signify valid price points within the Goldilocks zone, indicative of conducive trading conditions. Furthermore, small directional arrows at the chart's bottom highlight potential long or short entry points, validated by the Goldilocks zone's parameters.
• Data Table: A table presenting real-time statistics from the current candle backward through the chosen range offers insights into win rates and other relevant data, aiding in informed decision-making. This table adapts with each new candle, highlighting the most favorable win rates for both long and short positions.
█ Optimizing Strategy with Backtesting
Optimizing a trading strategy with backtesting involves rigorously testing the strategy on historical data to evaluate its performance and robustness before applying it in live markets. The GKD-M Stepped Baseline Optimizer incorporates advanced backtesting capabilities, offering both cumulative and rolling window types of backtests. Here's how each backtest type operates and the insights they provide for refining trading strategies:
Cumulative Backtest
• Overview: A cumulative backtest evaluates a strategy's performance over a continuous period without resetting the strategy parameters or the simulated trading capital at the beginning of each new period.
• Utility: This type is useful for understanding a strategy's long-term viability, assessing how it adapts to different market conditions over an extended timeframe.
• Interpreting Statistics: Cumulative backtest results often focus on overall return, drawdowns, win rate, and the Sharpe ratio. A strategy with consistent returns, manageable drawdowns, a high win rate, and a favorable Sharpe ratio is considered robust.
Rolling Window Backtest
• Overview: Unlike the cumulative approach, a rolling window backtest divides the historical data into smaller, overlapping or non-overlapping periods (windows), running the strategy separately on each. After each window, the strategy parameters and simulated trading capital are reset.
• Utility: This method is invaluable for assessing a strategy's consistency and adaptability to various market phases. It helps identify if the strategy's performance is dependent on specific market conditions.
• Interpreting Statistics: For rolling window backtests, consistency is key. Look for similar performance metrics (returns, drawdowns, win rate) across different windows. Variability in performance indicates sensitivity to market conditions, suggesting the need for strategy adjustments.
Strategy Refinement Through Backtest Statistics
• Net Profit and Loss: Measures the strategy’s overall effectiveness. Consistent profitability across different market conditions is a positive indicator.
• Win Rate and Profit Factor: High win rates and profit factors indicate a strategy's efficiency in capturing gains over losses.
• Average Profit per Trade: Understanding the strategy's ability to generate profit on a per-trade basis can highlight its operational efficiency.
• Average Number of Bars in Trade: This metric helps understand the strategy's market exposure and timing efficiency.
█ Exporting Data and Integration with GKD Backtests
The GKD-M Stepped Baseline Optimizer seamlessly integrates with the broader GKD trading system, allowing traders to export the optimization data and leverage it within the various GKD backtest modules. This feature allows users to forward the GKD-M Stepped Baseline Optimizer adaptive signals to a GKD backtest to be used as a Baseline component in a GKD trading system.
█ Moving Averages included in the Stepped Baseline Optimizer
The GKD-M Stepped Baseline Optimizer incorporates an extensive array of over 65 moving averages, each with unique characteristics and implications for trading strategy development. This comprehensive suite enables traders to conduct nuanced analysis and optimization, ensuring the selection of the most effective moving average for Baseline input into their GKD trading system.
Adaptive Moving Average - AMA
ADXvma - Average Directional Volatility Moving Average
Ahrens Moving Average
Alexander Moving Average - ALXMA
Coral
Deviation Scaled Moving Average - DSMA
Donchian
Double Exponential Moving Average - DEMA
Double Smoothed Exponential Moving Average - DSEMA
Double Smoothed FEMA - DSFEMA
Double Smoothed Range Weighted EMA - DSRWEMA
Double Smoothed Wilders EMA - DSWEMA
Double Weighted Moving Average - DWMA
Ehlers Optimal Tracking Filter - EOTF
Exponential Moving Average - EMA
Fast Exponential Moving Average - FEMA
Fractal Adaptive Moving Average - FRAMA
Generalized DEMA - GDEMA
Generalized Double DEMA - GDDEMA
Geometric Mean Moving Average
Hull Moving Average (Type 1) - HMA1
Hull Moving Average (Type 2) - HMA2
Hull Moving Average (Type 3) - HMA3
Hull Moving Average (Type 4) - HMA4
IE/2 - Early T3 by Tim Tilson
Integral of Linear Regression Slope - ILRS
Instantaneous Trendline
Kalman Filter
Kaufman Adaptive Moving Average - KAMA
Laguerre Filter
Leader Exponential Moving Average
Linear Regression Value - LSMA (Least Squares Moving Average)
Linear Weighted Moving Average - LWMA
McGinley Dynamic
McNicholl EMA
Non-Lag Moving Average
Ocean NMA Moving Average - ONMAMA
One More Moving Average - OMA
Parabolic Weighted Moving Average
Probability Density Function Moving Average - PDFMA
Quadratic Regression Moving Average - QRMA
Range Filter
Range Weighted EMA - RWEMA
Recursive Moving Trendline
Regularized EMA - REMA
Simple Decycler - SDEC
Simple Loxx Moving Average - SLMA
Simple Moving Average - SMA
Sine Weighted Moving Average
Smoothed LWMA - SLWMA
Smoothed Moving Average - SMMA
Smoother
Super Smoother
T3
Tether Lines
Three-pole Ehlers Butterworth
Three-pole Ehlers Smoother
Triangular Moving Average - TMA
Triangle Moving Average Generalized
Triple Exponential Moving Average - TEMA
Two-pole Ehlers Butterworth
Two-pole Ehlers smoother
Ultimate Smoother
Variable Index Dynamic Average - VIDYA
Variable Moving Average - VMA
Volume Weighted EMA - VEMA
Volume Weighted Moving Average - VWMA
Zero-Lag DEMA - Zero Lag Double Exponential Moving Average
Zero-Lag Moving Average
Zero Lag TEMA - Zero Lag Triple Exponential Moving Average
█ Volatility Types and Filtering
The GKD-M Stepped Baseline Optimizer features a comprehensive selection of over 15 volatility types, each tailored to capture different aspects of market behavior and risk.
Volatility Ticker Selection: Enables direct incorporation of external volatility indicators like VIX and EUVIX into the script for market sentiment analysis, signal filtering enhancement, and real-time risk management adjustments.
Standard Deviation of Logarithmic Returns: Quantifies asset volatility using the standard deviation applied to logarithmic returns, capturing symmetric price movements and financial returns' compound nature.
Exponential Weighted Moving Average (EWMA) for Volatility: Focuses on recent market information by applying exponentially decreasing weights to squared logarithmic returns, offering a dynamic view of market volatility.
Roger-Satchell Volatility Measure: Estimates asset volatility by analyzing the high, low, open, and close prices, providing a nuanced view of intraday volatility and market dynamics.
Close-to-Close Volatility Measure: Calculates volatility based on the closing prices of stocks, offering a streamlined but limited perspective on market behavior.
Parkinson Volatility Measure: Enhances volatility estimation by including high and low prices of the trading day, capturing a more accurate reflection of intraday market movements.
Garman-Klass Volatility Measure: Incorporates open, high, low, and close prices for a comprehensive daily volatility measure, capturing significant price movements and market activity.
Yang-Zhang Volatility Measure: Offers an efficient estimation of stock market volatility by combining overnight and intraday price movements, capturing opening jumps and overall market dynamics.
Garman-Klass-Yang-Zhang Volatility Measure: Merges the benefits of Garman-Klass and Yang-Zhang measures, providing a fuller picture of market volatility including opening market reactions.
Pseudo GARCH(2,2) Volatility Model: Mimics a GARCH(2,2) process using exponential moving averages of squared returns, highlighting volatility shocks and their future impact.
ER-Adaptive Average True Range (ATR): Adjusts the ATR period length based on market efficiency, offering a volatility measure that adapts to changing market conditions.
Adaptive Deviation: Dynamically adjusts its calculation period to offer a nuanced measure of volatility that responds to the market's intrinsic rhythms.
Median Absolute Deviation (MAD): Provides a robust measure of statistical variability, focusing on deviations from the median price, offering resilience against outliers.
Mean Absolute Deviation (MAD): Measures the average magnitude of deviations from the mean price, facilitating a straightforward understanding of volatility.
ATR (Average True Range): Finds the average of true ranges over a specified period, indicating the expected price movement and market volatility.
True Range Double (TRD): Offers a nuanced view of volatility by considering a broader range of price movements, identifying significant market sentiment shifts.
Tìm kiếm tập lệnh với "GOLD"

SuperTrade ST1 StrategyOverview
The SuperTrade ST1 Strategy is a long-only trend-following strategy that combines a Supertrend indicator with a 200-period EMA filter to isolate high-probability bullish trade setups. It is designed to operate in trending markets, using volatility-based exits with a strict 1:4 Risk-to-Reward (R:R) ratio, meaning that each trade targets a profit 4× the size of its predefined risk.
This strategy is ideal for traders looking to align with medium- to long-term trends, while maintaining disciplined risk control and minimal trade frequency.
How It Works
This strategy leverages three key components:
Supertrend Indicator
A trend-following indicator based on Average True Range (ATR).
Identifies bullish/bearish trend direction by plotting a trailing stop line that moves with price volatility.
200-period Exponential Moving Average (EMA) Filter
Trades are only taken when the price is above the EMA, ensuring participation only during confirmed uptrends.
Helps filter out counter-trend entries during market pullbacks or ranges.
ATR-Based Stop Loss and Take Profit
Each trade uses the ATR to calculate volatility-adjusted exit levels.
Stop Loss: 1× ATR below entry.
Take Profit: 4× ATR above entry (1:4 R:R).
This asymmetry ensures that even with a lower win rate, the strategy can remain profitable.
Entry Conditions
A long trade is triggered when:
Supertrend flips from bearish to bullish (trend reversal).
Price closes above the Supertrend line.
Price is above the 200 EMA (bullish market bias).
Exit Logic
Once a long position is entered:
Stop loss is set 1 ATR below entry.
Take profit is set 4 ATR above entry.
The strategy automatically exits the position on either target.
Backtest Settings
This strategy is configured for realistic backtesting, including:
$10,000 account size
2% equity risk per trade
0.1% commission
1 tick slippage
These settings aim to simulate real-world conditions and avoid overly optimistic results.
How to Use
Apply the script to any timeframe, though higher timeframes (1H, 4H, Daily) often yield more reliable signals.
Works best in clearly trending markets (especially in crypto, stocks, indices).
Can be paired with alerts for live trading or analysis.
Important Notes
This version is long-only by design. No short positions are executed.
Ideal for swing traders or position traders seeking asymmetric returns.
Users can modify the ATR period, Supertrend factor, or EMA filter length based on asset behavior.

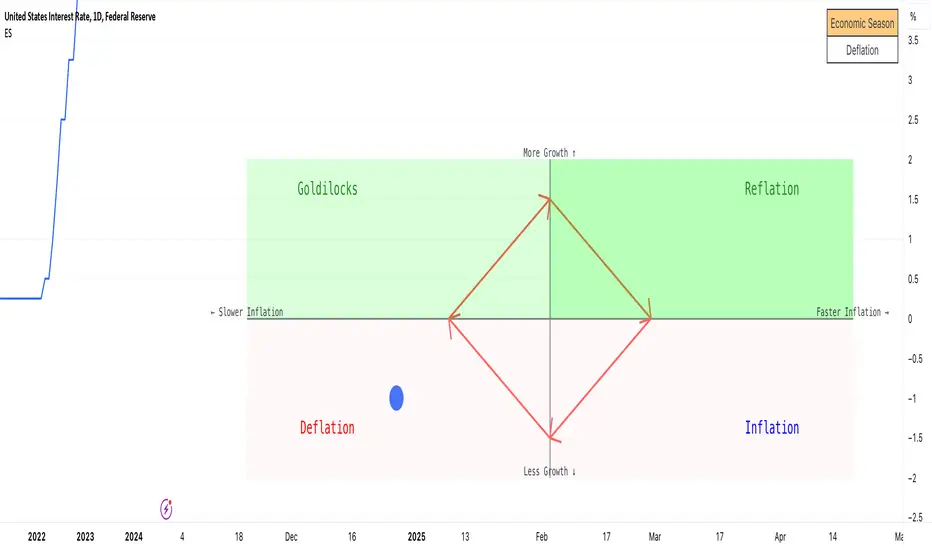
Economic Seasons [Daveatt]Ever wondered what season your economy is in?
Just like Mother Nature has her four seasons, the economy cycles through its own seasons! This indicator helps you visualize where we are in the economic cycle by tracking two key metrics:
📊 What We're Tracking:
1. Interest Rates (USIRYY) - The yearly change in interest rates
2. Inflation Rate (USINTR) - The rate at which prices are rising
The magic happens when we normalize these values (fancy math that makes the numbers play nice together) and compare them to their recent averages. We use a lookback period to calculate the standard deviation and determine if we're seeing higher or lower than normal readings.
🔄 The Four Economic Seasons & Investment Strategy:
1. 🌸 Goldilocks (↑Growth, ↓Inflation)
"Not too hot, not too cold" - The economy is growing steadily without overheating.
BEST TIME TO: Buy growth stocks, technology, consumer discretionary
WHY: Companies can grow earnings in this ideal environment of low rates and stable prices
2. 🌞 Reflation (↑Growth, ↑Inflation)
"Party time... but watch your wallet!" - The economy is heating up.
BEST TIME TO: Buy commodities, banking stocks, real estate
WHY: These sectors thrive when inflation rises alongside growth
3. 🌡️ Inflation (↓Growth, ↑Inflation)
"Ouch, my purchasing power!" - Growth slows while prices keep rising.
BEST TIME TO: Rotate into value stocks, consumer staples, healthcare
WHY: These defensive sectors maintain pricing power during inflationary periods
4. ❄️ Deflation (↓Growth, ↓Inflation)
"Winter is here" - Both growth and inflation are falling.
BEST TIME TO: Focus on quality bonds, cash positions, and dividend aristocrats
WHY: Capital preservation becomes key; high-quality fixed income provides safety
🎯 Strategic Trading Points:
- BUY AGGRESSIVELY: During late Deflation/early Goldilocks (the spring thaw)
- HOLD & ACCUMULATE: Throughout Goldilocks and early Reflation
- START TAKING PROFITS: During late Reflation/early Inflation
- DEFENSIVE POSITIONING: Throughout Inflation and Deflation
⚠️ Warning Signs to Watch:
- Goldilocks → Reflation: Time to reduce growth stock exposure
- Reflation → Inflation: Begin rotating into defensive sectors
- Inflation → Deflation: Quality becomes crucial
- Deflation → Goldilocks: Start building new positions
The blue dot shows you where we are right now in this cycle.
The red arrows in the middle remind us that this is a continuous cycle - one season flows into the next, just like in nature!
💡 Pro Tip: The transitions between seasons often provide the best opportunities - but also the highest risks. Use additional indicators and fundamental analysis to confirm these shifts.
Remember: Just like you wouldn't wear a winter coat in summer, you shouldn't use a Goldilocks strategy during Inflation! Time your trades with the seasons. 🎯
Happy Trading! 📈
Liquidity Sweep Guardian (Universal % or point based)
Liquidity Sweep Guardian - Complete User Guide
## Overview
The **Liquidity Sweep Guardian** is a visual warning system designed to prevent premature counter-trend trades (fades) near Previous Day High (PDH) and Previous Day Low (PDL) levels. This indicator helps you avoid one of the most common trading mistakes: fading too early before liquidity sweeps complete.
---
## 🎯 Core Trading Principle
### **THE GOLDEN RULE: Don't Fade Until It's Unlocked**
Price often **accelerates into key levels** to sweep liquidity before reversing. Trading against this momentum is extremely dangerous.
**The Process:**
1. **Danger Zone** (Red/White Box) = ⚠️ **DO NOT FADE** - Sweep likely incoming
2. **Sweep Occurs** (Triangle marker appears) = Price penetrates the level
3. **Reclaim Happens** (Price returns above/below level) = Level is tested
4. **🔓 UNLOCKED** (Gold border, green label) = **NOW you may CONSIDER a fade**
> **Important:** "UNLOCKED" means you may now *consider* a fade setup. It is NOT a trade signal itself. You still need your entry confirmation, risk management, and trade plan.
---
## 📊 Visual Elements Explained
### 1. **Danger Zone Boxes (Red Border by Default)**
**Two types of zones around PDH/PDL:**
- **Outer Danger Zone** (White fill): ±75pts (or 0.30%) around the level
- Indicates proximity to a key level where sweeps commonly occur
- Yellow/cautious trading zone
- **Inner Critical Zone** (Black fill): ±25pts (or 0.10%) around the level
- Highest probability area for liquidity sweep traps
- Avoid fading here at all costs
**What to do:**
- When price enters these zones, **wait and watch**
- Do not initiate counter-trend positions
- Allow the sweep to play out
### 2. **Unlocked Zones (Gold Border #ffeb3b)**
When a zone turns **gold/yellow** with green fill:
- The level has been swept AND reclaimed
- The liquidity grab is complete
- You may now look for fade opportunities with proper confirmation
### 3. **PDH/PDL Lines**
- **PDH Line** (Red): Previous Day High with price label
- **PDL Line** (Green): Previous Day Low with price label
- These are your key reference levels for the session
### 4. **Sweep Labels**
**Triangle Markers (SWEEP):**
- **Green Triangle** = Clean sweep (10-25pts penetration)
- **Orange Triangle** = Extended sweep (25-50pts penetration)
- **Red Triangle** = Deep penetration (50+ pts) - likely continuation, not reversal
**Warning Labels:**
- **⚠️ DEEP CONTINUATION?** = Penetration too deep, probably NOT a reversal setup
**Unlock Labels:**
- **🔓 LONG UNLOCKED** = PDL swept and reclaimed, may consider long fades
- **🔓 SHORT UNLOCKED** = PDH swept and reclaimed, may consider short fades
---
## ⚙️ Settings Guide
### **Calculation Mode**
**Use Percentage Mode (Default: ON)**
- ✅ **Enabled**: Universal mode - works on NQ, ES, RTY, stocks, crypto, forex
- ❌ **Disabled**: Fixed points mode - for specific instruments only
**When to use each:**
- **Percentage Mode**: Trading multiple instruments, or instruments with varying price levels
- **Fixed Points Mode**: Single instrument focus (e.g., only trading NQ at current levels)
### **Danger Zone Settings**
**Percentage Mode (Default for Universal Use):**
- **Danger Zone**: 0.30% each side (≈75pts on NQ@25,000)
- **Critical Zone**: 0.10% each side (≈25pts on NQ@25,000)
**Fixed Points Mode (For NQ Specifically):**
- **Danger Zone**: 75 points each side
- **Critical Zone**: 25 points each side
**Adjustment Tips:**
- For more volatile instruments: Increase percentages/points
- For less volatile instruments: Decrease percentages/points
- For higher timeframes: Use wider zones
- For lower timeframes: Use tighter zones
### **Sweep Classification**
**What defines a "real" sweep:**
- **Minimum**: 10pts / 0.04% - Shallow penetration may not grab enough liquidity
- **Optimal**: 10-25pts / 0.04-0.10% - "Goldilocks zone" for reversal setups
- **Extended**: 25-50pts / 0.10-0.20% - Deeper sweep, less reliable
- **Continuation**: 50+pts / 0.20%+ - Too deep, likely NOT reversing
**Max Bars for Reclaim**: 5 bars (default)
- Price should reclaim the level relatively quickly
- If it takes too long, the sweep may have failed
### **Visual Customization**
**Box Settings:**
- **Left Extension**: 60 bars (how far back the box extends)
- **Right Extension**: 50 bars (how far forward the box extends)
**Toggle Options:**
- Show/Hide Danger Zone Boxes
- Show/Hide PDH/PDL Lines
- Show/Hide Price Labels on lines
- Show/Hide Sweep Labels
- Show/Hide Unlock Labels
### **Color Customization**
All colors are fully customizable:
- Danger Zone Fill & Border
- Critical Zone Fill & Border
- Unlocked Zone Fill & Border
- PDH/PDL Line Colors
- PDH/PDL Label Colors
- Border Widths (1-5 pixels)
- Line Widths (1-5 pixels)
---
## 🎓 Trading Strategy Examples
### **Example 1: Long Setup at PDL**
1. **Morning**: Price approaches PDL (danger zone appears)
2. **Don't Fade Yet**: Price enters critical zone - resist urge to buy
3. **Sweep**: Price drops 15pts below PDL (green triangle appears)
4. **Reclaim**: Price closes back above PDL within 3 bars
5. **🔓 UNLOCKED**: Gold border + "LONG UNLOCKED" label appears
6. **Trade Setup**: Now look for bullish confirmation (order flow, structure, etc.)
### **Example 2: Avoiding a Trap at PDH**
1. **Afternoon**: Price rallies into PDH danger zone
2. **Temptation**: You want to short here (it "looks toppy")
3. **Sweep**: Price breaks 50pts above PDH (red triangle + ⚠️ warning)
4. **Continuation**: Deep penetration suggests continuation, not reversal
5. **Result**: No unlock occurs, price keeps running higher - trap avoided!
### **Example 3: Failed Unlock (No Trade)**
1. Price sweeps PDL by 12pts (green triangle)
2. Price struggles to reclaim PDL, stays below for 10+ bars
3. No "UNLOCKED" label appears
4. **Correct Action**: Do not fade - sweep failed to reclaim
---
## 📱 Alerts
The indicator includes built-in alerts for:
- **Entering Danger Zones**: Get warned when price approaches PDH/PDL
- **Sweep Detection**: Know immediately when a level is swept
- **Unlock Signals**: Get notified when fade setups become available
- **Continuation Warnings**: Alert when penetration suggests continuation
**To Set Alerts:**
1. Right-click indicator → "Add Alert"
2. Select desired alert condition
3. Configure notification preferences
---
## ⚠️ Important Disclaimers
### **What This Indicator IS:**
✅ A visual warning system to prevent premature fades
✅ A tool to identify when liquidity sweeps have completed
✅ A framework for counter-trend trade timing
### **What This Indicator IS NOT:**
❌ A complete trading system
❌ An entry signal generator
❌ A guarantee of trade success
❌ A substitute for proper risk management
### **Always Remember:**
- "UNLOCKED" = You may CONSIDER a fade (not a signal to trade)
- You still need your own entry confirmation
- You still need proper stop placement
- You still need position sizing and risk management
- Not every unlock leads to a successful trade
- Market context and order flow still matter
---
## 🔧 Recommended Settings by Instrument
### **NQ (Nasdaq-100 E-mini Futures)**
- Mode: Percentage or Fixed Points
- Percentage: 0.30% / 0.10% (default)
- Fixed Points: 75pts / 25pts (default)
### **ES (S&P 500 E-mini Futures)**
- Mode: Percentage
- Danger: 0.25% / Critical: 0.08%
- Or Fixed Points: 15pts / 5pts
### **RTY (Russell 2000 E-mini Futures)**
- Mode: Percentage
- Danger: 0.35% / Critical: 0.12%
- Or Fixed Points: 8pts / 3pts
### **Stocks (High Volume Large Caps)**
- Mode: Percentage (recommended)
- Danger: 0.20-0.40% / Critical: 0.08-0.15%
- Adjust based on ATR and volatility
### **Crypto (BTC, ETH)**
- Mode: Percentage (essential)
- Danger: 0.40-0.60% / Critical: 0.15-0.20%
- Higher volatility requires wider zones
---
## 💡 Pro Tips
1. **Use on Higher Timeframes**: Works best on 5min, 15min, 1hr charts
2. **Combine with Order Flow**: Use with footprint/delta for confirmation
3. **Watch Volume**: Strong volume on sweep = better reversal potential
4. **Consider Time of Day**: Sweeps during RTH often more reliable
5. **Multiple Timeframes**: Check if higher TF also shows unlock
6. **Don't Force Trades**: Not every session produces clean setups
7. **Journal Results**: Track which unlock types work best for you
8. **Respect Continuation Signals**: When indicator says "too deep," listen
---
## 🆘 Troubleshooting
**Q: Box isn't showing up**
A: Check that "Show Danger Zone Boxes" is enabled in Visual Settings
**Q: No price on labels**
A: Enable "Show Price Labels on Lines" in Visual Settings
**Q: Zones seem too tight/wide**
A: Adjust Danger Zone % or points based on current volatility
**Q: Getting too many/too few unlocks**
A: Adjust sweep classification thresholds (min/max penetration)
**Q: Want thicker/thinner lines**
A: Adjust line widths in "PDH/PDL Line Colors" section
**Q: Colors not matching my chart theme**
A: Fully customize all colors in the color settings groups
---
## 📚 Additional Resources
- Study price action around PDH/PDL on your instruments
- Learn about liquidity sweeps and stop hunts
- Understand market structure and order flow
- Practice identifying setups on replay/historical data
- Keep a trading journal of unlock scenarios
---
*Remember: The best trade is often the one you don't take. This indicator helps you avoid the trades you shouldn't take, so you can focus on the ones you should.*

Indian Market Trend
# Indian Market Trend
## **Know The Trend BEFORE It Happens - Institutional-Grade Market Intelligence**
### **🎯 Why This Indicator is Different:**
Most indicators tell you what **already happened**. This institutional-grade tool tells you what's **about to happen** by analyzing the **synchronized behavior of 40 major Indian stocks** in real-time.
***
## **📊 THREE POWERFUL ANALYSIS TABLES**
### **1️⃣ CORRELATION ANALYSIS TABLE**
- **Real-time correlation** of 40 NSE stocks with your chart symbol
- **Implied Trend Calculation** - The secret sauce that shows market direction BEFORE price confirms
- **Positive Implied Trend** = Stocks moving UP together (Bullish Confirmation)
- **Negative Implied Trend** = Stocks moving DOWN together (Bearish Warning)
- Fully customizable: Choose which stocks to analyze and table position
### **2️⃣ MARKET REGIME ANALYSIS TABLE**
Institutional-grade regime detection across **4 major market conditions:**
- **🟢 GOLDILOCKS REGIME** - Perfect growth environment (Risk-On)
- **🟡 REFLATION REGIME** - Economic recovery phase (High Beta Rally)
- **🔴 INFLATION REGIME** - Defensive rotation (Protect Capital)
- **🔵 DEFLATION REGIME** - Risk-off environment (Safe Havens)
**Each regime shows:**
- Top 5 performing equity style factors
- Bottom 5 underperforming factors
- Probability score for each regime
- **RISK ON/RISK OFF** status with real-time calculation
### **3️⃣ TOP/BOTTOM PERFORMERS TABLE**
- **Real-time ranking** of best and worst performing stocks
- Adjustable display (5-20 stocks)
- Shows relative strength vs market average
- Perfect for stock selection and sector rotation
***
## **🚀 THE EDGE: IMPLIED CORRELATION INDICATOR**
### **This is where the magic happens:**
The **Implied Correlation Plot** combines:
1. **Correlation Strength** - How stocks move together
2. **KAMA Trend Analysis** - Institutional adaptive moving average
3. **Directional Bias** - Market sentiment calculation
### **How to Read It:**
✅ **POSITIVE VALUES (Green Bars)**
- Stocks are moving UP in sync
- Strong bullish momentum
- High confidence in uptrend continuation
- **ACTION: Stay long, add on dips**
❌ **NEGATIVE VALUES (Red Bars)**
- Stocks are moving DOWN together
- Strong bearish pressure
- High confidence in downtrend continuation
- **ACTION: Reduce exposure, wait for reversal**
⚪ **NEAR ZERO (Gray Bars)**
- Market is confused/consolidating
- Low directional conviction
- Wait for clarity
- **ACTION: No new positions, tight stops**
### **The Institutional Advantage:**
When you see **strong green bars forming** → Market is building bullish pressure **BEFORE** your main chart shows a clear breakout!
When you see **strong red bars forming** → Market is building bearish pressure **BEFORE** your main chart breaks down!
**This is your early warning system!** 🎯
***
## **🎛️ FULLY CUSTOMIZABLE**
### **Table Controls:**
- ✅ Enable/Disable each table independently
- 📍 Position tables anywhere (Top/Middle/Bottom × Left/Center/Right)
- 📏 Adjustable text size for all displays
- 🎨 Clean, professional interface
### **Stock Selection:**
- **40 Pre-loaded NSE stocks** (Nifty 50 constituents)
- Fully editable - Replace ANY stock with your preferred symbols
- Works with NSE, BSE, or any exchange
- Perfect for sectoral analysis
### **Technical Parameters:**
- **Correlation Length** (Default: 14 days)
- **ROC Period** (Default: 14 days)
- **KAMA Settings** (Fast: 7, Slow: 19, ER: 8)
- **Display Options** (Number of stocks in each table)
***
## **📈 TRADING APPLICATIONS**
### **For Day Traders:**
- Early trend detection before price confirms
- Market regime identification for strategy selection
- Real-time sector rotation signals
### **For Swing Traders:**
- Multi-day trend confirmation
- Risk-on/Risk-off regime detection
- Top performer identification for swing entries
### **For Position Traders:**
- Long-term market regime analysis
- Portfolio rotation based on market conditions
- Macro trend confirmation
### **For Portfolio Managers:**
- Institutional-grade market regime framework
- 40-stock basket analysis
- Systematic rotation signals
***
## **🏆 KEY FEATURES**
✅ **40 Major Indian Stocks** - Comprehensive market coverage
✅ **3 Analysis Tables** - Correlation, Regime, Performance
✅ **Implied Correlation Plot** - Leading trend indicator
✅ **KAMA Trend Engine** - Adaptive institutional algorithm
✅ **Regime Detection** - Goldilocks/Reflation/Inflation/Deflation
✅ **Fully Customizable** - Every parameter adjustable
✅ **No Repainting** - Signals are final and reliable
✅ **Clean Interface** - Professional institutional design
✅ **Multi-Timeframe** - Works on Daily charts (recommended)
***
## **⚡ QUICK START GUIDE**
1. **Add indicator to Daily chart** of NSE:NIFTY or any Indian stock
2. **Enable all 3 tables** from "Table Controls" section (default: ON)
3. **Watch Implied Correlation plot** in indicator window:
- Green bars = Bullish strength building
- Red bars = Bearish pressure building
- Gray bars = Wait for clarity
4. **Check Market Regime Table** - Which regime has highest probability?
5. **Scan Top Performers Table** - Find strongest stocks for entries
6. **Cross-reference with your price action** - Confirm with chart patterns
***
## **🎓 INSTITUTIONAL METHODOLOGY**
This indicator uses the same frameworks employed by:
- Hedge funds for market regime detection
- Proprietary trading desks for correlation analysis
- Risk management teams for portfolio positioning
- Quantitative analysts for systematic signals
**The Normalized KAMA Oscillator** by IkkeOmar provides institutional-grade trend detection with adaptive smoothing that responds to market efficiency.
**The Implied Correlation Framework** measures market synchronization - when stocks move together with conviction, trends are more reliable and persistent.
***
## **💡 PRO TIPS**
1. **Best Results:** Use on Daily timeframe for most reliable signals
2. **Strong Signals:** Implied Correlation > 0.15 or < -0.15 = High conviction
3. **Regime Changes:** Watch for probability shifts between regimes
4. **Divergences:** If top performers weaken while index rises = Warning signal
5. **Confirmation:** Wait for 2-3 consecutive bars in same direction for stronger confidence
***
## **⚠️ RISK DISCLAIMER**
This indicator is a **decision support tool**, not financial advice. Always:
- Use proper risk management
- Combine with your own analysis
- Test on demo/paper trading first
- Never risk more than you can afford to lose
- Past performance doesn't guarantee future results
***
## **📞 SUPPORT & UPDATES**
- Regular updates with market condition changes
- Community feedback incorporated
- Bug fixes and optimizations
- Documentation and video tutorials (coming soon)
***
## **🌟 WHY TRADERS LOVE THIS INDICATOR**
✅ **"Finally see the market BEFORE it moves!"**
✅ **"Three tables give complete market picture"**
✅ **"Regime detection is game-changing"**
✅ **"Professional institutional tool for retail traders"**
✅ **"Clean, customizable, reliable"**
***
## **📊 INDICATOR SPECIFICATIONS**
- **Type:** Oscillator / Market Analysis
- **Overlay:** No (Separate pane)
- **Inputs:** 40 stock symbols + multiple parameters
- **Outputs:** 3 tables + 1 plot line
- **Repainting:** No
- **Alerts:** Compatible (can be added)
- **Multi-timeframe:** Yes (Daily recommended)
***
## **🎯 START TRADING WITH CONFIDENCE**
**Know the trend BEFORE the crowd!**
The market doesn't move in straight lines - it moves in **synchronized waves**. When you can measure that synchronization across 40 major stocks, you have an **institutional edge** that retail traders never see.
**Install now and experience the difference!** 🚀
***
**Tags:** #Indian #NSE #Nifty50 #Correlation #MarketRegime #TrendAnalysis #Institutional #KAMA #Performance #TopPerformers #RiskOn #RiskOff #Goldilocks #Reflation #ImpliedCorrelation
***
**Version:** 1.0
**Last Updated:** December 2025
**Compatible:** TradingView Pine Script v6
***
Feel free to ask questions in the comments! I actively respond to user feedback and continuously improve this indicator based on community needs.
**Happy Trading! 📈🎯**
***

ORB Fusion🎯 CORE INNOVATION: INSTITUTIONAL ORB FRAMEWORK WITH FAILED BREAKOUT INTELLIGENCE
ORB Fusion represents a complete institutional-grade Opening Range Breakout system combining classic Market Profile concepts (Initial Balance, day type classification) with modern algorithmic breakout detection, failed breakout reversal logic, and comprehensive statistical tracking. Rather than simply drawing lines at opening range extremes, this system implements the full trading methodology used by professional floor traders and market makers—including the critical concept that failed breakouts are often higher-probability setups than successful breakouts .
The Opening Range Hypothesis:
The first 30-60 minutes of trading establishes the day's value area —the price range where the majority of participants agree on fair value. This range is formed during peak information flow (overnight news digestion, gap reactions, early institutional positioning). Breakouts from this range signal directional conviction; failures to hold breakouts signal trapped participants and create exploitable reversals.
Why Opening Range Matters:
1. Information Aggregation : Opening range reflects overnight news, pre-market sentiment, and early institutional orders. It's the market's initial "consensus" on value.
2. Liquidity Concentration : Stop losses cluster just outside opening range. Breakouts trigger these stops, creating momentum. Failed breakouts trap traders, forcing reversals.
3. Statistical Persistence : Markets exhibit range expansion tendency —when price accepts above/below opening range with volume, it often extends 1.0-2.0x the opening range size before mean reversion.
4. Institutional Behavior : Large players (market makers, institutions) use opening range as reference for the day's trading plan. They fade extremes in rotation days and follow breakouts in trend days.
Historical Context:
Opening Range Breakout methodology originated in commodity futures pits (1970s-80s) where floor traders noticed consistent patterns: the first 30-60 minutes established a "fair value zone," and directional moves occurred when this zone was violated with conviction. J. Peter Steidlmayer formalized this observation in Market Profile theory, introducing the "Initial Balance" concept—the first hour (two 30-minute periods) defining market structure.
📊 OPENING RANGE CONSTRUCTION
Four ORB Timeframe Options:
1. 5-Minute ORB (0930-0935 ET):
Captures immediate market direction during "opening drive"—the explosive first few minutes when overnight orders hit the tape.
Use Case:
• Scalping strategies
• High-frequency breakout trading
• Extremely liquid instruments (ES, NQ, SPY)
Characteristics:
• Very tight range (often 0.2-0.5% of price)
• Early breakouts common (7 of 10 days break within first hour)
• Higher false breakout rate (50-60%)
• Requires sub-minute chart monitoring
Psychology: Captures panic buyers/sellers reacting to overnight news. Range is small because sample size is minimal—only 5 minutes of price discovery. Early breakouts often fail because they're driven by retail FOMO rather than institutional conviction.
2. 15-Minute ORB (0930-0945 ET):
Balances responsiveness with statistical validity. Captures opening drive plus initial reaction to that drive.
Use Case:
• Day trading strategies
• Balanced scalping/swing hybrid
• Most liquid instruments
Characteristics:
• Moderate range (0.4-0.8% of price typically)
• Breakout rate ~60% of days
• False breakout rate ~40-45%
• Good balance of opportunity and reliability
Psychology: Includes opening panic AND the first retest/consolidation. Sophisticated traders (institutions, algos) start expressing directional bias. This is the "Goldilocks" timeframe—not too reactive, not too slow.
3. 30-Minute ORB (0930-1000 ET):
Classic ORB timeframe. Default for most professional implementations.
Use Case:
• Standard intraday trading
• Position sizing for full-day trades
• All liquid instruments (equities, indices, futures)
Characteristics:
• Substantial range (0.6-1.2% of price)
• Breakout rate ~55% of days
• False breakout rate ~35-40%
• Statistical sweet spot for extensions
Psychology: Full opening auction + first institutional repositioning complete. By 10:00 AM ET, headlines are digested, early stops are hit, and "real" directional players reveal themselves. This is when institutional programs typically finish their opening positioning.
Statistical Advantage: 30-minute ORB shows highest correlation with daily range. When price breaks and holds outside 30m ORB, probability of reaching 1.0x extension (doubling the opening range) exceeds 60% historically.
4. 60-Minute ORB (0930-1030 ET) - Initial Balance:
Steidlmayer's "Initial Balance"—the foundation of Market Profile theory.
Use Case:
• Swing trading entries
• Day type classification
• Low-frequency institutional setups
Characteristics:
• Wide range (0.8-1.5% of price)
• Breakout rate ~45% of days
• False breakout rate ~25-30% (lowest)
• Best for trend day identification
Psychology: Full first hour captures A-period (0930-1000) and B-period (1000-1030). By 10:30 AM ET, all early positioning is complete. Market has "voted" on value. Subsequent price action confirms (trend day) or rejects (rotation day) this value assessment.
Initial Balance Theory:
IB represents the market's accepted value area . When price extends significantly beyond IB (>1.5x IB range), it signals a Trend Day —strong directional conviction. When price remains within 1.0x IB, it signals a Rotation Day —mean reversion environment. This classification completely changes trading strategy.
🔬 LTF PRECISION TECHNOLOGY
The Chart Timeframe Problem:
Traditional ORB indicators calculate range using the chart's current timeframe. This creates critical inaccuracies:
Example:
• You're on a 5-minute chart
• ORB period is 30 minutes (0930-1000 ET)
• Indicator sees only 6 bars (30min ÷ 5min/bar = 6 bars)
• If any 5-minute bar has extreme wick, entire ORB is distorted
The Problem Amplifies:
• On 15-minute chart with 30-minute ORB: Only 2 bars sampled
• On 30-minute chart with 30-minute ORB: Only 1 bar sampled
• Opening spike or single large wick defines entire range (invalid)
Solution: Lower Timeframe (LTF) Precision:
ORB Fusion uses `request.security_lower_tf()` to sample 1-minute bars regardless of chart timeframe:
```
For 30-minute ORB on 15-minute chart:
- Traditional method: Uses 2 bars (15min × 2 = 30min)
- LTF Precision: Requests thirty 1-minute bars, calculates true high/low
```
Why This Matters:
Scenario: ES futures, 15-minute chart, 30-minute ORB
• Traditional ORB: High = 5850.00, Low = 5842.00 (range = 8 points)
• LTF Precision ORB: High = 5848.50, Low = 5843.25 (range = 5.25 points)
Difference: 2.75 points distortion from single 15-minute wick hitting 5850.00 at 9:31 AM then immediately reversing. LTF precision filters this out by seeing it was a fleeting wick, not a sustained high.
Impact on Extensions:
With inflated range (8 points vs 5.25 points):
• 1.5x extension projects +12 points instead of +7.875 points
• Difference: 4.125 points (nearly $200 per ES contract)
• Breakout signals trigger late; extension targets unreachable
Implementation:
```pinescript
getLtfHighLow() =>
float ha = request.security_lower_tf(syminfo.tickerid, "1", high)
float la = request.security_lower_tf(syminfo.tickerid, "1", low)
```
Function returns arrays of 1-minute high/low values, then finds true maximum and minimum across all samples.
When LTF Precision Activates:
Only when chart timeframe exceeds ORB session window:
• 5-minute chart + 30-minute ORB: LTF used (chart TF > session bars needed)
• 1-minute chart + 30-minute ORB: LTF not needed (direct sampling sufficient)
Recommendation: Always enable LTF Precision unless you're on 1-minute charts. The computational overhead is negligible, and accuracy improvement is substantial.
⚖️ INITIAL BALANCE (IB) FRAMEWORK
Steidlmayer's Market Profile Innovation:
J. Peter Steidlmayer developed Market Profile in the 1980s for the Chicago Board of Trade. His key insight: market structure is best understood through time-at-price (value area) rather than just price-over-time (traditional charts).
Initial Balance Definition:
IB is the price range established during the first hour of trading, subdivided into:
• A-Period : First 30 minutes (0930-1000 ET for US equities)
• B-Period : Second 30 minutes (1000-1030 ET)
A-Period vs B-Period Comparison:
The relationship between A and B periods forecasts the day:
B-Period Expansion (Bullish):
• B-period high > A-period high
• B-period low ≥ A-period low
• Interpretation: Buyers stepping in after opening assessed
• Implication: Bullish continuation likely
• Strategy: Buy pullbacks to A-period high (now support)
B-Period Expansion (Bearish):
• B-period low < A-period low
• B-period high ≤ A-period high
• Interpretation: Sellers stepping in after opening assessed
• Implication: Bearish continuation likely
• Strategy: Sell rallies to A-period low (now resistance)
B-Period Contraction:
• B-period stays within A-period range
• Interpretation: Market indecisive, digesting A-period information
• Implication: Rotation day likely, stay range-bound
• Strategy: Fade extremes, sell high/buy low within IB
IB Extensions:
Professional traders use IB as a ruler to project price targets:
Extension Levels:
• 0.5x IB : Initial probe outside value (minor target)
• 1.0x IB : Full extension (major target for normal days)
• 1.5x IB : Trend day threshold (classifies as trending)
• 2.0x IB : Strong trend day (rare, ~10-15% of days)
Calculation:
```
IB Range = IB High - IB Low
Bull Extension 1.0x = IB High + (IB Range × 1.0)
Bear Extension 1.0x = IB Low - (IB Range × 1.0)
```
Example:
ES futures:
• IB High: 5850.00
• IB Low: 5842.00
• IB Range: 8.00 points
Extensions:
• 1.0x Bull Target: 5850 + 8 = 5858.00
• 1.5x Bull Target: 5850 + 12 = 5862.00
• 2.0x Bull Target: 5850 + 16 = 5866.00
If price reaches 5862.00 (1.5x), day is classified as Trend Day —strategy shifts from mean reversion to trend following.
📈 DAY TYPE CLASSIFICATION SYSTEM
Four Day Types (Market Profile Framework):
1. TREND DAY:
Definition: Price extends ≥1.5x IB range in one direction and stays there.
Characteristics:
• Opens and never returns to IB
• Persistent directional movement
• Volume increases as day progresses (conviction building)
• News-driven or strong institutional flow
Frequency: ~20-25% of trading days
Trading Strategy:
• DO: Follow the trend, trail stops, let winners run
• DON'T: Fade extremes, take early profits
• Key: Add to position on pullbacks to previous extension level
• Risk: Getting chopped in false trend (see Failed Breakout section)
Example: FOMC decision, payroll report, earnings surprise—anything creating one-sided conviction.
2. NORMAL DAY:
Definition: Price extends 0.5-1.5x IB, tests both sides, returns to IB.
Characteristics:
• Two-sided trading
• Extensions occur but don't persist
• Volume balanced throughout day
• Most common day type
Frequency: ~45-50% of trading days
Trading Strategy:
• DO: Take profits at extension levels, expect reversals
• DON'T: Hold for massive moves
• Key: Treat each extension as a profit-taking opportunity
• Risk: Holding too long when momentum shifts
Example: Typical day with no major catalysts—market balancing supply and demand.
3. ROTATION DAY:
Definition: Price stays within IB all day, rotating between high and low.
Characteristics:
• Never accepts outside IB
• Multiple tests of IB high/low
• Decreasing volume (no conviction)
• Classic range-bound action
Frequency: ~25-30% of trading days
Trading Strategy:
• DO: Fade extremes (sell IB high, buy IB low)
• DON'T: Chase breakouts
• Key: Enter at extremes with tight stops just outside IB
• Risk: Breakout finally occurs after multiple failures
Example: [/b> Pre-holiday trading, summer doldrums, consolidation after big move.
4. DEVELOPING:
Definition: Day type not yet determined (early in session).
Usage: Classification before 12:00 PM ET when IB extension pattern unclear.
ORB Fusion's Classification Algorithm:
```pinescript
if close > ibHigh:
ibExtension = (close - ibHigh) / ibRange
direction = "BULLISH"
else if close < ibLow:
ibExtension = (ibLow - close) / ibRange
direction = "BEARISH"
if ibExtension >= 1.5:
dayType = "TREND DAY"
else if ibExtension >= 0.5:
dayType = "NORMAL DAY"
else if close within IB:
dayType = "ROTATION DAY"
```
Why Classification Matters:
Same setup (bullish ORB breakout) has opposite implications:
• Trend Day : Hold for 2.0x extension, trail stops aggressively
• Normal Day : Take profits at 1.0x extension, watch for reversal
• Rotation Day : Fade the breakout immediately (likely false)
Knowing day type prevents catastrophic errors like fading a trend day or holding through rotation.
🚀 BREAKOUT DETECTION & CONFIRMATION
Three Confirmation Methods:
1. Close Beyond Level (Recommended):
Logic: Candle must close above ORB high (bull) or below ORB low (bear).
Why:
• Filters out wicks (temporary liquidity grabs)
• Ensures sustained acceptance above/below range
• Reduces false breakout rate by ~20-30%
Example:
• ORB High: 5850.00
• Bar high touches 5850.50 (wick above)
• Bar closes at 5848.00 (inside range)
• Result: NO breakout signal
vs.
• Bar high touches 5850.50
• Bar closes at 5851.00 (outside range)
• Result: BREAKOUT signal confirmed
Trade-off: Slightly delayed entry (wait for close) but much higher reliability.
2. Wick Beyond Level:
Logic: [/b> Any touch of ORB high/low triggers breakout.
Why:
• Earliest possible entry
• Captures aggressive momentum moves
Risk:
• High false breakout rate (60-70%)
• Stop runs trigger signals
• Requires very tight stops (difficult to manage)
Use Case: Scalping with 1-2 point profit targets where any penetration = trade.
3. Body Beyond Level:
Logic: [/b> Candle body (close vs open) must be entirely outside range.
Why:
• Strictest confirmation
• Ensures directional conviction (not just momentum)
• Lowest false breakout rate
Example: Trade-off: [/b> Very conservative—misses some valid breakouts but rarely triggers on false ones.
Volume Confirmation Layer:
All confirmation methods can require volume validation:
Volume Multiplier Logic: Rationale: [/b> True breakouts are driven by institutional activity (large size). Volume spike confirms real conviction vs. stop-run manipulation.
Statistical Impact: [/b>
• Breakouts with volume confirmation: ~65% success rate
• Breakouts without volume: ~45% success rate
• Difference: 20 percentage points edge
Implementation Note: [/b>
Volume confirmation adds complexity—you'll miss breakouts that work but lack volume. However, when targeting 1.5x+ extensions (ambitious goals), volume confirmation becomes critical because those moves require sustained institutional participation.
Recommended Settings by Strategy: [/b>
Scalping (1-2 point targets): [/b>
• Method: Close
• Volume: OFF
• Rationale: Quick in/out doesn't need perfection
Intraday Swing (5-10 point targets): [/b>
• Method: Close
• Volume: ON (1.5x multiplier)
• Rationale: Balance reliability and opportunity
Position Trading (full-day holds): [/b>
• Method: Body
• Volume: ON (2.0x multiplier)
• Rationale: Must be certain—large stops require high win rate
🔥 FAILED BREAKOUT SYSTEM
The Core Insight: [/b>
Failed breakouts are often more profitable [/b> than successful breakouts because they create trapped traders with predictable behavior.
Failed Breakout Definition: [/b>
A breakout that:
1. Initially penetrates ORB level with confirmation
2. Attracts participants (volume spike, momentum)
3. Fails to extend (stalls or immediately reverses)
4. Returns inside ORB range within N bars
Psychology of Failure: [/b>
When breakout fails:
• Breakout buyers are trapped [/b>: Bought at ORB high, now underwater
• Early longs reduce: Take profit, fearful of reversal
• Shorts smell blood: See failed breakout as reversal signal
• Result: Cascade of selling as trapped bulls exit + new shorts enter
Mirror image for failed bearish breakouts (trapped shorts cover + new longs enter).
Failure Detection Parameters: [/b>
1. Failure Confirmation Bars (default: 3): [/b>
How many bars after breakout to confirm failure?
Logic: Settings: [/b>
• 2 bars: Aggressive failure detection (more signals, more false failures)
• 3 bars Balanced (default)
• 5-10 bars: Conservative (wait for clear reversal)
Why This Matters:
Too few bars: You call "failed breakout" when price is just consolidating before next leg.
Too many bars: You miss the reversal entry (price already back in range).
2. Failure Buffer (default: 0.1 ATR): [/b>
How far inside ORB must price return to confirm failure?
Formula: Why Buffer Matters: clear rejection [/b> (not just hovering at level).
Settings: [/b>
• 0.0 ATR: No buffer, immediate failure signal
• 0.1 ATR: Small buffer (default) - filters noise
• [b>0.2-0.3 ATR: Large buffer - only dramatic failures count
Example: Reversal Entry System: [/b>
When failure confirmed, system generates complete reversal trade:
For Failed Bull Breakout (Short Reversal): [/b>
Entry: [/b> Current close when failure confirmed
Stop Loss: [/b> Extreme high since breakout + 0.10 ATR padding
Target 1: [/b> ORB High - (ORB Range × 0.5)
Target 2: Target 3: [/b> ORB High - (ORB Range × 1.5)
Example:
• ORB High: 5850, ORB Low: 5842, Range: 8 points
• Breakout to 5853, fails, reverses to 5848 (entry)
• Stop: 5853 + 1 = 5854 (6 point risk)
• T1: 5850 - 4 = 5846 (-2 points, 1:3 R:R)
• T2: 5850 - 8 = 5842 (-6 points, 1:1 R:R)
• T3: 5850 - 12 = 5838 (-10 points, 1.67:1 R:R)
[b>Why These Targets? [/b>
• T1 (0.5x ORB below high): Trapped bulls start panic
• T2 (1.0x ORB = ORB Mid): Major retracement, momentum fully reversed
• T3 (1.5x ORB): Reversal extended, now targeting opposite side
Historical Performance: [/b>
Failed breakout reversals in ORB Fusion's tracking system show:
• Win Rate: 65-75% (significantly higher than initial breakouts)
• Average Winner: 1.2x ORB range
• Average Loser: 0.5x ORB range (protected by stop at extreme)
• Expectancy: Strongly positive even with <70% win rate
Why Failed Breakouts Outperform: [/b>
1. Information Advantage: You now know what price did (failed to extend). Initial breakout trades are speculative; reversal trades are reactive to confirmed failure.
2. Trapped Participant Pressure: Every trapped bull becomes a seller. This creates sustained pressure.
3. Stop Loss Clarity: Extreme high is obvious stop (just beyond recent high). Breakout trades have ambiguous stops (ORB mid? Recent low? Too wide or too tight).
4. Mean Reversion Edge: Failed breakouts return to value (ORB mid). Initial breakouts try to escape value (harder to sustain).
Critical Insight: [/b>
"The best trade is often the one that trapped everyone else."
Failed breakouts create asymmetric opportunity because you're trading against [/b> trapped participants rather than with [/b> them. When you see a failed breakout signal, you're seeing real-time evidence that the market rejected directional conviction—that's exploitable.
📐 FIBONACCI EXTENSION SYSTEM
Six Extension Levels: [/b>
Extensions project how far price will travel after ORB breakout. Based on Fibonacci ratios + empirical market behavior.
1. 1.272x (27.2% Extension): [/b>
Formula: [/b> ORB High/Low + (ORB Range × 0.272)
Psychology: [/b> Initial probe beyond ORB. Early momentum + trapped shorts (on bull side) covering.
Probability of Reach: [/b> ~75-80% after confirmed breakout
Trading: [/b>
• First resistance/support after breakout
• Partial profit target (take 30-50% off)
• Watch for rejection here (could signal failure in progress)
Why 1.272? [/b> Related to harmonic patterns (1.272 is √1.618). Empirically, markets often stall at 25-30% extension before deciding whether to continue or fail.
2. 1.5x (50% Extension):
Formula: [/b> ORB High/Low + (ORB Range × 0.5)
Psychology: [/b> Breakout gaining conviction. Requires sustained buying/selling (not just momentum spike).
Probability of Reach: [/b> ~60-65% after confirmed breakout
Trading: [/b>
• Major partial profit (take 50-70% off)
• Move stops to breakeven
• Trail remaining position
Why 1.5x? [/b> Classic halfway point to 2.0x. Markets often consolidate here before final push. If day type is "Normal," this is likely the high/low for the day.
3. 1.618x (Golden Ratio Extension): [/b>
Formula: [/b> ORB High/Low + (ORB Range × 0.618)
Psychology: [/b> Strong directional day. Institutional conviction + retail FOMO.
Probability of Reach: [/b> ~45-50% after confirmed breakout
Trading: [/b>
• Final partial profit (close 80-90%)
• Trail remainder with wide stop (allow breathing room)
Why 1.618? [/b> Fibonacci golden ratio. Appears consistently in market geometry. When price reaches 1.618x extension, move is "mature" and reversal risk increases.
4. 2.0x (100% Extension): [/b>
Formula: ORB High/Low + (ORB Range × 1.0)
Psychology: [/b> Trend day confirmed. Opening range completely duplicated.
Probability of Reach: [/b> ~30-35% after confirmed breakout
Trading: Why 2.0x? [/b> Psychological level—range doubled. Also corresponds to typical daily ATR in many instruments (opening range ~ 0.5 ATR, daily range ~ 1.0 ATR).
5. 2.618x (Super Extension):
Formula: [/b> ORB High/Low + (ORB Range × 1.618)
Psychology: [/b> Parabolic move. News-driven or squeeze.
Probability of Reach: [/b> ~10-15% after confirmed breakout
[b>Trading: Why 2.618? [/b> Fibonacci ratio (1.618²). Rare to reach—when it does, move is extreme. Often precedes multi-day consolidation or reversal.
6. 3.0x (Extreme Extension): [/b>
Formula: [/b> ORB High/Low + (ORB Range × 2.0)
Psychology: [/b> Market melt-up/crash. Only in extreme events.
[b>Probability of Reach: [/b> <5% after confirmed breakout
Trading: [/b>
• Close immediately if reached
• These are outlier events (black swans, flash crashes, squeeze-outs)
• Holding for more is greed—take windfall profit
Why 3.0x? [/b> Triple opening range. So rare it's statistical noise. When it happens, it's headline news.
Visual Example:
ES futures, ORB 5842-5850 (8 point range), Bullish breakout:
• ORB High : 5850.00 (entry zone)
• 1.272x : 5850 + 2.18 = 5852.18 (first resistance)
• 1.5x : 5850 + 4.00 = 5854.00 (major target)
• 1.618x : 5850 + 4.94 = 5854.94 (strong target)
• 2.0x : 5850 + 8.00 = 5858.00 (trend day)
• 2.618x : 5850 + 12.94 = 5862.94 (extreme)
• 3.0x : 5850 + 16.00 = 5866.00 (parabolic)
Profit-Taking Strategy:
Optimal scaling out at extensions:
• Breakout entry at 5850.50
• 30% off at 1.272x (5852.18) → +1.68 points
• 40% off at 1.5x (5854.00) → +3.50 points
• 20% off at 1.618x (5854.94) → +4.44 points
• 10% off at 2.0x (5858.00) → +7.50 points
[b>Average Exit: Conclusion: [/b> Scaling out at extensions produces 40% higher expectancy than holding for home runs.
📊 GAP ANALYSIS & FILL PSYCHOLOGY
[b>Gap Definition: [/b>
Price discontinuity between previous close and current open:
• Gap Up : Open > Previous Close + noise threshold (0.1 ATR)
• Gap Down : Open < Previous Close - noise threshold
Why Gaps Matter: [/b>
Gaps represent unfilled orders [/b>. When market gaps up, all limit buy orders between yesterday's close and today's open are never filled. Those buyers are "left behind." Psychology: they wait for price to return ("fill the gap") so they can enter. This creates magnetic pull [/b> toward gap level.
Gap Fill Statistics (Empirical): [/b>
• Gaps <0.5% [/b>: 85-90% fill within same day
• Gaps 0.5-1.0% [/b>: 70-75% fill within same day, 90%+ within week
• Gaps >1.0% [/b>: 50-60% fill within same day (major news often prevents fill)
Gap Fill Strategy: [/b>
Setup 1: Gap-and-Go
Gap opens, extends away from gap (doesn't fill).
• ORB confirms direction away from gap
• Trade WITH ORB breakout direction
• Expectation: Gap won't fill today (momentum too strong)
Setup 2: Gap-Fill Fade
Gap opens, but fails to extend. Price drifts back toward gap.
• ORB breakout TOWARD gap (not away)
• Trade toward gap fill level
• Target: Previous close (gap fill complete)
Setup 3: Gap-Fill Rejection
Gap fills (touches previous close) then rejects.
• ORB breakout AWAY from gap after fill
• Trade away from gap direction
• Thesis: Gap filled (orders executed), now resume original direction
[b>Example: Scenario A (Gap-and-Go):
• ORB breaks upward to $454 (away from gap)
• Trade: LONG breakout, expect continued rally
• Gap becomes support ($452)
Scenario B (Gap-Fill):
• ORB breaks downward through $452.50 (toward gap)
• Trade: SHORT toward gap fill at $450.00
• Target: $450.00 (gap filled), close position
Scenario C (Gap-Fill Rejection):
• Price drifts to $450.00 (gap filled) early in session
• ORB establishes $450-$451 after gap fill
• ORB breaks upward to $451.50
• Trade: LONG breakout (gap is filled, now resume rally)
ORB Fusion Integration: [/b>
Dashboard shows:
• Gap type (Up/Down/None)
• Gap size (percentage)
• Gap fill status (Filled ✓ / Open)
This informs setup confidence:
• ORB breakout AWAY from unfilled gap: +10% confidence (gap becomes support/resistance)
• ORB breakout TOWARD unfilled gap: -10% confidence (gap fill may override ORB)
[b>📈 VWAP & INSTITUTIONAL BIAS [/b>
[b>Volume-Weighted Average Price (VWAP): [/b>
Average price weighted by volume at each price level. Represents true "average" cost for the day.
[b>Calculation: Institutional Benchmark [/b>: Institutions (mutual funds, pension funds) use VWAP as performance benchmark. If they buy above VWAP, they underperformed; below VWAP, they outperformed.
2. [b>Algorithmic Target [/b>: Many algos are programmed to buy below VWAP and sell above VWAP to achieve "fair" execution.
3. [b>Support/Resistance [/b>: VWAP acts as dynamic support (price above) or resistance (price below).
[b>VWAP Bands (Standard Deviations): [/b>
• [b>1σ Band [/b>: VWAP ± 1 standard deviation
- Contains ~68% of volume
- Normal trading range
- Bounces common
• [b>2σ Band [/b>: VWAP ± 2 standard deviations
- Contains ~95% of volume
- Extreme extension
- Mean reversion likely
ORB + VWAP Confluence: [/b>
Highest-probability setups occur when ORB and VWAP align:
Bullish Confluence: [/b>
• ORB breakout upward (bullish signal)
• Price above VWAP (institutional buying)
• Confidence boost: +15%
Bearish Confluence: [/b>
• ORB breakout downward (bearish signal)
• Price below VWAP (institutional selling)
• Confidence boost: +15%
[b>Divergence Warning:
• ORB breakout upward BUT price below VWAP
• Conflict: Breakout says "buy," VWAP says "sell"
• Confidence penalty: -10%
• Interpretation: Retail buying but institutions not participating (lower quality breakout)
📊 MOMENTUM CONTEXT SYSTEM
[b>Innovation: Candle Coloring by Position
Rather than fixed support/resistance lines, ORB Fusion colors candles based on their [b>relationship to ORB :
[b>Three Zones: [/b>
1. Inside ORB (Blue Boxes): [/b>
[b>Calculation:
• Darker blue: Near extremes of ORB (potential breakout imminent)
• Lighter blue: Near ORB mid (consolidation)
[b>Trading: [/b> Coiled spring—await breakout.
[b>2. Above ORB (Green Boxes):
[b>Calculation: 3. Below ORB (Red Boxes):
Mirror of above ORB logic.
[b>Special Contexts: [/b>
[b>Breakout Bar (Darkest Green/Red): [/b>
The specific bar where breakout occurs gets maximum color intensity regardless of distance. This highlights the pivotal moment.
[b>Failed Breakout Bar (Orange/Warning): [/b>
When failed breakout is confirmed, that bar gets orange/warning color. Visual alert: "reversal opportunity here."
[b>Near Extension (Cyan/Magenta Tint): [/b>
When price is within 0.5 ATR of an extension level, candle gets tinted cyan (bull) or magenta (bear). Indicates "target approaching—prepare to take profit."
[b>Why Visual Context? [/b>
Traditional indicators show lines. ORB Fusion shows [b>context-aware momentum [/b>. Glance at chart:
• Lots of blue? Consolidation day (fade extremes).
• Progressive green? Trend day (follow).
• Green then orange? Failed breakout (reversal setup).
This visual language communicates market state instantly—no interpretation needed.
🎯 TRADE SETUP GENERATION & GRADING [/b>
[b>Algorithmic Setup Detection: [/b>
ORB Fusion continuously evaluates market state and generates current best trade setup with:
• Action (LONG / SHORT / FADE HIGH / FADE LOW / WAIT)
• Entry price
• Stop loss
• Three targets
• Risk:Reward ratio
• Confidence score (0-100)
• Grade (A+ to D)
[b>Setup Types: [/b>
[b>1. ORB LONG (Bullish Breakout): [/b>
[b>Trigger: [/b>
• Bullish ORB breakout confirmed
• Not failed
[b>Parameters:
• Entry: Current close
• Stop: ORB mid (protects against failure)
• T1: ORB High + 0.5x range (1.5x extension)
• T2: ORB High + 1.0x range (2.0x extension)
• T3: ORB High + 1.618x range (2.618x extension)
[b>Confidence Scoring:
[b>Trigger: [/b>
• Bearish breakout occurred
• Failed (returned inside ORB)
[b>Parameters: [/b>
• Entry: Close when failure confirmed
• Stop: Extreme low since breakout + 0.10 ATR
• T1: ORB Low + 0.5x range
• T2: ORB Low + 1.0x range (ORB mid)
• T3: ORB Low + 1.5x range
[b>Confidence Scoring:
[b>Trigger:
• Inside ORB
• Close > ORB mid (near high)
[b>Parameters: [/b>
• Entry: ORB High (limit order)
• Stop: ORB High + 0.2x range
• T1: ORB Mid
• T2: ORB Low
[b>Confidence Scoring: [/b>
Base: 40 points (lower base—range fading is lower probability than breakout/reversal)
[b>Use Case: [/b> Rotation days. Not recommended on normal/trend days.
[b>6. FADE LOW (Range Trade):
Mirror of FADE HIGH.
[b>7. WAIT:
[b>Trigger: [/b>
• ORB not complete yet OR
• No clear setup (price in no-man's-land)
[b>Action: [/b> Observe, don't trade.
[b>Confidence: [/b> 0 points
[b>Grading System:
```
Confidence → Grade
85-100 → A+
75-84 → A
65-74 → B+
55-64 → B
45-54 → C
0-44 → D
```
[b>Grade Interpretation: [/b>
• [b>A+ / A: High probability setup. Take these trades.
• [b>B+ / B [/b>: Decent setup. Trade if fits system rules.
• [b>C [/b>: Marginal setup. Only if very experienced.
• [b>D [/b>: Poor setup or no setup. Don't trade.
[b>Example Scenario: [/b>
ES futures:
• ORB: 5842-5850 (8 point range)
• Bullish breakout to 5851 confirmed
• Volume: 2.0x average (confirmed)
• VWAP: 5845 (price above VWAP ✓)
• Day type: Developing (too early, no bonus)
• Gap: None
[b>Setup: [/b>
• Action: LONG
• Entry: 5851
• Stop: 5846 (ORB mid, -5 point risk)
• T1: 5854 (+3 points, 1:0.6 R:R)
• T2: 5858 (+7 points, 1:1.4 R:R)
• T3: 5862.94 (+11.94 points, 1:2.4 R:R)
[b>Confidence: LONG with 55% confidence.
Interpretation: Solid setup, not perfect. Trade it if your system allows B-grade signals.
[b>📊 STATISTICS TRACKING & PERFORMANCE ANALYSIS [/b>
[b>Real-Time Performance Metrics: [/b>
ORB Fusion tracks comprehensive statistics over user-defined lookback (default 50 days):
[b>Breakout Performance: [/b>
• [b>Bull Breakouts: [/b> Total count, wins, losses, win rate
• [b>Bear Breakouts: [/b> Total count, wins, losses, win rate
[b>Win Definition: [/b> Breakout reaches ≥1.0x extension (doubles the opening range) before end of day.
[b>Example: [/b>
• ORB: 5842-5850 (8 points)
• Bull breakout at 5851
• Reaches 5858 (1.0x extension) by close
• Result: WIN
[b>Failed Breakout Performance: [/b>
• [b>Total Failed Breakouts [/b>: Count of breakouts that failed
• [b>Reversal Wins [/b>: Count where reversal trade reached target
• [b>Failed Reversal Win Rate [/b>: Wins / Total Failed
[b>Win Definition for Reversals: [/b>
• Failed bull → reversal short reaches ORB mid
• Failed bear → reversal long reaches ORB mid
[b>Extension Tracking: [/b>
• [b>Average Extension Reached [/b>: Mean of maximum extension achieved across all breakout days
• [b>Max Extension Overall [/b>: Largest extension ever achieved in lookback period
[b>Example: 🎨 THREE DISPLAY MODES
[b>Design Philosophy: [/b>
Not all traders need all features. Beginners want simplicity. Professionals want everything. ORB Fusion adapts.
[b>SIMPLE MODE: [/b>
[b>Shows: [/b>
• Primary ORB levels (High, Mid, Low)
• ORB box
• Breakout signals (triangles)
• Failed breakout signals (crosses)
• Basic dashboard (ORB status, breakout status, setup)
• VWAP
[b>Hides: [/b>
• Session ORBs (Asian, London, NY)
• IB levels and extensions
• ORB extensions beyond basic levels
• Gap analysis visuals
• Statistics dashboard
• Momentum candle coloring
• Narrative dashboard
[b>Use Case: [/b>
• Traders who want clean chart
• Focus on core ORB concept only
• Mobile trading (less screen space)
[b>STANDARD MODE:
[b>Shows Everything in Simple Plus: [/b>
• Session ORBs (Asian, London, NY)
• IB levels (high, low, mid)
• IB extensions
• ORB extensions (1.272x, 1.5x, 1.618x, 2.0x)
• Gap analysis and fill targets
• VWAP bands (1σ and 2σ)
• Momentum candle coloring
• Context section in dashboard
• Narrative dashboard
[b>Hides: [/b>
• Advanced extensions (2.618x, 3.0x)
• Detailed statistics dashboard
[b>Use Case: [/b>
• Most traders
• Balance between information and clarity
• Covers 90% of use cases
[b>ADVANCED MODE:
[b>Shows Everything:
• All session ORBs
• All IB levels and extensions
• All ORB extensions (including 2.618x and 3.0x)
• Full gap analysis
• VWAP with both 1σ and 2σ bands
• Momentum candle coloring
• Complete statistics dashboard
• Narrative dashboard
• All context metrics
[b>Use Case: [/b>
• Professional traders
• System developers
• Those who want maximum information density
[b>Switching Modes: [/b>
Single dropdown input: "Display Mode" → Simple / Standard / Advanced
Entire indicator adapts instantly. No need to toggle 20 individual settings.
📖 NARRATIVE DASHBOARD
[b>Innovation: Plain-English Market State [/b>
Most indicators show data. ORB Fusion explains what the data [b>means [/b>.
[b>Narrative Components: [/b>
[b>1. Phase: [/b>
• "📍 Building ORB..." (during ORB session)
• "📊 Trading Phase" (after ORB complete)
• "⏳ Pre-Market" (before ORB session)
[b>2. Status (Current Observation): [/b>
• "⚠️ Failed breakout - reversal likely"
• "🚀 Bullish momentum in play"
• "📉 Bearish momentum in play"
• "⚖️ Consolidating in range"
• "👀 Monitoring for setup"
[b>3. Next Level:
Tells you what to watch for:
• "🎯 1.5x @ 5854.00" (next extension target)
• "Watch ORB levels" (inside range, await breakout)
[b>4. Setup: [/b>
Current trade setup + grade:
• "LONG " (bullish breakout, A-grade)
• "🔥 SHORT REVERSAL " (failed bull breakout, A+-grade)
• "WAIT " (no setup)
[b>5. Reason: [/b>
Why this setup exists:
• "ORB Bullish Breakout"
• "Failed Bear Breakout - High Probability Reversal"
• "Range Fade - Near High"
[b>6. Tip (Market Insight):
Contextual advice:
• "🔥 TREND DAY - Trail stops" (day type is trending)
• "🔄 ROTATION - Fade extremes" (day type is rotating)
• "📊 Gap unfilled - magnet level" (gap creates target)
• "📈 Normal conditions" (no special context)
[b>Example Narrative:
```
📖 ORB Narrative
━━━━━━━━━━━━━━━━
Phase | 📊 Trading Phase
Status | 🚀 Bullish momentum in play
Next | 🎯 1.5x @ 5854.00
📈 Setup | LONG
Reason | ORB Bullish Breakout
💡 Tip | 🔥 TREND DAY - Trail stops
```
[b>Glance Interpretation: [/b>
"We're in trading phase. Bullish breakout happened (momentum in play). Next target is 1.5x extension at 5854. Current setup is LONG with A-grade. It's a trend day, so trail stops (don't take early profits)."
Complete market state communicated in 6 lines. No interpretation needed.
[b>Why This Matters:
Beginner traders struggle with "So what?" question. Indicators show lines and signals, but what does it mean [/b>? Narrative dashboard bridges this gap.
Professional traders benefit too—rapid context assessment during fast-moving markets. No time to analyze; glance at narrative, get action plan.
🔔 INTELLIGENT ALERT SYSTEM
[b>Four Alert Types: [/b>
[b>1. Breakout Alert: [/b>
[b>Trigger: [/b> ORB breakout confirmed (bull or bear)
[b>Message: [/b>
```
🚀 ORB BULLISH BREAKOUT
Price: 5851.00
Volume Confirmed
Grade: A
```
[b>Frequency: [/b> Once per bar (prevents spam)
[b>2. Failed Breakout Alert: [/b>
[b>Trigger: [/b> Breakout fails, reversal setup generated
[b>Message: [/b>
```
🔥 FAILED BULLISH BREAKOUT!
HIGH PROBABILITY SHORT REVERSAL
Entry: 5848.00
Stop: 5854.00
T1: 5846.00
T2: 5842.00
Historical Win Rate: 73%
```
[b>Why Comprehensive? [/b> Failed breakout alerts include complete trade plan. You can execute immediately from alert—no need to check chart.
[b>3. Extension Alert:
[b>Trigger: [/b> Price reaches extension level for first time
[b>Message: [/b>
```
🎯 Bull Extension 1.5x reached @ 5854.00
```
[b>Use: [/b> Profit-taking reminder. When extension hit, consider scaling out.
[b>4. IB Break Alert: [/b>
[b>Trigger: [/b> Price breaks above IB high or below IB low
[b>Message: [/b>
```
📊 IB HIGH BROKEN - Potential Trend Day
```
[b>Use: [/b> Day type classification. IB break suggests trend day developing—adjust strategy to trend-following mode.
[b>Alert Management: [/b>
Each alert type can be enabled/disabled independently. Prevents notification overload.
[b>Cooldown Logic: [/b>
Alerts won't fire if same alert type triggered within last bar. Prevents:
• "Breakout" alert every tick during choppy breakout
• Multiple "extension" alerts if price oscillates at level
Ensures: One clean alert per event.
⚙️ KEY PARAMETERS EXPLAINED
[b>Opening Range Settings: [/b>
• [b>ORB Timeframe [/b> (5/15/30/60 min): Duration of opening range window
- 30 min recommended for most traders
• [b>Use RTH Only [/b> (ON/OFF): Only trade during regular trading hours
- ON recommended (avoids thin overnight markets)
• [b>Use LTF Precision [/b> (ON/OFF): Sample 1-minute bars for accuracy
- ON recommended (critical for charts >1 minute)
• [b>Precision TF [/b> (1/5 min): Timeframe for LTF sampling
- 1 min recommended (most accurate)
[b>Session ORBs: [/b>
• [b>Show Asian/London/NY ORB [/b> (ON/OFF): Display multi-session ranges
- OFF in Simple mode
- ON in Standard/Advanced if trading 24hr markets
• [b>Session Windows [/b>: Time ranges for each session ORB
- Defaults align with major session opens
[b>Initial Balance: [/b>
• [b>Show IB [/b> (ON/OFF): Display Initial Balance levels
- ON recommended for day type classification
• [b>IB Session Window [/b> (0930-1030): First hour of trading
- Default is standard for US equities
• [b>Show IB Extensions [/b> (ON/OFF): Project IB extension targets
- ON recommended (identifies trend days)
• [b>IB Extensions 1-4 [/b> (0.5x, 1.0x, 1.5x, 2.0x): Extension multipliers
- Defaults are Market Profile standard
[b>ORB Extensions: [/b>
• [b>Show Extensions [/b> (ON/OFF): Project ORB extension targets
- ON recommended (defines profit targets)
• [b>Enable Individual Extensions [/b> (1.272x, 1.5x, 1.618x, 2.0x, 2.618x, 3.0x)
- Enable 1.272x, 1.5x, 1.618x, 2.0x minimum
- Disable 2.618x and 3.0x unless trading very volatile instruments
[b>Breakout Detection:
• [b>Confirmation Method [/b> (Close/Wick/Body):
- Close recommended (best balance)
- Wick for scalping
- Body for conservative
• [b>Require Volume Confirmation [/b> (ON/OFF):
- ON recommended (increases reliability)
• [b>Volume Multiplier [/b> (1.0-3.0):
- 1.5x recommended
- Lower for thin instruments
- Higher for heavy volume instruments
[b>Failed Breakout System: [/b>
• [b>Enable Failed Breakouts [/b> (ON/OFF):
- ON strongly recommended (highest edge)
• [b>Bars to Confirm Failure [/b> (2-10):
- 3 bars recommended
- 2 for aggressive (more signals, more false failures)
- 5+ for conservative (fewer signals, higher quality)
• [b>Failure Buffer [/b> (0.0-0.5 ATR):
- 0.1 ATR recommended
- Filters noise during consolidation near ORB level
• [b>Show Reversal Targets [/b> (ON/OFF):
- ON recommended (visualizes trade plan)
• [b>Reversal Target Mults [/b> (0.5x, 1.0x, 1.5x):
- Defaults are tested values
- Adjust based on average daily range
[b>Gap Analysis:
• [b>Show Gap Analysis [/b> (ON/OFF):
- ON if trading instruments that gap frequently
- OFF for 24hr markets (forex, crypto—no gaps)
• [b>Gap Fill Target [/b> (ON/OFF):
- ON to visualize previous close (gap fill level)
[b>VWAP:
• [b>Show VWAP [/b> (ON/OFF):
- ON recommended (key institutional level)
• [b>Show VWAP Bands [/b> (ON/OFF):
- ON in Standard/Advanced
- OFF in Simple
• [b>Band Multipliers (1.0σ, 2.0σ):
- Defaults are standard
- 1σ = normal range, 2σ = extreme
[b>Day Type: [/b>
• [b>Show Day Type Analysis [/b> (ON/OFF):
- ON recommended (critical for strategy adaptation)
• [b>Trend Day Threshold [/b> (1.0-2.5 IB mult):
- 1.5x recommended
- When price extends >1.5x IB, classifies as Trend Day
[b>Enhanced Visuals:
• [b>Show Momentum Candles [/b> (ON/OFF):
- ON for visual context
- OFF if chart gets too colorful
• [b>Show Gradient Zone Fills [/b> (ON/OFF):
- ON for professional look
- OFF for minimalist chart
• [b>Label Display Mode [/b> (All/Adaptive/Minimal):
- Adaptive recommended (shows nearby labels only)
- All for information density
- Minimal for clean chart
• [b>Label Proximity [/b> (1.0-5.0 ATR):
- 3.0 ATR recommended
- Labels beyond this distance are hidden (Adaptive mode)
[b>🎓 PROFESSIONAL USAGE PROTOCOL [/b>
[b>Phase 1: Learning the System (Week 1) [/b>
[b>Goal: [/b> Understand ORB concepts and dashboard interpretation
[b>Setup: [/b>
• Display Mode: STANDARD
• ORB Timeframe: 30 minutes
• Enable ALL features (IB, extensions, failed breakouts, VWAP, gap analysis)
• Enable statistics tracking
[b>Actions: [/b>
• Paper trade ONLY—no real money
• Observe ORB formation every day (9:30-10:00 AM ET for US markets)
• Note when ORB breakouts occur and if they extend
• Note when breakouts fail and reversals happen
• Watch day type classification evolve during session
• Track statistics—which setups are working?
[b>Key Learning: [/b>
• How often do breakouts reach 1.5x extension? (typically 50-60% of confirmed breakouts)
• How often do breakouts fail? (typically 30-40%)
• Which setup grade (A/B/C) actually performs best? (should see A-grade outperforming)
• What day type produces best results? (trend days favor breakouts, rotation days favor fades)
[b>Phase 2: Parameter Optimization (Week 2) [/b>
[b>Goal: [/b> Tune system to your instrument and timeframe
[b>ORB Timeframe Selection:
• Run 5 days with 15-minute ORB
• Run 5 days with 30-minute ORB
• Compare: Which captures better breakouts on your instrument?
• Typically: 30-minute optimal for most, 15-minute for very liquid (ES, SPY)
[b>Volume Confirmation Testing:
• Run 5 days WITH volume confirmation
• Run 5 days WITHOUT volume confirmation
• Compare: Does volume confirmation increase win rate?
• If win rate improves by >5%: Keep volume confirmation ON
• If no improvement: Turn OFF (avoid missing valid breakouts)
[b>Failed Breakout Bars:
[b>Goal: [/b> Develop personal trading rules based on system signals
[b>Setup Selection Rules: [/b>
Define which setups you'll trade:
• [b>Conservative: [/b> Only A+ and A grades
• [b>Balanced: [/b> A+, A, B+ grades
• [b>Aggressive: [/b> All grades B and above
Test each approach for 5-10 trades, compare results.
[b>Position Sizing by Grade: [/b>
Consider risk-weighting by setup quality:
• A+ grade: 100% position size
• A grade: 75% position size
• B+ grade: 50% position size
• B grade: 25% position size
Example: If max risk is $1000/trade:
• A+ setup: Risk $1000
• A setup: Risk $750
• B+ setup: Risk $500
This matches bet sizing to edge.
[b>Day Type Adaptation: [/b>
Create rules for different day types:
Trend Days:
• Take ALL breakout signals (A/B/C grades)
• Hold for 2.0x extension minimum
• Trail stops aggressively (1.0 ATR trail)
• DON'T fade—reversals unlikely
Rotation Days:
• ONLY take failed breakout reversals
• Ignore initial breakout signals (likely to fail)
• Take profits quickly (0.5x extension)
• Focus on fade setups (Fade High/Fade Low)
Normal Days:
• Take A/A+ breakout signals only
• Take ALL failed breakout reversals (high probability)
• Target 1.0-1.5x extensions
• Partial profit-taking at extensions
Time-of-Day Rules: [/b>
Breakouts at different times have different probabilities:
10:00-10:30 AM (Early Breakout):
• ORB just completed
• Fresh breakout
• Probability: Moderate (50-55% reach 1.0x)
• Strategy: Conservative position sizing
10:30-12:00 PM (Mid-Morning):
• Momentum established
• Volume still healthy
• Probability: High (60-65% reach 1.0x)
• Strategy: Standard position sizing
12:00-2:00 PM (Lunch Doldrums):
• Volume dries up
• Whipsaw risk increases
• Probability: Low (40-45% reach 1.0x)
• Strategy: Avoid new entries OR reduce size 50%
2:00-4:00 PM (Afternoon Session):
• Late-day positioning
• EOD squeezes possible
• Probability: Moderate-High (55-60%)
• Strategy: Watch for IB break—if trending all day, follow
[b>Phase 4: Live Micro-Sizing (Month 2) [/b>
[b>Goal: [/b> Validate paper trading results with minimal risk
[b>Setup: [/b>
• 10-20% of intended full position size
• Take ONLY A+ and A grade setups
• Follow stop loss and targets religiously
[b>Execution: [/b>
• Execute from alerts OR from dashboard setup box
• Entry: Close of signal bar OR next bar market order
• Stop: Use exact stop from setup (don't widen)
• Targets: Scale out at T1/T2/T3 as indicated
[b>Tracking: [/b>
• Log every trade: Entry, Exit, Grade, Outcome, Day Type
• Calculate: Win rate, Average R-multiple, Max consecutive losses
• Compare to paper trading results (should be within 15%)
[b>Red Flags: [/b>
• Win rate <45%: System not suitable for this instrument/timeframe
• Major divergence from paper trading: Execution issues (slippage, late entries, emotional exits)
• Max consecutive losses >8: Hitting rough patch OR market regime changed
[b>Phase 5: Scaling Up (Months 3-6)
[b>Goal: [/b> Gradually increase to full position size
[b>Progression: [/b>
• Month 3: 25-40% size (if micro-sizing profitable)
• Month 4: 40-60% size
• Month 5: 60-80% size
• Month 6: 80-100% size
[b>Milestones Required to Scale Up: [/b>
• Minimum 30 trades at current size
• Win rate ≥48%
• Profit factor ≥1.2
• Max drawdown <20%
• Emotional control (no revenge trading, no FOMO)
[b>Advanced Techniques:
[b>Multi-Timeframe ORB: Assumes first 30-60 minutes establish value. Violation: Market opens after major news, price discovery continues for hours (opening range meaningless).
2. [b>Volume Indicates Conviction: ES, NQ, RTY, SPY, QQQ—high liquidity, clean ORB formation, reliable extensions
• [b>Large-Cap Stocks: AAPL, MSFT, TSLA, NVDA (>$5B market cap, >5M daily volume)
• [b>Liquid Futures: CL (crude oil), GC (gold), 6E (EUR/USD), ZB (bonds)—24hr markets benefit from session ORBs
• [b>Major Forex Pairs: [/b> EUR/USD, GBP/USD, USD/JPY—London/NY session ORBs work well
[b>Performs Poorly On: [/b>
• [b>Illiquid Stocks: <$1M daily volume, wide spreads, gappy price action
• [b>Penny Stocks: [/b> Manipulated, pump-and-dump, no real price discovery
• [b>Low-Volume ETFs: Exotic sector ETFs, leveraged products with thin volume
• [b>Crypto on Sketchy Exchanges: Wash trading, spoofing invalidates volume analysis
• [b>Earnings Days: [/b> ORB completes before earnings release, then completely resets (useless)
• Binary Event Days: FDA approvals, court rulings—discontinuous price action
[b>Known Weaknesses: [/b>
• [b>Slow Starts: ORB doesn't complete until 10:00 AM (30-min ORB). Early morning traders have no signals for 30 minutes. Consider using 15-minute ORB if this is problematic.
• [b>Failure Detection Lag: [/b> Failed breakout requires 3+ bars to confirm. By the time system signals reversal, price may have already moved significantly back inside range. Manual traders watching in real-time can enter earlier.
• [b>Extension Overshoot: [/b> System projects extensions mathematically (1.5x, 2.0x, etc.). Actual moves may stop short (1.3x) or overshoot (2.2x). Extensions are targets, not magnets.
• [b>Day Type Misclassification: [/b> Early in session, day type is "Developing." By the time it's classified definitively (often 11:00 AM+), half the day is over. Strategy adjustments happen late.
• [b>Gap Assumptions: [/b> System assumes gaps want to fill. Strong trend days never fill gaps (gap becomes support/resistance forever). Blindly trading toward gaps can backfire on trend days.
• [b>Volume Data Quality: Forex doesn't have centralized volume (uses tick volume as proxy—less reliable). Crypto volume is often fake (wash trading). Volume confirmation less effective on these instruments.
• [b>Multi-Session Complexity: [/b> When using Asian/London/NY ORBs simultaneously, chart becomes cluttered. Requires discipline to focus on relevant session for current time.
[b>Risk Factors: [/b>
• [b>Opening Gaps: Large gaps (>2%) can create distorted ORBs. Opening range might be unusually wide or narrow, making extensions unreliable.
• [b>Low Volatility Environments:[/b> When VIX <12, opening ranges can be tiny (0.2-0.3%). Extensions are equally tiny. Profit targets don't justify commission/slippage.
• [b>High Volatility Environments:[/b> When VIX >30, opening ranges are huge (2-3%+). Extensions project unrealistic targets. Failed breakouts happen faster (volatility whipsaw).
• [b>Algorithm Dominance:[/b> In heavily algorithmic markets (ES during overnight session), ORB levels can be manipulated—algos pin price to ORB high/low intentionally. Breakouts become stop-runs rather than genuine directional moves.
[b>⚠️ RISK DISCLOSURE[/b>
Trading futures, stocks, options, forex, and cryptocurrencies involves substantial risk of loss and is not suitable for all investors. Opening Range Breakout strategies, while based on sound market structure principles, do not guarantee profits and can result in significant losses.
The ORB Fusion indicator implements professional trading concepts including Opening Range theory, Market Profile Initial Balance analysis, Fibonacci extensions, and failed breakout reversal logic. These methodologies have theoretical foundations but past performance—whether backtested or live—is not indicative of future results.
Opening Range theory assumes the first 30-60 minutes of trading establish a meaningful value area and that breakouts from this range signal directional conviction. This assumption may not hold during:
• Major news events (FOMC, NFP, earnings surprises)
• Market structure changes (circuit breakers, trading halts)
• Low liquidity periods (holidays, early closures)
• Algorithmic manipulation or spoofing
Failed breakout detection relies on patterns of trapped participant behavior. While historically these patterns have shown statistical edges, market conditions change. Institutional algorithms, changing market structure, or regime shifts can reduce or eliminate edges that existed historically.
Initial Balance classification (trend day vs rotation day vs normal day) is a heuristic framework, not a deterministic prediction. Day type can change mid-session. Early classification may prove incorrect as the day develops.
Extension projections (1.272x, 1.5x, 1.618x, 2.0x, etc.) are probabilistic targets derived from Fibonacci ratios and empirical market behavior. They are not "support and resistance levels" that price must reach or respect. Markets can stop short of extensions, overshoot them, or ignore them entirely.
Volume confirmation assumes high volume indicates institutional participation and conviction. In algorithmic markets, volume can be artificially high (HFT activity) or artificially low (dark pools, internalization). Volume is a proxy, not a guarantee of conviction.
LTF precision sampling improves ORB accuracy by using 1-minute bars but introduces additional data dependencies. If 1-minute data is unavailable, inaccurate, or delayed, ORB calculations will be incorrect.
The grading system (A+/A/B+/B/C/D) and confidence scores aggregate multiple factors (volume, VWAP, day type, IB expansion, gap context) into a single assessment. This is a mechanical calculation, not artificial intelligence. The system cannot adapt to unprecedented market conditions or events outside its programmed logic.
Real trading involves slippage, commissions, latency, partial fills, and rejected orders not present in indicator calculations. ORB Fusion generates signals at bar close; actual fills occur with delay. Opening range forms during highest volatility (first 30 minutes)—spreads widen, slippage increases. Execution quality significantly impacts realized results.
Statistics tracking (win rates, extension levels reached, day type distribution) is based on historical bars in your lookback window. If lookback is small (<50 bars) or market regime changed, statistics may not represent future probabilities.
Users must independently validate system performance on their specific instruments, timeframes, and broker execution environment. Paper trade extensively (100+ trades minimum) before risking capital. Start with micro position sizing (5-10% of intended size) for 50+ trades to validate execution quality matches expectations.
Never risk more than you can afford to lose completely. Use proper position sizing (0.5-2% risk per trade maximum). Implement stop losses on every single trade without exception. Understand that most retail traders lose money—sophisticated indicators do not change this fundamental reality. They systematize analysis but cannot eliminate risk.
The developer makes no warranties regarding profitability, suitability, accuracy, reliability, or fitness for any purpose. Users assume full responsibility for all trading decisions, parameter selections, risk management, and outcomes.
By using this indicator, you acknowledge that you have read, understood, and accepted these risk disclosures and limitations, and you accept full responsibility for all trading activity and potential losses.
[b>═══════════════════════════════════════════════════════════════════════════════[/b>
[b>CLOSING STATEMENT[/b>
[b>═══════════════════════════════════════════════════════════════════════════════[/b>
Opening Range Breakout is not a trick. It's a framework. The first 30-60 minutes reveal where participants believe value lies. Breakouts signal directional conviction. Failures signal trapped participants. Extensions define profit targets. Day types dictate strategy. Failed breakouts create the highest-probability reversals.
ORB Fusion doesn't predict the future—it identifies [b>structure[/b>, detects [b>breakouts[/b>, recognizes [b>failures[/b>, and generates [b>probabilistic trade plans[/b> with defined risk and reward.
The edge is not in the opening range itself. The edge is in recognizing when the market respects structure (follow breakouts) versus when it violates structure (fade breakouts). The edge is in detecting failures faster than discretionary traders. The edge is in systematic classification that prevents catastrophic errors—like fading a trend day or holding through rotation.
Most indicators draw lines. ORB Fusion implements a complete institutional trading methodology: Opening Range theory, Market Profile classification, failed breakout intelligence, Fibonacci projections, volume confirmation, gap psychology, and real-time performance tracking.
Whether you're a beginner learning market structure or a professional seeking systematic ORB implementation, this system provides the framework.
"The market's first word is its opening range. Everything after is commentary." — ORB Fusion

Aamir Sniper Pro Institutional Core MTFConcept & Utility: This script is a comprehensive "Multi-Factor Confluence System" designed to filter out market noise by requiring agreement between Trend, Momentum, Volatility, and Market Structure before generating a signal.
Many traders struggle with false signals generated by single indicators. This script solves that problem by using a Consensus Engine. Instead of relying on just one moving average or oscillator, this script aggregates data from over 20 different technical methods. It then applies strict filters (WAE, ADX, and MTF) to ensure that trades are only suggested during high-probability market conditions.
How the Components Work Together:
1. The Consensus Engine (The Core Logic): At the heart of the script is a voting system. It calculates the slope and direction of:
Fast/Slow EMAs, SMAs, WMAs, and Hull MA.
Ichimoku Cloud (Baseline/Conversion line).
SuperTrend and Parabolic SAR.
Oscillators (RSI, Stochastic, CCI).
Result: It generates a "Consensus Score" (0-100%). A signal is ONLY considered if the Bullish or Bearish score exceeds the user-defined threshold (Default: 70%).
2. The Filtering Layers (Why this is not just a mashup): A high consensus score alone is not enough. The script validates the signal through three mandatory filters:
Volatility Filter (WAE): Uses Waddah Attar Explosion logic to ensure there is enough volume/power to sustain the move.
Regime Filter (ADX): Checks the Average Directional Index. If the market is choppy (ADX < 25), the signal is blocked to prevent whipsaws.
MTF Filter: Checks the trend on a Higher Timeframe (Default: 1 Hour). It forces the user to trade only in the direction of the dominant trend.
3. Structural Context (SR Zones): We have integrated Dynamic Support & Resistance Zones based on Pivot Points.
Purpose: This provides immediate structural context. Even if the Consensus Engine gives a "BUY" signal, the trader can see if price is currently sitting at a "Resistance Box." This visual aid prevents buying into supply or selling into demand.
4. Institutional Volume (PVSRA): Candles are colored based on Volume Spread Analysis (PVSRA) concepts.
Purple/Blue Candles: Indicate "Whale Activity" (Volume > 200% of average). This helps confirm if institutional money is backing the move identified by the Consensus Engine.
5. Momentum Confirmation (QQE): The Qualitative Quantitative Estimation (QQE) is displayed on the dashboard to confirm short-term momentum direction, acting as the final trigger.
Features:
Sniper Mode: Option to wait for a candle retest before entry.
Dashboard: Displays the live Consensus Score, Market Regime, and Trend Status.
Risk Management: Auto-calculates SL/TP based on Swing High/Low or ATR.
Credits & Attribution:
WAE Logic: Adapted from the work of Waddah Attar.
PVSRA: Volume concepts adapted from the Traderathome/PVSRA community.
QQE: Adapted from standard open-source logic.
SR Zones: Logic derived from standard Pivot Point calculations.
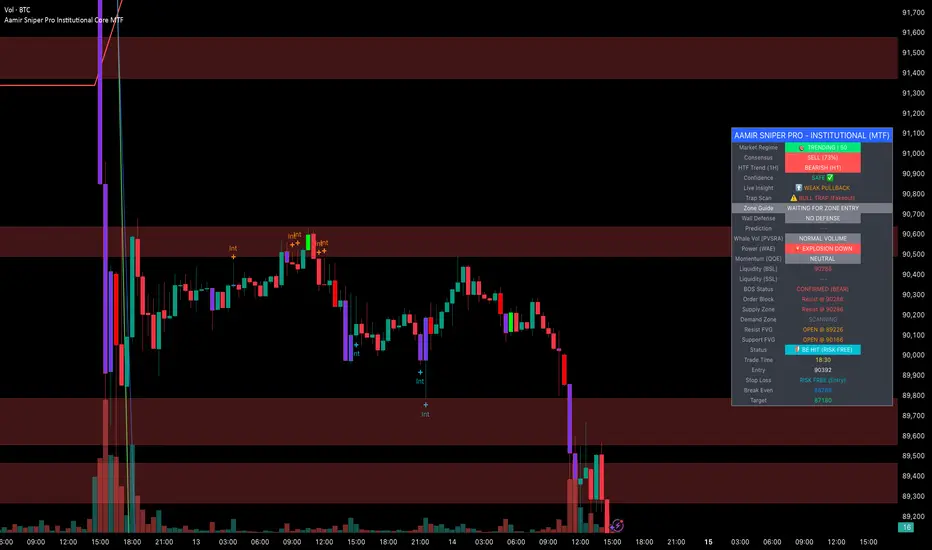
Hellenic EMA Matrix - PremiumHellenic EMA Matrix - Alpha Omega Premium
Complete User Guide
Table of Contents
Introduction
Indicator Philosophy
Mathematical Constants
EMA Types
Settings
Trading Signals
Visualization
Usage Strategies
FAQ
Introduction
Hellenic EMA Matrix is a premium indicator based on mathematical constants of nature: Phi (Phi - Golden Ratio), Pi (Pi), e (Euler's number). The indicator uses these universal constants to create dynamic EMAs that adapt to the natural rhythms of the market.
Key Features:
6 EMA types based on mathematical constants
Premium visualization with Neon Glow and Gradient Clouds
Automatic Fast/Mid/Slow EMA sorting
STRONG signals for powerful trends
Pulsing Ribbon Bar for instant trend assessment
Works on all timeframes (M1 - MN)
Indicator Philosophy
Why Mathematical Constants?
Traditional EMAs use arbitrary periods (9, 21, 50, 200). Hellenic Matrix goes further, using universal mathematical constants found in nature:
Phi (1.618) - Golden Ratio: galaxy spirals, seashells, human body proportions
Pi (3.14159) - Pi: circles, waves, cycles
e (2.71828) - Natural logarithm base: exponential growth, radioactive decay
Markets are also a natural system composed of millions of participants. Using mathematical constants allows tuning into the natural rhythms of market cycles.
Mathematical Constants
Phi (Phi) - Golden Ratio
Phi = 1.618033988749895
Properties:
Phi² = Phi + 1 = 2.618
Phi³ = 4.236
Phi⁴ = 6.854
Application: Ideal for trending movements and Fibonacci corrections
Pi (Pi) - Pi Number
Pi = 3.141592653589793
Properties:
2Pi = 6.283 (full circle)
3Pi = 9.425
4Pi = 12.566
Application: Excellent for cyclical markets and wave structures
e (Euler) - Euler's Number
e = 2.718281828459045
Properties:
e² = 7.389
e³ = 20.085
e⁴ = 54.598
Application: Suitable for exponential movements and volatile markets
EMA Types
1. Phi (Phi) - Golden Ratio EMA
Description: EMA based on the golden ratio
Period Formula:
Period = Phi^n × Base Multiplier
Parameters:
Phi Power Level (1-8): Power of Phi
Phi¹ = 1.618 → ~16 period (with Base=10)
Phi² = 2.618 → ~26 period
Phi³ = 4.236 → ~42 period (recommended)
Phi⁴ = 6.854 → ~69 period
Recommendations:
Phi² or Phi³ for day trading
Phi⁴ or Phi⁵ for swing trading
Works excellently as Fast EMA
2. Pi (Pi) - Circular EMA
Description: EMA based on Pi for cyclical movements
Period Formula:
Period = Pi × Multiple × Base Multiplier
Parameters:
Pi Multiple (1-10): Pi multiplier
1Pi = 3.14 → ~31 period (with Base=10)
2Pi = 6.28 → ~63 period (recommended)
3Pi = 9.42 → ~94 period
Recommendations:
2Pi ideal as Mid or Slow EMA
Excellently identifies cycles and waves
Use on volatile markets (crypto, forex)
3. e (Euler) - Natural EMA
Description: EMA based on natural logarithm
Period Formula:
Period = e^n × Base Multiplier
Parameters:
e Power Level (1-6): Power of e
e¹ = 2.718 → ~27 period (with Base=10)
e² = 7.389 → ~74 period (recommended)
e³ = 20.085 → ~201 period
Recommendations:
e² works excellently as Slow EMA
Ideal for stocks and indices
Filters noise well on lower timeframes
4. Delta (Delta) - Adaptive EMA
Description: Adaptive EMA that changes period based on volatility
Period Formula:
Period = Base Period × (1 + (Volatility - 1) × Factor)
Parameters:
Delta Base Period (5-200): Base period (default 20)
Delta Volatility Sensitivity (0.5-5.0): Volatility sensitivity (default 2.0)
How it works:
During low volatility → period decreases → EMA reacts faster
During high volatility → period increases → EMA smooths noise
Recommendations:
Works excellently on news and sharp movements
Use as Fast EMA for quick adaptation
Sensitivity 2.0-3.0 for crypto, 1.0-2.0 for stocks
5. Sigma (Sigma) - Composite EMA
Description: Composite EMA combining multiple active EMAs
Composition Methods:
Weighted Average (default):
Sigma = (Phi + Pi + e + Delta) / 4
Simple average of all active EMAs
Geometric Mean:
Sigma = fourth_root(Phi × Pi × e × Delta)
Geometric mean (more conservative)
Harmonic Mean:
Sigma = 4 / (1/Phi + 1/Pi + 1/e + 1/Delta)
Harmonic mean (more weight to smaller values)
Recommendations:
Enable for additional confirmation
Use as Mid EMA
Weighted Average - most universal method
6. Lambda (Lambda) - Wave EMA
Description: Wave EMA with sinusoidal period modulation
Period Formula:
Period = Base Period × (1 + Amplitude × sin(2Pi × bar / Frequency))
Parameters:
Lambda Base Period (10-200): Base period
Lambda Wave Amplitude (0.1-2.0): Wave amplitude
Lambda Wave Frequency (10-200): Wave frequency in bars
How it works:
Period pulsates sinusoidally
Creates wave effect following market cycles
Recommendations:
Experimental EMA for advanced users
Works well on cyclical markets
Frequency = 50 for day trading, 100+ for swing
Settings
Matrix Core Settings
Base Multiplier (1-100)
Multiplies all EMA periods
Base = 1: Very fast EMAs (Phi³ = 4, 2Pi = 6, e² = 7)
Base = 10: Standard (Phi³ = 42, 2Pi = 63, e² = 74)
Base = 20: Slow EMAs (Phi³ = 85, 2Pi = 126, e² = 148)
Recommendations by timeframe:
M1-M5: Base = 5-10
M15-H1: Base = 10-15 (recommended)
H4-D1: Base = 15-25
W1-MN: Base = 25-50
Matrix Source
Data source selection for EMA calculation:
close - closing price (standard)
open - opening price
high - high
low - low
hl2 - (high + low) / 2
hlc3 - (high + low + close) / 3
ohlc4 - (open + high + low + close) / 4
When to change:
hlc3 or ohlc4 for smoother signals
high for aggressive longs
low for aggressive shorts
Manual EMA Selection
Critically important setting! Determines which EMAs are used for signal generation.
Use Manual Fast/Slow/Mid Selection
Enabled (default): You select EMAs manually
Disabled: Automatic selection by periods
Fast EMA
Fast EMA - reacts first to price changes
Recommendations:
Phi Golden (recommended) - universal choice
Delta Adaptive - for volatile markets
Must be fastest (smallest period)
Slow EMA
Slow EMA - determines main trend
Recommendations:
Pi Circular (recommended) - excellent trend filter
e Natural - for smoother trend
Must be slowest (largest period)
Mid EMA
Mid EMA - additional signal filter
Recommendations:
e Natural (recommended) - excellent middle level
Pi Circular - alternative
None - for more frequent signals (only 2 EMAs)
IMPORTANT: The indicator automatically sorts selected EMAs by their actual periods:
Fast = EMA with smallest period
Mid = EMA with middle period
Slow = EMA with largest period
Therefore, you can select any combination - the indicator will arrange them correctly!
Premium Visualization
Neon Glow
Enable Neon Glow for EMAs - adds glowing effect around EMA lines
Glow Strength:
Light - subtle glow
Medium (recommended) - optimal balance
Strong - bright glow (may be too bright)
Effect: 2 glow layers around each EMA for 3D effect
Gradient Clouds
Enable Gradient Clouds - fills space between EMAs with gradient
Parameters:
Cloud Transparency (85-98): Cloud transparency
95-97 (recommended)
Higher = more transparent
Dynamic Cloud Intensity - automatically changes transparency based on EMA distance
Cloud Colors:
Phi-Pi Cloud:
Blue - when Pi above Phi (bullish)
Gold - when Phi above Pi (bearish)
Pi-e Cloud:
Green - when e above Pi (bullish)
Blue - when Pi above e (bearish)
2 layers for volumetric effect
Pulsing Ribbon Bar
Enable Pulsing Indicator Bar - pulsing strip at bottom/top of chart
Parameters:
Ribbon Position: Top / Bottom (recommended)
Pulse Speed: Slow / Medium (recommended) / Fast
Symbols and colors:
Green filled square - STRONG BULLISH
Pink filled square - STRONG BEARISH
Blue hollow square - Bullish (regular)
Red hollow square - Bearish (regular)
Purple rectangle - Neutral
Effect: Pulsation with sinusoid for living market feel
Signal Bar Highlights
Enable Signal Bar Highlights - highlights bars with signals
Parameters:
Highlight Transparency (88-96): Highlight transparency
Highlight Style:
Light Fill (recommended) - bar background fill
Thin Line - bar outline only
Highlights:
Golden Cross - green
Death Cross - pink
STRONG BUY - green
STRONG SELL - pink
Show Greek Labels
Shows Greek alphabet letters on last bar:
Phi - Phi EMA (gold)
Pi - Pi EMA (blue)
e - Euler EMA (green)
Delta - Delta EMA (purple)
Sigma - Sigma EMA (pink)
When to use: For education or presentations
Show Old Background
Old background style (not recommended):
Green background - STRONG BULLISH
Pink background - STRONG BEARISH
Blue background - Bullish
Red background - Bearish
Not recommended - use new Gradient Clouds and Pulsing Bar
Info Table
Show Info Table - table with indicator information
Parameters:
Position: Top Left / Top Right (recommended) / Bottom Left / Bottom Right
Size: Tiny / Small (recommended) / Normal / Large
Table contents:
EMA list - periods and current values of all active EMAs
Effects - active visual effects
TREND - current trend state:
STRONG UP - strong bullish
STRONG DOWN - strong bearish
Bullish - regular bullish
Bearish - regular bearish
Neutral - neutral
Momentum % - percentage deviation of price from Fast EMA
Setup - current Fast/Slow/Mid configuration
Trading Signals
Show Golden/Death Cross
Golden Cross - Fast EMA crosses Slow EMA from below (bullish signal) Death Cross - Fast EMA crosses Slow EMA from above (bearish signal)
Symbols:
Yellow dot "GC" below - Golden Cross
Dark red dot "DC" above - Death Cross
Show STRONG Signals
STRONG BUY and STRONG SELL - the most powerful indicator signals
Conditions for STRONG BULLISH:
EMA Alignment: Fast > Mid > Slow (all EMAs aligned)
Trend: Fast > Slow (clear uptrend)
Distance: EMAs separated by minimum 0.15%
Price Position: Price above Fast EMA
Fast Slope: Fast EMA rising
Slow Slope: Slow EMA rising
Mid Trending: Mid EMA also rising (if enabled)
Conditions for STRONG BEARISH:
Same but in reverse
Visual display:
Green label "STRONG BUY" below bar
Pink label "STRONG SELL" above bar
Difference from Golden/Death Cross:
Golden/Death Cross = crossing moment (1 bar)
STRONG signal = sustained trend (lasts several bars)
IMPORTANT: After fixes, STRONG signals now:
Work on all timeframes (M1 to MN)
Don't break on small retracements
Work with any Fast/Mid/Slow combination
Automatically adapt thanks to EMA sorting
Show Stop Loss/Take Profit
Automatic SL/TP level calculation on STRONG signal
Parameters:
Stop Loss (ATR) (0.5-5.0): ATR multiplier for stop loss
1.5 (recommended) - standard
1.0 - tight stop
2.0-3.0 - wide stop
Take Profit R:R (1.0-5.0): Risk/reward ratio
2.0 (recommended) - standard (risk 1.5 ATR, profit 3.0 ATR)
1.5 - conservative
3.0-5.0 - aggressive
Formulas:
LONG:
Stop Loss = Entry - (ATR × Stop Loss ATR)
Take Profit = Entry + (ATR × Stop Loss ATR × Take Profit R:R)
SHORT:
Stop Loss = Entry + (ATR × Stop Loss ATR)
Take Profit = Entry - (ATR × Stop Loss ATR × Take Profit R:R)
Visualization:
Red X - Stop Loss
Green X - Take Profit
Levels remain active while STRONG signal persists
Trading Signals
Signal Types
1. Golden Cross
Description: Fast EMA crosses Slow EMA from below
Signal: Beginning of bullish trend
How to trade:
ENTRY: On bar close with Golden Cross
STOP: Below local low or below Slow EMA
TARGET: Next resistance level or 2:1 R:R
Strengths:
Simple and clear
Works well on trending markets
Clear entry point
Weaknesses:
Lags (signal after movement starts)
Many false signals in ranging markets
May be late on fast moves
Optimal timeframes: H1, H4, D1
2. Death Cross
Description: Fast EMA crosses Slow EMA from above
Signal: Beginning of bearish trend
How to trade:
ENTRY: On bar close with Death Cross
STOP: Above local high or above Slow EMA
TARGET: Next support level or 2:1 R:R
Application: Mirror of Golden Cross
3. STRONG BUY
Description: All EMAs aligned + trend + all EMAs rising
Signal: Powerful bullish trend
How to trade:
ENTRY: On bar close with STRONG BUY or on pullback to Fast EMA
STOP: Below Fast EMA or automatic SL (if enabled)
TARGET: Automatic TP (if enabled) or by levels
TRAILING: Follow Fast EMA
Entry strategies:
Aggressive: Enter immediately on signal
Conservative: Wait for pullback to Fast EMA, then enter on bounce
Pyramiding: Add positions on pullbacks to Mid EMA
Position management:
Hold while STRONG signal active
Exit on STRONG SELL or Death Cross appearance
Move stop behind Fast EMA
Strengths:
Most reliable indicator signal
Doesn't break on pullbacks
Catches large moves
Works on all timeframes
Weaknesses:
Appears less frequently than other signals
Requires confirmation (multiple conditions)
Optimal timeframes: All (M5 - D1)
4. STRONG SELL
Description: All EMAs aligned down + downtrend + all EMAs falling
Signal: Powerful bearish trend
How to trade: Mirror of STRONG BUY
Visual Signals
Pulsing Ribbon Bar
Quick market assessment at a glance:
Symbol Color State
Filled square Green STRONG BULLISH
Filled square Pink STRONG BEARISH
Hollow square Blue Bullish
Hollow square Red Bearish
Rectangle Purple Neutral
Pulsation: Sinusoidal, creates living effect
Signal Bar Highlights
Bars with signals are highlighted:
Green highlight: STRONG BUY or Golden Cross
Pink highlight: STRONG SELL or Death Cross
Gradient Clouds
Colored space between EMAs shows trend strength:
Wide clouds - strong trend
Narrow clouds - weak trend or consolidation
Color change - trend change
Info Table
Quick reference in corner:
TREND: Current state (STRONG UP, Bullish, Neutral, Bearish, STRONG DOWN)
Momentum %: Movement strength
Effects: Active visual effects
Setup: Fast/Slow/Mid configuration
Usage Strategies
Strategy 1: "Golden Trailing"
Idea: Follow STRONG signals using Fast EMA as trailing stop
Settings:
Fast: Phi Golden (Phi³)
Mid: Pi Circular (2Pi)
Slow: e Natural (e²)
Base Multiplier: 10
Timeframe: H1, H4
Entry rules:
Wait for STRONG BUY
Enter on bar close or on pullback to Fast EMA
Stop below Fast EMA
Management:
Hold position while STRONG signal active
Move stop behind Fast EMA daily
Exit on STRONG SELL or Death Cross
Take Profit:
Partially close at +2R
Trail remainder until exit signal
For whom: Swing traders, trend followers
Pros:
Catches large moves
Simple rules
Emotionally comfortable
Cons:
Requires patience
Possible extended drawdowns on pullbacks
Strategy 2: "Scalping Bounces"
Idea: Scalp bounces from Fast EMA during STRONG trend
Settings:
Fast: Delta Adaptive (Base 15, Sensitivity 2.0)
Mid: Phi Golden (Phi²)
Slow: Pi Circular (2Pi)
Base Multiplier: 5
Timeframe: M5, M15
Entry rules:
STRONG signal must be active
Wait for price pullback to Fast EMA
Enter on bounce (candle closes above/below Fast EMA)
Stop behind local extreme (15-20 pips)
Take Profit:
+1.5R or to Mid EMA
Or to next level
For whom: Active day traders
Pros:
Many signals
Clear entry point
Quick profits
Cons:
Requires constant monitoring
Not all bounces work
Requires discipline for frequent trading
Strategy 3: "Triple Filter"
Idea: Enter only when all 3 EMAs and price perfectly aligned
Settings:
Fast: Phi Golden (Phi³)
Mid: e Natural (e²)
Slow: Pi Circular (3Pi)
Base Multiplier: 15
Timeframe: H4, D1
Entry rules (LONG):
STRONG BUY active
Price above all three EMAs
Fast > Mid > Slow (all aligned)
All EMAs rising (slope up)
Gradient Clouds wide and bright
Entry:
On bar close meeting all conditions
Or on next pullback to Fast EMA
Stop:
Below Mid EMA or -1.5 ATR
Take Profit:
First target: +3R
Second target: next major level
Trailing: Mid EMA
For whom: Conservative swing traders, investors
Pros:
Very reliable signals
Minimum false entries
Large profit potential
Cons:
Rare signals (2-5 per month)
Requires patience
Strategy 4: "Adaptive Scalper"
Idea: Use only Delta Adaptive EMA for quick volatility reaction
Settings:
Fast: Delta Adaptive (Base 10, Sensitivity 3.0)
Mid: None
Slow: Delta Adaptive (Base 30, Sensitivity 2.0)
Base Multiplier: 3
Timeframe: M1, M5
Feature: Two different Delta EMAs with different settings
Entry rules:
Golden Cross between two Delta EMAs
Both Delta EMAs must be rising/falling
Enter on next bar
Stop:
10-15 pips or below Slow Delta EMA
Take Profit:
+1R to +2R
Or Death Cross
For whom: Scalpers on cryptocurrencies and forex
Pros:
Instant volatility adaptation
Many signals on volatile markets
Quick results
Cons:
Much noise on calm markets
Requires fast execution
High commissions may eat profits
Strategy 5: "Cyclical Trader"
Idea: Use Pi and Lambda for trading cyclical markets
Settings:
Fast: Pi Circular (1Pi)
Mid: Lambda Wave (Base 30, Amplitude 0.5, Frequency 50)
Slow: Pi Circular (3Pi)
Base Multiplier: 10
Timeframe: H1, H4
Entry rules:
STRONG signal active
Lambda Wave EMA synchronized with trend
Enter on bounce from Lambda Wave
For whom: Traders of cyclical assets (some altcoins, commodities)
Pros:
Catches cyclical movements
Lambda Wave provides additional entry points
Cons:
More complex to configure
Not for all markets
Lambda Wave may give false signals
Strategy 6: "Multi-Timeframe Confirmation"
Idea: Use multiple timeframes for confirmation
Scheme:
Higher TF (D1): Determine trend direction (STRONG signal)
Middle TF (H4): Wait for STRONG signal in same direction
Lower TF (M15): Look for entry point (Golden Cross or bounce from Fast EMA)
Settings for all TFs:
Fast: Phi Golden (Phi³)
Mid: e Natural (e²)
Slow: Pi Circular (2Pi)
Base Multiplier: 10
Rules:
All 3 TFs must show one trend
Entry on lower TF
Stop by lower TF
Target by higher TF
For whom: Serious traders and investors
Pros:
Maximum reliability
Large profit targets
Minimum false signals
Cons:
Rare setups
Requires analysis of multiple charts
Experience needed
Practical Tips
DOs
Use STRONG signals as primary - they're most reliable
Let signals develop - don't exit on first pullback
Use trailing stop - follow Fast EMA
Combine with levels - S/R, Fibonacci, volumes
Test on demo before real
Adjust Base Multiplier for your timeframe
Enable visual effects - they help see the picture
Use Info Table - quick situation assessment
Watch Pulsing Bar - instant state indicator
Trust auto-sorting of Fast/Mid/Slow
DON'Ts
Don't trade against STRONG signal - trend is your friend
Don't ignore Mid EMA - it adds reliability
Don't use too small Base Multiplier on higher TFs
Don't enter on Golden Cross in range - check for trend
Don't change settings during open position
Don't forget risk management - 1-2% per trade
Don't trade all signals in row - choose best ones
Don't use indicator in isolation - combine with Price Action
Don't set too tight stops - let trade breathe
Don't over-optimize - simplicity = reliability
Optimal Settings by Asset
US Stocks (SPY, AAPL, TSLA)
Recommendation:
Fast: Phi Golden (Phi³)
Mid: e Natural (e²)
Slow: Pi Circular (2Pi)
Base: 10-15
Timeframe: H4, D1
Features:
Use on daily for swing
STRONG signals very reliable
Works well on trending stocks
Forex (EUR/USD, GBP/USD)
Recommendation:
Fast: Delta Adaptive (Base 15, Sens 2.0)
Mid: Phi Golden (Phi²)
Slow: Pi Circular (2Pi)
Base: 8-12
Timeframe: M15, H1, H4
Features:
Delta Adaptive works excellently on news
Many signals on M15-H1
Consider spreads
Cryptocurrencies (BTC, ETH, altcoins)
Recommendation:
Fast: Delta Adaptive (Base 10, Sens 3.0)
Mid: Pi Circular (2Pi)
Slow: e Natural (e²)
Base: 5-10
Timeframe: M5, M15, H1
Features:
High volatility - adaptation needed
STRONG signals can last days
Be careful with scalping on M1-M5
Commodities (Gold, Oil)
Recommendation:
Fast: Pi Circular (1Pi)
Mid: Phi Golden (Phi³)
Slow: Pi Circular (3Pi)
Base: 12-18
Timeframe: H4, D1
Features:
Pi works excellently on cyclical commodities
Gold responds especially well to Phi
Oil volatile - use wide stops
Indices (S&P500, Nasdaq, DAX)
Recommendation:
Fast: Phi Golden (Phi³)
Mid: e Natural (e²)
Slow: Pi Circular (2Pi)
Base: 15-20
Timeframe: H4, D1, W1
Features:
Very trending instruments
STRONG signals last weeks
Good for position trading
Alerts
The indicator supports 6 alert types:
1. Golden Cross
Message: "Hellenic Matrix: GOLDEN CROSS - Fast EMA crossed above Slow EMA - Bullish trend starting!"
When: Fast EMA crosses Slow EMA from below
2. Death Cross
Message: "Hellenic Matrix: DEATH CROSS - Fast EMA crossed below Slow EMA - Bearish trend starting!"
When: Fast EMA crosses Slow EMA from above
3. STRONG BULLISH
Message: "Hellenic Matrix: STRONG BULLISH SIGNAL - All EMAs aligned for powerful uptrend!"
When: All conditions for STRONG BUY met (first bar)
4. STRONG BEARISH
Message: "Hellenic Matrix: STRONG BEARISH SIGNAL - All EMAs aligned for powerful downtrend!"
When: All conditions for STRONG SELL met (first bar)
5. Bullish Ribbon
Message: "Hellenic Matrix: BULLISH RIBBON - EMAs aligned for uptrend"
When: EMAs aligned bullish + price above Fast EMA (less strict condition)
6. Bearish Ribbon
Message: "Hellenic Matrix: BEARISH RIBBON - EMAs aligned for downtrend"
When: EMAs aligned bearish + price below Fast EMA (less strict condition)
How to Set Up Alerts:
Open indicator on chart
Click on three dots next to indicator name
Select "Create Alert"
In "Condition" field select needed alert:
Golden Cross
Death Cross
STRONG BULLISH
STRONG BEARISH
Bullish Ribbon
Bearish Ribbon
Configure notification method:
Pop-up in browser
Email
SMS (in Premium accounts)
Push notifications in mobile app
Webhook (for automation)
Select frequency:
Once Per Bar Close (recommended) - once on bar close
Once Per Bar - during bar formation
Only Once - only first time
Click "Create"
Tip: Create separate alerts for different timeframes and instruments
FAQ
1. Why don't STRONG signals appear?
Possible reasons:
Incorrect Fast/Mid/Slow order
Solution: Indicator automatically sorts EMAs by periods, but ensure selected EMAs have different periods
Base Multiplier too large
Solution: Reduce Base to 5-10 on lower timeframes
Market in range
Solution: STRONG signals appear only in trends - this is normal
Too strict EMA settings
Solution: Try classic combination: Phi³ / Pi×2 / e² with Base=10
Mid EMA too close to Fast or Slow
Solution: Select Mid EMA with period between Fast and Slow
2. How often should STRONG signals appear?
Normal frequency:
M1-M5: 5-15 signals per day (very active markets)
M15-H1: 2-8 signals per day
H4: 3-10 signals per week
D1: 2-5 signals per month
W1: 2-6 signals per year
If too many signals - market very volatile or Base too small
If too few signals - market in range or Base too large
4. What are the best settings for beginners?
Universal "out of the box" settings:
Matrix Core:
Base Multiplier: 10
Source: close
Phi Golden: Enabled, Power = 3
Pi Circular: Enabled, Multiple = 2
e Natural: Enabled, Power = 2
Delta Adaptive: Enabled, Base = 20, Sensitivity = 2.0
Manual Selection:
Fast: Phi Golden
Mid: e Natural
Slow: Pi Circular
Visualization:
Gradient Clouds: ON
Neon Glow: ON (Medium)
Pulsing Bar: ON (Medium)
Signal Highlights: ON (Light Fill)
Table: ON (Top Right, Small)
Signals:
Golden/Death Cross: ON
STRONG Signals: ON
Stop Loss: OFF (while learning)
Timeframe for learning: H1 or H4
5. Can I use only one EMA?
No, minimum 2 EMAs (Fast and Slow) for signal generation.
Mid EMA is optional:
With Mid EMA = more reliable but rarer signals
Without Mid EMA = more signals but less strict filtering
Recommendation: Start with 3 EMAs (Fast/Mid/Slow), then experiment
6. Does the indicator work on cryptocurrencies?
Yes, works excellently! Especially good on:
Bitcoin (BTC)
Ethereum (ETH)
Major altcoins (SOL, BNB, XRP)
Recommended settings for crypto:
Fast: Delta Adaptive (Base 10-15, Sensitivity 2.5-3.0)
Mid: Pi Circular (2Pi)
Slow: e Natural (e²)
Base: 5-10
Timeframe: M15, H1, H4
Crypto market features:
High volatility → use Delta Adaptive
24/7 trading → set alerts
Sharp movements → wide stops
7. Can I trade only with this indicator?
Technically yes, but NOT recommended.
Best approach - combine with:
Price Action - support/resistance levels, candle patterns
Volume - movement strength confirmation
Fibonacci - retracement and extension levels
RSI/MACD - divergences and overbought/oversold
Fundamental analysis - news, company reports
Hellenic Matrix:
Excellently determines trend and its strength
Provides clear entry/exit points
Doesn't consider fundamentals
Doesn't see major levels
8. Why do Gradient Clouds change color?
Color depends on EMA order:
Phi-Pi Cloud:
Blue - Pi EMA above Phi EMA (bullish alignment)
Gold - Phi EMA above Pi EMA (bearish alignment)
Pi-e Cloud:
Green - e EMA above Pi EMA (bullish alignment)
Blue - Pi EMA above e EMA (bearish alignment)
Color change = EMA order change = possible trend change
9. What is Momentum % in the table?
Momentum % = percentage deviation of price from Fast EMA
Formula:
Momentum = ((Close - Fast EMA) / Fast EMA) × 100
Interpretation:
+0.5% to +2% - normal bullish momentum
+2% to +5% - strong bullish momentum
+5% and above - overheating (correction possible)
-0.5% to -2% - normal bearish momentum
-2% to -5% - strong bearish momentum
-5% and below - oversold (bounce possible)
Usage:
Monitor momentum during STRONG signals
Large momentum = don't enter (wait for pullback)
Small momentum = good entry point
10. How to configure for scalping?
Settings for scalping (M1-M5):
Base Multiplier: 3-5
Source: close or hlc3 (smoother)
Fast: Delta Adaptive (Base 8-12, Sensitivity 3.0)
Mid: None (for more signals)
Slow: Phi Golden (Phi²) or Pi Circular (1Pi)
Visualization:
- Gradient Clouds: ON (helps see strength)
- Neon Glow: OFF (doesn't clutter chart)
- Pulsing Bar: ON (quick assessment)
- Signal Highlights: ON
Signals:
- Golden/Death Cross: ON
- STRONG Signals: ON
- Stop Loss: ON (1.0-1.5 ATR, R:R 1.5-2.0)
Scalping rules:
Trade only STRONG signals
Enter on bounce from Fast EMA
Tight stops (10-20 pips)
Quick take profit (+1R to +2R)
Don't hold through news
11. How to configure for long-term investing?
Settings for investing (D1-W1):
Base Multiplier: 20-30
Source: close
Fast: Phi Golden (Phi³ or Phi⁴)
Mid: e Natural (e²)
Slow: Pi Circular (3Pi or 4Pi)
Visualization:
- Gradient Clouds: ON
- Neon Glow: ON (Medium)
- Everything else - to taste
Signals:
- Golden/Death Cross: ON
- STRONG Signals: ON
- Stop Loss: OFF (use percentage stop)
Investing rules:
Enter only on STRONG signals
Hold while STRONG active (weeks/months)
Stop below Slow EMA or -10%
Take profit: by company targets or +50-100%
Ignore short-term pullbacks
12. What if indicator slows down chart?
Indicator is optimized, but if it slows:
Disable unnecessary visual effects:
Neon Glow: OFF (saves 8 plots)
Gradient Clouds: ON but low quality
Lambda Wave EMA: OFF (if not using)
Reduce number of active EMAs:
Sigma Composite: OFF
Lambda Wave: OFF
Leave only Phi, Pi, e, Delta
Simplify settings:
Pulsing Bar: OFF
Greek Labels: OFF
Info Table: smaller size
13. Can I use on different timeframes simultaneously?
Yes! Multi-timeframe analysis is very powerful:
Classic scheme:
Higher TF (D1, W1) - determine global trend
Wait for STRONG signal
This is our trading direction
Middle TF (H4, H1) - look for confirmation
STRONG signal in same direction
Precise entry zone
Lower TF (M15, M5) - entry point
Golden Cross or bounce from Fast EMA
Precise stop loss
Example:
W1: STRONG BUY active (global uptrend)
H4: STRONG BUY appeared (confirmation)
M15: Wait for Golden Cross or bounce from Fast EMA → ENTRY
Advantages:
Maximum reliability
Clear timeframe hierarchy
Large targets
14. How does indicator work on news?
Delta Adaptive EMA adapts excellently to news:
Before news:
Low volatility → Delta EMA becomes fast → pulls to price
During news:
Sharp volatility spike → Delta EMA slows → filters noise
After news:
Volatility normalizes → Delta EMA returns to normal
Recommendations:
Don't trade at news release moment (spreads widen)
Wait for STRONG signal after news (2-5 bars)
Use Delta Adaptive as Fast EMA for quick reaction
Widen stops by 50-100% during important news
Advanced Techniques
Technique 1: "Divergences with EMA"
Idea: Look for discrepancies between price and Fast EMA
Bullish divergence:
Price makes lower low
Fast EMA makes higher low
= Possible reversal up
Bearish divergence:
Price makes higher high
Fast EMA makes lower high
= Possible reversal down
How to trade:
Find divergence
Wait for STRONG signal in divergence direction
Enter on confirmation
Technique 2: "EMA Tunnel"
Idea: Use space between Fast and Slow EMA as "tunnel"
Rules:
Wide tunnel - strong trend, hold position
Narrow tunnel - weak trend or consolidation, caution
Tunnel narrowing - trend weakening, prepare to exit
Tunnel widening - trend strengthening, can add
Visually: Gradient Clouds show this automatically!
Trading:
Enter on STRONG signal (tunnel starts widening)
Hold while tunnel wide
Exit when tunnel starts narrowing
Technique 3: "Wave Analysis with Lambda"
Idea: Lambda Wave EMA creates sinusoid matching market cycles
Setup:
Lambda Base Period: 30
Lambda Wave Amplitude: 0.5
Lambda Wave Frequency: 50 (adjusted to asset cycle)
How to find correct Frequency:
Look at historical cycles (distance between local highs)
Average distance = your Frequency
Example: if highs every 40-60 bars, set Frequency = 50
Trading:
Enter when Lambda Wave at bottom of sinusoid (growth potential)
Exit when Lambda Wave at top (fall potential)
Combine with STRONG signals
Technique 4: "Cluster Analysis"
Idea: When all EMAs gather in narrow cluster = powerful breakout soon
Cluster signs:
All EMAs (Phi, Pi, e, Delta) within 0.5-1% of each other
Gradient Clouds almost invisible
Price jumping around all EMAs
Trading:
Identify cluster (all EMAs close)
Determine breakout direction (where more volume, higher TFs direction)
Wait for breakout and STRONG signal
Enter on confirmation
Target = cluster size × 3-5
This is very powerful technique for big moves!
Technique 5: "Sigma as Dynamic Level"
Idea: Sigma Composite EMA = average of all EMAs = magnetic level
Usage:
Enable Sigma Composite (Weighted Average)
Sigma works as dynamic support/resistance
Price often returns to Sigma before trend continuation
Trading:
In trend: Enter on bounces from Sigma
In range: Fade moves from Sigma (trade return to Sigma)
On breakout: Sigma becomes support/resistance
Risk Management
Basic Rules
1. Position Size
Conservative: 1% of capital per trade
Moderate: 2% of capital per trade (recommended)
Aggressive: 3-5% (only for experienced)
Calculation formula:
Lot Size = (Capital × Risk%) / (Stop in pips × Pip value)
2. Risk/Reward Ratio
Minimum: 1:1.5
Standard: 1:2 (recommended)
Optimal: 1:3
Aggressive: 1:5+
3. Maximum Drawdown
Daily: -3% to -5%
Weekly: -7% to -10%
Monthly: -15% to -20%
Upon reaching limit → STOP trading until end of period
Position Management Strategies
1. Fixed Stop
Method:
Stop below/above Fast EMA or local extreme
DON'T move stop against position
Can move to breakeven
For whom: Beginners, conservative traders
2. Trailing by Fast EMA
Method:
Each day (or bar) move stop to Fast EMA level
Position closes when price breaks Fast EMA
Advantages:
Stay in trend as long as possible
Automatically exit on reversal
For whom: Trend followers, swing traders
3. Partial Exit
Method:
50% of position close at +2R
50% hold with trailing by Mid EMA or Slow EMA
Advantages:
Lock profit
Leave position for big move
Psychologically comfortable
For whom: Universal method (recommended)
4. Pyramiding
Method:
First entry on STRONG signal (50% of planned position)
Add 25% on pullback to Fast EMA
Add another 25% on pullback to Mid EMA
Overall stop below Slow EMA
Advantages:
Average entry price
Reduce risk
Increase profit in strong trends
Caution:
Works only in trends
In range leads to losses
For whom: Experienced traders
Trading Psychology
Correct Mindset
1. Indicator is a tool, not holy grail
Indicator shows probability, not guarantee
There will be losing trades - this is normal
Important is series statistics, not one trade
2. Trust the system
If STRONG signal appeared - enter
Don't search for "perfect" moment
Follow trading plan
3. Patience
STRONG signals don't appear every day
Better miss signal than enter against trend
Quality over quantity
4. Discipline
Always set stop loss
Don't move stop against position
Don't increase risk after losses
Beginner Mistakes
1. "I know better than indicator"
Indicator says STRONG BUY, but you think "too high, will wait for pullback"
Result: miss profitable move
Solution: Trust signals or don't use indicator
2. "Will reverse now for sure"
Trading against STRONG trend
Result: stops, stops, stops
Solution: Trend is your friend, trade with trend
3. "Will hold a bit more"
Don't exit when STRONG signal disappears
Greed eats profit
Solution: If signal gone - exit!
4. "I'll recover"
After losses double risk
Result: huge losses
Solution: Fixed % risk ALWAYS
5. "I don't like this signal"
Skip signals because of "feeling"
Result: inconsistency, no statistics
Solution: Trade ALL signals or clearly define filters
Trading Journal
What to Record
For each trade:
1. Entry/exit date and time
2. Instrument and timeframe
3. Signal type
Golden Cross
STRONG BUY
STRONG SELL
Death Cross
4. Indicator settings
Fast/Mid/Slow EMA
Base Multiplier
Other parameters
5. Chart screenshot
Entry moment
Exit moment
6. Trade parameters
Position size
Stop loss
Take Profit
R:R
7. Result
Profit/Loss in $
Profit/Loss in %
Profit/Loss in R
8. Notes
What was right
What was wrong
Emotions during trade
Lessons
Journal Analysis
Analyze weekly:
1. Win Rate
Win Rate = (Profitable trades / All trades) × 100%
Good: 50-60%
Excellent: 60-70%
Exceptional: 70%+
2. Average R
Average R = Sum of all R / Number of trades
Good: +0.5R
Excellent: +1.0R
Exceptional: +1.5R+
3. Profit Factor
Profit Factor = Total profit / Total losses
Good: 1.5+
Excellent: 2.0+
Exceptional: 3.0+
4. Maximum Drawdown
Track consecutive losses
If more than 5 in row - stop, check system
5. Best/Worst Trades
What was common in best trades? (do more)
What was common in worst trades? (avoid)
Pre-Trade Checklist
Technical Analysis
STRONG signal active (BUY or SELL)
All EMAs properly aligned (Fast > Mid > Slow or reverse)
Price on correct side of Fast EMA
Gradient Clouds confirm trend
Pulsing Bar shows STRONG state
Momentum % in normal range (not overheated)
No close strong levels against direction
Higher timeframe doesn't contradict
Risk Management
Position size calculated (1-2% risk)
Stop loss set
Take profit calculated (minimum 1:2)
R:R satisfactory
Daily/weekly risk limit not exceeded
No other open correlated positions
Fundamental Analysis
No important news in coming hours
Market session appropriate (liquidity)
No contradicting fundamentals
Understand why asset is moving
Psychology
Calm and thinking clearly
No emotions from previous trades
Ready to accept loss at stop
Following trading plan
Not revenging market for past losses
If at least one point is NO - think twice before entering!
Learning Roadmap
Week 1: Familiarization
Goals:
Install and configure indicator
Study all EMA types
Understand visualization
Tasks:
Add indicator to chart
Test all Fast/Mid/Slow settings
Play with Base Multiplier on different timeframes
Observe Gradient Clouds and Pulsing Bar
Study Info Table
Result: Comfort with indicator interface
Week 2: Signals
Goals:
Learn to recognize all signal types
Understand difference between Golden Cross and STRONG
Tasks:
Find 10 Golden Cross examples in history
Find 10 STRONG BUY examples in history
Compare their results (which worked better)
Set up alerts
Get 5 real alerts
Result: Understanding signals
Week 3: Demo Trading
Goals:
Start trading signals on demo account
Gather statistics
Tasks:
Open demo account
Trade ONLY STRONG signals
Keep journal (minimum 20 trades)
Don't change indicator settings
Strictly follow stop losses
Result: 20+ documented trades
Week 4: Analysis
Goals:
Analyze demo trading results
Optimize approach
Tasks:
Calculate win rate and average R
Find patterns in profitable trades
Find patterns in losing trades
Adjust approach (not indicator!)
Write trading plan
Result: Trading plan on 1 page
Month 2: Improvement
Goals:
Deepen understanding
Add additional techniques
Tasks:
Study multi-timeframe analysis
Test combinations with Price Action
Try advanced techniques (divergences, tunnels)
Continue demo trading (minimum 50 trades)
Achieve stable profitability on demo
Result: Win rate 55%+ and Profit Factor 1.5+
Month 3: Real Trading
Goals:
Transition to real account
Maintain discipline
Tasks:
Open small real account
Trade minimum lots
Strictly follow trading plan
DON'T increase risk
Focus on process, not profit
Result: Psychological comfort on real
Month 4+: Scaling
Goals:
Increase account
Become consistently profitable
Tasks:
With 60%+ win rate can increase risk to 2%
Upon doubling account can add capital
Continue keeping journal
Periodically review and improve strategy
Share experience with community
Result: Stable profitability month after month
Additional Resources
Recommended Reading
Technical Analysis:
"Technical Analysis of Financial Markets" - John Murphy
"Trading in the Zone" - Mark Douglas (psychology)
"Market Wizards" - Jack Schwager (trader interviews)
EMA and Moving Averages:
"Moving Averages 101" - Steve Burns
Articles on Investopedia about EMA
Risk Management:
"The Mathematics of Money Management" - Ralph Vince
"Trade Your Way to Financial Freedom" - Van K. Tharp
Trading Journals:
Edgewonk (paid, very powerful)
Tradervue (free version + premium)
Excel/Google Sheets (free)
Screeners:
TradingView Stock Screener
Finviz (stocks)
CoinMarketCap (crypto)
Conclusion
Hellenic EMA Matrix is a powerful tool based on universal mathematical constants of nature. The indicator combines:
Mathematical elegance - Phi, Pi, e instead of arbitrary numbers
Premium visualization - Neon Glow, Gradient Clouds, Pulsing Bar
Reliable signals - STRONG BUY/SELL work on all timeframes
Flexibility - 6 EMA types, adaptation to any trading style
Automation - auto-sorting EMAs, SL/TP calculation, alerts
Key Success Principles:
Simplicity - start with basic settings (Phi/Pi/e, Base=10)
Discipline - follow STRONG signals strictly
Patience - wait for quality setups
Risk Management - 1-2% per trade, ALWAYS
Journal - document every trade
Learning - constantly improve skills
Remember:
Indicator shows probability, not guarantee
Important is series statistics, not one trade
Psychology more important than technique
Quality more important than quantity
Process more important than result
Acknowledgments
Thank you for using Hellenic EMA Matrix - Alpha Omega Premium!
The indicator was created with love for mathematics, markets, and beautiful visualization.
Wishing you profitable trading!
Guide Version: 1.0
Date: 2025
Compatibility: Pine Script v6, TradingView
"In the simplicity of mathematical constants lies the complexity of market movements"

Market Trend statusBullTrading Free Indicator Series
What is the Trend State Machine?
A “trend state machine” that fuses DMI (+DI/−DI) with ADX strength. It avoids bells and whistles and answers three things with minimal rules:
1. Whether the market is range-bound (chop) or trending;
2. If trending, whether it is bullish (long) or bearish (short);
3. The trend intensity tier (Strong / Extreme / Decaying) plus a 0–100 strength score.
1-Minute Quick Start (beginners can stop here)
1. Timeframe – pick your trading anchor first
• Crypto: 5–15m
• Gold: 5m or 15m
• FX: 15–30m
2. Mode – top of the panel: set Mode = Simple.
3. Sensitivity – set Sensitivity (1 conservative – 5 aggressive). Recommended:
• Crypto: 3 (use 4 in high volatility)
• Gold: 2–3
• FX: 2–3
• Indices: 2
4. Read the card (top-right)
• Environment: Range/Invalid, Bull Trend (Watch), Bull Trend (Confirmed) (bearish equivalents apply)
• Add-ons: | Strong, | Extreme, | Decay
• Also shows ADX, Enter/Exit thresholds, ΔDI, and Score.
5. Background & lines
• Green/Red background = in trend; deeper shade = stronger.
• Orange thick line = ADX, Green = +DI, Red = −DI; shaded band between lines is the enter/exit zone.
6. Minimal execution rules
• Trade with the trend only: consider entries only when Environment = Confirmed and direction is bull/bear.
• Prioritize strength: when Strong Trend triggers or Score > 70, prefer trend-following adds / enable trailing take-profit.
• Exit: when Exit/Flip alert fires, or after Decay if ADX falls back below the enter threshold, reduce/close.
Note: In Simple mode, built-in hysteresis (Enter > Exit) cuts whipsaws significantly—no need to hand-tune thresholds.
How to Use Alerts
• Three built-in fixed alerts:
1. Trend Confirmed (Bull/Bear) — entry/add trigger
2. Strong Trend — momentum reinforcement (chase/add or tighten trailing TP)
3. Exit or Flip — scale-out/close/observe the other side
• Want dynamic messages with numbers? Check “Enable dynamic alerts (alert())” and, when creating the alert, choose Any alert() function call.
Parameter Guidance (rules of thumb)
• Sensitivity: Higher = earlier entries but more false signals; lower = later confirmation but steadier.
• Timeframe: The smaller the timeframe, the lower the sensitivity you usually need; on higher timeframes you may nudge it up.
• Combos:
• Crypto: 5m/15m + Sens 3 (4 in heavy vol)
• Gold: 5m/15m + Sens 2–3
• FX: 15m/30m + Sens 2–3
• Indices: 15m/30m + Sens 2
Pro Mode Highlights (optional)
• Threshold Mode: switch from Fixed (default) to Percentile Adaptive for better robustness across regimes/markets.
• ΔDI / Slope / Hold / Cool-down:
• ΔDI min separation filters weak price/volume divergences.
• ADX slope > threshold on entry rejects “breakouts without growing strength”.
• Min hold bars confirms before output to reduce whipsaws.
• Cool-down bars prevent immediate re-entry after exit/flip.
• MTF Aggregation: enable MTF, default 3× current timeframe, HTF weight 0.3–0.5.
• Turn on Require HTF not opposite & HTF_ADX ≥ exit threshold to effectively filter higher-TF noise.
Reading Cheat Sheet (what you see = what it means)
• Environment: Range/Invalid → Stand down; avoid counter-trend.
• Trend (Watch) → Just entered the zone; wait for Confirmed or buy the pullback with small size.
• Trend (Confirmed) → Trend-following allowed; use Score and Strong/Decay to size/manage.
• Strong Trend → Consider chasing/relaxing TP; momentum is increasing.
• Extreme → Overheated; be cautious chasing—favor trailing to lock gains.
• Decay → Momentum bending down; prepare to trim or tighten stops.
Common Pitfalls & Fixes
• Whipsaws in ranges → Lower sensitivity or move up a timeframe; in Pro mode, enable Slope filter.
• Confirmation too late → During Trend (Watch), try a probe with smaller size; add on confirmation.
• Cross-asset differences → Use Percentile thresholds and MTF weight, or adjust via market presets (Gold/FX/Index).
• Single-signal bias → Always combine Environment + Score + Strong/Decay to avoid tunnel vision.
⸻
Disclaimer: This tool is for educational and research purposes only and does not constitute investment advice or a promise of profit. Trading involves risk; you are solely responsible for your gains and losses.
BullTrading免费指标系列
趋势状态机 是什么:
一个把 DMI(+DI/-DI) 与 ADX 强度合成的“趋势状态机”。它不追求花哨,而是用最小规则输出三件事:
1. 市场当前是 震荡还是趋势;
2. 如是趋势,是 多还是 空;
3. 趋势的 强弱等级(强趋势/极端/衰减)与一个 0–100 的强度分数。
一分钟上手(新手用这个就够)
1. 时间周期:先选你交易的主周期(例:加密 5–15m;黄金 5m 或 15m;外汇 15–30m)。
2. 模式:面板最上方“模式”= 简单。
3. 敏感度:设“敏感度(1保守–5激进)”。推荐:
• Crypto:3(波动大可 4)
• Gold:2–3
• FX:2–3
• 指数/股指:2
4. 读卡片(右上角)
• 环境:震荡/无效、多头趋势(观察)、多头趋势(已确认)(空头同理)
• 附加:|强趋势、|极端、|衰减
• 同时显示 ADX、进入/退出阈值、ΔDI、评分。
5. 底色 & 线
• 绿色/红色底色=处于趋势;颜色越实=越强。
• 橙色粗线=ADX,绿色=+DI,红色=-DI;中间阴影为进入/退出带。
6. 最小执行规则
• 只顺势:环境=已确认 且方向为多/空时才考虑进场。
• 强势优先:出现 强趋势 或评分>70 时,优先做顺势加仓/启动追踪止盈。
• 退出:出现 退出/翻转 告警,或 衰减 后 ADX 再跌回进入阈值下方时,减仓/平仓。
提醒:简单模式下,脚本已内置迟滞(进入>退出),可显著减少抖动;无需再手动校准阈值。
告警怎么用
• 已内置三条固定告警:
1. 趋势已确认(多/空) — 入场/加仓触发器
2. 强趋势 — 趋势强化(可做追击或加速移动止盈)
3. 退出或翻转 — 减仓/止盈/反向观察
• 想带数值的动态文案:勾选“启用动态告警 alert()”,创建告警时选择 Any alert() function call。
参数建议(简易法则)
• 敏感度:更激进(数字大)=更早进场但更易假信号;更保守(数字小)=更迟确认但更稳。
• 时间周期:越小周期越需要降低敏感度;越大周期可略升敏感度。
• 组合:
• Crypto:5m/15m + 敏感度 3(波动大时 4)
• Gold:5m/15m + 敏感度 2–3
• FX:15m/30m + 敏感度 2–3
• 指数:15m/30m + 敏感度 2
专业模式要点(进阶可选)
• 阈值模式:从“固定阈值(默认)”切到“百分位自适应”,在大波动/换市场时更鲁棒。
• ΔDI/斜率/驻留/冷却:
• ΔDI 最小分离度 过滤弱量价背离;
• 进入需 ADX 斜率>阈值 可拒绝“强度不增”的假突破;
• 最小驻留K数 确认后再输出,减少回撤抖动;
• 冷却K数 防止来回打脸。
• MTF 聚合:勾选“启用 MTF”,默认自动 3× 当前周期,HTF 权重 0.3–0.5。
• 要求HTF不反向且HTF_ADX≥退出阈值 打开,能有效剔除逆大级别噪音。
读图速查(你看到=代表什么)
• 环境:震荡/无效 → 暂停;不要逆势开单。
• 趋势(观察) → 刚进入阈值,等待 已确认 或回踩二次确认。
• 趋势(已确认) → 允许顺势;用评分和“强趋势/衰减”微调仓位。
• 强趋势 → 追击或放宽止盈,趋势动能在增强。
• 极端 → 过热区;谨慎追高,更多用移动止盈锁定。
• 衰减 → 动能下弯,准备减仓或收紧止盈。
常见坑 & 对策
• 在震荡箱体频繁进出:降低敏感度或升周期;专业模式勾选“斜率过滤”。
• 确认太慢错过起点:在确认前的“趋势(观察)”阶段,可用更小仓位的试探单,确认后加仓。
• 不同品种差异大:用“百分位”阈值与 MTF 权重;或按市场预设(Gold/FX/Index)微调。
• 只看一个信号:至少同时看 环境状态 + 评分 + 强/衰 三个维度,避免单指标偏差。
本指标仅供教育与研究,不构成投资建议或收益承诺;交易有风险,盈亏自负。

Market Regime IndexThe Market Regime Index is a top-down macro regime nowcasting tool that offers a consolidated view of the market’s risk appetite. It tracks 32 of the world’s most influential markets across asset classes to determine investor sentiment by applying trend-following signals to each independent asset. It features adjustable parameters and a built-in alert system that notifies investors when conditions transition between Risk-On and Risk-Off regimes. The selected markets are grouped into equities (7), fixed income (9), currencies (7), commodities (5), and derivatives (4):
Equities = S&P 500 E-mini Index Futures, Nasdaq-100 E-mini Index Futures, Russell 2000 E-mini Index Futures, STOXX Europe 600 Index Futures, Nikkei 225 Index Futures, MSCI Emerging Markets Index Futures, and S&P 500 High Beta (SPHB)/Low Beta (SPLV) Ratio.
Fixed Income = US 10Y Treasury Yield, US 2Y Treasury Yield, US 10Y-02Y Yield Spread, German 10Y Bund Yield, UK 10Y Gilt Yield, US 10Y Breakeven Inflation Rate, US 10Y TIPS Yield, US High Yield Option-Adjusted Spread, and US Corporate Option-Adjusted Spread.
Currencies = US Dollar Index (DXY), Australian Dollar/US Dollar, Euro/US Dollar, Chinese Yuan/US Dollar, Pound Sterling/US Dollar, Japanese Yen/US Dollar, and Bitcoin/US Dollar.
Commodities = ICE Brent Crude Oil Futures, COMEX Gold Futures, COMEX Silver Futures, COMEX Copper Futures, and S&P Goldman Sachs Commodity Index (GSCI) Futures.
Derivatives = CBOE S&P 500 Volatility Index (VIX), ICE US Bond Market Volatility Index (MOVE), CBOE 3M Implied Correlation Index, and CBOE VIX Volatility Index (VVIX)/VIX.
All assets are directionally aligned with their historical correlation to the S&P 500. Each asset contributes equally based on its individual bullish or bearish signal. The overall market regime is calculated as the difference between the number of Risk-On and Risk-Off signals divided by the total number of assets, displayed as the percentage of markets confirming each regime. Green indicates Risk-On and occurs when the number of Risk-On signals exceeds Risk-Off signals, while red indicates Risk-Off and occurs when the number of Risk-Off signals exceeds Risk-On signals.
Bullish Signal = (Fast MA – Slow MA) > (ATR × ATR Margin)
Bearish Signal = (Fast MA – Slow MA) < –(ATR × ATR Margin)
Market Regime = (Risk-On signals – Risk-Off signals) ÷ Total assets
This indicator is designed with flexibility in mind, allowing users to include or exclude individual assets that contribute to the market regime and adjust the input parameters used for trend signal detection. These parameters apply to each independent asset, and the overall regime signal is smoothed by the signal length to reduce noise and enhance reliability. Investors can position according to the prevailing market regime by selecting factors that have historically outperformed under each regime environment to minimise downside risk and maximise upside potential:
Risk-On Equity Factors = High Beta > Cyclicals > Low Volatility > Defensives.
Risk-Off Equity Factors = Defensives > Low Volatility > Cyclicals > High Beta.
Risk-On Fixed Income Factors = High Yield > Investment Grade > Treasuries.
Risk-Off Fixed Income Factors = Treasuries > Investment Grade > High Yield.
Risk-On Commodity Factors = Industrial Metals > Energy > Agriculture > Gold.
Risk-Off Commodity Factors = Gold > Agriculture > Energy > Industrial Metals.
Risk-On Currency Factors = Cryptocurrencies > Foreign Currencies > US Dollar.
Risk-Off Currency Factors = US Dollar > Foreign Currencies > Cryptocurrencies.
In summary, the Market Regime Index is a comprehensive macro risk-management tool that identifies the current market regime and helps investors align portfolio risk with the market’s underlying risk appetite. Its intuitive, color-coded design makes it an indispensable resource for investors seeking to navigate shifting market conditions and enhance risk-adjusted performance by selecting factors that have historically outperformed. While it has proven historically valuable, asset-specific characteristics and correlations evolve over time as market dynamics change.

DC History & Daily Cross CountOkay, here is a technical document for the Pine Script indicator we developed. This can be used as a guide or description when publishing the script on TradingView or elsewhere.
Technical Document: SMA Cross Signals & Static DC History (Death Cross)
Version: 1.0
Date: April 14, 2025
Indicator Name: Specific Static DC History + Live Signals
Pine Script Version: 5
1. Overview
This TradingView indicator is designed to provide traders with visual signals for Simple Moving Average (SMA) crossovers, specifically focusing on the "Death Cross", while also presenting relevant historical context via a static data table and a real-time daily cross counter.
It combines several features:
Plotting of a fast and a slow Simple Moving Average (SMA).
Visual identification and marking of "Death Cross" events (Fast SMA crossing below Slow SMA) directly on the price chart.
A customizable table displaying static, pre-defined historical performance data of the S&P 500 following specific Death Crosses that occurred between 2016 and 2022.
An optional label that counts the total number of SMA crosses (both Golden Crosses and Death Crosses) occurring during the current trading day/session, including extended hours if enabled by the user on their chart.
2. Features
Customizable SMA Lengths: User-defined periods for both the Fast (default 50) and Slow (default 200) SMAs.
Death Cross Signals: Clear visual markers (red triangles above the bar and optional background shading) when the Fast SMA closes below the Slow SMA.
Optional SMA Plotting: Ability to show or hide the SMA lines themselves.
Static Historical Performance Table: Displays fixed historical return data (1 Week, 1 Month, 3 Months, 6 Months, 1 Year) following specific S&P 500 Death Crosses that occurred on 1/11/2016, 12/7/2018, 3/30/2020, and 3/14/2022. Note: This data is static and does not change based on the current chart.
Customizable Table Position: User can select the on-screen corner for the data table.
Daily SMA Cross Counter: Optionally displays a label showing the cumulative number of times the Fast SMA has crossed above (Golden Cross) or below (Death Cross) the Slow SMA during the current trading day/session.
Extended Hours Compatibility: The Daily Cross Counter includes crosses from pre-market and after-hours sessions if the user has "Extended Trading Hours" enabled on their TradingView chart settings.
3. Technical Explanation
SMA Calculation: The script uses the built-in ta.sma(source, length) function, calculating the Simple Moving Average based on the close price of each bar for the user-defined fastLen and slowLen.
Death Cross Detection: A Death Cross is detected using ta.crossunder(fastMA, slowMA). This function returns true on the first bar where the value of fastMA is less than the value of slowMA, after previously being greater than or equal to it. The comparison is based on the calculated SMA values at the close of each bar.
Golden Cross Detection: Similarly, ta.crossover(fastMA, slowMA) is used to detect Golden Crosses for the daily counter.
Visual Signals: The plotshape() function draws a red triangle above the bar where deathCross is true. The bgcolor() function applies a transparent red background to the bar where deathCross is true.
Static Table Data: The historical performance data for the 4 specified dates (Jan 2016 - Mar 2022) is hardcoded into array variables within the script. This data was derived from a prior analysis (based on the initially provided image, source likely Dow Jones Market Data or similar) and is not calculated dynamically from the chart. The script iterates through these arrays and populates a table object on the last bar.
Daily Cross Counter:
A var int dailyCrossCount variable holds the count, ensuring persistence across bars within a day.
ta.change(time("D")) detects the start of a new daily session based on the chart's symbol and session settings. When true, the dailyCrossCount is reset to 0.
On each bar, if either deathCross or goldenCross is true, the dailyCrossCount is incremented.
A label object displays the dailyCrossCount and is updated on the last bar (barstate.islast).
Extended Hours Inclusion: The script inherently uses the data series provided by the chart. If the chart is configured to include Extended Trading Hours (ETH), the close prices used for SMA calculations will reflect ETH data, and crosses occurring during ETH will be detected and counted.
4. Settings (Inputs)
Show Static Data Table (2016-2022) (Checkbox): Toggles the visibility of the table containing the fixed historical performance data. (Default: On)
Table Position (Dropdown): Selects the corner or side of the chart where the static data table will be displayed. (Default: top_right)
Plot 50/200 SMAs (Checkbox): Toggles the visibility of the Fast and Slow SMA lines on the chart. (Default: On)
Fast MA Length (Integer Input): Sets the lookback period for the Fast Simple Moving Average. (Default: 50)
Slow MA Length (Integer Input): Sets the lookback period for the Slow Simple Moving Average. (Default: 200)
Show Daily Cross Count (Checkbox): Toggles the visibility of the label displaying the number of SMA crosses detected during the current day's session. (Default: On)
5. How to Use / Interpretation
Apply the indicator to your desired chart (e.g., SPY, QQQ, /ES).
Use the plotted SMA lines (if enabled) and the red triangle/background signals to identify potential trend changes indicated by Death Crosses based on your chosen MA lengths. Remember that these are lagging indicators.
Refer to the static data table for historical context only. It shows how the S&P 500 performed following specific Death Crosses between 2016 and 2022. This data is fixed and does not predict future performance.
Use the "Today's SMA Crosses" label (if enabled) to gauge the frequency of interaction between the chosen SMAs during the current session. A higher number might indicate choppier conditions or potential shifts on the chart's timeframe.
Important: For the Daily Cross Counter to reflect pre-market/after-hours activity, ensure "Extended Trading Hours" (ETH) is enabled in your TradingView chart settings.
Be aware that the number of crosses detected by the script (based on bar closes) may differ from visual interpretations of lines touching intraday, especially on lower timeframes.
6. Limitations
Static Table Data: The performance data in the table is fixed to the 4 provided historical instances (2016-2022) and is not calculated dynamically or updated. It serves only as a historical reference point.
Lagging Indicators: Moving Averages and their crosses are lagging indicators and may not signal trend changes precisely at tops or bottoms.
Cross Calculation: Crosses are based on the closing price of each bar. Intraday price movements briefly piercing an SMA may not register as a confirmed cross.
Daily Counter Definition: The definition of "Today" depends on the chart's session timing, which might not align perfectly with a calendar day.
Whipsaws: On lower timeframes or during volatile periods, MA crosses can generate frequent signals (whipsaws) which may be less reliable.
7. Disclaimer
This indicator is provided for informational and educational purposes only. It does not constitute financial advice or a recommendation to buy or sell any security. Trading involves significant risk, and past performance (including the historical data presented in the table) is not indicative of future results. Always conduct your own thorough research and consult with a qualified financial advisor before making any trading decisions.
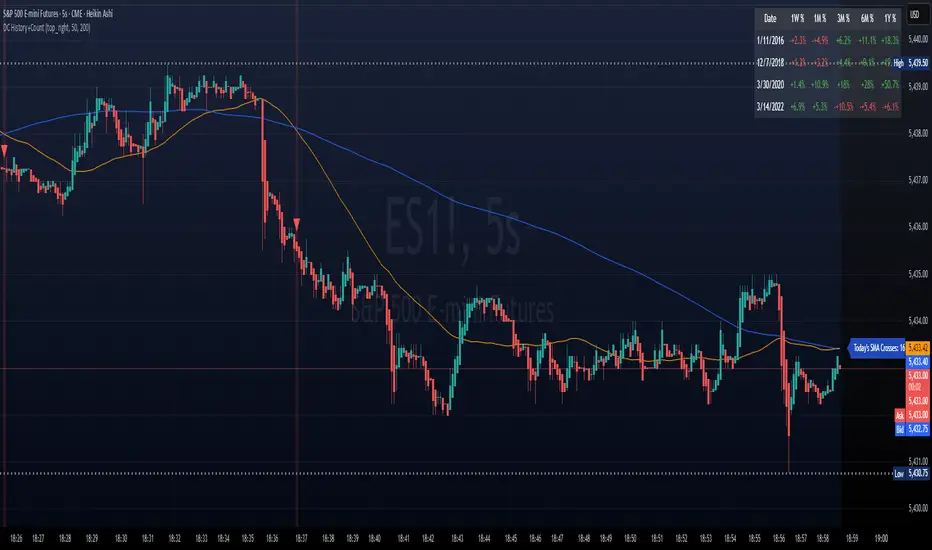
Cross Market AdvancedEnglish Description:
Cross Market Advanced is a TradingView indicator designed for intermarket analysis between two tickers. It compares the price of the primary market (the chart’s ticker) with a secondary market (user-selectable) by calculating their ratio—optionally with a configurable time delay. This feature is especially useful for markets such as oil and gold. Statistical studies show that the gold price typically lags behind the oil price by about 140–150 days, meaning that an oil rally can potentially trigger a gold rally after approximately 145 days.
Key features include:
• Intermarket Comparison: Analyzes the relationship between two different markets.
• Customizable Ratio Calculation: Choose between EMA and SMA smoothing, set evaluation periods, and apply a time delay for the secondary ticker. This delay can be tailored to match market-specific relationships, like the oil-to-gold lag.
• Overbought & Oversold Levels: Visual cues are provided with horizontal reference lines at 70 (overbought) and 30 (oversold), with a shaded zone between, helping to identify extreme market conditions.
• Divergence Detection: Identifies potential divergences between the ticker price and the scaled index. Divergence signals are color-coded (red for bearish, green for bullish) as a rough guide—note that this does not replace detailed technical analysis.
• Additional Plots: Optionally display the raw ratio and z‑score.
• Visual Aids: The indicator displays the selected tickers on the chart along with clear reference levels.
This tool is ideal for traders looking to explore cross-market relationships, identify early signs of potential market reversals, and incorporate time delay effects—particularly in markets like oil and gold.
Deutsche Beschreibung:
Cross Market Advanced ist ein TradingView-Indikator, der eine Intermarket-Analyse zwischen zwei Tickern ermöglicht. Er vergleicht den Kurs des primären Marktes (dem im Chart dargestellten Ticker) mit einem sekundären Markt (frei wählbar), indem er deren Verhältnis berechnet – optional mit einem einstellbaren Zeitversatz. Dieser Zeitversatz ist besonders nützlich, wenn beispielsweise Öl und Gold verglichen werden. Statistischen Untersuchungen zufolge läuft der Goldpreis etwa 140–150 Tage hinter dem Ölpreis her, was bedeuten kann, dass eine Öl-Rallye zu einer Gold-Rallye mit einem Verzögerungsfaktor von etwa 145 Tagen führen kann.
Wichtige Funktionen im Überblick:
• Intermarket-Vergleich: Analyse der Beziehung zwischen zwei unterschiedlichen Märkten.
• Anpassbare Verhältnis-Berechnung: Auswahl zwischen EMA und SMA, Festlegung der Evaluationsperiode sowie Anwendung eines Zeitversatzes für den zweiten Ticker. Dieser Versatz kann an marktspezifische Zusammenhänge angepasst werden, wie z.B. das Öl-Gold-Verhältnis.
• Überkauft & Überverkauft: Mit horizontalen Referenzlinien bei 70 (Überkauft) und 30 (Überverkauft) wird die aktuelle Marktlage visualisiert – der dazwischen liegende, hervorgehobene Bereich hilft, extreme Marktbedingungen zu erkennen.
• Divergenzerkennung: Ermittelt mögliche Divergenzen zwischen dem Ticker-Kurs und dem skalierten Index. Divergenzsignale werden farblich hervorgehoben (rot für bärisch, grün für bullisch) und dienen als grobe Orientierung – sie ersetzen jedoch keine ausführliche charttechnische Analyse.
• Zusatzplots: Optionale Darstellung des Rohwerts des Verhältnisses sowie des z‑Scores.
• Visuelle Hilfen: Der Indikator zeigt die ausgewählten Ticker im Chart sowie die klaren Referenzniveaus an.
Dieser Indikator eignet sich ideal für Trader, die Cross-Market-Beziehungen untersuchen, frühzeitig Hinweise auf mögliche Trendumkehrungen erkennen und auch Verzögerungseffekte – wie etwa beim Öl-Gold-Verhältnis – in ihre Analyse einbeziehen möchten.

Multi-Band Comparison (Uptrend)Multi-Band Comparison
Overview:
The Multi-Band Comparison indicator is engineered to reveal critical levels of support and resistance in strong uptrends. In a healthy upward market, the price action will adhere closely to the 95th percentile line (the Upper Quantile Band), effectively “riding” it. This indicator combines a modified Bollinger Band (set at one standard deviation), quantile analysis (95% and 5% levels), and power‑law math to display a dynamic picture of market structure—highlighting a “golden channel” and robust support areas.
Key Components & Calculations:
The Golden Channel: Upper Bollinger Band & Upper Std Dev Band of the Upper Quantile
Upper Bollinger Band:
Calculation:
boll_upper=SMA(close,length)+(boll_mult×stdev)
boll_upper=SMA(close,length)+(boll_mult×stdev) Here, the 20-period SMA is used along with one standard deviation of the close, where the multiplier (boll_mult) is 1.0.
Role in an Uptrend:
In a healthy uptrend, price rides near the 95th percentile line. When price crosses above this Upper Bollinger Band, it confirms strong bullish momentum.
Upper Std Dev Band of the Upper Quantile (95th Percentile) Band:
Calculation:
quant_upper_std_up=quant_upper+stdev
quant_upper_std_up=quant_upper+stdev The Upper Quantile Band, quant_upperquant_upper, is calculated as the 95th percentile of recent price data. Adding one standard deviation creates an extension that accounts for normal volatility around this extreme level.
The Golden Channel:
When the price crosses above the Upper Bollinger Band, the Upper Std Dev Band of the Upper Quantile immediately shifts to gold (yellow) and remains gold until price falls below the Bollinger level. Together, these two lines form the “golden channel”—a visual hallmark of a healthy uptrend where the price reliably hugs the 95th percentile level.
Upper Power‑Law Band
Calculation:
The Upper Power‑Law Band is derived in two steps:
Determine the Extreme Return Factor:
power_upper=Percentile(returns,95%)
power_upper=Percentile(returns,95%) where returns are computed as:
returns=closeclose −1.
returns=close close−1.
Scale the Current Price:
power_upper_band=close×(1+power_upper)
power_upper_band=close×(1+power_upper)
Rationale and Correlation:
By focusing on the upper 5% of returns (reflecting “fat tails”), the Upper Power‑Law Band captures extreme but statistically expected movements. In an uptrend, its value often converges with the Upper Std Dev Band of the Upper Quantile because both measures reflect heightened volatility and extreme price levels. When the Upper Power‑Law Band exceeds the Upper Std Dev Band, it can signal a temporary overextension.
Upper Quantile Band (95% Percentile)
Calculation:
quant_upper=Percentile(price,95%)
quant_upper=Percentile(price,95%) This level represents where 95% of past price data falls below, and in a robust uptrend the price action practically rides this line.
Color Logic:
Its color shifts from a neutral (blackish) tone to a vibrant, bullish hue when the Upper Power‑Law Band crosses above it—signaling extra strength in the trend.
Lower Quantile and Its Support
Lower Quantile Band (5% Percentile):
Calculation:
quant_lower=Percentile(price,5%)
quant_lower=Percentile(price,5%)
Behavior:
In a healthy uptrend, price remains well above the Lower Quantile Band. It turns red only when price touches or crosses it, serving as a warning signal. Under normal conditions it remains bright green, indicating the market is not nearing these extreme lows.
Lower Std Dev Band of the Lower Quantile:
This line is calculated by subtracting one standard deviation from quant_lowerquant_lower and typically serves as absolute support in nearly all conditions (except during gap or near-gap moves). Its consistent role as support provides traders with a robust level to monitor.
How to Use the Indicator:
Golden Channel and Trend Confirmation:
As price rides the Upper Quantile (95th percentile) perfectly in a healthy uptrend, the Upper Bollinger Band (1 stdev above SMA) and the Upper Std Dev Band of the Upper Quantile form a “golden channel” once price crosses above the Bollinger level. When this occurs, the Upper Std Dev Band remains gold until price dips back below the Bollinger Band. This visual cue reinforces trend strength.
Power‑Law Insights:
The Upper Power‑Law Band, which is based on extreme (95th percentile) returns, tends to align with the Upper Std Dev Band. This convergence reinforces that extreme, yet statistically expected, price moves are occurring—indicating that even though the price rides the 95th percentile, it can only stretch so far before a correction or consolidation.
Support Indicators:
Primary and Secondary Support in Uptrends:
The Upper Bollinger Band and the Lower Std Dev Band of the Upper Quantile act as support zones for minor retracements in the uptrend.
Absolute Support:
The Lower Std Dev Band of the Lower Quantile serves as an almost invariable support area under most market conditions.
Conclusion:
The Multi-Band Comparison indicator unifies advanced statistical techniques to offer a clear view of uptrend structure. In a healthy bull market, price action rides the 95th percentile line with precision, and when the Upper Bollinger Band is breached, the corresponding Upper Std Dev Band turns gold to form a “golden channel.” This, combined with the Power‑Law analysis that captures extreme moves, and the robust lower support levels, provides traders with powerful, multi-dimensional insights for managing entries, exits, and risk.
Disclaimer:
Trading involves risk. This indicator is for educational purposes only and does not constitute financial advice. Always perform your own analysis before making trading decisions.

Enhanced Economic Composite with Dynamic WeightEnhanced Economic Composite with Dynamic Weight
Overview of the Indicator :
The "Enhanced Economic Composite with Dynamic Weight" is a comprehensive tool that combines multiple economic indicators, technical signals, and dynamic weighting to provide insights into market and economic health. It adjusts based on current volatility and recession risk, offering a detailed view of market conditions.
What This Indicator Does :
Tracks Economic Health: Uses key economic and market indicators to assess overall market conditions.
Dynamic Weighting: Adjusts the importance of components like stock indices, gold, and bonds based on volatility (VIX) and yield curve inversion.
Technical Signals: Identifies market momentum shifts through key crossovers like the Golden Cross, Death Cross, Silver Cross, and Hospice Cross.
Recession Shading: Marks known recessions for historical context.
Economic Factors Considered :
TIP (Treasury Inflation-Protected Securities): Reflects inflation expectations.
Gold: A safe-haven asset, increases in weight during volatility or rising momentum.
US Dollar Index (DXY): Measures USD strength, fixed weight of 10%, smoothed with EMA.
Commodities (DBC): Indicates global demand; weight increases with momentum or volatility.
Volatility Index (VIX): Reflects market risk, inversely related to market confidence.
Stock Indices (S&P 500, DJIA, NASDAQ, Russell 2000): Represent market performance, with weights reduced during high volatility or negative yield spread.
Yield Spread (10Y - 2Y Treasuries): Predicts recessions; negative spread reduces stock weighting.
Credit Spread (HYG - TLT): Indicates market risk through corporate vs. government bond yields.
How and Why Factors are Weighted:
Stock Indices get more weight in stable markets (low VIX, positive yield spread), while safe-haven assets like gold and bonds gain weight in volatile markets or during yield curve inversions. This dynamic adjustment ensures the composite reflects current market sentiment.
Technical Signals:
Golden Cross: 50 EMA crossing above 200 SMA, signaling bullish momentum.
Death Cross: 50 EMA below 200 SMA, indicating bearish momentum.
Silver Cross: 21 EMA crossing above 50 EMA, plotted only if below the 200-day SMA, signaling potential upside in downtrend conditions.
Hospice Cross: 50 EMA crosses below 21 EMA, plotted only if 21 EMA is below 200 SMA, a leading bearish signal.
Recession Shading:
Recession periods like the Great Recession, Early 2000s Recession, and COVID-19 Recession are shaded to provide historical context.
Benefits of Using This Indicator:
Comprehensive Analysis: Combines economic fundamentals and technical analysis for a full market view.
Dynamic Risk Adjustment: Weights shift between growth and safe-haven assets based on volatility and recession risk.
Early Signals: The Silver Cross and Hospice Cross provide early warnings of potential market shifts.
Recession Forecasting: Helps predict downturns through the yield curve and recession indicators.
Who Can Benefit:
Traders: Identify market momentum shifts early through crossovers.
Long-term Investors: Use recession warnings and dynamic adjustments to protect portfolios.
Analysts: A holistic tool for analyzing both economic trends and market movements.
This indicator helps users navigate varying market conditions by dynamically adjusting based on economic factors and providing early technical signals for market momentum shifts.

STRX - Macro TimesSTRX - Macro Times
The STRX - Macro Times is an advanced indicator designed to highlight key moments in financial markets based on specific macroeconomic time frames for Forex, Indices, and Gold. With this tool, you can optimize your trading decisions by monitoring periods of increased volatility and activity in the markets, leveraging the most strategic time windows to operate.
Key Features:
Highlighting Forex, Indices, and Gold Sessions:
The STRX - Macro Times automatically colors the candles on the chart during crucial time intervals for Forex, Indices, and Gold markets, helping you easily spot periods of heightened economic and financial activity. This allows you to focus on times when the market is most liquid and volatile, enhancing your trading performance.
Pre-set Macro Times:
The indicator is programmed to highlight three different key time windows for each market:
Forex: Major sessions from 8:30 to 10:00, 12:00 to 13:00, and 15:00 to 15:30.
Indices: Key times from 9:00 to 10:00, 15:45 to 16:15, and 19:00 to 20:00.
Gold: Strategic moments from 8:30 to 10:00, 14:30 to 16:00, and 20:00 to 21:30.
Total Customization:
You can enable or disable the coloring for different markets (Forex, Indices, Gold) based on your trading preferences. This allows you to focus only on the markets you follow, simplifying chart analysis and optimizing your response time to market changes.
Clear and Intuitive Visual Coloring:
The chart bars are colored in white, creating a clear visual distinction to recognize the most relevant time windows. This makes it easy to identify macroeconomic periods without wasting time manually calculating opportunity windows.
With STRX - Macro Times, you’ll have a strategic advantage in trading by focusing on periods of high volatility and improving the efficiency of your operations in the most active markets. This indicator is perfect for those looking to enhance their strategy and operate in sync with the key moments of the global market.

GKD-C Wavelet Oscillator [Loxx]The Giga Kaleidoscope GKD-C Wavelet Oscillator is a Confirmation module included in AlgxTrading's "Giga Kaleidoscope Modularized Trading System."
█ GKD-C Wavelet Oscillator, a brief overview
The Wavelet Oscillator is an advanced technical analysis tool that integrates wavelet transformations with the Kalman filter to provide a nuanced understanding of market trends and momentum. At the heart of this oscillator is the Haar wavelet transform, a mathematical technique that breaks down price data into different frequency components. The Haar transform works by analyzing the price series in pairs, calculating the average and difference between adjacent data points, effectively separating the underlying signal (trend) from noise or minor fluctuations. This decomposition allows the oscillator to isolate significant price movements and reconstruct them with greater clarity through the inverse Haar transform. The Kalman filter is then applied to further smooth the signal, refining the data and reducing the impact of short-term volatility.
This process enhances the oscillator's ability to detect subtle shifts in market dynamics that might be missed by conventional indicators. The GKD-C Wavelet Oscillator utilizes these refined signals to generate two types of trading signals: Zero-line crosses, where the oscillator moves above or below a central reference point, indicating potential bullish or bearish momentum, and Signal crosses, where the current oscillator value crosses its previous value, signaling possible trend reversals. These features make the Wavelet Oscillator particularly effective in identifying key turning points in the market, providing traders with a powerful tool for anticipating and responding to changes in price momentum within the GKD trading system. (Read the sections below to learn how traders can test these different signal types using AlgxTrading's GKD trading system.)
GKD-C Wavelet Oscillator in Zero-line crosses mode
GKD-C Wavelet Oscillator in Signal crosses mode
To explain the features included in the GKD-C Wavelet Oscillator, let's first dive into the details of the Giga Kaleidoscope (GKD) Modularized Trading System.
█ Giga Kaleidoscope (GKD) Modularized Trading System
The GKD Trading System is a comprehensive, algorithmic trading framework from AlgxTrading, designed to optimize trading strategies across various market conditions. It employs a modular approach, incorporating elements such as volatility assessment, trend identification through a baseline, multiple confirmation strategies for signal accuracy, and volume analysis. Key components also include specialized strategies for entry and exit, enabling precise trade execution. The system allows for extensive backtesting, providing traders with the ability to evaluate the effectiveness of their strategies using historical data. Aimed at reducing setup time, the GKD system empowers traders to focus more on strategy refinement and execution, leveraging a wide array of technical indicators for informed decision-making.
🔶 Core components of a GKD Algorithmic Trading System
Each GKD indicator is denoted with a module identifier of either: GKD-BT, GKD-B, GKD-C, GKD-V, GKD-M, or GKD-E. This allows traders to understand to which module each indicator belongs and where each indicator fits into the GKD system. The GKD algorithm is built on the principles of trend, momentum, and volatility. There are eight core components in the GKD trading algorithm:
🔹 Volatility - In the GKD trading system, volatility is used as a part of the system to help determine the appropriate stop loss and take profit levels for a trade. There are 17+ different types of volatility available in the GKD system including Average True Range (ATR), True Range Double (TRD), Close-to-Close, Garman-Klass, and more.
🔹 Baseline (GKD-B) - The baseline is essentially a moving average and is used to determine the overall direction of the market. The baseline in the GKD trading system is used to filter out trades that are not in line with the long-term trend of the market. The baseline is plotted on the chart along with other GKD indicators.
Trades are only taken when the price is in the same direction as the baseline. For example, if the baseline is sloping upwards or price is above the baseline, then only long trades are taken, and if the baseline is sloping downwards or price is below the baseline, then only short trades are taken. This approach helps to ensure that trades are in line with the overall trend of the market, and reduces the risk of entering trades that are likely to fail.
🔹 Confirmation 1, Confirmation 2, Continuation (GKD-C) - The GKD trading system incorporates technical confirmation indicators for the generation of its primary long and short signals, essential for its operation.
The GKD trading system distinguishes three specific categories. The first category, Confirmation 1, encompasses technical indicators designed to identify trends and generate explicit trading signals. The second category, Confirmation 2, a technical indicator used to identify trends; this type of indicator is primarily used to filter the Confirmation 1 indicator signals; however, this type of confirmation indicator also generates signals*. Lastly, the Continuation category includes technical indicators used in conjunction with Confirmation 1 and Confirmation 2 to generate a special type of trading signal called a "Continuation"
In a full GKD trading system all three categories generate signals. (see the section “GKD Trading System Signals” below)
🔹 Volatility/Volume (GKD-V) - Volatility/Volume indicators are used to measure the amount of buying and selling activity in a market. They are based on the trading Volatility/Volume of the market, and can provide information about the strength of the trend. In the GKD trading system, Volatility/Volume indicators are used to confirm trading signals generated by the various other GKD indicators. In the GKD trading system, Volatility is a proxy for Volume and vice versa.
Volatility/Volume indicators reduce the risk of false signals and improve the overall profitability of trades. These indicators can provide additional information about the market that is not captured by GKD-C confirmation and GKD-B baseline indicators.
🔹 Exit (GKD-E) - The exit indicator in the GKD system is an indicator that is deemed effective at identifying optimal exit points. The purpose of the exit indicator is to identify when a trend is likely to reverse or when the market conditions have changed, signaling the need to exit a trade. By using an exit indicator, traders can manage their risk and prevent significant losses.
🔹 Backtest (GKD-BT) - The GKD-BT backtest indicators link all other GKD-C, GKD-B, GKD-E, GKD-V, and GKD-M components together to create a GKD trading system. GKD-BT backtests generate signals (see the section “GKD Trading System Signals” below) from the confluence of various GKD indicators that are imported into the GKD-BT backtest. Backtest types include: GKD-BT solo and full GKD backtest strategies used for a single ticker; GKD-BT optimizers used to optimize a single indicator or the full GKD trading system; GKD-BT Multi-ticker used to backtest a single indicator or the full GKD trading system across up to ten tickers; GKD-BT exotic backtests like CC, Baseline, and Giga Stacks used to test confluence between GKD components to then be injected into a core GKD-BT Multi-ticker backtest or single ticker strategy.
🔹 Metamorphosis (GKD-M)** - The concept of a metamorphosis indicator involves the integration of two or more GKD indicators to generate a compound signal. This is achieved by evaluating the accuracy of each indicator and selecting the signal from the indicator with the highest accuracy. As an illustration, let's consider a scenario where we calculate the accuracy of 10 indicators and choose the signal from the indicator that demonstrates the highest accuracy.
The resulting output from the metamorphosis indicator can then be utilized in a GKD-BT backtest by occupying a slot that aligns with the purpose of the metamorphosis indicator. The slot can be a GKD-B, GKD-C, GKD-E, or GKD-V slot, depending on the specific requirements and objectives of the indicator. This allows for seamless integration and utilization of the compound signal within the GKD-BT framework.
*(see the section “GKD Trading System Signals” below)
**(not a required component of the GKD algorithm)
🔶 What does the application of the GKD trading system look like?
Example trading system:
Volatility: Average True Range (ATR) (selectable in all backtests and other related GKD indicators)
GKD-B Baseline: GKD-B Multi-Ticker Baseline using Hull Moving Average
GKD-C Confirmation 1: GKD-C Advance Trend Pressure
GKD-C Confirmation 2: GKD-C Dorsey Inertia
GKD-C Continuation: GKD-C Stochastic of RSX
GKD-V Volatility/Volume: GKD-V Damiani Volatmeter
GKD-E Exit: GKD-E MFI
GKD-BT Backtest: GKD-BT Multi-Ticker Full GKD Backtest
GKD-M Metamorphosis: GKD-M Baseline Optimizer
**all indicators mentioned above are included in the same AlgxTrading package**
Each module is passed to a GKD-BT backtest module. In the backtest module, all components are combined to formulate trading signals and statistical output. This chaining of indicators requires that each module conform to AlgxTrading's GKD protocol, therefore allowing for the testing of every possible combination of technical indicators that make up the various indictor types in the GKD algorithm.
🔶 GKD Trading System Signals
🔹 Standard Entry requires a sequence of conditions including a confirmation signal from GKD-C, baseline agreement, price criteria related to the Goldie Locks Zone, and concurrence from a second confirmation and volatility/volume indicators.
🔹 1-Candle Standard Entry introduces a two-phase process where initial conditions must be met, followed by a retraction in price and additional confirmations in the subsequent candle, including baseline, confirmations 1 and 2, and volatility/volume criteria.
🔹 Baseline Entry focuses on signals generated by the GKD-B Baseline, requiring agreement from confirmation signals, specific price conditions within the Goldie Locks Zone, and a timing condition related to the confirmation 1 signal.
🔹 1-Candle Baseline Entry mirrors the baseline entry but adds a requirement for a price retraction and subsequent confirmations in the following candle, maintaining the focus on the baseline's guidance.
🔹 Volatility/Volume Entry is predicated on signals from volatility/volume indicators, requiring support from confirmations, price criteria within the Goldie Locks Zone, baseline agreement, and a timing condition for the confirmation 1 signal.
🔹 1-Candle Volatility/Volume Entry adapts the volatility/volume entry to include a phase of initial signal and agreement, followed by a retracement phase that seeks further agreement from the system's components in the subsequent candle.
🔹 Confirmation 2 Entry is based on the second confirmation signal, requiring the first confirmation's agreement, specific price criteria, agreement from volatility/volume indicators, and baseline, with a timing condition for the confirmation 1 signal.
🔹 1-Candle Confirmation 2 Entry adds a retracement requirement to the confirmation 2 entry, necessitating additional agreements from the system's components in the candle following the signal.
🔹 PullBack Entry initiates with a baseline signal and agreement from the first confirmation, with a price condition related to volatility. It then looks for price to return within the Goldie Locks Zone and seeks further agreement from the system's components in the subsequent candle.
🔹 Continuation Entry allows for the continuation of an active position, based on a previously triggered entry strategy. It requires that the baseline hasn't crossed since the initial trigger, alongside ongoing agreements from confirmations and the baseline.
█ GKD-C Wavelet Oscillator, a deep dive
Now that you have a basic understanding of the GKD trading system. let's dive deeper into the features included in the GKD-C Wavelet Oscillator
🔶 GKD-C Wavelet Oscillator Modes aka "Confirmation Type"
The GKD-C Wavelet Oscillator has 4 modes: Confirmation for confirmation 1 and 2; Continuation; Multi-ticker for multi-ticker confirmation 1 and 2; and Optimizer.
🔹 Confirmation: When in this mode, the GKD-C Wavelet Oscillator generates confirmation 1 and 2 signals. These values can then be exported to a GKD-BT backtest strategy.
Signal Key: L = Long, S = Short
GKD-C Wavelet Oscillator in Confirmation mode
Confirmation Exports
GKD-C Wavelet Oscillator in attached to a GKD-BT backtest strategy
**the backtest data rendered to the chart above uses $5 commission per trade and 10% equity per trade with $1 million initial capital. Each backtest result for each ticker assumes these same inputs. The results are NOT cumulative, they are separate and isolated per ticker and trading side, long or short**
🔹 Continuation: When in this mode, the GKD-C Wavelet Oscillator generates continuation signals.
Signal Key: L = Long, S = Short, CL = Continuation Long, CS = Continuation Short
GKD-C Wavelet Oscillator in Continuation mode
Continuation Exports
🔹 Multi-ticker: When in this mode, the GKD-C Wavelet Oscillator generates multi-ticker confirmation 1 and 2. This mode allows users to generate confirmation 1 and 2, and continuation signals for up to 10 different tickers. These values can then be exported to a GKD-BT Multi-ticker backtest.
Signal Key: L = Long, S = Short
GKD-C Wavelet Oscillator in Multi-ticker mode
Multi-ticker Exports
GKD-C Wavelet Oscillator attached to the GKD-BT Multi-ticker SCS Backtest
**the backtest data rendered to the chart above uses $5 commission per trade and 10% equity per trade with $1 million initial capital. Each backtest result for each ticker assumes these same inputs. The results are NOT cumulative, they are separate and isolated per ticker and trading side, long or short**
🔹 Optimizer: When in this mode, the GKD-C Wavelet Oscillator generates optimization signals. These signals allow the user to backtest a range of input values. These values are exported to a GKD-BT optimizer backtest.
Signal Key: L = Long, S = Short
GKD-C Wavelet Oscillator in Optimizer mode
Optimizer Inputs and Exports
GKD-C Wavelet Oscillator attacked to the GKD-BT Optimizer SCS Backtest
**the backtest data rendered to the chart above uses $5 commission per trade and 10% equity per trade with $1 million initial capital. Each backtest result for each ticker assumes these same inputs. The results are NOT cumulative, they are separate and isolated per ticker and trading side, long or short**
█ Conclusion
The GKD-C Wavelet Oscillator serves as a multi-modal component of the GKD trading system allowing traders to optimize and backtest acorss a range of input parameters and tickers. These features decrease total build time required to create a custom GKD algorithmic trading system by allowing users to spend more time trading and less time guessing.
█ How to Access
You can see the Author's Instructions below to learn how to get access.

GKD-BT Optimizer SCSC Backtest [Loxx]The Giga Kaleidoscope GKD-BT Optimizer SCSC Backtest (Solo Confirmation Super Complex) is a Backtest module included in AlgxTrading's "Giga Kaleidoscope Modularized Trading System." (see the section Giga Kaleidoscope (GKD) Modularized Trading System below for an explanation of the GKD trading system)
**the backtest data rendered to the chart above and all screenshots below use $5 commission per trade and 10% equity per trade with $1 million initial capital**
█ GKD-BT Optimizer SCSC Backtest
The GKD-BT Optimizer SCSC Backtest is a comprehensive backtesting module designed to optimize the combination of key GKD indicators within AlgxTrading's "Giga Kaleidoscope Modularized Trading System." This module facilitates precise strategy refinement by allowing traders to configure and optimize the following critical GKD indicators:
GKD-B Baseline
GKD-V Volatility/Volume
GKD-C Confirmation 1
GKD-C Continuation
Each indicator is equipped with an "Optimizer" mode, enabling dynamic feedback and iterative improvements directly into the backtesting environment. This integrated approach ensures that each component contributes effectively to the overall strategy, providing a robust framework for achieving optimized trading outcomes.
The GKD-BT Optimizer supports granular test configurations including a single take profit and stop loss setting, and allows for targeted testing within specified date ranges to simulate forward testing with historical data. This feature is essential for evaluating the resilience and effectiveness of trading strategies under various market conditions.
Furthermore, the module is designed with user-centric features such as:
Customizable Trading Panel: Displays critical backtest results and trade statistics, which can be shown or hidden as per user preference.
Highlighting Thresholds: Users can set thresholds for Total Percent Wins, Percent Profitable, and Profit Factor, which helps in quickly identifying the most relevant metrics for analysis.
The detailed setup ensures that traders can not only adjust their strategies based on historical performance but also fine-tune their approach to meet specific trading objectives.
🔶 To configure this indicator: ***all GKD indicators listed below are all included in the AlgxTrading trading system package***
1. Add GKD-C Confirmation, GKD-B Baseline, GKD-V Volatility/Volume, and GKD-C Continuation to your chart
2. In the GKD-B Baseline indicator, change "Baseline Type" to "Optimizer"
3. In the GKD-V Volatility/Volume indicator, change "Volatility/Volume Type" to "Optimizer"
4. In the GKD-C Confirmation 1 indicator, change "Confirmation Type" to "Optimizer"
5. In the GKD-C Continuation indicator, change "Confirmation Type" to "Optimizer"
An example of steps 2-5. In the screenshot example below, we change the value "Confirmation Type" in the GKD-C Fisher Transform indicator to "Optimizer"
6. In the GKD-BT Optimizer SCSC Backtest, import the value "Input into NEW GKD-BT Backtest" from the GKD-B Baseline indicator into the field "Import GKD-B Baseline indicator"
7. In the GKD-BT Optimizer SCSC Backtest, import the value "Input into NEW GKD-BT Backtest" from the GKD-V Volatility/Volume indicator into the field "Import GKD-V Volatility/Volume indicator"
8. In the GKD-BT Optimizer SCSC Backtest, import the value "Input into NEW GKD-BT Backtest" from the GKD-C Confirmation 1 indicator into the field "Import GKD-C Confirmation 1 indicator"
9. In the GKD-BT Optimizer SCSC Backtest, import the value "Input into NEW GKD-BT Backtest" from the GKD-C Continuation indicator into the field "Import GKD-C Continuation indicator"
An example of steps 6-9. In the screenshot example below, we import the value "Input into NEW GKD-BT Backtest" from the GKD-C Fisher Transform indicator into the GKD-BT Optimizer SCSC Backtest
10. Decide which of the 5 indicators you wish to optimize in first in the GKD-BT Optimizer SCSC Backtest. Change the value of the import from "Input into NEW GKD-BT Backtest" to "Input into NEW GKD-BT Optimizer Signals"
An example of step 10. In the screenshot example below, we chose to optimize the Confirmation 1 indicator, the GKD-C Fisher Transform. We change the value of the field "Import GKD-C Confirmation 1 indicator" from "Input into NEW GKD-BT Backtest" to "Input into NEW GKD-BT Optimizer Signals"
11. In the GKD-BT Optimizer SCSC Backtest and under the "Optimization Settings", use the dropdown menu "Optimization Indicator" to select the type of indicator you selected from step 12 above: "Baseline", "Volatility/Volume", "Confirmation 1", or "Continuation"
12. In the GKD-BT Optimizer SCSC Backtest and under the "Optimization Settings", import the value "Input into NEW GKD-BT Optimizer Start" from the indicator you selected to optimize in step 12 above into the field "Import Optimization Indicator Start"
13. In the GKD-BT Optimizer SCSC Backtest and under the "Optimization Settings", import the value "Input into NEW GKD-BT Optimizer Skip" from the indicator you selected to optimize in step 12 above into the field "Import Optimization Indicator Skip"
An example of step 11. In the screenshot example below, we select "Confirmation 1" from the "Optimization Indicator" dropdown menu
An example of steps 12 and 13. In the screenshot example below, we import "Import Optimization Indicator Start" and "Import Optimization Indicator Skip" from the GKD-C Fisher Transform indicator into their respective fields
🔶 This backtest includes the following metrics
Net profit: Overall profit or loss achieved.
Total Closed Trades: Total number of closed trades, both winning and losing.
Total Percent Wins: Total wins, whether long or short, for the selected time interval regardless of commissions and other profit-modifying addons.
Percent Profitable: Total wins, whether long or short, that are also profitable, taking commissions into account.
Profit Factor: The ratio of gross profits to gross losses, indicating how much money the strategy made for every unit of money it lost.
Average Profit per Trade: The average gain or loss per trade, calculated by dividing the net profit by the total number of closed trades.
Average Number of Bars in Trade: The average number of bars that elapsed during trades for all closed trades.
🔶 Summary of notable settings not already explained above
🔹 Backtest Properties
These settings define the financial and logistical parameters of the trading simulation, including:
Initial Capital: Specifies the starting balance for the backtest, setting the baseline for measuring profitability and loss.
Order Size: Determines the size of trades, which can be fixed or a percentage of the equity, affecting risk and return.
Order Type: Chooses between fixed contract sizes or a percentage-based order size, allowing for static or dynamic trading volumes.
Commission per Order: Accounts for trading costs, subtracting these from profits to provide a more accurate net performance result.
🔹 Signal Qualifiers
This group of settings establishes criteria related to the strategy's Baseline, and Volatility/Volume indicators in relation to the GKD-C Confirmation 1 indicator, which is crucial for validating trade signals. These include:
Maximum Allowable Post Signal Baseline Cross Bars Back: Sets the maximum number of bars that can elapse after a signal generated by a GKD-C Confirmation 1 indicator triggers. If the GKD-C Confirmation 1 indicator generates a long/short signal that doesn't yet agree with the trend position of the Baseline, then should the Baseline "catch-up" to the long/short trend of the GKD-C Confirmation 1 indicator within the number of bars specified by this setting, then a signal is generated.
Maximum Allowable Post Signal Volatility/Volume Cross Bars Back: Sets the maximum number of bars that can elapse after a signal generated by a GKD-C Confirmation 1 indicator triggers. If the GKD-C Confirmation 1 indicator generates a long/short signal that doesn't yet agree with the position of the Volatility/Volume, then should the Volatility/Volume "catch-up" with the long/short of the GKD-C Confirmation 1 indicator within the number of bars specified by this setting, then a signal is generated.
🔹 Signal Settings
Signal Options: These settings allow users to toggle the visibility of different types of entries based on the strategy criteria, such as standard entries, baseline entries, and continuation entries.
Standard Entry Rules Settings: Detailed criteria for standard entries can be customized here, including conditions on baseline agreement, price within specific zones, and agreement with other confirmation indicators.
1-Candle Rule Standard Entry Rules Settings: Similar to standard entries, but with a focus on conditions that must be met within a one-candle timeframe.
Baseline Entry Rules Settings: Specifies rules for entries based on the baseline, including conditions on confirmation agreement and price zones.
Volatility/Volume Entry Rules Settings: This includes settings for entries based on volatility or volume conditions, with specific rules on confirmation agreement and baseline agreement.
Continuation Entry Rules Settings: This group outlines the conditions for continuation entries, focusing on agreement with baseline and confirmation indicators since the entry signal trigger.
🔹 Volatility Settings
Volatility PnL Settings: Parameters for defining the type of volatility measure to use, its period, and multipliers for profit and stop levels.
Volatility Types Included
Standard Deviation of Logarithmic Returns: Quantifies asset volatility using the standard deviation applied to logarithmic returns, capturing symmetric price movements and financial returns' compound nature.
Exponential Weighted Moving Average (EWMA) for Volatility: Focuses on recent market information by applying exponentially decreasing weights to squared logarithmic returns, offering a dynamic view of market volatility.
Roger-Satchell Volatility Measure: Estimates asset volatility by analyzing the high, low, open, and close prices, providing a nuanced view of intraday volatility and market dynamics.
Close-to-Close Volatility Measure: Calculates volatility based on the closing prices of stocks, offering a streamlined but limited perspective on market behavior.
Parkinson Volatility Measure: Enhances volatility estimation by including high and low prices of the trading day, capturing a more accurate reflection of intraday market movements.
Garman-Klass Volatility Measure: Incorporates open, high, low, and close prices for a comprehensive daily volatility measure, capturing significant price movements and market activity.
Yang-Zhang Volatility Measure: Offers an efficient estimation of stock market volatility by combining overnight and intraday price movements, capturing opening jumps and overall market dynamics.
Garman-Klass-Yang-Zhang Volatility Measure: Merges the benefits of Garman-Klass and Yang-Zhang measures, providing a fuller picture of market volatility including opening market reactions.
Pseudo GARCH(2,2) Volatility Model: Mimics a GARCH(2,2) process using exponential moving averages of squared returns, highlighting volatility shocks and their future impact.
ER-Adaptive Average True Range (ATR): Adjusts the ATR period length based on market efficiency, offering a volatility measure that adapts to changing market conditions.
Adaptive Deviation: Dynamically adjusts its calculation period to offer a nuanced measure of volatility that responds to the market's intrinsic rhythms.
Median Absolute Deviation (MAD): Provides a robust measure of statistical variability, focusing on deviations from the median price, offering resilience against outliers.
Mean Absolute Deviation (MAD): Measures the average magnitude of deviations from the mean price, facilitating a straightforward understanding of volatility.
ATR (Average True Range): Finds the average of true ranges over a specified period, indicating the expected price movement and market volatility.
True Range Double (TRD): Offers a nuanced view of volatility by considering a broader range of price movements, identifying significant market sentiment shifts.
🔹 Other Settings
Backtest Dates: Users can specify the timeframe for the backtest, including start and end dates, as well as the acceptable entry time window.
Volatility Inputs: Additional settings related to volatility calculations, such as static percent, internal filter period for median absolute deviation, and parameters for specific volatility models.
UI Options: Settings to customize the user interface, including table activation, date panel visibility, and aesthetics like color and text size.
Export Options: Allows users to select the type of data to export from the backtest, focusing on metrics like net profit, total closed trades, and average profit per trade.
█ Giga Kaleidoscope (GKD) Modularized Trading System
The GKD Trading System is a comprehensive, algorithmic trading framework from AlgxTrading, designed to optimize trading strategies across various market conditions. It employs a modular approach, incorporating elements such as volatility assessment, trend identification through a baseline, multiple confirmation strategies for signal accuracy, and volume analysis. Key components also include specialized strategies for entry and exit, enabling precise trade execution. The system allows for extensive backtesting, providing traders with the ability to evaluate the effectiveness of their strategies using historical data. Aimed at reducing setup time, the GKD system empowers traders to focus more on strategy refinement and execution, leveraging a wide array of technical indicators for informed decision-making.
🔶 Core components of a GKD Algorithmic Trading System
Each GKD indicator is denoted with a module identifier of either: GKD-BT, GKD-B, GKD-C, GKD-V, GKD-M, or GKD-E. This allows traders to understand to which module each indicator belongs and where each indicator fits into the GKD system. The GKD algorithm is built on the principles of trend, momentum, and volatility. There are eight core components in the GKD trading algorithm:
🔹 Volatility - In the GKD trading system, volatility is used as a part of the system to help determine the appropriate stop loss and take profit levels for a trade. There are 17+ different types of volatility available in the GKD system including Average True Range (ATR), True Range Double (TRD), Close-to-Close, Garman-Klass, and more.
🔹 Baseline (GKD-B) - The baseline is essentially a moving average and is used to determine the overall direction of the market. The baseline in the GKD trading system is used to filter out trades that are not in line with the long-term trend of the market. The baseline is plotted on the chart along with other GKD indicators.
Trades are only taken when the price is in the same direction as the baseline. For example, if the baseline is sloping upwards or price is above the baseline, then only long trades are taken, and if the baseline is sloping downwards or price is below the baseline, then only short trades are taken. This approach helps to ensure that trades are in line with the overall trend of the market, and reduces the risk of entering trades that are likely to fail.
🔹 Confirmation 1, Confirmation 2, Continuation (GKD-C) - The GKD trading system incorporates technical confirmation indicators for the generation of its primary long and short signals, essential for its operation.
The GKD trading system distinguishes three specific categories. The first category, Confirmation 1 , encompasses technical indicators designed to identify trends and generate explicit trading signals. The second category, Confirmation 2 , a technical indicator used to identify trends; this type of indicator is primarily used to filter the Confirmation 1 indicator signals; however, this type of confirmation indicator also generates signals*. Lastly, the Continuation category includes technical indicators used in conjunction with Confirmation 1 and Confirmation 2 to generate a special type of trading signal called a "Continuation"
In a full GKD trading system all three categories generate signals. (see the section “GKD Trading System Signals” below)
🔹 Volatility/Volume (GKD-V) - Volatility/Volume indicators are used to measure the amount of buying and selling activity in a market. They are based on the trading Volatility/Volume of the market, and can provide information about the strength of the trend. In the GKD trading system, Volatility/Volume indicators are used to confirm trading signals generated by the various other GKD indicators. In the GKD trading system, Volatility is a proxy for Volume and vice versa.
Volatility/Volume indicators reduce the risk of false signals and improve the overall profitability of trades. These indicators can provide additional information about the market that is not captured by GKD-C confirmation and GKD-B baseline indicators.
🔹 Exit (GKD-E) - The exit indicator in the GKD system is an indicator that is deemed effective at identifying optimal exit points. The purpose of the exit indicator is to identify when a trend is likely to reverse or when the market conditions have changed, signaling the need to exit a trade. By using an exit indicator, traders can manage their risk and prevent significant losses.
🔹 Backtest (GKD-BT) - The GKD-BT backtest indicators link all other GKD-C, GKD-B, GKD-E, GKD-V, and GKD-M components together to create a GKD trading system. GKD-BT backtests generate signals (see the section “GKD Trading System Signals” below) from the confluence of various GKD indicators that are imported into the GKD-BT backtest. Backtest types include: GKD-BT solo and full GKD backtest strategies used for a single ticker; GKD-BT optimizers used to optimize a single indicator or the full GKD trading system; GKD-BT Multi-ticker used to backtest a single indicator or the full GKD trading system across up to ten tickers; GKD-BT exotic backtests like CC, Baseline, and Giga Stacks used to test confluence between GKD components to then be injected into a core GKD-BT Multi-ticker backtest or single ticker strategy.
🔹 Metamorphosis (GKD-M) ** - The concept of a metamorphosis indicator involves the integration of two or more GKD indicators to generate a compound signal. This is achieved by evaluating the accuracy of each indicator and selecting the signal from the indicator with the highest accuracy. As an illustration, let's consider a scenario where we calculate the accuracy of 10 indicators and choose the signal from the indicator that demonstrates the highest accuracy.
The resulting output from the metamorphosis indicator can then be utilized in a GKD-BT backtest by occupying a slot that aligns with the purpose of the metamorphosis indicator. The slot can be a GKD-B, GKD-C, GKD-E, or GKD-V slot, depending on the specific requirements and objectives of the indicator. This allows for seamless integration and utilization of the compound signal within the GKD-BT framework.
*see the section “GKD Trading System Signals” below
**not a required component of the GKD algorithm
🔶 What does the application of the GKD trading system look like?
Example trading system:
Volatility: Average True Range (ATR) (selectable in all backtests and other related GKD indicators)
GKD-B Baseline: GKD-B Multi-Ticker Baseline using Hull Moving Average
GKD-C Confirmation 1 : GKD-C Advance Trend Pressure
GKD-C Confirmation 2: GKD-C Dorsey Inertia
GKD-C Continuation: GKD-C Stochastic of RSX
GKD-V Volatility/Volume: GKD-V Damiani Volatmeter
GKD-E Exit: GKD-E MFI
GKD-BT Backtest: GKD-BT Multi-Ticker Full GKD Backtest
GKD-M Metamorphosis: GKD-M Baseline Optimizer
**all indicators mentioned above are included in the same AlgxTrading package**
Each module is passed to a GKD-BT backtest module. In the backtest module, all components are combined to formulate trading signals and statistical output. This chaining of indicators requires that each module conform to AlgxTrading's GKD protocol, therefore allowing for the testing of every possible combination of technical indicators that make up the various indictor types in the GKD algorithm.
🔶 GKD Trading System Signals
Standard Entry requires a sequence of conditions including a confirmation signal from GKD-C, baseline agreement, price criteria related to the Goldie Locks Zone, and concurrence from a second confirmation and volatility/volume indicators.
1-Candle Standard Entry introduces a two-phase process where initial conditions must be met, followed by a retraction in price and additional confirmations in the subsequent candle, including baseline, confirmations 1 and 2, and volatility/volume criteria.
Baseline Entry focuses on signals generated by the GKD-B Baseline, requiring agreement from confirmation signals, specific price conditions within the Goldie Locks Zone, and a timing condition related to the confirmation 1 signal.
1-Candle Baseline Entry mirrors the baseline entry but adds a requirement for a price retraction and subsequent confirmations in the following candle, maintaining the focus on the baseline's guidance.
Volatility/Volume Entry is predicated on signals from volatility/volume indicators, requiring support from confirmations, price criteria within the Goldie Locks Zone, baseline agreement, and a timing condition for the confirmation 1 signal.
1-Candle Volatility/Volume Entry adapts the volatility/volume entry to include a phase of initial signal and agreement, followed by a retracement phase that seeks further agreement from the system's components in the subsequent candle.
Confirmation 2 Entry is based on the second confirmation signal, requiring the first confirmation's agreement, specific price criteria, agreement from volatility/volume indicators, and baseline, with a timing condition for the confirmation 1 signal.
1-Candle Confirmation 2 Entry adds a retracement requirement to the confirmation 2 entry, necessitating additional agreements from the system's components in the candle following the signal.
PullBack Entry initiates with a baseline signal and agreement from the first confirmation, with a price condition related to volatility. It then looks for price to return within the Goldie Locks Zone and seeks further agreement from the system's components in the subsequent candle.
Continuation Entry allows for the continuation of an active position, based on a previously triggered entry strategy. It requires that the baseline hasn't crossed since the initial trigger, alongside ongoing agreements from confirmations and the baseline.
█ Conclusion
The GKD-BT Optimizer SCSC Backtest is a critical tool within the Giga Kaleidoscope Modularized Trading System, designed for precise strategy refinement and evaluation within the GKD framework. It enables the optimization and testing of various trading indicators and strategies under different market conditions. The module's design facilitates detailed analysis of individual trading components' performance, allowing for the optimization of indicators like Baseline, Volatility/Volume, Confirmation, and Continuation. This optimization process aids traders in identifying the most effective configurations, thereby enhancing trading outcomes and strategy efficiency within the GKD ecosystem.
█ How to Access
You can see the Author's Instructions below to learn how to get access.

GKD-BT Optimizer Full GKD Backtest [Loxx]The Giga Kaleidoscope GKD-BT Optimizer Full GKD Backtest is a Backtest module included in AlgxTrading's "Giga Kaleidoscope Modularized Trading System." (see the section Giga Kaleidoscope (GKD) Modularized Trading System below for an explanation of the GKD trading system)
**the backtest data rendered to the chart above and all screenshots below use $5 commission per trade and 10% equity per trade with $1 million initial capital**
█ GKD-BT Optimizer Full GKD Backtest
The GKD-BT Optimizer Full GKD Backtest is a comprehensive backtesting module designed to optimize the combination of key GKD indicators within AlgxTrading's "Giga Kaleidoscope Modularized Trading System." This module facilitates precise strategy refinement by allowing traders to configure and optimize the following critical GKD indicators:
GKD-B Baseline
GKD-V Volatility/Volume
GKD-C Confirmation 1
GKD-C Confirmation 2
GKD-C Continuation
Each indicator is equipped with an "Optimizer" mode, enabling dynamic feedback and iterative improvements directly into the backtesting environment. This integrated approach ensures that each component contributes effectively to the overall strategy, providing a robust framework for achieving optimized trading outcomes.
The GKD-BT Optimizer supports granular test configurations including a single take profit and stop loss setting, and allows for targeted testing within specified date ranges to simulate forward testing with historical data. This feature is essential for evaluating the resilience and effectiveness of trading strategies under various market conditions.
Furthermore, the module is designed with user-centric features such as:
Customizable Trading Panel: Displays critical backtest results and trade statistics, which can be shown or hidden as per user preference.
Highlighting Thresholds: Users can set thresholds for Total Percent Wins, Percent Profitable, and Profit Factor, which helps in quickly identifying the most relevant metrics for analysis.
The detailed setup ensures that traders can not only adjust their strategies based on historical performance but also fine-tune their approach to meet specific trading objectives.
🔶 To configure this indicator: ***all GKD indicators listed below are all included in the AlgxTrading trading system package***
1. Add GKD-C Confirmation, GKD-B Baseline, GKD-V Volatility/Volume, GKD-C Confirmation 2, and GKD-C Continuation to your chart
2. In the GKD-B Baseline indicator, change "Baseline Type" to "Optimizer"
3. In the GKD-V Volatility/Volume indicator, change "Volatility/Volume Type" to "Optimizer"
4. In the GKD-C Confirmation 1 indicator, change "Confirmation Type" to "Optimizer"
5. In the GKD-C Confirmation 2 indicator, change "Confirmation Type" to "Optimizer"
6. In the GKD-C Continuation indicator, change "Confirmation Type" to "Optimizer"
An example of steps 2-6. In the screenshot example below, we change the value "Confirmation Type" in the GKD-C Fisher Transform indicator to "Optimizer"
7. In the GKD-BT Optimizer Full GKD Backtest, import the value "Input into NEW GKD-BT Backtest" from the GKD-B Baseline indicator into the field "Import GKD-B Baseline indicator"
8. In the GKD-BT Optimizer Full GKD Backtest, import the value "Input into NEW GKD-BT Backtest" from the GKD-V Volatility/Volume indicator into the field "Import GKD-V Volatility/Volume indicator"
9. In the GKD-BT Optimizer Full GKD Backtest, import the value "Input into NEW GKD-BT Backtest" from the GKD-C Confirmation 1 indicator into the field "Import GKD-C Confirmation 1 indicator"
10. In the GKD-BT Optimizer Full GKD Backtest, import the value "Input into NEW GKD-BT Backtest" from the GKD-C Confirmation 2 indicator into the field "Import GKD-C Confirmation 2 indicator"
11. In the GKD-BT Optimizer Full GKD Backtest, import the value "Input into NEW GKD-BT Backtest" from the GKD-C Continuation indicator into the field "Import GKD-C Continuation indicator"
An example of steps 7-11. In the screenshot example below, we import the value "Input into NEW GKD-BT Backtest" from the GKD-C Coppock Curve indicator into the GKD-BT Optimizer Full GKD Backtest
12. Decide which of the 5 indicators you wish to optimize in first in the GKD-BT Optimizer Full GKD Backtest. Change the value of the import from "Input into NEW GKD-BT Backtest" to "Input into NEW GKD-BT Optimizer Signals"
An example of step 12. In the screenshot example below, we chose to optimize the Confirmation 1 indicator, the GKD-C Fisher Transform. We change the value of the field "Import GKD-C Confirmation 1 indicator" from "Input into NEW GKD-BT Backtest" to "Input into NEW GKD-BT Optimizer Signals"
13. In the GKD-BT Optimizer Full GKD Backtest and under the "Optimization Settings", use the dropdown menu "Optimization Indicator" to select the type of indicator you selected from step 12 above: "Baseline", "Volatility/Volume", "Confirmation 1", "Confirmation 2", or "Continuation"
14. In the GKD-BT Optimizer Full GKD Backtest and under the "Optimization Settings", import the value "Input into NEW GKD-BT Optimizer Start" from the indicator you selected to optimize in step 12 above into the field "Import Optimization Indicator Start"
15. In the GKD-BT Optimizer Full GKD Backtest and under the "Optimization Settings", import the value "Input into NEW GKD-BT Optimizer Skip" from the indicator you selected to optimize in step 12 above into the field "Import Optimization Indicator Skip"
An example of step 13. In the screenshot example below, we select "Confirmation 1" from the "Optimization Indicator" dropdown menu
An example of steps 14 and 15. In the screenshot example below, we import "Import Optimization Indicator Start" and "Import Optimization Indicator Skip" from the GKD-C Fisher Transform indicator into their respective fields
🔶 This backtest includes the following metrics
Net profit: Overall profit or loss achieved.
Total Closed Trades: Total number of closed trades, both winning and losing.
Total Percent Wins: Total wins, whether long or short, for the selected time interval regardless of commissions and other profit-modifying addons.
Percent Profitable: Total wins, whether long or short, that are also profitable, taking commissions into account.
Profit Factor: The ratio of gross profits to gross losses, indicating how much money the strategy made for every unit of money it lost.
Average Profit per Trade: The average gain or loss per trade, calculated by dividing the net profit by the total number of closed trades.
Average Number of Bars in Trade: The average number of bars that elapsed during trades for all closed trades.
🔶 Summary of notable settings not already explained above
🔹 Backtest Properties
These settings define the financial and logistical parameters of the trading simulation, including:
Initial Capital: Specifies the starting balance for the backtest, setting the baseline for measuring profitability and loss.
Order Size: Determines the size of trades, which can be fixed or a percentage of the equity, affecting risk and return.
Order Type: Chooses between fixed contract sizes or a percentage-based order size, allowing for static or dynamic trading volumes.
Commission per Order: Accounts for trading costs, subtracting these from profits to provide a more accurate net performance result.
🔹 Signal Qualifiers
This group of settings establishes criteria related to the strategy's Baseline, Volatility/Volume, and Confirmation 2 indicators in relation to the GKD-C Confirmation 1 indicator, which is crucial for validating trade signals. These include:
Maximum Allowable Post Signal Baseline Cross Bars Back: Sets the maximum number of bars that can elapse after a signal generated by a GKD-C Confirmation 1 indicator triggers. If the GKD-C Confirmation 1 indicator generates a long/short signal that doesn't yet agree with the trend position of the Baseline, then should the Baseline "catch-up" to the long/short trend of the GKD-C Confirmation 1 indicator within the number of bars specified by this setting, then a signal is generated.
Maximum Allowable Post Signal Volatility/Volume Cross Bars Back: Sets the maximum number of bars that can elapse after a signal generated by a GKD-C Confirmation 1 indicator triggers. If the GKD-C Confirmation 1 indicator generates a long/short signal that doesn't yet agree with the position of the Volatility/Volume, then should the Volatility/Volume "catch-up" with the long/short of the GKD-C Confirmation 1 indicator within the number of bars specified by this setting, then a signal is generated.
Maximum Allowable Post Signal Confirmation 2 Cross Bars Back: Sets the maximum number of bars that can elapse after a signal generated by a GKD-C Confirmation 1 indicator triggers. If the GKD-C Confirmation 1 indicator generates a long/short signal that doesn't yet agree with the trend position of the Confirmation 2, then should the Confirmation 2 "catch-up" to the long/short trend of the GKD-C Confirmation 1 indicator within the number of bars specified by this setting, then a signal is generated.
🔹 Signal Settings
Signal Options: These settings allow users to toggle the visibility of different types of entries based on the strategy criteria, such as standard entries, baseline entries, and continuation entries.
Standard Entry Rules Settings: Detailed criteria for standard entries can be customized here, including conditions on baseline agreement, price within specific zones, and agreement with other confirmation indicators.
1-Candle Rule Standard Entry Rules Settings: Similar to standard entries, but with a focus on conditions that must be met within a one-candle timeframe.
Baseline Entry Rules Settings: Specifies rules for entries based on the baseline, including conditions on confirmation agreement and price zones.
Volatility/Volume Entry Rules Settings: This includes settings for entries based on volatility or volume conditions, with specific rules on confirmation agreement and baseline agreement.
Confirmation 2 Entry Rules Settings: Settings here define the rules for entries based on a second confirmation indicator, detailing the required agreements and conditions.
Continuation Entry Rules Settings: This group outlines the conditions for continuation entries, focusing on agreement with baseline and confirmation indicators since the entry signal trigger.
🔹 Volatility Settings
Volatility PnL Settings: Parameters for defining the type of volatility measure to use, its period, and multipliers for profit and stop levels.
Volatility Types Included
Standard Deviation of Logarithmic Returns: Quantifies asset volatility using the standard deviation applied to logarithmic returns, capturing symmetric price movements and financial returns' compound nature.
Exponential Weighted Moving Average (EWMA) for Volatility: Focuses on recent market information by applying exponentially decreasing weights to squared logarithmic returns, offering a dynamic view of market volatility.
Roger-Satchell Volatility Measure: Estimates asset volatility by analyzing the high, low, open, and close prices, providing a nuanced view of intraday volatility and market dynamics.
Close-to-Close Volatility Measure: Calculates volatility based on the closing prices of stocks, offering a streamlined but limited perspective on market behavior.
Parkinson Volatility Measure: Enhances volatility estimation by including high and low prices of the trading day, capturing a more accurate reflection of intraday market movements.
Garman-Klass Volatility Measure: Incorporates open, high, low, and close prices for a comprehensive daily volatility measure, capturing significant price movements and market activity.
Yang-Zhang Volatility Measure: Offers an efficient estimation of stock market volatility by combining overnight and intraday price movements, capturing opening jumps and overall market dynamics.
Garman-Klass-Yang-Zhang Volatility Measure: Merges the benefits of Garman-Klass and Yang-Zhang measures, providing a fuller picture of market volatility including opening market reactions.
Pseudo GARCH(2,2) Volatility Model: Mimics a GARCH(2,2) process using exponential moving averages of squared returns, highlighting volatility shocks and their future impact.
ER-Adaptive Average True Range (ATR): Adjusts the ATR period length based on market efficiency, offering a volatility measure that adapts to changing market conditions.
Adaptive Deviation: Dynamically adjusts its calculation period to offer a nuanced measure of volatility that responds to the market's intrinsic rhythms.
Median Absolute Deviation (MAD): Provides a robust measure of statistical variability, focusing on deviations from the median price, offering resilience against outliers.
Mean Absolute Deviation (MAD): Measures the average magnitude of deviations from the mean price, facilitating a straightforward understanding of volatility.
ATR (Average True Range): Finds the average of true ranges over a specified period, indicating the expected price movement and market volatility.
True Range Double (TRD): Offers a nuanced view of volatility by considering a broader range of price movements, identifying significant market sentiment shifts.
🔹 Other Settings
Backtest Dates: Users can specify the timeframe for the backtest, including start and end dates, as well as the acceptable entry time window.
Volatility Inputs: Additional settings related to volatility calculations, such as static percent, internal filter period for median absolute deviation, and parameters for specific volatility models.
UI Options: Settings to customize the user interface, including table activation, date panel visibility, and aesthetics like color and text size.
Export Options: Allows users to select the type of data to export from the backtest, focusing on metrics like net profit, total closed trades, and average profit per trade.
█ Giga Kaleidoscope (GKD) Modularized Trading System
The GKD Trading System is a comprehensive, algorithmic trading framework from AlgxTrading, designed to optimize trading strategies across various market conditions. It employs a modular approach, incorporating elements such as volatility assessment, trend identification through a baseline, multiple confirmation strategies for signal accuracy, and volume analysis. Key components also include specialized strategies for entry and exit, enabling precise trade execution. The system allows for extensive backtesting, providing traders with the ability to evaluate the effectiveness of their strategies using historical data. Aimed at reducing setup time, the GKD system empowers traders to focus more on strategy refinement and execution, leveraging a wide array of technical indicators for informed decision-making.
🔶 Core components of a GKD Algorithmic Trading System
Each GKD indicator is denoted with a module identifier of either: GKD-BT, GKD-B, GKD-C, GKD-V, GKD-M, or GKD-E. This allows traders to understand to which module each indicator belongs and where each indicator fits into the GKD system. The GKD algorithm is built on the principles of trend, momentum, and volatility. There are eight core components in the GKD trading algorithm:
🔹 Volatility - In the GKD trading system, volatility is used as a part of the system to help determine the appropriate stop loss and take profit levels for a trade. There are 17+ different types of volatility available in the GKD system including Average True Range (ATR), True Range Double (TRD), Close-to-Close, Garman-Klass, and more.
🔹 Baseline (GKD-B) - The baseline is essentially a moving average and is used to determine the overall direction of the market. The baseline in the GKD trading system is used to filter out trades that are not in line with the long-term trend of the market. The baseline is plotted on the chart along with other GKD indicators.
Trades are only taken when the price is in the same direction as the baseline. For example, if the baseline is sloping upwards or price is above the baseline, then only long trades are taken, and if the baseline is sloping downwards or price is below the baseline, then only short trades are taken. This approach helps to ensure that trades are in line with the overall trend of the market, and reduces the risk of entering trades that are likely to fail.
🔹 Confirmation 1, Confirmation 2, Continuation (GKD-C) - The GKD trading system incorporates technical confirmation indicators for the generation of its primary long and short signals, essential for its operation.
The GKD trading system distinguishes three specific categories. The first category, Confirmation 1 , encompasses technical indicators designed to identify trends and generate explicit trading signals. The second category, Confirmation 2 , a technical indicator used to identify trends; this type of indicator is primarily used to filter the Confirmation 1 indicator signals; however, this type of confirmation indicator also generates signals*. Lastly, the Continuation category includes technical indicators used in conjunction with Confirmation 1 and Confirmation 2 to generate a special type of trading signal called a "Continuation"
In a full GKD trading system all three categories generate signals. (see the section “GKD Trading System Signals” below)
🔹 Volatility/Volume (GKD-V) - Volatility/Volume indicators are used to measure the amount of buying and selling activity in a market. They are based on the trading Volatility/Volume of the market, and can provide information about the strength of the trend. In the GKD trading system, Volatility/Volume indicators are used to confirm trading signals generated by the various other GKD indicators. In the GKD trading system, Volatility is a proxy for Volume and vice versa.
Volatility/Volume indicators reduce the risk of false signals and improve the overall profitability of trades. These indicators can provide additional information about the market that is not captured by GKD-C confirmation and GKD-B baseline indicators.
🔹 Exit (GKD-E) - The exit indicator in the GKD system is an indicator that is deemed effective at identifying optimal exit points. The purpose of the exit indicator is to identify when a trend is likely to reverse or when the market conditions have changed, signaling the need to exit a trade. By using an exit indicator, traders can manage their risk and prevent significant losses.
🔹 Backtest (GKD-BT) - The GKD-BT backtest indicators link all other GKD-C, GKD-B, GKD-E, GKD-V, and GKD-M components together to create a GKD trading system. GKD-BT backtests generate signals (see the section “GKD Trading System Signals” below) from the confluence of various GKD indicators that are imported into the GKD-BT backtest. Backtest types include: GKD-BT solo and full GKD backtest strategies used for a single ticker; GKD-BT optimizers used to optimize a single indicator or the full GKD trading system; GKD-BT Multi-ticker used to backtest a single indicator or the full GKD trading system across up to ten tickers; GKD-BT exotic backtests like CC, Baseline, and Giga Stacks used to test confluence between GKD components to then be injected into a core GKD-BT Multi-ticker backtest or single ticker strategy.
🔹 Metamorphosis (GKD-M) ** - The concept of a metamorphosis indicator involves the integration of two or more GKD indicators to generate a compound signal. This is achieved by evaluating the accuracy of each indicator and selecting the signal from the indicator with the highest accuracy. As an illustration, let's consider a scenario where we calculate the accuracy of 10 indicators and choose the signal from the indicator that demonstrates the highest accuracy.
The resulting output from the metamorphosis indicator can then be utilized in a GKD-BT backtest by occupying a slot that aligns with the purpose of the metamorphosis indicator. The slot can be a GKD-B, GKD-C, GKD-E, or GKD-V slot, depending on the specific requirements and objectives of the indicator. This allows for seamless integration and utilization of the compound signal within the GKD-BT framework.
*see the section “GKD Trading System Signals” below
**not a required component of the GKD algorithm
🔶 What does the application of the GKD trading system look like?
Example trading system:
Volatility: Average True Range (ATR) (selectable in all backtests and other related GKD indicators)
GKD-B Baseline: GKD-B Multi-Ticker Baseline using Hull Moving Average
GKD-C Confirmation 1 : GKD-C Advance Trend Pressure
GKD-C Confirmation 2: GKD-C Dorsey Inertia
GKD-C Continuation: GKD-C Stochastic of RSX
GKD-V Volatility/Volume: GKD-V Damiani Volatmeter
GKD-E Exit: GKD-E MFI
GKD-BT Backtest: GKD-BT Multi-Ticker Full GKD Backtest
GKD-M Metamorphosis: GKD-M Baseline Optimizer
**all indicators mentioned above are included in the same AlgxTrading package**
Each module is passed to a GKD-BT backtest module. In the backtest module, all components are combined to formulate trading signals and statistical output. This chaining of indicators requires that each module conform to AlgxTrading's GKD protocol, therefore allowing for the testing of every possible combination of technical indicators that make up the various indictor types in the GKD algorithm.
🔶 GKD Trading System Signals
Standard Entry requires a sequence of conditions including a confirmation signal from GKD-C, baseline agreement, price criteria related to the Goldie Locks Zone, and concurrence from a second confirmation and volatility/volume indicators.
1-Candle Standard Entry introduces a two-phase process where initial conditions must be met, followed by a retraction in price and additional confirmations in the subsequent candle, including baseline, confirmations 1 and 2, and volatility/volume criteria.
Baseline Entry focuses on signals generated by the GKD-B Baseline, requiring agreement from confirmation signals, specific price conditions within the Goldie Locks Zone, and a timing condition related to the confirmation 1 signal.
1-Candle Baseline Entry mirrors the baseline entry but adds a requirement for a price retraction and subsequent confirmations in the following candle, maintaining the focus on the baseline's guidance.
Volatility/Volume Entry is predicated on signals from volatility/volume indicators, requiring support from confirmations, price criteria within the Goldie Locks Zone, baseline agreement, and a timing condition for the confirmation 1 signal.
1-Candle Volatility/Volume Entry adapts the volatility/volume entry to include a phase of initial signal and agreement, followed by a retracement phase that seeks further agreement from the system's components in the subsequent candle.
Confirmation 2 Entry is based on the second confirmation signal, requiring the first confirmation's agreement, specific price criteria, agreement from volatility/volume indicators, and baseline, with a timing condition for the confirmation 1 signal.
1-Candle Confirmation 2 Entry adds a retracement requirement to the confirmation 2 entry, necessitating additional agreements from the system's components in the candle following the signal.
PullBack Entry initiates with a baseline signal and agreement from the first confirmation, with a price condition related to volatility. It then looks for price to return within the Goldie Locks Zone and seeks further agreement from the system's components in the subsequent candle.
Continuation Entry allows for the continuation of an active position, based on a previously triggered entry strategy. It requires that the baseline hasn't crossed since the initial trigger, alongside ongoing agreements from confirmations and the baseline.
█ Conclusion
The GKD-BT Optimizer Full GKD Backtest is a critical tool within the Giga Kaleidoscope Modularized Trading System, designed for precise strategy refinement and evaluation within the GKD framework. It enables the optimization and testing of various trading indicators and strategies under different market conditions. The module's design facilitates detailed analysis of individual trading components' performance, allowing for the optimization of indicators like Baseline, Volatility/Volume, Confirmation, and Continuation. This optimization process aids traders in identifying the most effective configurations, thereby enhancing trading outcomes and strategy efficiency within the GKD ecosystem.
█ How to Access
You can see the Author's Instructions below to learn how to get access.

GKD-C Derivative Oscillator [Loxx]The Giga Kaleidoscope GKD-C Derivative Oscillator is a Confirmation module included in AlgxTrading's "Giga Kaleidoscope Modularized Trading System."
█ GKD-C Derivative Oscillator, a brief overview
The Derivative Oscillator is a technical analysis tool used in trading that merges the concepts of the Relative Strength Index (RSI) and the double smoothed moving average. Essentially, it operates by taking the difference between a short-term moving average of the asset's price and a longer-term moving average, which is then double smoothed with exponential moving averages (EMAs). This process refines the RSI, aiming to provide clearer signals regarding the momentum and potential trend reversals of a security's price. The GKD-C Derivative Oscillator produces two types of signals: Zero-line or Signal crosses. (read the sections below to learn how traders can test these different signal types using AlgxTrading's GKD trading system)
GKD-C Derivative Oscillator in Zero-line crosses mode
GKD-C Derivative Oscillator in Signal crosses mode
To explain the features included in the GKD-C Derivative Oscillator , let's first dive into the details of the Giga Kaleidoscope (GKD) Modularized Trading System.
█ Giga Kaleidoscope (GKD) Modularized Trading System
The GKD Trading System is a comprehensive, algorithmic trading framework from AlgxTrading, designed to optimize trading strategies across various market conditions. It employs a modular approach, incorporating elements such as volatility assessment, trend identification through a baseline, multiple confirmation strategies for signal accuracy, and volume analysis. Key components also include specialized strategies for entry and exit, enabling precise trade execution. The system allows for extensive backtesting, providing traders with the ability to evaluate the effectiveness of their strategies using historical data. Aimed at reducing setup time, the GKD system empowers traders to focus more on strategy refinement and execution, leveraging a wide array of technical indicators for informed decision-making.
🔶 Core components of a GKD Algorithmic Trading System
Each GKD indicator is denoted with a module identifier of either: GKD-BT, GKD-B, GKD-C, GKD-V, GKD-M, or GKD-E. This allows traders to understand to which module each indicator belongs and where each indicator fits into the GKD system. The GKD algorithm is built on the principles of trend, momentum, and volatility. There are eight core components in the GKD trading algorithm:
🔹 Volatility - In the GKD trading system, volatility is used as a part of the system to help determine the appropriate stop loss and take profit levels for a trade. There are 17+ different types of volatility available in the GKD system including Average True Range (ATR), True Range Double (TRD), Close-to-Close, Garman-Klass, and more.
🔹 Baseline (GKD-B) - The baseline is essentially a moving average and is used to determine the overall direction of the market. The baseline in the GKD trading system is used to filter out trades that are not in line with the long-term trend of the market. The baseline is plotted on the chart along with other GKD indicators.
Trades are only taken when the price is in the same direction as the baseline. For example, if the baseline is sloping upwards or price is above the baseline, then only long trades are taken, and if the baseline is sloping downwards or price is below the baseline, then only short trades are taken. This approach helps to ensure that trades are in line with the overall trend of the market, and reduces the risk of entering trades that are likely to fail.
🔹 Confirmation 1, Confirmation 2, Continuation (GKD-C) - The GKD trading system incorporates technical confirmation indicators for the generation of its primary long and short signals, essential for its operation.
The GKD trading system distinguishes three specific categories. The first category, Confirmation 1 , encompasses technical indicators designed to identify trends and generate explicit trading signals. The second category, Confirmation 2 , a technical indicator used to identify trends; this type of indicator is primarily used to filter the Confirmation 1 indicator signals; however, this type of confirmation indicator also generates signals*. Lastly, the Continuation category includes technical indicators used in conjunction with Confirmation 1 and Confirmation 2 to generate a special type of trading signal called a "Continuation"
In a full GKD trading system all three categories generate signals. (see the section “GKD Trading System Signals” below)
🔹 Volatility/Volume (GKD-V) - Volatility/Volume indicators are used to measure the amount of buying and selling activity in a market. They are based on the trading Volatility/Volume of the market, and can provide information about the strength of the trend. In the GKD trading system, Volatility/Volume indicators are used to confirm trading signals generated by the various other GKD indicators. In the GKD trading system, Volatility is a proxy for Volume and vice versa.
Volatility/Volume indicators reduce the risk of false signals and improve the overall profitability of trades. These indicators can provide additional information about the market that is not captured by GKD-C confirmation and GKD-B baseline indicators.
🔹 Exit (GKD-E) - The exit indicator in the GKD system is an indicator that is deemed effective at identifying optimal exit points. The purpose of the exit indicator is to identify when a trend is likely to reverse or when the market conditions have changed, signaling the need to exit a trade. By using an exit indicator, traders can manage their risk and prevent significant losses.
🔹 Backtest (GKD-BT) - The GKD-BT backtest indicators link all other GKD-C, GKD-B, GKD-E, GKD-V, and GKD-M components together to create a GKD trading system. GKD-BT backtests generate signals (see the section “GKD Trading System Signals” below) from the confluence of various GKD indicators that are imported into the GKD-BT backtest. Backtest types include: GKD-BT solo and full GKD backtest strategies used for a single ticker; GKD-BT optimizers used to optimize a single indicator or the full GKD trading system; GKD-BT Multi-ticker used to backtest a single indicator or the full GKD trading system across up to ten tickers; GKD-BT exotic backtests like CC, Baseline, and Giga Stacks used to test confluence between GKD components to then be injected into a core GKD-BT Multi-ticker backtest or single ticker strategy.
🔹 Metamorphosis (GKD-M) ** - The concept of a metamorphosis indicator involves the integration of two or more GKD indicators to generate a compound signal. This is achieved by evaluating the accuracy of each indicator and selecting the signal from the indicator with the highest accuracy. As an illustration, let's consider a scenario where we calculate the accuracy of 10 indicators and choose the signal from the indicator that demonstrates the highest accuracy.
The resulting output from the metamorphosis indicator can then be utilized in a GKD-BT backtest by occupying a slot that aligns with the purpose of the metamorphosis indicator. The slot can be a GKD-B, GKD-C, GKD-E, or GKD-V slot, depending on the specific requirements and objectives of the indicator. This allows for seamless integration and utilization of the compound signal within the GKD-BT framework.
*(see the section “GKD Trading System Signals” below)
**(not a required component of the GKD algorithm)
🔶 What does the application of the GKD trading system look like?
Example trading system:
Volatility: Average True Range (ATR) (selectable in all backtests and other related GKD indicators)
GKD-B Baseline: GKD-B Multi-Ticker Baseline using Hull Moving Average
GKD-C Confirmation 1 : GKD-C Advance Trend Pressure
GKD-C Confirmation 2: GKD-C Dorsey Inertia
GKD-C Continuation: GKD-C Stochastic of RSX
GKD-V Volatility/Volume: GKD-V Damiani Volatmeter
GKD-E Exit: GKD-E MFI
GKD-BT Backtest: GKD-BT Multi-Ticker Full GKD Backtest
GKD-M Metamorphosis: GKD-M Baseline Optimizer
**all indicators mentioned above are included in the same AlgxTrading package**
Each module is passed to a GKD-BT backtest module. In the backtest module, all components are combined to formulate trading signals and statistical output. This chaining of indicators requires that each module conform to AlgxTrading's GKD protocol, therefore allowing for the testing of every possible combination of technical indicators that make up the various indictor types in the GKD algorithm.
🔶 GKD Trading System Signals
🔹 Standard Entry requires a sequence of conditions including a confirmation signal from GKD-C, baseline agreement, price criteria related to the Goldie Locks Zone, and concurrence from a second confirmation and volatility/volume indicators.
🔹 1-Candle Standard Entry introduces a two-phase process where initial conditions must be met, followed by a retraction in price and additional confirmations in the subsequent candle, including baseline, confirmations 1 and 2, and volatility/volume criteria.
🔹 Baseline Entry focuses on signals generated by the GKD-B Baseline, requiring agreement from confirmation signals, specific price conditions within the Goldie Locks Zone, and a timing condition related to the confirmation 1 signal.
🔹 1-Candle Baseline Entry mirrors the baseline entry but adds a requirement for a price retraction and subsequent confirmations in the following candle, maintaining the focus on the baseline's guidance.
🔹 Volatility/Volume Entry is predicated on signals from volatility/volume indicators, requiring support from confirmations, price criteria within the Goldie Locks Zone, baseline agreement, and a timing condition for the confirmation 1 signal.
🔹 1-Candle Volatility/Volume Entry adapts the volatility/volume entry to include a phase of initial signal and agreement, followed by a retracement phase that seeks further agreement from the system's components in the subsequent candle.
🔹 Confirmation 2 Entry is based on the second confirmation signal, requiring the first confirmation's agreement, specific price criteria, agreement from volatility/volume indicators, and baseline, with a timing condition for the confirmation 1 signal.
🔹 1-Candle Confirmation 2 Entry adds a retracement requirement to the confirmation 2 entry, necessitating additional agreements from the system's components in the candle following the signal.
🔹 PullBack Entry initiates with a baseline signal and agreement from the first confirmation, with a price condition related to volatility. It then looks for price to return within the Goldie Locks Zone and seeks further agreement from the system's components in the subsequent candle.
🔹 Continuation Entry allows for the continuation of an active position, based on a previously triggered entry strategy. It requires that the baseline hasn't crossed since the initial trigger, alongside ongoing agreements from confirmations and the baseline.
█ GKD-C Derivative Oscillator, a deep dive
Now that you have a basic understanding of the GKD trading system. let's dive deeper into the features included in the GKD-C Derivative Oscillator
🔶 GKD-C Derivative Oscillator Modes aka "Confirmation Type"
The GKD-C Derivative Oscillator has 4 modes: Confirmation for confirmation 1 and 2; Continuation; Multi-ticker for multi-ticker confirmation 1 and 2; and Optimizer.
🔹 Confirmation: When in this mode, the GKD-C Derivative Oscillator generates confirmation 1 and 2 signals. These values can then be exported to a GKD-BT backtest strategy.
Signal Key: L = Long, S = Short
GKD-C Derivative Oscillator in Confirmation mode
Confirmation Exports
GKD-C Derivative Oscillator in attached to a GKD-BT backtest strategy
**the backtest data rendered to the chart above uses $5 commission per trade and 10% equity per trade with $1 million initial capital. Each backtest result for each ticker assumes these same inputs. The results are NOT cumulative, they are separate and isolated per ticker and trading side, long or short**
🔹 Continuation: When in this mode, the GKD-C Derivative Oscillator generates continuation signals.
Signal Key: L = Long, S = Short, CL = Continuation Long, CS = Continuation Short
GKD-C Derivative Oscillator in Continuation mode
Continuation Exports
🔹 Multi-ticker: When in this mode, the GKD-C Derivative Oscillator generates multi-ticker confirmation 1 and 2. This mode allows users to generate confirmation 1 and 2, and continuation signals for up to 10 different tickers. These values can then be exported to a GKD-BT Multi-ticker backtest.
Signal Key: L = Long, S = Short
GKD-C Derivative Oscillator in Multi-ticker mode
Multi-ticker Exports
GKD-C Derivative Oscillator attached to the GKD-BT Multi-ticker SCS Backtest
**the backtest data rendered to the chart above uses $5 commission per trade and 10% equity per trade with $1 million initial capital. Each backtest result for each ticker assumes these same inputs. The results are NOT cumulative, they are separate and isolated per ticker and trading side, long or short**
🔹 Optimizer: When in this mode, the GKD-C Derivative Oscillator generates optimization signals. These signals allow the user to backtest a range of input values. These values are exported to a GKD-BT optimizer backtest.
Signal Key: L = Long, S = Short
GKD-C Derivative Oscillator in Optimizer mode
Optimizer Inputs and Exports
GKD-C Derivative Oscillator attacked to the GKD-BT Optimizer SCS Backtest
**the backtest data rendered to the chart above uses $5 commission per trade and 10% equity per trade with $1 million initial capital. Each backtest result for each ticker assumes these same inputs. The results are NOT cumulative, they are separate and isolated per ticker and trading side, long or short**
█ Conclusion
The GKD-C Derivative Oscillator serves as a multi-modal component of the GKD trading system allowing traders to optimize and backtest acorss a range of input parameters and tickers. These features decrease total build time required to create a custom GKD algorithmic trading system by allowing users to spend more time trading and less time guessing.
█ How to Access
You can see the Author's Instructions below to learn how to get access.

GKD-B Multi-Ticker Stepped Baseline [Loxx]Giga Kaleidoscope GKD-B Multi-Ticker Stepped Baseline is a Baseline module included in Loxx's "Giga Kaleidoscope Modularized Trading System".
This version of the GKD-B Baseline is designed specifically to support traders who wish to conduct GKD-BT Multi-Ticker Backtests with multiple tickers. This functionality is exclusive to the GKD-BT Multi-Ticker Backtests.
Traders have the capability to apply a filter to the selected moving average, leveraging various volatility metrics to enhance trend identification. This feature is tailored for traders favoring a gradual and consistent approach, enabling them to discern more sustainable trends. The system permits filtering for both the input data and the moving average results, requiring price movements to exceed a specific threshold—defined as multiples of the volatility—before acknowledging a trend change. This mechanism effectively reduces false signals caused by market noise and lateral movements. A distinctive aspect of this tool is its ability to adjust both price and moving average data based on volatility indicators like VIX, EUVIX, BVIV, and EVIV, among others. Understanding the time frame over which a volatility index is measured is crucial; for instance, VIX is measured on an annual basis, whereas BVIV and EVIV are based on a 30-day period. To accurately convert these measurements to a daily scale, users must input the correct "days per year" value: 252 for VIX and 30 for BVIV and EVIV. Future updates will introduce additional functionality to extend analysis across various time frames, but currently, this feature is solely available for daily time frame analysis.
█ GKD-B Multi-Ticker Stepped Baseline includes 65+ different moving averages:
Adaptive Moving Average - AMA
ADXvma - Average Directional Volatility Moving Average
Ahrens Moving Average
Alexander Moving Average - ALXMA
Deviation Scaled Moving Average - DSMA
Donchian
Double Exponential Moving Average - DEMA
Double Smoothed Exponential Moving Average - DSEMA
Double Smoothed FEMA - DSFEMA
Double Smoothed Range Weighted EMA - DSRWEMA
Double Smoothed Wilders EMA - DSWEMA
Double Weighted Moving Average - DWMA
Ehlers Optimal Tracking Filter - EOTF
Exponential Moving Average - EMA
Fast Exponential Moving Average - FEMA
Fractal Adaptive Moving Average - FRAMA
Generalized DEMA - GDEMA
Generalized Double DEMA - GDDEMA
Hull Moving Average (Type 1) - HMA1
Hull Moving Average (Type 2) - HMA2
Hull Moving Average (Type 3) - HMA3
Hull Moving Average (Type 4) - HMA4
IE /2 - Early T3 by Tim Tilson
Integral of Linear Regression Slope - ILRS
Kaufman Adaptive Moving Average - KAMA
Laguerre Filter
Leader Exponential Moving Average
Linear Regression Value - LSMA ( Least Squares Moving Average )
Linear Weighted Moving Average - LWMA
McGinley Dynamic
McNicholl EMA
Non-Lag Moving Average
Ocean NMA Moving Average - ONMAMA
One More Moving Average - OMA
Parabolic Weighted Moving Average
Probability Density Function Moving Average - PDFMA
Quadratic Regression Moving Average - QRMA
Regularized EMA - REMA
Range Weighted EMA - RWEMA
Recursive Moving Trendline
Simple Decycler - SDEC
Simple Jurik Moving Average - SJMA
Simple Moving Average - SMA
Sine Weighted Moving Average
Smoothed LWMA - SLWMA
Smoothed Moving Average - SMMA
Smoother
Super Smoother
T3
Three-pole Ehlers Butterworth
Three-pole Ehlers Smoother
Triangular Moving Average - TMA
Triple Exponential Moving Average - TEMA
Two-pole Ehlers Butterworth
Two-pole Ehlers smoother
Variable Index Dynamic Average - VIDYA
Variable Moving Average - VMA
Volume Weighted EMA - VEMA
Volume Weighted Moving Average - VWMA
Zero-Lag DEMA - Zero Lag Exponential Moving Average
Zero-Lag Moving Average
Zero Lag TEMA - Zero Lag Triple Exponential Moving Average
Geometric Mean Moving Average
Coral
Tether Lines
Range Filter
Triangle Moving Average Generalized
Ultinate Smoother
Adaptive Moving Average - AMA
The Adaptive Moving Average (AMA) is a moving average that changes its sensitivity to price moves depending on the calculated volatility. It becomes more sensitive during periods when the price is moving smoothly in a certain direction and becomes less sensitive when the price is volatile.
ADXvma - Average Directional Volatility Moving Average
Linnsoft's ADXvma formula is a volatility-based moving average, with the volatility being determined by the value of the ADX indicator.
The ADXvma has the SMA in Chande's CMO replaced with an EMA , it then uses a few more layers of EMA smoothing before the "Volatility Index" is calculated.
A side effect is, those additional layers slow down the ADXvma when you compare it to Chande's Variable Index Dynamic Average VIDYA .
The ADXVMA provides support during uptrends and resistance during downtrends and will stay flat for longer, but will create some of the most accurate market signals when it decides to move.
Ahrens Moving Average
Richard D. Ahrens's Moving Average promises "Smoother Data" that isn't influenced by the occasional price spike. It works by using the Open and the Close in his formula so that the only time the Ahrens Moving Average will change is when the candlestick is either making new highs or new lows.
Alexander Moving Average - ALXMA
This Moving Average uses an elaborate smoothing formula and utilizes a 7 period Moving Average. It corresponds to fitting a second-order polynomial to seven consecutive observations. This moving average is rarely used in trading but is interesting as this Moving Average has been applied to diffusion indexes that tend to be very volatile.
Deviation Scaled Moving Average - DSMA
The Deviation-Scaled Moving Average is a data smoothing technique that acts like an exponential moving average with a dynamic smoothing coefficient. The smoothing coefficient is automatically updated based on the magnitude of price changes. In the Deviation-Scaled Moving Average, the standard deviation from the mean is chosen to be the measure of this magnitude. The resulting indicator provides substantial smoothing of the data even when price changes are small while quickly adapting to these changes.
Donchian
Donchian Channels are three lines generated by moving average calculations that comprise an indicator formed by upper and lower bands around a midrange or median band. The upper band marks the highest price of a security over N periods while the lower band marks the lowest price of a security over N periods.
Double Exponential Moving Average - DEMA
The Double Exponential Moving Average ( DEMA ) combines a smoothed EMA and a single EMA to provide a low-lag indicator. It's primary purpose is to reduce the amount of "lagging entry" opportunities, and like all Moving Averages, the DEMA confirms uptrends whenever price crosses on top of it and closes above it, and confirms downtrends when the price crosses under it and closes below it - but with significantly less lag.
Double Smoothed Exponential Moving Average - DSEMA
The Double Smoothed Exponential Moving Average is a lot less laggy compared to a traditional EMA . It's also considered a leading indicator compared to the EMA , and is best utilized whenever smoothness and speed of reaction to market changes are required.
Double Smoothed FEMA - DSFEMA
Same as the Double Exponential Moving Average (DEMA), but uses a faster version of EMA for its calculation.
Double Smoothed Range Weighted EMA - DSRWEMA
Range weighted exponential moving average (EMA) is, unlike the "regular" range weighted average calculated in a different way. Even though the basis - the range weighting - is the same, the way how it is calculated is completely different. By definition this type of EMA is calculated as a ratio of EMA of price*weight / EMA of weight. And the results are very different and the two should be considered as completely different types of averages. The higher than EMA to price changes responsiveness when the ranges increase remains in this EMA too and in those cases this EMA is clearly leading the "regular" EMA. This version includes double smoothing.
Double Smoothed Wilders EMA - DSWEMA
Welles Wilder was frequently using one "special" case of EMA (Exponential Moving Average) that is due to that fact (that he used it) sometimes called Wilder's EMA. This version is adding double smoothing to Wilder's EMA in order to make it "faster" (it is more responsive to market prices than the original) and is still keeping very smooth values.
Double Weighted Moving Average - DWMA
Double weighted moving average is an LWMA (Linear Weighted Moving Average). Instead of doing one cycle for calculating the LWMA, the indicator is made to cycle the loop 2 times. That produces a smoother values than the original LWMA
Ehlers Optimal Tracking Filter - EOTF
The Elher's Optimum Tracking Filter quickly adjusts rapid shifts in the price and yet is relatively smooth when the price has a sideways action. The operation of this filter is similar to Kaufman’s Adaptive Moving
Average
Exponential Moving Average - EMA
The EMA places more significance on recent data points and moves closer to price than the SMA ( Simple Moving Average ). It reacts faster to volatility due to its emphasis on recent data and is known for its ability to give greater weight to recent and more relevant data. The EMA is therefore seen as an enhancement over the SMA .
Fast Exponential Moving Average - FEMA
An Exponential Moving Average with a short look-back period.
Fractal Adaptive Moving Average - FRAMA
The Fractal Adaptive Moving Average by John Ehlers is an intelligent adaptive Moving Average which takes the importance of price changes into account and follows price closely enough to display significant moves whilst remaining flat if price ranges. The FRAMA does this by dynamically adjusting the look-back period based on the market's fractal geometry.
Generalized DEMA - GDEMA
The double exponential moving average (DEMA), was developed by Patrick Mulloy in an attempt to reduce the amount of lag time found in traditional moving averages. It was first introduced in the February 1994 issue of the magazine Technical Analysis of Stocks & Commodities in Mulloy's article "Smoothing Data with Faster Moving Averages.". Instead of using fixed multiplication factor in the final DEMA formula, the generalized version allows you to change it. By varying the "volume factor" form 0 to 1 you apply different multiplications and thus producing DEMA with different "speed" - the higher the volume factor is the "faster" the DEMA will be (but also the slope of it will be less smooth). The volume factor is limited in the calculation to 1 since any volume factor that is larger than 1 is increasing the overshooting to the extent that some volume factors usage makes the indicator unusable.
Generalized Double DEMA - GDDEMA
The double exponential moving average (DEMA), was developed by Patrick Mulloy in an attempt to reduce the amount of lag time found in traditional moving averages. It was first introduced in the February 1994 issue of the magazine Technical Analysis of Stocks & Commodities in Mulloy's article "Smoothing Data with Faster Moving Averages''. This is an extension of the Generalized DEMA using Tim Tillsons (the inventor of T3) idea, and is using GDEMA of GDEMA for calculation (which is the "middle step" of T3 calculation). Since there are no versions showing that middle step, this version covers that too. The result is smoother than Generalized DEMA, but is less smooth than T3 - one has to do some experimenting in order to find the optimal way to use it, but in any case, since it is "faster" than the T3 (Tim Tillson T3) and still smooth, it looks like a good compromise between speed and smoothness.
Hull Moving Average (Type 1) - HMA1
Alan Hull's HMA makes use of weighted moving averages to prioritize recent values and greatly reduce lag whilst maintaining the smoothness of a traditional Moving Average. For this reason, it's seen as a well-suited Moving Average for identifying entry points. This version uses SMA for smoothing.
Hull Moving Average (Type 2) - HMA2
Alan Hull's HMA makes use of weighted moving averages to prioritize recent values and greatly reduce lag whilst maintaining the smoothness of a traditional Moving Average. For this reason, it's seen as a well-suited Moving Average for identifying entry points. This version uses EMA for smoothing.
Hull Moving Average (Type 3) - HMA3
Alan Hull's HMA makes use of weighted moving averages to prioritize recent values and greatly reduce lag whilst maintaining the smoothness of a traditional Moving Average. For this reason, it's seen as a well-suited Moving Average for identifying entry points. This version uses LWMA for smoothing.
Hull Moving Average (Type 4) - HMA4
Alan Hull's HMA makes use of weighted moving averages to prioritize recent values and greatly reduce lag whilst maintaining the smoothness of a traditional Moving Average. For this reason, it's seen as a well-suited Moving Average for identifying entry points. This version uses SMMA for smoothing.
IE /2 - Early T3 by Tim Tilson and T3 new
The T3 moving average is a type of technical indicator used in financial analysis to identify trends in price movements. It is similar to the Exponential Moving Average (EMA) and the Double Exponential Moving Average (DEMA), but uses a different smoothing algorithm.
The T3 moving average is calculated using a series of exponential moving averages that are designed to filter out noise and smooth the data. The resulting smoothed data is then weighted with a non-linear function to produce a final output that is more responsive to changes in trend direction.
The T3 moving average can be customized by adjusting the length of the moving average, as well as the weighting function used to smooth the data. It is commonly used in conjunction with other technical indicators as part of a larger trading strategy.
Integral of Linear Regression Slope - ILRS
A Moving Average where the slope of a linear regression line is simply integrated as it is fitted in a moving window of length N (natural numbers in maths) across the data. The derivative of ILRS is the linear regression slope. ILRS is not the same as a SMA ( Simple Moving Average ) of length N, which is actually the midpoint of the linear regression line as it moves across the data.
Kaufman Adaptive Moving Average - KAMA
Developed by Perry Kaufman, Kaufman's Adaptive Moving Average (KAMA) is a moving average designed to account for market noise or volatility. KAMA will closely follow prices when the price swings are relatively small and the noise is low.
Laguerre Filter
The Laguerre Filter is a smoothing filter which is based on Laguerre polynomials. The filter requires the current price, three prior prices, a user defined factor called Alpha to fill its calculation.
Adjusting the Alpha coefficient is used to increase or decrease its lag and its smoothness.
Leader Exponential Moving Average
The Leader EMA was created by Giorgos E. Siligardos who created a Moving Average which was able to eliminate lag altogether whilst maintaining some smoothness. It was first described during his research paper "MACD Leader" where he applied this to the MACD to improve its signals and remove its lagging issue. This filter uses his leading MACD's "modified EMA" and can be used as a zero lag filter.
Linear Regression Value - LSMA ( Least Squares Moving Average )
LSMA as a Moving Average is based on plotting the end point of the linear regression line. It compares the current value to the prior value and a determination is made of a possible trend, eg. the linear regression line is pointing up or down.
Linear Weighted Moving Average - LWMA
LWMA reacts to price quicker than the SMA and EMA . Although it's similar to the Simple Moving Average , the difference is that a weight coefficient is multiplied to the price which means the most recent price has the highest weighting, and each prior price has progressively less weight. The weights drop in a linear fashion.
McGinley Dynamic
John McGinley created this Moving Average to track prices better than traditional Moving Averages. It does this by incorporating an automatic adjustment factor into its formula, which speeds (or slows) the indicator in trending, or ranging, markets.
McNicholl EMA
Dennis McNicholl developed this Moving Average to use as his center line for his "Better Bollinger Bands" indicator and was successful because it responded better to volatility changes over the standard SMA and managed to avoid common whipsaws.
Non-lag moving average
The Non Lag Moving average follows price closely and gives very quick signals as well as early signals of price change. As a standalone Moving Average, it should not be used on its own, but as an additional confluence tool for early signals.
Ocean NMA Moving Average - ONMAMA
Created by Jim Sloman, the NMA is a moving average that automatically adjusts to volatility without being programmed to do so. For more info, read his guide "Ocean Theory, an Introduction"
One More Moving Average (OMA)
The One More Moving Average (OMA) is a technical indicator that calculates a series of Jurik-style moving averages in order to reduce noise and provide smoother price data. It uses six exponential moving averages to generate the final value, with the length of the moving averages determined by an adaptive algorithm that adjusts to the current market conditions. The algorithm calculates the average period by comparing the signal to noise ratio and using this value to determine the length of the moving averages. The resulting values are used to generate the final value of the OMA, which can be used to identify trends and potential changes in trend direction.
Parabolic Weighted Moving Average
The Parabolic Weighted Moving Average is a variation of the Linear Weighted Moving Average . The Linear Weighted Moving Average calculates the average by assigning different weights to each element in its calculation. The Parabolic Weighted Moving Average is a variation that allows weights to be changed to form a parabolic curve. It is done simply by using the Power parameter of this indicator.
Probability Density Function Moving Average - PDFMA
Probability density function based MA is a sort of weighted moving average that uses probability density function to calculate the weights. By its nature it is similar to a lot of digital filters.
Quadratic Regression Moving Average - QRMA
A quadratic regression is the process of finding the equation of the parabola that best fits a set of data. This moving average is an obscure concept that was posted to Forex forums in around 2008.
Regularized EMA - REMA
The regularized exponential moving average (REMA) by Chris Satchwell is a variation on the EMA (see Exponential Moving Average) designed to be smoother but not introduce too much extra lag.
Range Weighted EMA - RWEMA
This indicator is a variation of the range weighted EMA. The variation comes from a possible need to make that indicator a bit less "noisy" when it comes to slope changes. The method used for calculating this variation is the method described by Lee Leibfarth in his article "Trading With An Adaptive Price Zone".
Recursive Moving Trendline
Dennis Meyers's Recursive Moving Trendline uses a recursive (repeated application of a rule) polynomial fit, a technique that uses a small number of past values estimations of price and today's price to predict tomorrow's price.
Simple Decycler - SDEC
The Ehlers Simple Decycler study is a virtually zero-lag technical indicator proposed by John F. Ehlers. The original idea behind this study (and several others created by John F. Ehlers) is that market data can be considered a continuum of cycle periods with different cycle amplitudes. Thus, trending periods can be considered segments of longer cycles, or, in other words, low-frequency segments. Applying the right filter might help identify these segments.
Simple Loxx Moving Average - SLMA
A three stage moving average combining an adaptive EMA, a Kalman Filter, and a Kauffman adaptive filter.
Simple Moving Average - SMA
The SMA calculates the average of a range of prices by adding recent prices and then dividing that figure by the number of time periods in the calculation average. It is the most basic Moving Average which is seen as a reliable tool for starting off with Moving Average studies. As reliable as it may be, the basic moving average will work better when it's enhanced into an EMA .
Sine Weighted Moving Average
The Sine Weighted Moving Average assigns the most weight at the middle of the data set. It does this by weighting from the first half of a Sine Wave Cycle and the most weighting is given to the data in the middle of that data set. The Sine WMA closely resembles the TMA (Triangular Moving Average).
Smoothed LWMA - SLWMA
A smoothed version of the LWMA
Smoothed Moving Average - SMMA
The Smoothed Moving Average is similar to the Simple Moving Average ( SMA ), but aims to reduce noise rather than reduce lag. SMMA takes all prices into account and uses a long lookback period. Due to this, it's seen as an accurate yet laggy Moving Average.
Smoother
The Smoother filter is a faster-reacting smoothing technique which generates considerably less lag than the SMMA ( Smoothed Moving Average ). It gives earlier signals but can also create false signals due to its earlier reactions. This filter is sometimes wrongly mistaken for the superior Jurik Smoothing algorithm.
Super Smoother
The Super Smoother filter uses John Ehlers’s “Super Smoother” which consists of a Two pole Butterworth filter combined with a 2-bar SMA ( Simple Moving Average ) that suppresses the 22050 Hz Nyquist frequency: A characteristic of a sampler, which converts a continuous function or signal into a discrete sequence.
Three-pole Ehlers Butterworth
The 3 pole Ehlers Butterworth (as well as the Two pole Butterworth) are both superior alternatives to the EMA and SMA . They aim at producing less lag whilst maintaining accuracy. The 2 pole filter will give you a better approximation for price, whereas the 3 pole filter has superior smoothing.
Three-pole Ehlers smoother
The 3 pole Ehlers smoother works almost as close to price as the above mentioned 3 Pole Ehlers Butterworth. It acts as a strong baseline for signals but removes some noise. Side by side, it hardly differs from the Three Pole Ehlers Butterworth but when examined closely, it has better overshoot reduction compared to the 3 pole Ehlers Butterworth.
Triangular Moving Average - TMA
The TMA is similar to the EMA but uses a different weighting scheme. Exponential and weighted Moving Averages will assign weight to the most recent price data. Simple moving averages will assign the weight equally across all the price data. With a TMA (Triangular Moving Average), it is double smoother (averaged twice) so the majority of the weight is assigned to the middle portion of the data.
Triple Exponential Moving Average - TEMA
The TEMA uses multiple EMA calculations as well as subtracting lag to create a tool which can be used for scalping pullbacks. As it follows price closely, its signals are considered very noisy and should only be used in extremely fast-paced trading conditions.
Two-pole Ehlers Butterworth
The 2 pole Ehlers Butterworth (as well as the three pole Butterworth mentioned above) is another filter that cuts out the noise and follows the price closely. The 2 pole is seen as a faster, leading filter over the 3 pole and follows price a bit more closely. Analysts will utilize both a 2 pole and a 3 pole Butterworth on the same chart using the same period, but having both on chart allows its crosses to be traded.
Two-pole Ehlers smoother
A smoother version of the Two pole Ehlers Butterworth. This filter is the faster version out of the 3 pole Ehlers Butterworth. It does a decent job at cutting out market noise whilst emphasizing a closer following to price over the 3 pole Ehlers .
Variable Index Dynamic Average - VIDYA
Variable Index Dynamic Average Technical Indicator ( VIDYA ) was developed by Tushar Chande. It is an original method of calculating the Exponential Moving Average ( EMA ) with the dynamically changing period of averaging.
Variable Moving Average - VMA
The Variable Moving Average (VMA) is a study that uses an Exponential Moving Average being able to automatically adjust its smoothing factor according to the market volatility.
Volume Weighted EMA - VEMA
An EMA that uses a volume and price weighted calculation instead of the standard price input.
Volume Weighted Moving Average - VWMA
A Volume Weighted Moving Average is a moving average where more weight is given to bars with heavy volume than with light volume. Thus the value of the moving average will be closer to where most trading actually happened than it otherwise would be without being volume weighted.
Zero-Lag DEMA - Zero Lag Double Exponential Moving Average
John Ehlers's Zero Lag DEMA's aim is to eliminate the inherent lag associated with all trend following indicators which average a price over time. Because this is a Double Exponential Moving Average with Zero Lag, it has a tendency to overshoot and create a lot of false signals for swing trading. It can however be used for quick scalping or as a secondary indicator for confluence.
Zero-Lag Moving Average
The Zero Lag Moving Average is described by its creator, John Ehlers , as a Moving Average with absolutely no delay. And it's for this reason that this filter will cause a lot of abrupt signals which will not be ideal for medium to long-term traders. This filter is designed to follow price as close as possible whilst de-lagging data instead of basing it on regular data. The way this is done is by attempting to remove the cumulative effect of the Moving Average.
Zero-Lag TEMA - Zero Lag Triple Exponential Moving Average
Just like the Zero Lag DEMA , this filter will give you the fastest signals out of all the Zero Lag Moving Averages. This is useful for scalping but dangerous for medium to long-term traders, especially during market Volatility and news events. Having no lag, this filter also has no smoothing in its signals and can cause some very bizarre behavior when applied to certain indicators.
█ Volatility Goldie Locks Zone
This volatility filter is the standard first pass filter that is used for all NNFX systems despite the additional volatility/volume filter used in step 5. For this filter, price must fall into a range of maximum and minimum values calculated using multiples of volatility. Unlike the standard NNFX systems, this version of volatility filtering is separated from the core Baseline and uses it's own moving average with Loxx's Exotic Source Types.
█ Volatility Types included
The GKD system utilizes volatility-based take profits and stop losses. Each take profit and stop loss is calculated as a multiple of volatility. You can change the values of the multipliers in the settings as well.
This module includes 17 types of volatility:
Close-to-Close
Parkinson
Garman-Klass
Rogers-Satchell
Yang-Zhang
Garman-Klass-Yang-Zhang
Exponential Weighted Moving Average
Standard Deviation of Log Returns
Pseudo GARCH(2,2)
Average True Range
True Range Double
Standard Deviation
Adaptive Deviation
Median Absolute Deviation
Efficiency-Ratio Adaptive ATR
Mean Absolute Deviation
Static Percent
Various volatility estimators and indicators that investors and traders can use to measure the dispersion or volatility of a financial instrument's price. Each estimator has its strengths and weaknesses, and the choice of estimator should depend on the specific needs and circumstances of the user.
Volatility Ticker Selection
Import volatility tickers like VIX, EUVIX, BVIV, and EVIV.
Close-to-Close
Close-to-Close volatility is a classic and widely used volatility measure, sometimes referred to as historical volatility.
Volatility is an indicator of the speed of a stock price change. A stock with high volatility is one where the price changes rapidly and with a larger amplitude. The more volatile a stock is, the riskier it is.
Close-to-close historical volatility is calculated using only a stock's closing prices. It is the simplest volatility estimator. However, in many cases, it is not precise enough. Stock prices could jump significantly during a trading session and return to the opening value at the end. That means that a considerable amount of price information is not taken into account by close-to-close volatility.
Despite its drawbacks, Close-to-Close volatility is still useful in cases where the instrument doesn't have intraday prices. For example, mutual funds calculate their net asset values daily or weekly, and thus their prices are not suitable for more sophisticated volatility estimators.
Parkinson
Parkinson volatility is a volatility measure that uses the stock’s high and low price of the day.
The main difference between regular volatility and Parkinson volatility is that the latter uses high and low prices for a day, rather than only the closing price. This is useful as close-to-close prices could show little difference while large price movements could have occurred during the day. Thus, Parkinson's volatility is considered more precise and requires less data for calculation than close-to-close volatility.
One drawback of this estimator is that it doesn't take into account price movements after the market closes. Hence, it systematically undervalues volatility. This drawback is addressed in the Garman-Klass volatility estimator.
Garman-Klass
Garman-Klass is a volatility estimator that incorporates open, low, high, and close prices of a security.
Garman-Klass volatility extends Parkinson's volatility by taking into account the opening and closing prices. As markets are most active during the opening and closing of a trading session, it makes volatility estimation more accurate.
Garman and Klass also assumed that the process of price change follows a continuous diffusion process (Geometric Brownian motion). However, this assumption has several drawbacks. The method is not robust for opening jumps in price and trend movements.
Despite its drawbacks, the Garman-Klass estimator is still more effective than the basic formula since it takes into account not only the price at the beginning and end of the time interval but also intraday price extremes.
Researchers Rogers and Satchell have proposed a more efficient method for assessing historical volatility that takes into account price trends. See Rogers-Satchell Volatility for more detail.
Rogers-Satchell
Rogers-Satchell is an estimator for measuring the volatility of securities with an average return not equal to zero.
Unlike Parkinson and Garman-Klass estimators, Rogers-Satchell incorporates a drift term (mean return not equal to zero). As a result, it provides better volatility estimation when the underlying is trending.
The main disadvantage of this method is that it does not take into account price movements between trading sessions. This leads to an underestimation of volatility since price jumps periodically occur in the market precisely at the moments between sessions.
A more comprehensive estimator that also considers the gaps between sessions was developed based on the Rogers-Satchel formula in the 2000s by Yang-Zhang. See Yang Zhang Volatility for more detail.
Yang-Zhang
Yang Zhang is a historical volatility estimator that handles both opening jumps and the drift and has a minimum estimation error.
Yang-Zhang volatility can be thought of as a combination of the overnight (close-to-open volatility) and a weighted average of the Rogers-Satchell volatility and the day’s open-to-close volatility. It is considered to be 14 times more efficient than the close-to-close estimator.
Garman-Klass-Yang-Zhang
Garman-Klass-Yang-Zhang (GKYZ) volatility estimator incorporates the returns of open, high, low, and closing prices in its calculation.
GKYZ volatility estimator takes into account overnight jumps but not the trend, i.e., it assumes that the underlying asset follows a Geometric Brownian Motion (GBM) process with zero drift. Therefore, the GKYZ volatility estimator tends to overestimate the volatility when the drift is different from zero. However, for a GBM process, this estimator is eight times more efficient than the close-to-close volatility estimator.
Exponential Weighted Moving Average
The Exponentially Weighted Moving Average (EWMA) is a quantitative or statistical measure used to model or describe a time series. The EWMA is widely used in finance, with the main applications being technical analysis and volatility modeling.
The moving average is designed such that older observations are given lower weights. The weights decrease exponentially as the data point gets older – hence the name exponentially weighted.
The only decision a user of the EWMA must make is the parameter lambda. The parameter decides how important the current observation is in the calculation of the EWMA. The higher the value of lambda, the more closely the EWMA tracks the original time series.
Standard Deviation of Log Returns
This is the simplest calculation of volatility. It's the standard deviation of ln(close/close(1)).
Pseudo GARCH(2,2)
This is calculated using a short- and long-run mean of variance multiplied by ?.
avg(var;M) + (1 ? ?) avg(var;N) = 2?var/(M+1-(M-1)L) + 2(1-?)var/(M+1-(M-1)L)
Solving for ? can be done by minimizing the mean squared error of estimation; that is, regressing L^-1var - avg(var; N) against avg(var; M) - avg(var; N) and using the resulting beta estimate as ?.
Average True Range
The average true range (ATR) is a technical analysis indicator, introduced by market technician J. Welles Wilder Jr. in his book New Concepts in Technical Trading Systems, that measures market volatility by decomposing the entire range of an asset price for that period.
The true range indicator is taken as the greatest of the following: current high less the current low; the absolute value of the current high less the previous close; and the absolute value of the current low less the previous close. The ATR is then a moving average, generally using 14 days, of the true ranges.
True Range Double
A special case of ATR that attempts to correct for volatility skew.
Standard Deviation
Standard deviation is a statistic that measures the dispersion of a dataset relative to its mean and is calculated as the square root of the variance. The standard deviation is calculated as the square root of variance by determining each data point's deviation relative to the mean. If the data points are further from the mean, there is a higher deviation within the data set; thus, the more spread out the data, the higher the standard deviation.
Adaptive Deviation
By definition, the Standard Deviation (STD, also represented by the Greek letter sigma ? or the Latin letter s) is a measure that is used to quantify the amount of variation or dispersion of a set of data values. In technical analysis, we usually use it to measure the level of current volatility.
Standard Deviation is based on Simple Moving Average calculation for mean value. This version of standard deviation uses the properties of EMA to calculate what can be called a new type of deviation, and since it is based on EMA, we can call it EMA deviation. Additionally, Perry Kaufman's efficiency ratio is used to make it adaptive (since all EMA type calculations are nearly perfect for adapting).
The difference when compared to the standard is significant--not just because of EMA usage, but the efficiency ratio makes it a "bit more logical" in very volatile market conditions.
Median Absolute Deviation
The median absolute deviation is a measure of statistical dispersion. Moreover, the MAD is a robust statistic, being more resilient to outliers in a data set than the standard deviation. In the standard deviation, the distances from the mean are squared, so large deviations are weighted more heavily, and thus outliers can heavily influence it. In the MAD, the deviations of a small number of outliers are irrelevant.
Because the MAD is a more robust estimator of scale than the sample variance or standard deviation, it works better with distributions without a mean or variance, such as the Cauchy distribution.
For this indicator, a manual recreation of the quantile function in Pine Script is used. This is so users have a full inside view into how this is calculated.
Efficiency-Ratio Adaptive ATR
Average True Range (ATR) is a widely used indicator for many occasions in technical analysis. It is calculated as the RMA of the true range. This version adds a "twist": it uses Perry Kaufman's Efficiency Ratio to calculate adaptive true range.
Mean Absolute Deviation
The mean absolute deviation (MAD) is a measure of variability that indicates the average distance between observations and their mean. MAD uses the original units of the data, which simplifies interpretation. Larger values signify that the data points spread out further from the average. Conversely, lower values correspond to data points bunching closer to it. The mean absolute deviation is also known as the mean deviation and average absolute deviation.
This definition of the mean absolute deviation sounds similar to the standard deviation (SD). While both measure variability, they have different calculations. In recent years, some proponents of MAD have suggested that it replace the SD as the primary measure because it is a simpler concept that better fits real life.
█ Giga Kaleidoscope Modularized Trading System
Core components of an NNFX algorithmic trading strategy
The NNFX algorithm is built on the principles of trend, momentum, and volatility. There are six core components in the NNFX trading algorithm:
1. Volatility - price volatility; e.g., Average True Range, True Range Double, Close-to-Close, etc.
2. Baseline - a moving average to identify price trend
3. Confirmation 1 - a technical indicator used to identify trends
4. Confirmation 2 - a technical indicator used to identify trends
5. Continuation - a technical indicator used to identify trends
6. Volatility/Volume - a technical indicator used to identify volatility/volume breakouts/breakdown
7. Exit - a technical indicator used to determine when a trend is exhausted
8. Metamorphosis - a technical indicator that produces a compound signal from the combination of other GKD indicators*
*(not part of the NNFX algorithm)
What is Volatility in the NNFX trading system?
In the NNFX (No Nonsense Forex) trading system, ATR (Average True Range) is typically used to measure the volatility of an asset. It is used as a part of the system to help determine the appropriate stop loss and take profit levels for a trade. ATR is calculated by taking the average of the true range values over a specified period.
True range is calculated as the maximum of the following values:
-Current high minus the current low
-Absolute value of the current high minus the previous close
-Absolute value of the current low minus the previous close
ATR is a dynamic indicator that changes with changes in volatility. As volatility increases, the value of ATR increases, and as volatility decreases, the value of ATR decreases. By using ATR in NNFX system, traders can adjust their stop loss and take profit levels according to the volatility of the asset being traded. This helps to ensure that the trade is given enough room to move, while also minimizing potential losses.
Other types of volatility include True Range Double (TRD), Close-to-Close, and Garman-Klass
What is a Baseline indicator?
The baseline is essentially a moving average, and is used to determine the overall direction of the market.
The baseline in the NNFX system is used to filter out trades that are not in line with the long-term trend of the market. The baseline is plotted on the chart along with other indicators, such as the Moving Average (MA), the Relative Strength Index (RSI), and the Average True Range (ATR).
Trades are only taken when the price is in the same direction as the baseline. For example, if the baseline is sloping upwards, only long trades are taken, and if the baseline is sloping downwards, only short trades are taken. This approach helps to ensure that trades are in line with the overall trend of the market, and reduces the risk of entering trades that are likely to fail.
By using a baseline in the NNFX system, traders can have a clear reference point for determining the overall trend of the market, and can make more informed trading decisions. The baseline helps to filter out noise and false signals, and ensures that trades are taken in the direction of the long-term trend.
What is a Confirmation indicator?
Confirmation indicators are technical indicators that are used to confirm the signals generated by primary indicators. Primary indicators are the core indicators used in the NNFX system, such as the Average True Range (ATR), the Moving Average (MA), and the Relative Strength Index (RSI).
The purpose of the confirmation indicators is to reduce false signals and improve the accuracy of the trading system. They are designed to confirm the signals generated by the primary indicators by providing additional information about the strength and direction of the trend.
Some examples of confirmation indicators that may be used in the NNFX system include the Bollinger Bands, the MACD (Moving Average Convergence Divergence), and the MACD Oscillator. These indicators can provide information about the volatility, momentum, and trend strength of the market, and can be used to confirm the signals generated by the primary indicators.
In the NNFX system, confirmation indicators are used in combination with primary indicators and other filters to create a trading system that is robust and reliable. By using multiple indicators to confirm trading signals, the system aims to reduce the risk of false signals and improve the overall profitability of the trades.
What is a Continuation indicator?
In the NNFX (No Nonsense Forex) trading system, a continuation indicator is a technical indicator that is used to confirm a current trend and predict that the trend is likely to continue in the same direction. A continuation indicator is typically used in conjunction with other indicators in the system, such as a baseline indicator, to provide a comprehensive trading strategy.
What is a Volatility/Volume indicator?
Volume indicators, such as the On Balance Volume (OBV), the Chaikin Money Flow (CMF), or the Volume Price Trend (VPT), are used to measure the amount of buying and selling activity in a market. They are based on the trading volume of the market, and can provide information about the strength of the trend. In the NNFX system, volume indicators are used to confirm trading signals generated by the Moving Average and the Relative Strength Index. Volatility indicators include Average Direction Index, Waddah Attar, and Volatility Ratio. In the NNFX trading system, volatility is a proxy for volume and vice versa.
By using volume indicators as confirmation tools, the NNFX trading system aims to reduce the risk of false signals and improve the overall profitability of trades. These indicators can provide additional information about the market that is not captured by the primary indicators, and can help traders to make more informed trading decisions. In addition, volume indicators can be used to identify potential changes in market trends and to confirm the strength of price movements.
What is an Exit indicator?
The exit indicator is used in conjunction with other indicators in the system, such as the Moving Average (MA), the Relative Strength Index (RSI), and the Average True Range (ATR), to provide a comprehensive trading strategy.
The exit indicator in the NNFX system can be any technical indicator that is deemed effective at identifying optimal exit points. Examples of exit indicators that are commonly used include the Parabolic SAR, and the Average Directional Index (ADX).
The purpose of the exit indicator is to identify when a trend is likely to reverse or when the market conditions have changed, signaling the need to exit a trade. By using an exit indicator, traders can manage their risk and prevent significant losses.
In the NNFX system, the exit indicator is used in conjunction with a stop loss and a take profit order to maximize profits and minimize losses. The stop loss order is used to limit the amount of loss that can be incurred if the trade goes against the trader, while the take profit order is used to lock in profits when the trade is moving in the trader's favor.
Overall, the use of an exit indicator in the NNFX trading system is an important component of a comprehensive trading strategy. It allows traders to manage their risk effectively and improve the profitability of their trades by exiting at the right time.
What is an Metamorphosis indicator?
The concept of a metamorphosis indicator involves the integration of two or more GKD indicators to generate a compound signal. This is achieved by evaluating the accuracy of each indicator and selecting the signal from the indicator with the highest accuracy. As an illustration, let's consider a scenario where we calculate the accuracy of 10 indicators and choose the signal from the indicator that demonstrates the highest accuracy.
The resulting output from the metamorphosis indicator can then be utilized in a GKD-BT backtest by occupying a slot that aligns with the purpose of the metamorphosis indicator. The slot can be a GKD-B, GKD-C, or GKD-E slot, depending on the specific requirements and objectives of the indicator. This allows for seamless integration and utilization of the compound signal within the GKD-BT framework.
How does Loxx's GKD (Giga Kaleidoscope Modularized Trading System) implement the NNFX algorithm outlined above?
Loxx's GKD v2.0 system has five types of modules (indicators/strategies). These modules are:
1. GKD-BT - Backtesting module (Volatility, Number 1 in the NNFX algorithm)
2. GKD-B - Baseline module (Baseline and Volatility/Volume, Numbers 1 and 2 in the NNFX algorithm)
3. GKD-C - Confirmation 1/2 and Continuation module (Confirmation 1/2 and Continuation, Numbers 3, 4, and 5 in the NNFX algorithm)
4. GKD-V - Volatility/Volume module (Confirmation 1/2, Number 6 in the NNFX algorithm)
5. GKD-E - Exit module (Exit, Number 7 in the NNFX algorithm)
6. GKD-M - Metamorphosis module (Metamorphosis, Number 8 in the NNFX algorithm, but not part of the NNFX algorithm)
(additional module types will added in future releases)
Each module interacts with every module by passing data to A backtest module wherein the various components of the GKD system are combined to create a trading signal.
That is, the Baseline indicator passes its data to Volatility/Volume. The Volatility/Volume indicator passes its values to the Confirmation 1 indicator. The Confirmation 1 indicator passes its values to the Confirmation 2 indicator. The Confirmation 2 indicator passes its values to the Continuation indicator. The Continuation indicator passes its values to the Exit indicator, and finally, the Exit indicator passes its values to the Backtest strategy.
This chaining of indicators requires that each module conform to Loxx's GKD protocol, therefore allowing for the testing of every possible combination of technical indicators that make up the six components of the NNFX algorithm.
What does the application of the GKD trading system look like?
Example trading system:
Backtest: Multi-Ticker CC Backtest
Baseline: Hull Moving Average
Volatility/Volume: Hurst Exponent
Confirmation 1: Advance Trend Pressure as shown on the chart above
Confirmation 2: uf2018
Continuation: Coppock Curve
Exit: Rex Oscillator
Metamorphosis: Baseline Optimizer
Each GKD indicator is denoted with a module identifier of either: GKD-BT, GKD-B, GKD-C, GKD-V, GKD-M, or GKD-E. This allows traders to understand to which module each indicator belongs and where each indicator fits into the GKD system.
█ Giga Kaleidoscope Modularized Trading System Signals
Standard Entry
1. GKD-C Confirmation gives signal
2. Baseline agrees
3. Price inside Goldie Locks Zone Minimum
4. Price inside Goldie Locks Zone Maximum
5. Confirmation 2 agrees
6. Volatility/Volume agrees
1-Candle Standard Entry
1a. GKD-C Confirmation gives signal
2a. Baseline agrees
3a. Price inside Goldie Locks Zone Minimum
4a. Price inside Goldie Locks Zone Maximum
Next Candle
1b. Price retraced
2b. Baseline agrees
3b. Confirmation 1 agrees
4b. Confirmation 2 agrees
5b. Volatility/Volume agrees
Baseline Entry
1. GKD-B Baseline gives signal
2. Confirmation 1 agrees
3. Price inside Goldie Locks Zone Minimum
4. Price inside Goldie Locks Zone Maximum
5. Confirmation 2 agrees
6. Volatility/Volume agrees
7. Confirmation 1 signal was less than 'Maximum Allowable PSBC Bars Back' prior
1-Candle Baseline Entry
1a. GKD-B Baseline gives signal
2a. Confirmation 1 agrees
3a. Price inside Goldie Locks Zone Minimum
4a. Price inside Goldie Locks Zone Maximum
5a. Confirmation 1 signal was less than 'Maximum Allowable PSBC Bars Back' prior
Next Candle
1b. Price retraced
2b. Baseline agrees
3b. Confirmation 1 agrees
4b. Confirmation 2 agrees
5b. Volatility/Volume agrees
Volatility/Volume Entry
1. GKD-V Volatility/Volume gives signal
2. Confirmation 1 agrees
3. Price inside Goldie Locks Zone Minimum
4. Price inside Goldie Locks Zone Maximum
5. Confirmation 2 agrees
6. Baseline agrees
7. Confirmation 1 signal was less than 7 candles prior
1-Candle Volatility/Volume Entry
1a. GKD-V Volatility/Volume gives signal
2a. Confirmation 1 agrees
3a. Price inside Goldie Locks Zone Minimum
4a. Price inside Goldie Locks Zone Maximum
5a. Confirmation 1 signal was less than 'Maximum Allowable PSVVC Bars Back' prior
Next Candle
1b. Price retraced
2b. Volatility/Volume agrees
3b. Confirmation 1 agrees
4b. Confirmation 2 agrees
5b. Baseline agrees
Confirmation 2 Entry
1. GKD-C Confirmation 2 gives signal
2. Confirmation 1 agrees
3. Price inside Goldie Locks Zone Minimum
4. Price inside Goldie Locks Zone Maximum
5. Volatility/Volume agrees
6. Baseline agrees
7. Confirmation 1 signal was less than 7 candles prior
1-Candle Confirmation 2 Entry
1a. GKD-C Confirmation 2 gives signal
2a. Confirmation 1 agrees
3a. Price inside Goldie Locks Zone Minimum
4a. Price inside Goldie Locks Zone Maximum
5a. Confirmation 1 signal was less than 'Maximum Allowable PSC2C Bars Back' prior
Next Candle
1b. Price retraced
2b. Confirmation 2 agrees
3b. Confirmation 1 agrees
4b. Volatility/Volume agrees
5b. Baseline agrees
PullBack Entry
1a. GKD-B Baseline gives signal
2a. Confirmation 1 agrees
3a. Price is beyond 1.0x Volatility of Baseline
Next Candle
1b. Price inside Goldie Locks Zone Minimum
2b. Price inside Goldie Locks Zone Maximum
3b. Confirmation 1 agrees
4b. Confirmation 2 agrees
5b. Volatility/Volume agrees
Continuation Entry
1. Standard Entry, 1-Candle Standard Entry, Baseline Entry, 1-Candle Baseline Entry, Volatility/Volume Entry, 1-Candle Volatility/Volume Entry, Confirmation 2 Entry, 1-Candle Confirmation 2 Entry, or Pullback entry triggered previously
2. Baseline hasn't crossed since entry signal trigger
4. Confirmation 1 agrees
5. Baseline agrees
6. Confirmation 2 agrees

GKD-BT Multi-Ticker Baseline Backtest [Loxx]The Giga Kaleidoscope GKD-BT Multi-Ticker Baseline Backtest is a backtesting module included in Loxx's "Giga Kaleidoscope Modularized Trading System."
█ Giga Kaleidoscope GKD-BT Multi-Ticker Baseline Backtest
The Multi-Ticker SCSC Backtest is a Solo Confirmation Super Complex backtest that allows traders to test GKD-B Multi-Ticker Baseline series baselines indicators filtered. The purpose of this backtest is to enable traders to quickly evaluate the viability of a Baseline across hundreds of tickers within 30-60 minutes.
The backtest module supports testing with 1 take profit and 1 stop loss. It also offers the option to limit testing to a specific date range, allowing simulated forward testing using historical data. This backtest module only includes standard long and short signals. Additionally, users can choose to display or hide a trading panel that provides relevant information about the backtest, statistics, and the current trade. Traders can also select a highlighting threshold for Total Percent Wins and Percent Profitable, and Profit Factor.
To use this indicator:
1. Import 1-10 tickers into the GKD-B Multi-Ticker Baseline indicator
2. Import the value "Input into NEW GKD-BT Multi-ticker Backtest" from the GKD-B Multi-Ticker Baseline indicator (Volatility-Adaptive, Stepped, etc.) into the GKD-BT Multi-Ticker Baseline Backtest.
3. Import the same 1-10 tickers from number step 1 above into the GKD-BT Multi-Ticker Baseline Backtest indicator into the text area field "Input Tickers separated by commas".
3. When importing tickers, ensure that you import the same type of tickers for all 1-10 tickers. For example, test only FX or Cryptocurrency or Stocks. Do not combine different tradable asset types.
4. Make sure that your chart is set to a ticker that corresponds to the tradable asset type. For cryptocurrency testing, set the chart to BTCUSDT. For Forex testing, set the chart to EURUSD.
This backtest includes the following metrics:
1. Net profit: Overall profit or loss achieved.
2. Total Closed Trades: Total number of closed trades, both winning and losing.
3. Total Percent Wins: Total wins, whether long or short, for the selected time interval regardless of commissions and other profit-modifying add-ons.
4. Percent Profitable: Total wins, whether long or short, that are also profitable, taking commissions into account.
5. Profit Factor: The ratio of gross profits to gross losses, indicating how much money the strategy made for every unit of money it lost.
6. Average Profit per Trade: The average gain or loss per trade, calculated by dividing the net profit by the total number of closed trades.
7. Average Number of Bars in Trade: The average number of bars that elapsed during trades for all closed trades.
Summary of notable settings:
Input Tickers separated by commas: Allows the user to input tickers separated by commas, specifying the symbols or tickers of financial instruments used in the backtest. The tickers should follow the format "EXCHANGE:TICKER" (e.g., "NASDAQ:AAPL, NYSE:MSFT").
Import GKD-B Baseline: Imports the "GKD-B Multi-Ticker Baseline" indicator.
Initial Capital: Represents the starting account balance for the backtest, denominated in the base currency of the trading account.
Order Size: Determines the quantity of contracts traded in each trade.
Order Type: Specifies the type of order used in the backtest, either "Contracts" or "% Equity."
Commission: Represents the commission per order or transaction cost incurred in each trade.
**the backtest data rendered to the chart above uses $5 commission per trade and 10% equity per trade with $1 million initial capital. Each backtest result for each ticker assumes these same inputs. The results are NOT cumulative, they are separate and isolated per ticker and trading side, long or short**
█ Volatility Types included
The GKD system utilizes volatility-based take profits and stop losses. Each take profit and stop loss is calculated as a multiple of volatility. You can change the values of the multipliers in the settings as well.
This module includes 17 types of volatility:
Close-to-Close
Parkinson
Garman-Klass
Rogers-Satchell
Yang-Zhang
Garman-Klass-Yang-Zhang
Exponential Weighted Moving Average
Standard Deviation of Log Returns
Pseudo GARCH(2,2)
Average True Range
True Range Double
Standard Deviation
Adaptive Deviation
Median Absolute Deviation
Efficiency-Ratio Adaptive ATR
Mean Absolute Deviation
Static Percent
Various volatility estimators and indicators that investors and traders can use to measure the dispersion or volatility of a financial instrument's price. Each estimator has its strengths and weaknesses, and the choice of estimator should depend on the specific needs and circumstances of the user.
Close-to-Close
Close-to-Close volatility is a classic and widely used volatility measure, sometimes referred to as historical volatility.
Volatility is an indicator of the speed of a stock price change. A stock with high volatility is one where the price changes rapidly and with a larger amplitude. The more volatile a stock is, the riskier it is.
Close-to-close historical volatility is calculated using only a stock's closing prices. It is the simplest volatility estimator. However, in many cases, it is not precise enough. Stock prices could jump significantly during a trading session and return to the opening value at the end. That means that a considerable amount of price information is not taken into account by close-to-close volatility.
Despite its drawbacks, Close-to-Close volatility is still useful in cases where the instrument doesn't have intraday prices. For example, mutual funds calculate their net asset values daily or weekly, and thus their prices are not suitable for more sophisticated volatility estimators.
Parkinson
Parkinson volatility is a volatility measure that uses the stock’s high and low price of the day.
The main difference between regular volatility and Parkinson volatility is that the latter uses high and low prices for a day, rather than only the closing price. This is useful as close-to-close prices could show little difference while large price movements could have occurred during the day. Thus, Parkinson's volatility is considered more precise and requires less data for calculation than close-to-close volatility.
One drawback of this estimator is that it doesn't take into account price movements after the market closes. Hence, it systematically undervalues volatility. This drawback is addressed in the Garman-Klass volatility estimator.
Garman-Klass
Garman-Klass is a volatility estimator that incorporates open, low, high, and close prices of a security.
Garman-Klass volatility extends Parkinson's volatility by taking into account the opening and closing prices. As markets are most active during the opening and closing of a trading session, it makes volatility estimation more accurate.
Garman and Klass also assumed that the process of price change follows a continuous diffusion process (Geometric Brownian motion). However, this assumption has several drawbacks. The method is not robust for opening jumps in price and trend movements.
Despite its drawbacks, the Garman-Klass estimator is still more effective than the basic formula since it takes into account not only the price at the beginning and end of the time interval but also intraday price extremes.
Researchers Rogers and Satchell have proposed a more efficient method for assessing historical volatility that takes into account price trends. See Rogers-Satchell Volatility for more detail.
Rogers-Satchell
Rogers-Satchell is an estimator for measuring the volatility of securities with an average return not equal to zero.
Unlike Parkinson and Garman-Klass estimators, Rogers-Satchell incorporates a drift term (mean return not equal to zero). As a result, it provides better volatility estimation when the underlying is trending.
The main disadvantage of this method is that it does not take into account price movements between trading sessions. This leads to an underestimation of volatility since price jumps periodically occur in the market precisely at the moments between sessions.
A more comprehensive estimator that also considers the gaps between sessions was developed based on the Rogers-Satchel formula in the 2000s by Yang-Zhang. See Yang Zhang Volatility for more detail.
Yang-Zhang
Yang Zhang is a historical volatility estimator that handles both opening jumps and the drift and has a minimum estimation error.
Yang-Zhang volatility can be thought of as a combination of the overnight (close-to-open volatility) and a weighted average of the Rogers-Satchell volatility and the day’s open-to-close volatility. It is considered to be 14 times more efficient than the close-to-close estimator.
Garman-Klass-Yang-Zhang
Garman-Klass-Yang-Zhang (GKYZ) volatility estimator incorporates the returns of open, high, low, and closing prices in its calculation.
GKYZ volatility estimator takes into account overnight jumps but not the trend, i.e., it assumes that the underlying asset follows a Geometric Brownian Motion (GBM) process with zero drift. Therefore, the GKYZ volatility estimator tends to overestimate the volatility when the drift is different from zero. However, for a GBM process, this estimator is eight times more efficient than the close-to-close volatility estimator.
Exponential Weighted Moving Average
The Exponentially Weighted Moving Average (EWMA) is a quantitative or statistical measure used to model or describe a time series. The EWMA is widely used in finance, with the main applications being technical analysis and volatility modeling.
The moving average is designed such that older observations are given lower weights. The weights decrease exponentially as the data point gets older – hence the name exponentially weighted.
The only decision a user of the EWMA must make is the parameter lambda. The parameter decides how important the current observation is in the calculation of the EWMA. The higher the value of lambda, the more closely the EWMA tracks the original time series.
Standard Deviation of Log Returns
This is the simplest calculation of volatility. It's the standard deviation of ln(close/close(1)).
Pseudo GARCH(2,2)
This is calculated using a short- and long-run mean of variance multiplied by ?.
avg(var;M) + (1 ? ?) avg(var;N) = 2?var/(M+1-(M-1)L) + 2(1-?)var/(M+1-(M-1)L)
Solving for ? can be done by minimizing the mean squared error of estimation; that is, regressing L^-1var - avg(var; N) against avg(var; M) - avg(var; N) and using the resulting beta estimate as ?.
Average True Range
The average true range (ATR) is a technical analysis indicator, introduced by market technician J. Welles Wilder Jr. in his book New Concepts in Technical Trading Systems, that measures market volatility by decomposing the entire range of an asset price for that period.
The true range indicator is taken as the greatest of the following: current high less the current low; the absolute value of the current high less the previous close; and the absolute value of the current low less the previous close. The ATR is then a moving average, generally using 14 days, of the true ranges.
True Range Double
A special case of ATR that attempts to correct for volatility skew.
Standard Deviation
Standard deviation is a statistic that measures the dispersion of a dataset relative to its mean and is calculated as the square root of the variance. The standard deviation is calculated as the square root of variance by determining each data point's deviation relative to the mean. If the data points are further from the mean, there is a higher deviation within the data set; thus, the more spread out the data, the higher the standard deviation.
Adaptive Deviation
By definition, the Standard Deviation (STD, also represented by the Greek letter sigma ? or the Latin letter s) is a measure that is used to quantify the amount of variation or dispersion of a set of data values. In technical analysis, we usually use it to measure the level of current volatility.
Standard Deviation is based on Simple Moving Average calculation for mean value. This version of standard deviation uses the properties of EMA to calculate what can be called a new type of deviation, and since it is based on EMA, we can call it EMA deviation. Additionally, Perry Kaufman's efficiency ratio is used to make it adaptive (since all EMA type calculations are nearly perfect for adapting).
The difference when compared to the standard is significant--not just because of EMA usage, but the efficiency ratio makes it a "bit more logical" in very volatile market conditions.
Median Absolute Deviation
The median absolute deviation is a measure of statistical dispersion. Moreover, the MAD is a robust statistic, being more resilient to outliers in a data set than the standard deviation. In the standard deviation, the distances from the mean are squared, so large deviations are weighted more heavily, and thus outliers can heavily influence it. In the MAD, the deviations of a small number of outliers are irrelevant.
Because the MAD is a more robust estimator of scale than the sample variance or standard deviation, it works better with distributions without a mean or variance, such as the Cauchy distribution.
For this indicator, a manual recreation of the quantile function in Pine Script is used. This is so users have a full inside view into how this is calculated.
Efficiency-Ratio Adaptive ATR
Average True Range (ATR) is a widely used indicator for many occasions in technical analysis. It is calculated as the RMA of the true range. This version adds a "twist": it uses Perry Kaufman's Efficiency Ratio to calculate adaptive true range.
Mean Absolute Deviation
The mean absolute deviation (MAD) is a measure of variability that indicates the average distance between observations and their mean. MAD uses the original units of the data, which simplifies interpretation. Larger values signify that the data points spread out further from the average. Conversely, lower values correspond to data points bunching closer to it. The mean absolute deviation is also known as the mean deviation and average absolute deviation.
This definition of the mean absolute deviation sounds similar to the standard deviation (SD). While both measure variability, they have different calculations. In recent years, some proponents of MAD have suggested that it replace the SD as the primary measure because it is a simpler concept that better fits real life.
█ Giga Kaleidoscope Modularized Trading System
Core components of an NNFX algorithmic trading strategy
The NNFX algorithm is built on the principles of trend, momentum, and volatility. There are six core components in the NNFX trading algorithm:
1. Volatility - price volatility; e.g., Average True Range, True Range Double, Close-to-Close, etc.
2. Baseline - a moving average to identify price trend
3. Confirmation 1 - a technical indicator used to identify trends
4. Confirmation 2 - a technical indicator used to identify trends
5. Continuation - a technical indicator used to identify trends
6. Volatility/Volume - a technical indicator used to identify volatility/volume breakouts/breakdown
7. Exit - a technical indicator used to determine when a trend is exhausted
8. Metamorphosis - a technical indicator that produces a compound signal from the combination of other GKD indicators*
*(not part of the NNFX algorithm)
What is Volatility in the NNFX trading system?
In the NNFX (No Nonsense Forex) trading system, ATR (Average True Range) is typically used to measure the volatility of an asset. It is used as a part of the system to help determine the appropriate stop loss and take profit levels for a trade. ATR is calculated by taking the average of the true range values over a specified period.
True range is calculated as the maximum of the following values:
-Current high minus the current low
-Absolute value of the current high minus the previous close
-Absolute value of the current low minus the previous close
ATR is a dynamic indicator that changes with changes in volatility. As volatility increases, the value of ATR increases, and as volatility decreases, the value of ATR decreases. By using ATR in NNFX system, traders can adjust their stop loss and take profit levels according to the volatility of the asset being traded. This helps to ensure that the trade is given enough room to move, while also minimizing potential losses.
Other types of volatility include True Range Double (TRD), Close-to-Close, and Garman-Klass
What is a Baseline indicator?
The baseline is essentially a moving average, and is used to determine the overall direction of the market.
The baseline in the NNFX system is used to filter out trades that are not in line with the long-term trend of the market. The baseline is plotted on the chart along with other indicators, such as the Moving Average (MA), the Relative Strength Index (RSI), and the Average True Range (ATR).
Trades are only taken when the price is in the same direction as the baseline. For example, if the baseline is sloping upwards, only long trades are taken, and if the baseline is sloping downwards, only short trades are taken. This approach helps to ensure that trades are in line with the overall trend of the market, and reduces the risk of entering trades that are likely to fail.
By using a baseline in the NNFX system, traders can have a clear reference point for determining the overall trend of the market, and can make more informed trading decisions. The baseline helps to filter out noise and false signals, and ensures that trades are taken in the direction of the long-term trend.
What is a Confirmation indicator?
Confirmation indicators are technical indicators that are used to confirm the signals generated by primary indicators. Primary indicators are the core indicators used in the NNFX system, such as the Average True Range (ATR), the Moving Average (MA), and the Relative Strength Index (RSI).
The purpose of the confirmation indicators is to reduce false signals and improve the accuracy of the trading system. They are designed to confirm the signals generated by the primary indicators by providing additional information about the strength and direction of the trend.
Some examples of confirmation indicators that may be used in the NNFX system include the Bollinger Bands, the MACD (Moving Average Convergence Divergence), and the MACD Oscillator. These indicators can provide information about the volatility, momentum, and trend strength of the market, and can be used to confirm the signals generated by the primary indicators.
In the NNFX system, confirmation indicators are used in combination with primary indicators and other filters to create a trading system that is robust and reliable. By using multiple indicators to confirm trading signals, the system aims to reduce the risk of false signals and improve the overall profitability of the trades.
What is a Continuation indicator?
In the NNFX (No Nonsense Forex) trading system, a continuation indicator is a technical indicator that is used to confirm a current trend and predict that the trend is likely to continue in the same direction. A continuation indicator is typically used in conjunction with other indicators in the system, such as a baseline indicator, to provide a comprehensive trading strategy.
What is a Volatility/Volume indicator?
Volume indicators, such as the On Balance Volume (OBV), the Chaikin Money Flow (CMF), or the Volume Price Trend (VPT), are used to measure the amount of buying and selling activity in a market. They are based on the trading volume of the market, and can provide information about the strength of the trend. In the NNFX system, volume indicators are used to confirm trading signals generated by the Moving Average and the Relative Strength Index. Volatility indicators include Average Direction Index, Waddah Attar, and Volatility Ratio. In the NNFX trading system, volatility is a proxy for volume and vice versa.
By using volume indicators as confirmation tools, the NNFX trading system aims to reduce the risk of false signals and improve the overall profitability of trades. These indicators can provide additional information about the market that is not captured by the primary indicators, and can help traders to make more informed trading decisions. In addition, volume indicators can be used to identify potential changes in market trends and to confirm the strength of price movements.
What is an Exit indicator?
The exit indicator is used in conjunction with other indicators in the system, such as the Moving Average (MA), the Relative Strength Index (RSI), and the Average True Range (ATR), to provide a comprehensive trading strategy.
The exit indicator in the NNFX system can be any technical indicator that is deemed effective at identifying optimal exit points. Examples of exit indicators that are commonly used include the Parabolic SAR, and the Average Directional Index (ADX).
The purpose of the exit indicator is to identify when a trend is likely to reverse or when the market conditions have changed, signaling the need to exit a trade. By using an exit indicator, traders can manage their risk and prevent significant losses.
In the NNFX system, the exit indicator is used in conjunction with a stop loss and a take profit order to maximize profits and minimize losses. The stop loss order is used to limit the amount of loss that can be incurred if the trade goes against the trader, while the take profit order is used to lock in profits when the trade is moving in the trader's favor.
Overall, the use of an exit indicator in the NNFX trading system is an important component of a comprehensive trading strategy. It allows traders to manage their risk effectively and improve the profitability of their trades by exiting at the right time.
What is an Metamorphosis indicator?
The concept of a metamorphosis indicator involves the integration of two or more GKD indicators to generate a compound signal. This is achieved by evaluating the accuracy of each indicator and selecting the signal from the indicator with the highest accuracy. As an illustration, let's consider a scenario where we calculate the accuracy of 10 indicators and choose the signal from the indicator that demonstrates the highest accuracy.
The resulting output from the metamorphosis indicator can then be utilized in a GKD-BT backtest by occupying a slot that aligns with the purpose of the metamorphosis indicator. The slot can be a GKD-B, GKD-C, or GKD-E slot, depending on the specific requirements and objectives of the indicator. This allows for seamless integration and utilization of the compound signal within the GKD-BT framework.
How does Loxx's GKD (Giga Kaleidoscope Modularized Trading System) implement the NNFX algorithm outlined above?
Loxx's GKD v2.0 system has five types of modules (indicators/strategies). These modules are:
1. GKD-BT - Backtesting module (Volatility, Number 1 in the NNFX algorithm)
2. GKD-B - Baseline module (Baseline and Volatility/Volume, Numbers 1 and 2 in the NNFX algorithm)
3. GKD-C - Confirmation 1/2 and Continuation module (Confirmation 1/2 and Continuation, Numbers 3, 4, and 5 in the NNFX algorithm)
4. GKD-V - Volatility/Volume module (Confirmation 1/2, Number 6 in the NNFX algorithm)
5. GKD-E - Exit module (Exit, Number 7 in the NNFX algorithm)
6. GKD-M - Metamorphosis module (Metamorphosis, Number 8 in the NNFX algorithm, but not part of the NNFX algorithm)
(additional module types will added in future releases)
Each module interacts with every module by passing data to A backtest module wherein the various components of the GKD system are combined to create a trading signal.
That is, the Baseline indicator passes its data to Volatility/Volume. The Volatility/Volume indicator passes its values to the Confirmation 1 indicator. The Confirmation 1 indicator passes its values to the Confirmation 2 indicator. The Confirmation 2 indicator passes its values to the Continuation indicator. The Continuation indicator passes its values to the Exit indicator, and finally, the Exit indicator passes its values to the Backtest strategy.
This chaining of indicators requires that each module conform to Loxx's GKD protocol, therefore allowing for the testing of every possible combination of technical indicators that make up the six components of the NNFX algorithm.
What does the application of the GKD trading system look like?
Example trading system:
Backtest: Multi-Ticker CC Backtest
Baseline: Hull Moving Average
Volatility/Volume: Hurst Exponent
Confirmation 1: Advance Trend Pressure as shown on the chart above
Confirmation 2: uf2018
Continuation: Coppock Curve
Exit: Rex Oscillator
Metamorphosis: Baseline Optimizer
Each GKD indicator is denoted with a module identifier of either: GKD-BT, GKD-B, GKD-C, GKD-V, GKD-M, or GKD-E. This allows traders to understand to which module each indicator belongs and where each indicator fits into the GKD system.
█ Giga Kaleidoscope Modularized Trading System Signals
Standard Entry
1. GKD-C Confirmation gives signal
2. Baseline agrees
3. Price inside Goldie Locks Zone Minimum
4. Price inside Goldie Locks Zone Maximum
5. Confirmation 2 agrees
6. Volatility/Volume agrees
1-Candle Standard Entry
1a. GKD-C Confirmation gives signal
2a. Baseline agrees
3a. Price inside Goldie Locks Zone Minimum
4a. Price inside Goldie Locks Zone Maximum
Next Candle
1b. Price retraced
2b. Baseline agrees
3b. Confirmation 1 agrees
4b. Confirmation 2 agrees
5b. Volatility/Volume agrees
Baseline Entry
1. GKD-B Baseline gives signal
2. Confirmation 1 agrees
3. Price inside Goldie Locks Zone Minimum
4. Price inside Goldie Locks Zone Maximum
5. Confirmation 2 agrees
6. Volatility/Volume agrees
7. Confirmation 1 signal was less than 'Maximum Allowable PSBC Bars Back' prior
1-Candle Baseline Entry
1a. GKD-B Baseline gives signal
2a. Confirmation 1 agrees
3a. Price inside Goldie Locks Zone Minimum
4a. Price inside Goldie Locks Zone Maximum
5a. Confirmation 1 signal was less than 'Maximum Allowable PSBC Bars Back' prior
Next Candle
1b. Price retraced
2b. Baseline agrees
3b. Confirmation 1 agrees
4b. Confirmation 2 agrees
5b. Volatility/Volume agrees
Volatility/Volume Entry
1. GKD-V Volatility/Volume gives signal
2. Confirmation 1 agrees
3. Price inside Goldie Locks Zone Minimum
4. Price inside Goldie Locks Zone Maximum
5. Confirmation 2 agrees
6. Baseline agrees
7. Confirmation 1 signal was less than 7 candles prior
1-Candle Volatility/Volume Entry
1a. GKD-V Volatility/Volume gives signal
2a. Confirmation 1 agrees
3a. Price inside Goldie Locks Zone Minimum
4a. Price inside Goldie Locks Zone Maximum
5a. Confirmation 1 signal was less than 'Maximum Allowable PSVVC Bars Back' prior
Next Candle
1b. Price retraced
2b. Volatility/Volume agrees
3b. Confirmation 1 agrees
4b. Confirmation 2 agrees
5b. Baseline agrees
Confirmation 2 Entry
1. GKD-C Confirmation 2 gives signal
2. Confirmation 1 agrees
3. Price inside Goldie Locks Zone Minimum
4. Price inside Goldie Locks Zone Maximum
5. Volatility/Volume agrees
6. Baseline agrees
7. Confirmation 1 signal was less than 7 candles prior
1-Candle Confirmation 2 Entry
1a. GKD-C Confirmation 2 gives signal
2a. Confirmation 1 agrees
3a. Price inside Goldie Locks Zone Minimum
4a. Price inside Goldie Locks Zone Maximum
5a. Confirmation 1 signal was less than 'Maximum Allowable PSC2C Bars Back' prior
Next Candle
1b. Price retraced
2b. Confirmation 2 agrees
3b. Confirmation 1 agrees
4b. Volatility/Volume agrees
5b. Baseline agrees
PullBack Entry
1a. GKD-B Baseline gives signal
2a. Confirmation 1 agrees
3a. Price is beyond 1.0x Volatility of Baseline
Next Candle
1b. Price inside Goldie Locks Zone Minimum
2b. Price inside Goldie Locks Zone Maximum
3b. Confirmation 1 agrees
4b. Confirmation 2 agrees
5b. Volatility/Volume agrees
Continuation Entry
1. Standard Entry, 1-Candle Standard Entry, Baseline Entry, 1-Candle Baseline Entry, Volatility/Volume Entry, 1-Candle Volatility/Volume Entry, Confirmation 2 Entry, 1-Candle Confirmation 2 Entry, or Pullback entry triggered previously
2. Baseline hasn't crossed since entry signal trigger
4. Confirmation 1 agrees
5. Baseline agrees
6. Confirmation 2 agrees

GKD-C XMA Histogram [Loxx]The Giga Kaleidoscope GKD-C XMA Histogram is a Confirmation module included in Loxx's "Giga Kaleidoscope Modularized Trading System."
█ GKD-C XMA Histogram
The "XMA Histogram" utilizes a dynamic approach to analyze market trends through various types of moving averages, including Exponential Moving Average (EMA), Fast Exponential Moving Average (FEMA), Linear Weighted Moving Average (LWMA), Simple Moving Average (SMA), and Smoothed Moving Average (SMMA). This flexibility allows traders to select the moving average that best fits their trading style and market conditions. The indicator calculates the selected moving average over a specified period for a given price source, then examines the difference between the current and previous values of this moving average.
A threshold, adjusted for market precision, determines significant changes. If the change in the moving average exceeds this threshold, it signals potential market momentum. The histogram visualizes this momentum, marking upward momentum with green and downward momentum with red. The XMA Histogram is designed to signal potential entry and exit points, identifying when the price crosses the moving average in a way that suggests a strong trend. This tool is particularly useful for traders looking to capitalize on trends by providing a clear, visual representation of market momentum and direction shifts.
█ Giga Kaleidoscope Modularized Trading System
Core components of an NNFX algorithmic trading strategy
The NNFX algorithm is built on the principles of trend, momentum, and volatility. There are six core components in the NNFX trading algorithm:
1. Volatility - price volatility; e.g., Average True Range, True Range Double, Close-to-Close, etc.
2. Baseline - a moving average to identify price trend
3. Confirmation 1 - a technical indicator used to identify trends
4. Confirmation 2 - a technical indicator used to identify trends
5. Continuation - a technical indicator used to identify trends
6. Volatility/Volume - a technical indicator used to identify volatility/volume breakouts/breakdown
7. Exit - a technical indicator used to determine when a trend is exhausted
8. Metamorphosis - a technical indicator that produces a compound signal from the combination of other GKD indicators*
*(not part of the NNFX algorithm)
What is Volatility in the NNFX trading system?
In the NNFX (No Nonsense Forex) trading system, ATR (Average True Range) is typically used to measure the volatility of an asset. It is used as a part of the system to help determine the appropriate stop loss and take profit levels for a trade. ATR is calculated by taking the average of the true range values over a specified period.
True range is calculated as the maximum of the following values:
-Current high minus the current low
-Absolute value of the current high minus the previous close
-Absolute value of the current low minus the previous close
ATR is a dynamic indicator that changes with changes in volatility. As volatility increases, the value of ATR increases, and as volatility decreases, the value of ATR decreases. By using ATR in NNFX system, traders can adjust their stop loss and take profit levels according to the volatility of the asset being traded. This helps to ensure that the trade is given enough room to move, while also minimizing potential losses.
Other types of volatility include True Range Double (TRD), Close-to-Close, and Garman-Klass
What is a Baseline indicator?
The baseline is essentially a moving average, and is used to determine the overall direction of the market.
The baseline in the NNFX system is used to filter out trades that are not in line with the long-term trend of the market. The baseline is plotted on the chart along with other indicators, such as the Moving Average (MA), the Relative Strength Index (RSI), and the Average True Range (ATR).
Trades are only taken when the price is in the same direction as the baseline. For example, if the baseline is sloping upwards, only long trades are taken, and if the baseline is sloping downwards, only short trades are taken. This approach helps to ensure that trades are in line with the overall trend of the market, and reduces the risk of entering trades that are likely to fail.
By using a baseline in the NNFX system, traders can have a clear reference point for determining the overall trend of the market, and can make more informed trading decisions. The baseline helps to filter out noise and false signals, and ensures that trades are taken in the direction of the long-term trend.
What is a Confirmation indicator?
Confirmation indicators are technical indicators that are used to confirm the signals generated by primary indicators. Primary indicators are the core indicators used in the NNFX system, such as the Average True Range (ATR), the Moving Average (MA), and the Relative Strength Index (RSI).
The purpose of the confirmation indicators is to reduce false signals and improve the accuracy of the trading system. They are designed to confirm the signals generated by the primary indicators by providing additional information about the strength and direction of the trend.
Some examples of confirmation indicators that may be used in the NNFX system include the Bollinger Bands, the MACD (Moving Average Convergence Divergence), and the MACD Oscillator. These indicators can provide information about the volatility, momentum, and trend strength of the market, and can be used to confirm the signals generated by the primary indicators.
In the NNFX system, confirmation indicators are used in combination with primary indicators and other filters to create a trading system that is robust and reliable. By using multiple indicators to confirm trading signals, the system aims to reduce the risk of false signals and improve the overall profitability of the trades.
What is a Continuation indicator?
In the NNFX (No Nonsense Forex) trading system, a continuation indicator is a technical indicator that is used to confirm a current trend and predict that the trend is likely to continue in the same direction. A continuation indicator is typically used in conjunction with other indicators in the system, such as a baseline indicator, to provide a comprehensive trading strategy.
What is a Volatility/Volume indicator?
Volume indicators, such as the On Balance Volume (OBV), the Chaikin Money Flow (CMF), or the Volume Price Trend (VPT), are used to measure the amount of buying and selling activity in a market. They are based on the trading volume of the market, and can provide information about the strength of the trend. In the NNFX system, volume indicators are used to confirm trading signals generated by the Moving Average and the Relative Strength Index. Volatility indicators include Average Direction Index, Waddah Attar, and Volatility Ratio. In the NNFX trading system, volatility is a proxy for volume and vice versa.
By using volume indicators as confirmation tools, the NNFX trading system aims to reduce the risk of false signals and improve the overall profitability of trades. These indicators can provide additional information about the market that is not captured by the primary indicators, and can help traders to make more informed trading decisions. In addition, volume indicators can be used to identify potential changes in market trends and to confirm the strength of price movements.
What is an Exit indicator?
The exit indicator is used in conjunction with other indicators in the system, such as the Moving Average (MA), the Relative Strength Index (RSI), and the Average True Range (ATR), to provide a comprehensive trading strategy.
The exit indicator in the NNFX system can be any technical indicator that is deemed effective at identifying optimal exit points. Examples of exit indicators that are commonly used include the Parabolic SAR, and the Average Directional Index (ADX).
The purpose of the exit indicator is to identify when a trend is likely to reverse or when the market conditions have changed, signaling the need to exit a trade. By using an exit indicator, traders can manage their risk and prevent significant losses.
In the NNFX system, the exit indicator is used in conjunction with a stop loss and a take profit order to maximize profits and minimize losses. The stop loss order is used to limit the amount of loss that can be incurred if the trade goes against the trader, while the take profit order is used to lock in profits when the trade is moving in the trader's favor.
Overall, the use of an exit indicator in the NNFX trading system is an important component of a comprehensive trading strategy. It allows traders to manage their risk effectively and improve the profitability of their trades by exiting at the right time.
What is an Metamorphosis indicator?
The concept of a metamorphosis indicator involves the integration of two or more GKD indicators to generate a compound signal. This is achieved by evaluating the accuracy of each indicator and selecting the signal from the indicator with the highest accuracy. As an illustration, let's consider a scenario where we calculate the accuracy of 10 indicators and choose the signal from the indicator that demonstrates the highest accuracy.
The resulting output from the metamorphosis indicator can then be utilized in a GKD-BT backtest by occupying a slot that aligns with the purpose of the metamorphosis indicator. The slot can be a GKD-B, GKD-C, or GKD-E slot, depending on the specific requirements and objectives of the indicator. This allows for seamless integration and utilization of the compound signal within the GKD-BT framework.
How does Loxx's GKD (Giga Kaleidoscope Modularized Trading System) implement the NNFX algorithm outlined above?
Loxx's GKD v2.0 system has five types of modules (indicators/strategies). These modules are:
1. GKD-BT - Backtesting module (Volatility, Number 1 in the NNFX algorithm)
2. GKD-B - Baseline module (Baseline and Volatility/Volume, Numbers 1 and 2 in the NNFX algorithm)
3. GKD-C - Confirmation 1/2 and Continuation module (Confirmation 1/2 and Continuation, Numbers 3, 4, and 5 in the NNFX algorithm)
4. GKD-V - Volatility/Volume module (Confirmation 1/2, Number 6 in the NNFX algorithm)
5. GKD-E - Exit module (Exit, Number 7 in the NNFX algorithm)
6. GKD-M - Metamorphosis module (Metamorphosis, Number 8 in the NNFX algorithm, but not part of the NNFX algorithm)
(additional module types will added in future releases)
Each module interacts with every module by passing data to A backtest module wherein the various components of the GKD system are combined to create a trading signal.
That is, the Baseline indicator passes its data to Volatility/Volume. The Volatility/Volume indicator passes its values to the Confirmation 1 indicator. The Confirmation 1 indicator passes its values to the Confirmation 2 indicator. The Confirmation 2 indicator passes its values to the Continuation indicator. The Continuation indicator passes its values to the Exit indicator, and finally, the Exit indicator passes its values to the Backtest strategy.
This chaining of indicators requires that each module conform to Loxx's GKD protocol, therefore allowing for the testing of every possible combination of technical indicators that make up the six components of the NNFX algorithm.
What does the application of the GKD trading system look like?
Example trading system:
Backtest: Multi-Ticker CC Backtest
Baseline: Hull Moving Average
Volatility/Volume: Hurst Exponent
Confirmation 1: Advance Trend Pressure as shown on the chart above
Confirmation 2: uf2018
Continuation: Coppock Curve
Exit: Rex Oscillator
Metamorphosis: Baseline Optimizer
Each GKD indicator is denoted with a module identifier of either: GKD-BT, GKD-B, GKD-C, GKD-V, GKD-M, or GKD-E. This allows traders to understand to which module each indicator belongs and where each indicator fits into the GKD system.
█ Giga Kaleidoscope Modularized Trading System Signals
Standard Entry
1. GKD-C Confirmation gives signal
2. Baseline agrees
3. Price inside Goldie Locks Zone Minimum
4. Price inside Goldie Locks Zone Maximum
5. Confirmation 2 agrees
6. Volatility/Volume agrees
1-Candle Standard Entry
1a. GKD-C Confirmation gives signal
2a. Baseline agrees
3a. Price inside Goldie Locks Zone Minimum
4a. Price inside Goldie Locks Zone Maximum
Next Candle
1b. Price retraced
2b. Baseline agrees
3b. Confirmation 1 agrees
4b. Confirmation 2 agrees
5b. Volatility/Volume agrees
Baseline Entry
1. GKD-B Baseline gives signal
2. Confirmation 1 agrees
3. Price inside Goldie Locks Zone Minimum
4. Price inside Goldie Locks Zone Maximum
5. Confirmation 2 agrees
6. Volatility/Volume agrees
7. Confirmation 1 signal was less than 'Maximum Allowable PSBC Bars Back' prior
1-Candle Baseline Entry
1a. GKD-B Baseline gives signal
2a. Confirmation 1 agrees
3a. Price inside Goldie Locks Zone Minimum
4a. Price inside Goldie Locks Zone Maximum
5a. Confirmation 1 signal was less than 'Maximum Allowable PSBC Bars Back' prior
Next Candle
1b. Price retraced
2b. Baseline agrees
3b. Confirmation 1 agrees
4b. Confirmation 2 agrees
5b. Volatility/Volume agrees
Volatility/Volume Entry
1. GKD-V Volatility/Volume gives signal
2. Confirmation 1 agrees
3. Price inside Goldie Locks Zone Minimum
4. Price inside Goldie Locks Zone Maximum
5. Confirmation 2 agrees
6. Baseline agrees
7. Confirmation 1 signal was less than 7 candles prior
1-Candle Volatility/Volume Entry
1a. GKD-V Volatility/Volume gives signal
2a. Confirmation 1 agrees
3a. Price inside Goldie Locks Zone Minimum
4a. Price inside Goldie Locks Zone Maximum
5a. Confirmation 1 signal was less than 'Maximum Allowable PSVVC Bars Back' prior
Next Candle
1b. Price retraced
2b. Volatility/Volume agrees
3b. Confirmation 1 agrees
4b. Confirmation 2 agrees
5b. Baseline agrees
Confirmation 2 Entry
1. GKD-C Confirmation 2 gives signal
2. Confirmation 1 agrees
3. Price inside Goldie Locks Zone Minimum
4. Price inside Goldie Locks Zone Maximum
5. Volatility/Volume agrees
6. Baseline agrees
7. Confirmation 1 signal was less than 7 candles prior
1-Candle Confirmation 2 Entry
1a. GKD-C Confirmation 2 gives signal
2a. Confirmation 1 agrees
3a. Price inside Goldie Locks Zone Minimum
4a. Price inside Goldie Locks Zone Maximum
5a. Confirmation 1 signal was less than 'Maximum Allowable PSC2C Bars Back' prior
Next Candle
1b. Price retraced
2b. Confirmation 2 agrees
3b. Confirmation 1 agrees
4b. Volatility/Volume agrees
5b. Baseline agrees
PullBack Entry
1a. GKD-B Baseline gives signal
2a. Confirmation 1 agrees
3a. Price is beyond 1.0x Volatility of Baseline
Next Candle
1b. Price inside Goldie Locks Zone Minimum
2b. Price inside Goldie Locks Zone Maximum
3b. Confirmation 1 agrees
4b. Confirmation 2 agrees
5b. Volatility/Volume agrees
Continuation Entry
1. Standard Entry, 1-Candle Standard Entry, Baseline Entry, 1-Candle Baseline Entry, Volatility/Volume Entry, 1-Candle Volatility/Volume Entry, Confirmation 2 Entry, 1-Candle Confirmation 2 Entry, or Pullback entry triggered previously
2. Baseline hasn't crossed since entry signal trigger
4. Confirmation 1 agrees
5. Baseline agrees
6. Confirmation 2 agrees

GKD-C Momentum Candles [Loxx]The Giga Kaleidoscope GKD-C Momentum Candles is a Confirmation module included in Loxx's "Giga Kaleidoscope Modularized Trading System."
█ GKD-C Momentum Candles
The Momentum Candles indicator uses the difference between the closing and opening prices divided by the Average True Range (ATR) over 50 periods to calculate momentum. It sets upper and lower thresholds based on an ATR multiplier: the upper threshold (Tresh1) is 1 divided by the ATR multiplier, and the lower threshold (Tresh2) is the negative inverse of this value. These thresholds help identify significant momentum shifts, generating long/short signals.
█ Giga Kaleidoscope Modularized Trading System
Core components of an NNFX algorithmic trading strategy
The NNFX algorithm is built on the principles of trend, momentum, and volatility. There are six core components in the NNFX trading algorithm:
1. Volatility - price volatility; e.g., Average True Range, True Range Double, Close-to-Close, etc.
2. Baseline - a moving average to identify price trend
3. Confirmation 1 - a technical indicator used to identify trends
4. Confirmation 2 - a technical indicator used to identify trends
5. Continuation - a technical indicator used to identify trends
6. Volatility/Volume - a technical indicator used to identify volatility/volume breakouts/breakdown
7. Exit - a technical indicator used to determine when a trend is exhausted
8. Metamorphosis - a technical indicator that produces a compound signal from the combination of other GKD indicators*
*(not part of the NNFX algorithm)
What is Volatility in the NNFX trading system?
In the NNFX (No Nonsense Forex) trading system, ATR (Average True Range) is typically used to measure the volatility of an asset. It is used as a part of the system to help determine the appropriate stop loss and take profit levels for a trade. ATR is calculated by taking the average of the true range values over a specified period.
True range is calculated as the maximum of the following values:
-Current high minus the current low
-Absolute value of the current high minus the previous close
-Absolute value of the current low minus the previous close
ATR is a dynamic indicator that changes with changes in volatility. As volatility increases, the value of ATR increases, and as volatility decreases, the value of ATR decreases. By using ATR in NNFX system, traders can adjust their stop loss and take profit levels according to the volatility of the asset being traded. This helps to ensure that the trade is given enough room to move, while also minimizing potential losses.
Other types of volatility include True Range Double (TRD), Close-to-Close, and Garman-Klass
What is a Baseline indicator?
The baseline is essentially a moving average, and is used to determine the overall direction of the market.
The baseline in the NNFX system is used to filter out trades that are not in line with the long-term trend of the market. The baseline is plotted on the chart along with other indicators, such as the Moving Average (MA), the Relative Strength Index (RSI), and the Average True Range (ATR).
Trades are only taken when the price is in the same direction as the baseline. For example, if the baseline is sloping upwards, only long trades are taken, and if the baseline is sloping downwards, only short trades are taken. This approach helps to ensure that trades are in line with the overall trend of the market, and reduces the risk of entering trades that are likely to fail.
By using a baseline in the NNFX system, traders can have a clear reference point for determining the overall trend of the market, and can make more informed trading decisions. The baseline helps to filter out noise and false signals, and ensures that trades are taken in the direction of the long-term trend.
What is a Confirmation indicator?
Confirmation indicators are technical indicators that are used to confirm the signals generated by primary indicators. Primary indicators are the core indicators used in the NNFX system, such as the Average True Range (ATR), the Moving Average (MA), and the Relative Strength Index (RSI).
The purpose of the confirmation indicators is to reduce false signals and improve the accuracy of the trading system. They are designed to confirm the signals generated by the primary indicators by providing additional information about the strength and direction of the trend.
Some examples of confirmation indicators that may be used in the NNFX system include the Bollinger Bands, the MACD (Moving Average Convergence Divergence), and the MACD Oscillator. These indicators can provide information about the volatility, momentum, and trend strength of the market, and can be used to confirm the signals generated by the primary indicators.
In the NNFX system, confirmation indicators are used in combination with primary indicators and other filters to create a trading system that is robust and reliable. By using multiple indicators to confirm trading signals, the system aims to reduce the risk of false signals and improve the overall profitability of the trades.
What is a Continuation indicator?
In the NNFX (No Nonsense Forex) trading system, a continuation indicator is a technical indicator that is used to confirm a current trend and predict that the trend is likely to continue in the same direction. A continuation indicator is typically used in conjunction with other indicators in the system, such as a baseline indicator, to provide a comprehensive trading strategy.
What is a Volatility/Volume indicator?
Volume indicators, such as the On Balance Volume (OBV), the Chaikin Money Flow (CMF), or the Volume Price Trend (VPT), are used to measure the amount of buying and selling activity in a market. They are based on the trading volume of the market, and can provide information about the strength of the trend. In the NNFX system, volume indicators are used to confirm trading signals generated by the Moving Average and the Relative Strength Index. Volatility indicators include Average Direction Index, Waddah Attar, and Volatility Ratio. In the NNFX trading system, volatility is a proxy for volume and vice versa.
By using volume indicators as confirmation tools, the NNFX trading system aims to reduce the risk of false signals and improve the overall profitability of trades. These indicators can provide additional information about the market that is not captured by the primary indicators, and can help traders to make more informed trading decisions. In addition, volume indicators can be used to identify potential changes in market trends and to confirm the strength of price movements.
What is an Exit indicator?
The exit indicator is used in conjunction with other indicators in the system, such as the Moving Average (MA), the Relative Strength Index (RSI), and the Average True Range (ATR), to provide a comprehensive trading strategy.
The exit indicator in the NNFX system can be any technical indicator that is deemed effective at identifying optimal exit points. Examples of exit indicators that are commonly used include the Parabolic SAR, and the Average Directional Index (ADX).
The purpose of the exit indicator is to identify when a trend is likely to reverse or when the market conditions have changed, signaling the need to exit a trade. By using an exit indicator, traders can manage their risk and prevent significant losses.
In the NNFX system, the exit indicator is used in conjunction with a stop loss and a take profit order to maximize profits and minimize losses. The stop loss order is used to limit the amount of loss that can be incurred if the trade goes against the trader, while the take profit order is used to lock in profits when the trade is moving in the trader's favor.
Overall, the use of an exit indicator in the NNFX trading system is an important component of a comprehensive trading strategy. It allows traders to manage their risk effectively and improve the profitability of their trades by exiting at the right time.
What is an Metamorphosis indicator?
The concept of a metamorphosis indicator involves the integration of two or more GKD indicators to generate a compound signal. This is achieved by evaluating the accuracy of each indicator and selecting the signal from the indicator with the highest accuracy. As an illustration, let's consider a scenario where we calculate the accuracy of 10 indicators and choose the signal from the indicator that demonstrates the highest accuracy.
The resulting output from the metamorphosis indicator can then be utilized in a GKD-BT backtest by occupying a slot that aligns with the purpose of the metamorphosis indicator. The slot can be a GKD-B, GKD-C, or GKD-E slot, depending on the specific requirements and objectives of the indicator. This allows for seamless integration and utilization of the compound signal within the GKD-BT framework.
How does Loxx's GKD (Giga Kaleidoscope Modularized Trading System) implement the NNFX algorithm outlined above?
Loxx's GKD v2.0 system has five types of modules (indicators/strategies). These modules are:
1. GKD-BT - Backtesting module (Volatility, Number 1 in the NNFX algorithm)
2. GKD-B - Baseline module (Baseline and Volatility/Volume, Numbers 1 and 2 in the NNFX algorithm)
3. GKD-C - Confirmation 1/2 and Continuation module (Confirmation 1/2 and Continuation, Numbers 3, 4, and 5 in the NNFX algorithm)
4. GKD-V - Volatility/Volume module (Confirmation 1/2, Number 6 in the NNFX algorithm)
5. GKD-E - Exit module (Exit, Number 7 in the NNFX algorithm)
6. GKD-M - Metamorphosis module (Metamorphosis, Number 8 in the NNFX algorithm, but not part of the NNFX algorithm)
(additional module types will added in future releases)
Each module interacts with every module by passing data to A backtest module wherein the various components of the GKD system are combined to create a trading signal.
That is, the Baseline indicator passes its data to Volatility/Volume. The Volatility/Volume indicator passes its values to the Confirmation 1 indicator. The Confirmation 1 indicator passes its values to the Confirmation 2 indicator. The Confirmation 2 indicator passes its values to the Continuation indicator. The Continuation indicator passes its values to the Exit indicator, and finally, the Exit indicator passes its values to the Backtest strategy.
This chaining of indicators requires that each module conform to Loxx's GKD protocol, therefore allowing for the testing of every possible combination of technical indicators that make up the six components of the NNFX algorithm.
What does the application of the GKD trading system look like?
Example trading system:
Backtest: Multi-Ticker CC Backtest
Baseline: Hull Moving Average
Volatility/Volume: Hurst Exponent
Confirmation 1: Advance Trend Pressure as shown on the chart above
Confirmation 2: uf2018
Continuation: Coppock Curve
Exit: Rex Oscillator
Metamorphosis: Baseline Optimizer
Each GKD indicator is denoted with a module identifier of either: GKD-BT, GKD-B, GKD-C, GKD-V, GKD-M, or GKD-E. This allows traders to understand to which module each indicator belongs and where each indicator fits into the GKD system.
█ Giga Kaleidoscope Modularized Trading System Signals
Standard Entry
1. GKD-C Confirmation gives signal
2. Baseline agrees
3. Price inside Goldie Locks Zone Minimum
4. Price inside Goldie Locks Zone Maximum
5. Confirmation 2 agrees
6. Volatility/Volume agrees
1-Candle Standard Entry
1a. GKD-C Confirmation gives signal
2a. Baseline agrees
3a. Price inside Goldie Locks Zone Minimum
4a. Price inside Goldie Locks Zone Maximum
Next Candle
1b. Price retraced
2b. Baseline agrees
3b. Confirmation 1 agrees
4b. Confirmation 2 agrees
5b. Volatility/Volume agrees
Baseline Entry
1. GKD-B Baseline gives signal
2. Confirmation 1 agrees
3. Price inside Goldie Locks Zone Minimum
4. Price inside Goldie Locks Zone Maximum
5. Confirmation 2 agrees
6. Volatility/Volume agrees
7. Confirmation 1 signal was less than 'Maximum Allowable PSBC Bars Back' prior
1-Candle Baseline Entry
1a. GKD-B Baseline gives signal
2a. Confirmation 1 agrees
3a. Price inside Goldie Locks Zone Minimum
4a. Price inside Goldie Locks Zone Maximum
5a. Confirmation 1 signal was less than 'Maximum Allowable PSBC Bars Back' prior
Next Candle
1b. Price retraced
2b. Baseline agrees
3b. Confirmation 1 agrees
4b. Confirmation 2 agrees
5b. Volatility/Volume agrees
Volatility/Volume Entry
1. GKD-V Volatility/Volume gives signal
2. Confirmation 1 agrees
3. Price inside Goldie Locks Zone Minimum
4. Price inside Goldie Locks Zone Maximum
5. Confirmation 2 agrees
6. Baseline agrees
7. Confirmation 1 signal was less than 7 candles prior
1-Candle Volatility/Volume Entry
1a. GKD-V Volatility/Volume gives signal
2a. Confirmation 1 agrees
3a. Price inside Goldie Locks Zone Minimum
4a. Price inside Goldie Locks Zone Maximum
5a. Confirmation 1 signal was less than 'Maximum Allowable PSVVC Bars Back' prior
Next Candle
1b. Price retraced
2b. Volatility/Volume agrees
3b. Confirmation 1 agrees
4b. Confirmation 2 agrees
5b. Baseline agrees
Confirmation 2 Entry
1. GKD-C Confirmation 2 gives signal
2. Confirmation 1 agrees
3. Price inside Goldie Locks Zone Minimum
4. Price inside Goldie Locks Zone Maximum
5. Volatility/Volume agrees
6. Baseline agrees
7. Confirmation 1 signal was less than 7 candles prior
1-Candle Confirmation 2 Entry
1a. GKD-C Confirmation 2 gives signal
2a. Confirmation 1 agrees
3a. Price inside Goldie Locks Zone Minimum
4a. Price inside Goldie Locks Zone Maximum
5a. Confirmation 1 signal was less than 'Maximum Allowable PSC2C Bars Back' prior
Next Candle
1b. Price retraced
2b. Confirmation 2 agrees
3b. Confirmation 1 agrees
4b. Volatility/Volume agrees
5b. Baseline agrees
PullBack Entry
1a. GKD-B Baseline gives signal
2a. Confirmation 1 agrees
3a. Price is beyond 1.0x Volatility of Baseline
Next Candle
1b. Price inside Goldie Locks Zone Minimum
2b. Price inside Goldie Locks Zone Maximum
3b. Confirmation 1 agrees
4b. Confirmation 2 agrees
5b. Volatility/Volume agrees
Continuation Entry
1. Standard Entry, 1-Candle Standard Entry, Baseline Entry, 1-Candle Baseline Entry, Volatility/Volume Entry, 1-Candle Volatility/Volume Entry, Confirmation 2 Entry, 1-Candle Confirmation 2 Entry, or Pullback entry triggered previously
2. Baseline hasn't crossed since entry signal trigger
4. Confirmation 1 agrees
5. Baseline agrees
6. Confirmation 2 agrees
