ootaLibrary "oota"
Collection of all custom and enhanced TA indicators - Object oriented methods implementation
method tr(c, useTrueRange)
returns true range of the candle
Namespace types: Candle
Parameters:
c (Candle) : Candle object containing ohlc data
useTrueRange (bool) : Use true range for atr calculation instead of just high/low difference
method ma(maType, length, source)
returns custom moving averages
Namespace types: simple CustomSeries
Parameters:
maType (simple CustomSeries) : Custom series type
length (simple int) : Moving Average Length
source (float) : Moving Average Source
Returns: moving average for the given type and length
method atr(maType, length, useTrueRange, c)
returns ATR with custom moving average
Namespace types: simple CustomSeries
Parameters:
maType (simple CustomSeries) : Custom series type
length (simple int) : Moving Average Length
useTrueRange (bool) : Use true range for atr calculation instead of just high/low difference
c (Candle) : Candle object containing ohlc
Returns: ATR for the given moving average type and length
method atrpercent(maType, length, useTrueRange, c)
returns ATR as percentage of close price
Namespace types: simple CustomSeries
Parameters:
maType (simple CustomSeries) : Custom series type
length (simple int) : Moving Average Length
useTrueRange (bool) : Use true range for atr calculation instead of just high/low difference
c (Candle) : Candle object containing ohlc
Returns: ATR as percentage of close price for the given moving average type and length
method bb(maType, length, multiplier, sticky, c)
returns Bollinger band for custom moving average
Namespace types: simple CustomSeries
Parameters:
maType (simple CustomSeries) : Custom series type
length (simple int) : Moving Average Length
multiplier (float) : Standard Deviation multiplier
sticky (simple bool) : - sticky boundaries which will only change when value is outside boundary.
c (Candle) : Candle object containing ohlc
Returns: Bollinger band with custom moving average for given source, length and multiplier
method bbw(maType, length, multiplier, sticky, c)
returns Bollinger bandwidth for custom moving average
Namespace types: simple CustomSeries
Parameters:
maType (simple CustomSeries) : Custom series type
length (simple int) : Moving Average Length
multiplier (float) : Standard Deviation multiplier
sticky (simple bool) : sticky boundaries which will only change when value is outside boundary.
c (Candle) : Candle object containing ohlc
Returns: Bollinger Bandwidth for custom moving average for given source, length and multiplier
method bpercentb(maType, length, multiplier, sticky, c)
returns Bollinger Percent B for custom moving average
Namespace types: simple CustomSeries
Parameters:
maType (simple CustomSeries) : Custom series type
length (simple int) : Moving Average Length
multiplier (float) : Standard Deviation multiplier
sticky (simple bool) : - sticky boundaries which will only change when value is outside boundary.
c (Candle) : Candle object containing ohlc
Returns: Bollinger Percent B for custom moving average for given source, length and multiplier
method kc(maType, length, multiplier, useTrueRange, sticky, c)
returns Keltner Channel for custom moving average
Namespace types: simple CustomSeries
Parameters:
maType (simple CustomSeries) : Custom series type
length (simple int) : Moving Average Length
multiplier (float) : Standard Deviation multiplier
useTrueRange (simple bool) : - if set to false, uses high-low.
sticky (simple bool) : - sticky boundaries which will only change when value is outside boundary.
c (Candle) : Candle object containing ohlc
Returns: Keltner Channel for custom moving average for given souce, length and multiplier
method kcw(maType, length, multiplier, useTrueRange, sticky, c)
returns Keltner Channel Width with custom moving average
Namespace types: simple CustomSeries
Parameters:
maType (simple CustomSeries) : Custom series type
length (simple int) : Moving Average Length
multiplier (float) : Standard Deviation multiplier
useTrueRange (simple bool) : - if set to false, uses high-low.
sticky (simple bool) : - sticky boundaries which will only change when value is outside boundary.
c (Candle) : Candle object containing ohlc
Returns: Keltner Channel Width for custom moving average
method kpercentk(maType, length, multiplier, useTrueRange, sticky, c)
returns Keltner Channel Percent K Width with custom moving average
Namespace types: simple CustomSeries
Parameters:
maType (simple CustomSeries) : Custom series type
length (simple int) : Moving Average Length
multiplier (float) : Standard Deviation multiplier
useTrueRange (simple bool) : - if set to false, uses high-low.
sticky (simple bool) : - sticky boundaries which will only change when value is outside boundary.
c (Candle) : Candle object containing ohlc
Returns: Keltner Percent K for given moving average, source, length and multiplier
method dc(c, length, sticky)
returns Custom Donchian Channel
Namespace types: Candle
Parameters:
c (Candle) : Candle object containing ohlc
length (simple int) : - donchian channel length
sticky (simple bool) : - sticky boundaries which will only change when value is outside boundary.
Returns: Donchian channel
method dcw(c, length, sticky)
returns Donchian Channel Width
Namespace types: Candle
Parameters:
c (Candle) : Candle object containing ohlc
length (simple int) : - donchian channel length
sticky (simple bool) : - sticky boundaries which will only change when value is outside boundary.
Returns: Donchian channel width
method dpercentd(c, length, sticky)
returns Donchian Channel Percent of price
Namespace types: Candle
Parameters:
c (Candle) : Candle object containing ohlc
length (simple int) : - donchian channel length
sticky (simple bool) : - sticky boundaries which will only change when value is outside boundary.
Returns: Donchian channel Percent D
method supertrend(maType, length, multiplier, useTrueRange, waitForClose, delayed, c)
supertrend Simple supertrend based on atr but also takes into consideration of custom MA Type, sources
Namespace types: simple CustomSeries
Parameters:
maType (simple CustomSeries) : Custom Series
length (simple int) : ATR Length
multiplier (simple float) : ATR Multiplier
useTrueRange (simple bool) : - if set to false, uses high-low.
waitForClose (simple bool) : : Considers source for direction change crossover if checked. Else, uses highSource and lowSource.
delayed (simple bool) : : if set to true lags supertrend atr stop based on target levels.
c (Candle) : Candle object containing ohlc
Returns: dir : Supertrend direction
supertrend : BuyStop if direction is 1 else SellStop
method oscillatorRange(seriesType, source, highlowLength, rangeLength, sticky)
oscillatorRange - returns Custom overbought/oversold areas for an oscillator input
Namespace types: simple CustomSeries
Parameters:
seriesType (simple CustomSeries) : - Custom series type
source (float) : - Osillator source such as RSI, COG etc.
highlowLength (simple int) : - length on which highlow of the oscillator is calculated
rangeLength (simple int) : - length used for calculating oversold/overbought range - usually same as oscillator length
sticky (simple bool) : - overbought, oversold levels won't change unless crossed
Returns: Dynamic overbought and oversold range for oscillator input
method oscillator(oscillatorType, length, shortLength, longLength, c)
oscillator - returns Choice of oscillator with custom overbought/oversold range
Namespace types: simple OscillatorType
Parameters:
oscillatorType (simple OscillatorType) : OscillatorType object
length (simple int) : - Oscillator length - not used for TSI
shortLength (simple int) : - shortLength only used for TSI
longLength (simple int) : - longLength only used for TSI
c (Candle) : Candle object containing ohlc
Returns: Oscillator value
method oscillatorWithRange(oscillatorType, length, shortLength, longLength, seriesType, highlowLength, sticky, c)
oscillatorWithRange - returns Choice of oscillator with custom overbought/oversold range
Namespace types: simple OscillatorType
Parameters:
oscillatorType (simple OscillatorType) : OscillatorType object
length (simple int) : - Oscillator length - not used for TSI
shortLength (simple int) : - shortLength only used for TSI
longLength (simple int) : - longLength only used for TSI
seriesType (simple CustomSeries) : - CustomSeries enum type
highlowLength (simple int) : - length on which highlow of the oscillator is calculated
sticky (simple bool) : - overbought, oversold levels won't change unless crossed
c (Candle) : Candle object containing ohlc
Returns: Oscillator value along with dynamic overbought and oversold range for oscillator input
Candle
Custom candle object
Fields:
o (series float) : open
h (series float) : high
l (series float) : low
c (series float) : close
barindex (series int) : bar_index
bartime (series int) : time
bartimeclose (series int) : time_close
v (series float) : volume
Tìm kiếm tập lệnh với "KELTNER"
taLibrary "ta"
Collection of all custom and enhanced TA indicators
ma(source, maType, length)
returns custom moving averages
Parameters:
source (float) : Moving Average Source
maType (simple string) : Moving Average Type : Can be sma, ema, hma, rma, wma, vwma, swma, highlow, linreg, median
length (simple int) : Moving Average Length
Returns: moving average for the given type and length
atr(maType, length)
returns ATR with custom moving average
Parameters:
maType (simple string) : Moving Average Type : Can be sma, ema, hma, rma, wma, vwma, swma, highlow, linreg, median
length (simple int) : Moving Average Length
Returns: ATR for the given moving average type and length
atrpercent(maType, length)
returns ATR as percentage of close price
Parameters:
maType (simple string) : Moving Average Type : Can be sma, ema, hma, rma, wma, vwma, swma, highlow, linreg, median
length (simple int) : Moving Average Length
Returns: ATR as percentage of close price for the given moving average type and length
bb(source, maType, length, multiplier, sticky)
returns Bollinger band for custom moving average
Parameters:
source (float) : Moving Average Source
maType (simple string) : Moving Average Type : Can be sma, ema, hma, rma, wma, vwma, swma, highlow, linreg, median
length (simple int) : Moving Average Length
multiplier (float) : Standard Deviation multiplier
sticky (simple bool) : - sticky boundaries which will only change when value is outside boundary.
Returns: Bollinger band with custom moving average for given source, length and multiplier
bbw(source, maType, length, multiplier, sticky)
returns Bollinger bandwidth for custom moving average
Parameters:
source (float) : Moving Average Source
maType (simple string) : Moving Average Type : Can be sma, ema, hma, rma, wma, vwma, swma, highlow, linreg, median
length (simple int) : Moving Average Length
multiplier (float) : Standard Deviation multiplier
sticky (simple bool) : - sticky boundaries which will only change when value is outside boundary.
Returns: Bollinger Bandwidth for custom moving average for given source, length and multiplier
bpercentb(source, maType, length, multiplier, sticky)
returns Bollinger Percent B for custom moving average
Parameters:
source (float) : Moving Average Source
maType (simple string) : Moving Average Type : Can be sma, ema, hma, rma, wma, vwma, swma, highlow, linreg, median
length (simple int) : Moving Average Length
multiplier (float) : Standard Deviation multiplier
sticky (simple bool) : - sticky boundaries which will only change when value is outside boundary.
Returns: Bollinger Percent B for custom moving average for given source, length and multiplier
kc(source, maType, length, multiplier, useTrueRange, sticky)
returns Keltner Channel for custom moving average
Parameters:
source (float) : Moving Average Source
maType (simple string) : Moving Average Type : Can be sma, ema, hma, rma, wma, vwma, swma, highlow, linreg, median
length (simple int) : Moving Average Length
multiplier (float) : Standard Deviation multiplier
useTrueRange (simple bool) : - if set to false, uses high-low.
sticky (simple bool) : - sticky boundaries which will only change when value is outside boundary.
Returns: Keltner Channel for custom moving average for given souce, length and multiplier
kcw(source, maType, length, multiplier, useTrueRange, sticky)
returns Keltner Channel Width with custom moving average
Parameters:
source (float) : Moving Average Source
maType (simple string) : Moving Average Type : Can be sma, ema, hma, rma, wma, vwma, swma, highlow, linreg, median
length (simple int) : Moving Average Length
multiplier (float) : Standard Deviation multiplier
useTrueRange (simple bool) : - if set to false, uses high-low.
sticky (simple bool) : - sticky boundaries which will only change when value is outside boundary.
Returns: Keltner Channel Width for custom moving average
kpercentk(source, maType, length, multiplier, useTrueRange, sticky)
returns Keltner Channel Percent K Width with custom moving average
Parameters:
source (float) : Moving Average Source
maType (simple string) : Moving Average Type : Can be sma, ema, hma, rma, wma, vwma, swma, highlow, linreg, median
length (simple int) : Moving Average Length
multiplier (float) : Standard Deviation multiplier
useTrueRange (simple bool) : - if set to false, uses high-low.
sticky (simple bool) : - sticky boundaries which will only change when value is outside boundary.
Returns: Keltner Percent K for given moving average, source, length and multiplier
dc(length, useAlternateSource, alternateSource, sticky)
returns Custom Donchian Channel
Parameters:
length (simple int) : - donchian channel length
useAlternateSource (simple bool) : - Custom source is used only if useAlternateSource is set to true
alternateSource (float) : - Custom source
sticky (simple bool) : - sticky boundaries which will only change when value is outside boundary.
Returns: Donchian channel
dcw(length, useAlternateSource, alternateSource, sticky)
returns Donchian Channel Width
Parameters:
length (simple int) : - donchian channel length
useAlternateSource (simple bool) : - Custom source is used only if useAlternateSource is set to true
alternateSource (float) : - Custom source
sticky (simple bool) : - sticky boundaries which will only change when value is outside boundary.
Returns: Donchian channel width
dpercentd(length, useAlternateSource, alternateSource, sticky)
returns Donchian Channel Percent of price
Parameters:
length (simple int) : - donchian channel length
useAlternateSource (simple bool) : - Custom source is used only if useAlternateSource is set to true
alternateSource (float) : - Custom source
sticky (simple bool) : - sticky boundaries which will only change when value is outside boundary.
Returns: Donchian channel Percent D
oscillatorRange(source, method, highlowLength, rangeLength, sticky)
oscillatorRange - returns Custom overbought/oversold areas for an oscillator input
Parameters:
source (float) : - Osillator source such as RSI, COG etc.
method (simple string) : - Valid values for method are : sma, ema, hma, rma, wma, vwma, swma, highlow, linreg, median
highlowLength (simple int) : - length on which highlow of the oscillator is calculated
rangeLength (simple int) : - length used for calculating oversold/overbought range - usually same as oscillator length
sticky (simple bool) : - overbought, oversold levels won't change unless crossed
Returns: Dynamic overbought and oversold range for oscillator input
oscillator(type, length, shortLength, longLength, source, highSource, lowSource, method, highlowLength, sticky)
oscillator - returns Choice of oscillator with custom overbought/oversold range
Parameters:
type (simple string) : - oscillator type. Valid values : cci, cmo, cog, mfi, roc, rsi, stoch, tsi, wpr
length (simple int) : - Oscillator length - not used for TSI
shortLength (simple int) : - shortLength only used for TSI
longLength (simple int) : - longLength only used for TSI
source (float) : - custom source if required
highSource (float) : - custom high source for stochastic oscillator
lowSource (float) : - custom low source for stochastic oscillator
method (simple string) : - Valid values for method are : sma, ema, hma, rma, wma, vwma, swma, highlow, linreg, median
highlowLength (simple int) : - length on which highlow of the oscillator is calculated
sticky (simple bool) : - overbought, oversold levels won't change unless crossed
Returns: Oscillator value along with dynamic overbought and oversold range for oscillator input

Kelbol Bands @shrilss The Kelbol Bands are designed to provide traders with insights into price volatility and potential trend reversal points. By combining Bollinger Bands (BB) and Keltner Channels (KC), this indicator offers a versatile approach to analyzing market dynamics.
Key Features:
- Customizable Parameters: The indicator allows traders to adjust parameters such as BB Length, BB Multiplier, KC Length, KC Multiplier, and ATR Length to suit their trading preferences and strategies.
- Timeframe Flexibility: Traders can select different timeframes for calculating Bollinger Bands and Keltner Channels independently, enhancing adaptability to various market conditions.
- Visual Representation: The indicator plots Upper, Basis (Midline), and Lower Kelbol Bands, as well as Upper, Basis, and Lower Keltner Channels and Bollinger Bands separately. This visual representation aids traders in identifying potential support and resistance levels, as well as trend direction.
- Toggle Display: Users have the option to toggle the visibility of each component individually, providing flexibility in focusing on specific aspects of price action.
Calculation Method:
- Bollinger Bands (BB) are calculated based on the selected BB Length and BB Multiplier. The upper and lower bands are derived from the simple moving average (SMA) of the price and the standard deviation of the price series.
- Keltner Channels (KC) are determined using the selected KC Length, KC Multiplier, and ATR Length. The basis (midline) of the channel is derived from the SMA of the price, while the upper and lower channels are calculated based on the average true range (ATR).
- Kelbol Bands (KBL) are a combination of Bollinger Bands and Keltner Channels. The upper, basis, and lower bands of KBL are calculated as the averages of the corresponding values of Bollinger Bands and Keltner Channels.

taLibrary "ta"
Collection of all custom and enhanced TA indicators. Same as enhanced_ta. But, removed all the displays to make it faster.
ma(source, maType, length)
returns custom moving averages
Parameters:
source : Moving Average Source
maType : Moving Average Type : Can be sma, ema, hma, rma, wma, vwma, swma, highlow, linreg, median
length : Moving Average Length
Returns: moving average for the given type and length
atr(maType, length)
returns ATR with custom moving average
Parameters:
maType : Moving Average Type : Can be sma, ema, hma, rma, wma, vwma, swma, highlow, linreg, median
length : Moving Average Length
Returns: ATR for the given moving average type and length
atrpercent(maType, length)
returns ATR as percentage of close price
Parameters:
maType : Moving Average Type : Can be sma, ema, hma, rma, wma, vwma, swma, highlow, linreg, median
length : Moving Average Length
Returns: ATR as percentage of close price for the given moving average type and length
bb(source, maType, length, multiplier, sticky)
returns Bollinger band for custom moving average
Parameters:
source : Moving Average Source
maType : Moving Average Type : Can be sma, ema, hma, rma, wma, vwma, swma, highlow, linreg, median
length : Moving Average Length
multiplier : Standard Deviation multiplier
sticky : - sticky boundaries which will only change when value is outside boundary.
Returns: Bollinger band with custom moving average for given source, length and multiplier
bbw(source, maType, length, multiplier, sticky)
returns Bollinger bandwidth for custom moving average
Parameters:
source : Moving Average Source
maType : Moving Average Type : Can be sma, ema, hma, rma, wma, vwma, swma, highlow, linreg, median
length : Moving Average Length
multiplier : Standard Deviation multiplier
sticky : - sticky boundaries which will only change when value is outside boundary.
Returns: Bollinger Bandwidth for custom moving average for given source, length and multiplier
bpercentb(source, maType, length, multiplier, sticky)
returns Bollinger Percent B for custom moving average
Parameters:
source : Moving Average Source
maType : Moving Average Type : Can be sma, ema, hma, rma, wma, vwma, swma, highlow, linreg, median
length : Moving Average Length
multiplier : Standard Deviation multiplier
sticky : - sticky boundaries which will only change when value is outside boundary.
Returns: Bollinger Percent B for custom moving average for given source, length and multiplier
kc(source, maType, length, multiplier, useTrueRange, sticky)
returns Keltner Channel for custom moving average
Parameters:
source : Moving Average Source
maType : Moving Average Type : Can be sma, ema, hma, rma, wma, vwma, swma, highlow, linreg, median
length : Moving Average Length
multiplier : Standard Deviation multiplier
useTrueRange : - if set to false, uses high-low.
sticky : - sticky boundaries which will only change when value is outside boundary.
Returns: Keltner Channel for custom moving average for given souce, length and multiplier
kcw(source, maType, length, multiplier, useTrueRange, sticky)
returns Keltner Channel Width with custom moving average
Parameters:
source : Moving Average Source
maType : Moving Average Type : Can be sma, ema, hma, rma, wma, vwma, swma, highlow, linreg, median
length : Moving Average Length
multiplier : Standard Deviation multiplier
useTrueRange : - if set to false, uses high-low.
sticky : - sticky boundaries which will only change when value is outside boundary.
Returns: Keltner Channel Width for custom moving average
kpercentk(source, maType, length, multiplier, useTrueRange, sticky)
returns Keltner Channel Percent K Width with custom moving average
Parameters:
source : Moving Average Source
maType : Moving Average Type : Can be sma, ema, hma, rma, wma, vwma, swma, highlow, linreg, median
length : Moving Average Length
multiplier : Standard Deviation multiplier
useTrueRange : - if set to false, uses high-low.
sticky : - sticky boundaries which will only change when value is outside boundary.
Returns: Keltner Percent K for given moving average, source, length and multiplier
dc(length, useAlternateSource, alternateSource, sticky)
returns Custom Donchian Channel
Parameters:
length : - donchian channel length
useAlternateSource : - Custom source is used only if useAlternateSource is set to true
alternateSource : - Custom source
sticky : - sticky boundaries which will only change when value is outside boundary.
Returns: Donchian channel
dcw(length, useAlternateSource, alternateSource, sticky)
returns Donchian Channel Width
Parameters:
length : - donchian channel length
useAlternateSource : - Custom source is used only if useAlternateSource is set to true
alternateSource : - Custom source
sticky : - sticky boundaries which will only change when value is outside boundary.
Returns: Donchian channel width
dpercentd(useAlternateSource, alternateSource, length, sticky)
returns Donchian Channel Percent of price
Parameters:
useAlternateSource : - Custom source is used only if useAlternateSource is set to true
alternateSource : - Custom source
length : - donchian channel length
sticky : - sticky boundaries which will only change when value is outside boundary.
Returns: Donchian channel Percent D
oscillatorRange(source, method, highlowLength, rangeLength, sticky)
oscillatorRange - returns Custom overbought/oversold areas for an oscillator input
Parameters:
source : - Osillator source such as RSI, COG etc.
method : - Valid values for method are : sma, ema, hma, rma, wma, vwma, swma, highlow, linreg, median
highlowLength : - length on which highlow of the oscillator is calculated
rangeLength : - length used for calculating oversold/overbought range - usually same as oscillator length
sticky : - overbought, oversold levels won't change unless crossed
Returns: Dynamic overbought and oversold range for oscillator input
oscillator(type, length, shortLength, longLength, source, highSource, lowSource, method, highlowLength, sticky)
oscillator - returns Choice of oscillator with custom overbought/oversold range
Parameters:
type : - oscillator type. Valid values : cci, cmo, cog, mfi, roc, rsi, stoch, tsi, wpr
length : - Oscillator length - not used for TSI
shortLength : - shortLength only used for TSI
longLength : - longLength only used for TSI
source : - custom source if required
highSource : - custom high source for stochastic oscillator
lowSource : - custom low source for stochastic oscillator
method : - Valid values for method are : sma, ema, hma, rma, wma, vwma, swma, highlow, linreg, median
highlowLength : - length on which highlow of the oscillator is calculated
sticky : - overbought, oversold levels won't change unless crossed
Returns: Oscillator value along with dynamic overbought and oversold range for oscillator input
multibands(bandType, source, maType, length, useTrueRange, sticky, numberOfBands, multiplierStart, multiplierStep)
multibands - returns Choice of oscillator with custom overbought/oversold range
Parameters:
bandType : - Band type - can be either bb or kc
source : - custom source if required
maType : Moving Average Type : Can be sma, ema, hma, rma, wma, vwma, swma, highlow, linreg, median
length : - Oscillator length - not used for TSI
useTrueRange : - if set to false, uses high-low.
sticky : - for sticky borders which only change upon source crossover/crossunder
numberOfBands : - Number of bands to generate
multiplierStart : - Starting ATR or Standard deviation multiplier for first band
multiplierStep : - Incremental value for multiplier for each band
Returns: array of band values sorted in ascending order
mbandoscillator(bandType, source, maType, length, useTrueRange, stickyBands, numberOfBands, multiplierStart, multiplierStep)
mbandoscillator - Multiband oscillator created on the basis of bands
Parameters:
bandType : - Band type - can be either bb or kc
source : - custom source if required
maType : Moving Average Type : Can be sma, ema, hma, rma, wma, vwma, swma, highlow, linreg, median
length : - Oscillator length - not used for TSI
useTrueRange : - if set to false, uses high-low.
stickyBands : - for sticky borders which only change upon source crossover/crossunder for band detection
numberOfBands : - Number of bands to generate
multiplierStart : - Starting ATR or Standard deviation multiplier for first band
multiplierStep : - Incremental value for multiplier for each band
Returns: oscillator currentStates - Array containing states for last n bars

enhanced_taLibrary "enhanced_ta"
Collection of all custom and enhanced TA indicators
ma(source, maType, length) returns custom moving averages
Parameters:
source : Moving Average Source
maType : Moving Average Type : Can be sma, ema, hma, rma, wma, vwma, swma, highlow
length : Moving Average Length
Returns: moving average for the given type and length
bb(source, maType, length, multiplier) returns Bollinger band for custom moving average
Parameters:
source : Moving Average Source
maType : Moving Average Type : Can be sma, ema, hma, rma, wma, vwma, swma, highlow
length : Moving Average Length
multiplier : Standard Deviation multiplier
Returns: Bollinger band with custom moving average for given source, length and multiplier
bbw(source, maType, length, multiplier) returns Bollinger bandwidth for custom moving average
Parameters:
source : Moving Average Source
maType : Moving Average Type : Can be sma, ema, hma, rma, wma, vwma, swma, highlow
length : Moving Average Length
multiplier : Standard Deviation multiplier
Returns: Bollinger Bandwidth for custom moving average for given source, length and multiplier
bpercentb(source, maType, length, multiplier) returns Bollinger Percent B for custom moving average
Parameters:
source : Moving Average Source
maType : Moving Average Type : Can be sma, ema, hma, rma, wma, vwma, swma, highlow
length : Moving Average Length
multiplier : Standard Deviation multiplier
Returns: Bollinger Percent B for custom moving average for given source, length and multiplier
kc(source, maType, length, multiplier) returns Keltner Channel for custom moving average
Parameters:
source : Moving Average Source
maType : Moving Average Type : Can be sma, ema, hma, rma, wma, vwma, swma, highlow
length : Moving Average Length
multiplier : Standard Deviation multiplier
Returns: Keltner Channel for custom moving average for given souce, length and multiplier
kcw(source, maType, length, multiplier) returns Keltner Channel Width with custom moving average
Parameters:
source : Moving Average Source
maType : Moving Average Type : Can be sma, ema, hma, rma, wma, vwma, swma, highlow
length : Moving Average Length
multiplier : Standard Deviation multiplier
Returns: Keltner Channel Width for custom moving average
kpercentk(source, maType, length, multiplier) returns Keltner Channel Percent K Width with custom moving average
Parameters:
source : Moving Average Source
maType : Moving Average Type : Can be sma, ema, hma, rma, wma, vwma, swma, highlow
length : Moving Average Length
multiplier : Standard Deviation multiplier
Returns: Keltner Percent K for given moving average, source, length and multiplier
dc(source, useCustomSource, length) returns Custom Donchian Channel
Parameters:
source : - Custom source
useCustomSource : - Custom source is used only if useCustomSource is set to true
length : - donchian channel length
Returns: Donchian channel
oscillatorRange(source, method, highlowLength, rangeLength) returns Custom overbought/oversold areas for an oscillator input
Parameters:
source : - Osillator source such as RSI, COG etc.
method : - Valid values for method are : sma, ema, hma, rma, wma, vwma, swma, highlow
highlowLength : - length on which highlow of the oscillator is calculated
rangeLength : - length used for calculating oversold/overbought range - usually same as oscillator length
Returns: Dynamic overbought and oversold range for oscillator input

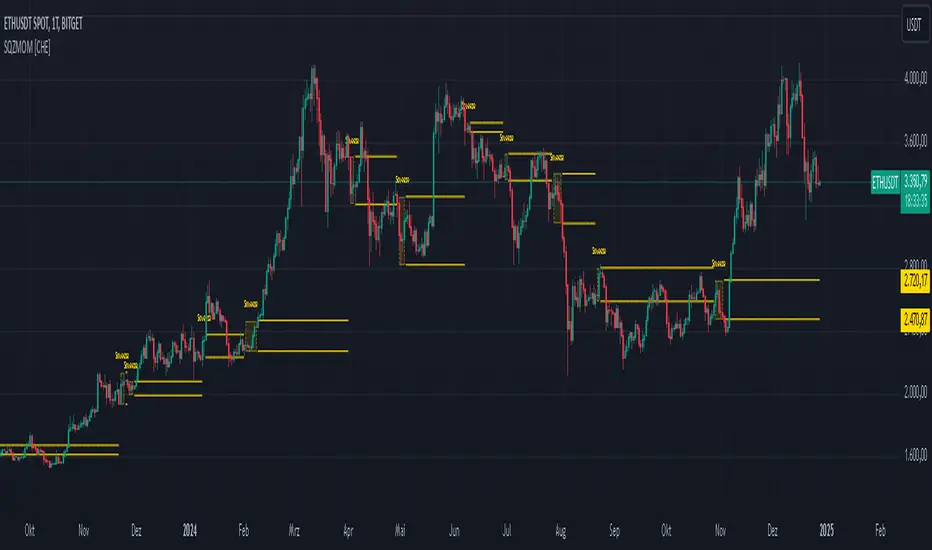
Squeeze Momentum Indicator [CHE] Squeeze Momentum Indicator
The Squeeze Momentum Indicator is an improved and simplified version of the classic Squeeze Momentum Indicator by LazyBear. It focuses on precise detection of squeeze phases without relying on Keltner Channels (KC) or complex momentum calculations. Instead, it emphasizes the dynamic analysis of Bollinger Band widths and their distance changes to provide clear and intuitive signals.
What is the Squeeze Momentum Indicator ?
This indicator helps you identify periods of low volatility (squeeze phases) when the market is often poised for significant moves. With its clear visualization and innovative methods, it enables traders to spot breakout opportunities early and trade strategically.
Differences from the Original LazyBear Indicator
1. Use of Bollinger Bands (BB):
- LazyBear Indicator combines Bollinger Bands with Keltner Channels. A squeeze is detected when the Bollinger Bands fall inside the Keltner Channels.
- CHE Indicator relies solely on Bollinger Bands and an additional analysis of their width (distance between the upper and lower bands). This makes the calculation more straightforward and reduces dependency on multiple indicator families.
2. Squeeze Detection:
- LazyBear: A squeeze is defined based on the relationship between Bollinger Bands and Keltner Channels. It has three states: “Squeeze On,” “Squeeze Off,” and “No Squeeze.”
- CHE: A squeeze is detected when the width of the Bollinger Bands falls below the lower "Distance Bollinger Bands." It only has two states: Squeeze Active and No Squeeze.
3. Momentum Calculation:
- LazyBear: Uses linear regression (LinReg) to calculate momentum and displays it as color-coded histograms.
- CHE: Does not include momentum calculations. The focus is entirely on volatility visualization and squeeze detection.
4. Visualization:
- LazyBear: Displays momentum histograms and horizontal lines to signal different states.
- CHE: Visualizes the width of the Bollinger Bands and their Distance Bollinger Bands as lines on the chart. The chart background turns green when a squeeze is detected, simplifying interpretation.
What Is Plotted?
1. Bollinger Band Width:
- A line representing the distance between the upper and lower Bollinger Bands, measuring market volatility.
2. Distance Bollinger Bands:
- Two additional lines (upper and lower Distance Bollinger Bands) based on the Bollinger Band width, defining thresholds for squeeze conditions.
3. Session-Specific Box:
- A dynamic box is drawn on the chart during a squeeze phase. The box marks the high and low of the market for the squeeze duration. It visually frames the range, helping traders monitor breakouts beyond these levels.
4. Max/Min Markers:
- The indicator dynamically updates and marks the maximum and minimum price levels during a squeeze. These levels can serve as breakout thresholds or critical reference points for price action.
5. Background Color:
- The chart background turns green when a squeeze is active (Bollinger Band width falls below the lower Distance Bollinger Bands). This highlights potential breakout conditions.
How to Use the CHE Indicator
1. Add the Indicator:
- Add the indicator to your chart and customize settings such as Bollinger Band length (`sqz_length`) and multiplier (`sqz_multiplier`) to fit your strategy.
2. Identify Squeeze Conditions:
- Watch for the green background, which signals a squeeze—indicating a period of low volatility where significant market moves often follow.
3. Monitor the Box and Max/Min Levels:
- During a squeeze, the box outlines the trading range, and the maximum and minimum levels are updated in real time. Use these as breakout triggers or support/resistance zones.
4. Session-Specific Analysis:
- The indicator can highlight squeezes during specific trading sessions (e.g., market open), allowing you to focus on key time frames.
5. Additional Confirmation:
- Combine the CHE Indicator with price action analysis or momentum tools to determine the direction of potential breakouts.
Why Use the Squeeze Momentum Indicator ?
- Simplicity: Clear visualization and reduced complexity by eliminating Keltner Channels and momentum calculations.
- Flexibility: Suitable for all markets—stocks, forex, crypto, and more.
- Enhanced Visualization: The box and max/min markers provide real-time visual cues for range-bound trading and breakout strategies.
- Efficiency: Focuses on what matters most—identifying volatility and squeeze phases.
With the Squeeze Momentum Indicator , you can take your trading strategy to the next level. Thanks to its clear design, dynamic range visualization, and innovative methods, you’ll recognize breakout opportunities earlier and trade with greater precision. Try it out and experience its user-friendliness and effectiveness for yourself!
Uptrick: MultiTrend Squeeze System**Uptrick: MultiTrend Squeeze System Indicator: The Ultimate Trading Tool for Precision and Versatility 📈🔥**
### Introduction
The MultiTrend Squeeze System is a powerful, multi-faceted trading indicator designed to provide traders with precise buy and sell signals by combining the strengths of multiple technical analysis tools. This script isn't just an indicator; it's a comprehensive trading system that merges the power of SuperTrend, RSI, Volume Filtering, and Squeeze Momentum to give you an unparalleled edge in the market. Whether you're a day trader looking for short-term opportunities or a swing trader aiming to catch longer-term trends, this indicator is tailored to meet your needs.
### Key Features and Unique Aspects
1. **SuperTrend with Dynamic Adjustments 📊**
- **Adaptive SuperTrend Calculation:** The SuperTrend is a popular trend-following indicator that adjusts dynamically based on market conditions. It uses the Average True Range (ATR) to calculate upper and lower bands, which shift according to market volatility. This script takes it further by combining it with the RSI and Volume filtering to provide more accurate signals.
- **Direction Sensitivity:** The SuperTrend here is not static. It adjusts based on the direction of the previous SuperTrend value, ensuring that the indicator remains relevant even in choppy markets.
2. **RSI Integration for Overbought/Oversold Conditions 💹**
- **RSI Calculation:** The Relative Strength Index (RSI) is incorporated to identify overbought and oversold conditions, adding an extra layer of precision. This helps in filtering out false signals and ensuring that trades are taken only in optimal conditions.
- **Customizable RSI Settings:** The RSI settings are fully customizable, allowing traders to adjust the RSI length and the overbought/oversold levels according to their trading style and market.
3. **Volume Filtering for Enhanced Signal Confirmation 📉**
- **Volume Multiplier:** This unique feature integrates volume analysis, ensuring that signals are only generated when there is sufficient market participation. The Volume Multiplier can be adjusted to filter out weak signals that occur during low-volume periods.
- **Optional Volume Filtering:** Traders have the flexibility to turn the volume filter on or off, depending on their preference or market conditions. This makes the indicator versatile, allowing it to be used across different asset classes and market conditions.
4. **Squeeze Momentum Indicator (SMI) for Market Pressure Analysis 💥**
- **Squeeze Detection:** The Squeeze Momentum Indicator detects periods of market compression and expansion. This script goes beyond the traditional Bollinger Bands and Keltner Channels by incorporating true range calculations, offering a more nuanced view of market momentum.
- **Customizable Squeeze Settings:** The lengths and multipliers for both Bollinger Bands and Keltner Channels are customizable, giving traders the flexibility to fine-tune the indicator based on their specific needs.
5. **Visual and Aesthetic Customization 🎨**
- **Color-Coding for Clarity:** The indicator is color-coded to make it easy to interpret signals. Bullish trends are marked with a vibrant green color, while bearish trends are highlighted in red. Neutral or unconfirmed signals are displayed in softer tones to reduce noise.
- **Histogram Visualization:** The primary trend direction and strength are displayed as a histogram, making it easy to visualize the market's momentum at a glance. The height and color of the bars provide immediate feedback on the strength and direction of the trend.
6. **Alerts for Real-Time Trading 🚨**
- **Custom Alerts:** The script is equipped with custom alerts that notify traders when a buy or sell signal is generated. These alerts can be configured to send notifications through various channels, including email, SMS, or directly to the trading platform.
- **Immediate Reaction:** The alerts are triggered based on the confluence of SuperTrend, RSI, and Volume signals, ensuring that traders are notified only when the most robust trading opportunities arise.
7. **Comprehensive Input Customization ⚙️**
- **SuperTrend Settings:** Adjust the ATR length and factor to control the sensitivity of the SuperTrend. This allows you to adapt the indicator to different market conditions, whether you're trading a volatile cryptocurrency or a more stable stock.
- **RSI Settings:** Customize the RSI length and thresholds for overbought and oversold conditions, enabling you to tailor the indicator to your specific trading strategy.
- **Volume Settings:** The Volume Multiplier and the option to toggle the volume filter provide an additional layer of customization, allowing you to fine-tune the indicator based on market liquidity and participation.
- **Squeeze Momentum Settings:** The lengths and multipliers for Bollinger Bands and Keltner Channels can be adjusted to detect different levels of market compression, providing flexibility for both short-term and long-term traders.
### How It Works: A Deep Dive Into the Mechanics 🛠️
1. **SuperTrend Calculation:**
- The SuperTrend is calculated using the ATR, which measures market volatility. The indicator creates upper and lower bands around the price, adjusting these bands based on the current level of market volatility. The direction of the trend is determined by the position of the price relative to these bands.
- The script enhances the standard SuperTrend by ensuring that the bands do not flip-flop too quickly, reducing the chances of false signals in a choppy market. The direction is confirmed by checking the position of the close relative to the previous band, making the trend detection more reliable.
2. **RSI Integration:**
- The RSI is calculated over a customizable length and compared to user-defined overbought and oversold levels. When the RSI crosses below the oversold level, and the SuperTrend indicates a bullish trend, a buy signal is generated. Conversely, when the RSI crosses above the overbought level, and the SuperTrend indicates a bearish trend, a sell signal is triggered.
- The combination of RSI with SuperTrend ensures that trades are only taken when there is a strong confluence of signals, reducing the chances of entering trades during weak or indecisive market phases.
3. **Volume Filtering:**
- The script calculates the average volume over a 20-period simple moving average. The volume filter ensures that buy and sell signals are only valid when the current volume exceeds a multiple of this average, which can be adjusted by the user. This feature helps filter out weak signals that might occur during low-volume periods, such as just before a major news event or during after-hours trading.
- The volume filter is particularly useful in markets where volume spikes are common, as it ensures that signals are only generated when there is significant market interest in the direction of the trend.
4. **Squeeze Momentum:**
- The Squeeze Momentum Indicator (SMI) adds a layer of market pressure analysis. The script calculates Bollinger Bands and Keltner Channels, detecting when the market is in a "squeeze" — a period of low volatility that typically precedes a significant price move.
- When the Bollinger Bands are inside the Keltner Channels, the market is in a squeeze (compression phase). This is often a precursor to a breakout or breakdown. The script colors the histogram bars black during this phase, indicating a potential for a strong move. Once the squeeze is released, the bars are colored according to the direction of the SuperTrend, signaling a potential entry point.
5. **Integration and Signal Generation:**
- The script brings together the SuperTrend, RSI, Volume, and Squeeze Momentum to generate highly accurate buy and sell signals. A buy signal is triggered when the SuperTrend is bullish, the RSI indicates oversold conditions, and the volume filter confirms strong market participation. Similarly, a sell signal is generated when the SuperTrend is bearish, the RSI indicates overbought conditions, and the volume filter is met.
- The combination of these elements ensures that the signals are robust, reducing the likelihood of entering trades during weak or indecisive market conditions.
### Practical Applications: How to Use the MultiTrend Squeeze System 📅
1. **Day Trading:**
- For day traders, this indicator provides quick and reliable signals that can be used to enter and exit trades multiple times within a day. The volume filter ensures that you are trading during the most liquid times of the day, increasing the chances of successful trades. The Squeeze Momentum aspect helps you catch breakouts or breakdowns, which are common in intraday trading.
2. **Swing Trading:**
- Swing traders can use the MultiTrend Squeeze System to identify longer-term trends. By adjusting the ATR length and factor, you can make the SuperTrend more sensitive to catch longer-term moves. The RSI and Squeeze Momentum aspects help you time your entries and exits, ensuring that you get in early on a trend and exit before it reverses.
3. **Scalping:**
- For scalpers, the quick signals provided by this system, especially in combination with the volume filter, make it easier to take small profits repeatedly. The histogram bars give you a clear visual cue of the market's momentum, making it easier to scalp effectively.
4. **Position Trading:**
- Even position traders can benefit from this indicator by using it to confirm long-term trends. By adjusting the settings to less sensitive parameters, you can ensure that you are only entering trades when a strong trend is confirmed. The Squeeze Momentum indicator will help you stay in the trade during periods of consolidation, waiting for the next big move.
### Conclusion: Why the MultiTrend Squeeze System is a Game-Changer 🚀
The MultiTrend Squeeze System is not just another trading indicator; it’s a comprehensive trading strategy encapsulated within a single script. By combining the power
of SuperTrend, RSI, Volume Filtering, and Squeeze Momentum, this indicator provides a robust and versatile tool that can be adapted to various trading styles and market conditions.
**Why is it Unique?**
- **Multi-Dimensional Analysis:** Unlike many other indicators that rely on a single data point or calculation, this script incorporates multiple layers of analysis, ensuring that signals are based on a confluence of factors, which increases their reliability.
- **Customizability:** The vast range of input settings allows traders to tailor the indicator to their specific needs, whether they are trading forex, stocks, cryptocurrencies, or commodities.
- **Visual Clarity:** The color-coded bars, labels, and signals make it easy to interpret the market conditions at a glance, reducing the time needed to make trading decisions.
Whether you are a novice trader or an experienced market participant, the MultiTrend Squeeze System offers a powerful toolset to enhance your trading strategy, reduce risk, and maximize your potential returns. With its combination of trend analysis, momentum detection, and volume filtering, this indicator is designed to help you trade with confidence and precision in any market condition.

MACDh with divergences & impulse system (overlayed on prices)-----------------------------------------------------------------
General Description:
This indicator ( the one on the top panel above ) consists on some lines, arrows and labels drawn over the price bars/candles indicating the detection of regular divergences between price and the classic MACD histogram (shown on the low panel). This script is special because it can be adjusted to fit several criteria when trading divergences filtering them according to the "height" and "width" of the patterns. The script also includes the "extra features" Impulse System and Keltner Channels, which you will hardly find anywhere else in similar classic MACD histogram divergence indicators.
The indicator helps to find trend reversals, and it works on any market, any instrument, any timeframe, and any market condition (except against really strong trends that do not show any other sign of reversion yet).
Please take on consideration that divergences should be taken with caution.
-----------------------------------------------------------------
Definition of classic Bullish and Bearish divergences:
* Bearish divergences occur in uptrends identifying market tops. A classical or regular bearish divergence occurs when prices reach a new high and then pull back, with an oscillator (MACD histogram in this case) dropping below its zero line. Prices stabilize and rally to a higher high, but the oscillator reaches a lower peak than it did on a previous rally.
In the chart above (weekly charts of NKE, Nike, Inc.), in area X (around August 2021), NKE rallied to a new bull market high and MACD-Histogram rallied with it, rising above its previous peak and showing that bulls were extremely strong. In area Y, MACD-H fell below its centerline and at the same time prices punched below the zone between the two moving averages. In area Z, NKE rallied to a new bull market high, but the rally of MACD-H was feeble, reflecting the bulls’ weakness. Its downtick from peak Z completed a bearish divergence, giving a strong sell signal and auguring a nasty bear market.
* Bullish divergences , in the other hand, occur towards the ends of downtrends identifying market bottoms. A classical (also called regular) bullish divergence occurs when prices and an oscillator (MACD histogram in this case) both fall to a new low, rally, with the oscillator rising above its zero line, then both fall again. This time, prices drop to a lower low, but the oscillator traces a higher bottom than during its previous decline.
In the example in the chart above (weekly charts of NKE, Nike, Inc.), you see a bearish divergence that signaled the October 2022 bear market bottom, giving a strong buy signal right near the lows. In area A, NKE (weekly charts) appeared in a free fall. The record low A of MACD-H indicated that bears were extremely strong. In area B, MACD-H rallied above its centerline. Notice the brief rally of prices at that moment. In area C, NKE slid to a new bear market low, but MACD-H traced a much more shallow low. Its uptick completed a bullish divergence, giving a strong buy signal.
-----------------------------------------------------------------
Some cool features included in this indicator:
1. This indicator also includes the “ Impulse System ”. The Impulse System is based on two indicators, a 13-day exponential moving average and the MACD-Histogram, and identifies inflection points where a trend speeds up or slows down. The moving average identifies the trend, while the MACD-Histogram measures momentum. This unique indicator combination is color coded into the price bars for easy reference.
Calculation:
Green Price Bar: (13-period EMA > previous 13-period EMA) and
(MACD-Histogram > previous period's MACD-Histogram)
Red Price Bar: (13-period EMA < previous 13-period EMA) and
(MACD-Histogram < previous period's MACD-Histogram)
Price bars are colored blue when conditions for a Red Price Bar or Green Price Bar are not met. The MACD-Histogram is based on MACD(12,26,9).
The Impulse System works more like a censorship system. Green price bars show that the bulls are in control of both trend and momentum as both the 13-day EMA and MACD-Histogram are rising (you don't have permission to sell). A red price bar indicates that the bears have taken control because the 13-day EMA and MACD Histogram are falling (you don't have permission to buy). A blue price bar indicates mixed technical signals, with neither buying nor selling pressure predominating (either both buying or selling are permitted).
2. Another "extra feature" included here is the " Keltner Channels ". Keltner Channels are volatility-based envelopes set above and below an exponential moving average.
3. It were also included a couple of EMAs.
Everything can be removed from the chart any time.
-----------------------------------------------------------------
Options/adjustments for this indicator:
*Horizontal Distance (width) between two tops/bottoms criteria.
Refers to the horizontal distance between the MACH histogram peaks involved in the divergence
*Height of tops/bottoms criteria (for Histogram).
Refers to the difference/relation/vertical distance between the MACH HISTOGRAM peaks involved in the divergence: 1st Histogram Peak is X times the 2nd.
*Height/Vertical deviation of tops/bottoms criteria (for Price).
Deviation refers to the difference/relation/vertical distance between the PRICE peaks involved in the divergence.
*Plot Regular Bullish Divergences?.
*Plot Regular Bearish Divergences?.
*Delete Previous Cancelled Divergences?.
*Shows a pair of EMAs.
*Shows Keltner Channels (using ATR)
Keltner Channels are volatility-based envelopes set above and below an exponential moving average.
*This indicator also has the option to show the Impulse System over the price bars/candles.

BB_Keltner Firing Squeeze by RMThis script shows the Squeeze firing event, after the Bollinger Bands have been inside Keltner Channels, indicating possible short term trend of price action.
Based on Bollinger Bands & Keltner Channels scripts in the Pine scripts library.
Bollinger Bands are a type of statistical chart characterizing the prices and volatility over time of a financial instrument or commodity, using a formulaic method propounded by John Bollinger in the 1980s.
Keltner channel is a technical analysis indicator showing a central moving average line plus channel lines at a distance above and below. The indicator is named after Chester W. Keltner (1909–1998)
Squeeze is an event in the price action of a given market instrument that happens when Bollinger Bands are inside the Keltner Channels, thus indicating build up of volatility. The Firing event is the first candle not in a squeeze after the squeeze event, that releases the price action on a given direction with a given impulse that makes is last several candles. Markets are volatile and can change directions due to several reasons not accounted in this method. Use at you own discretion and evaluate your risk before proceeding.

ABS NR — Fail-Safe Confirm (v4.2.2)
# ABS NR — Fail-Safe Confirm (v4.2.2)
## What it is (quick take)
**ABS NR FS** is a **non-repainting “arm → confirm” entry framework** for intraday and swing execution. It blends:
* **Regime** (EMA stack + 60-min slope),
* **Location** (Keltner basis/edges),
* **Stretch** (session-anchored **VWAP Z-score**),
* **Momentum gating** (TSI cross/slope),
* **Guards** (session window, minimum ATR%, gap filter, optional market alignment).
You’ll see a **small dot** when a setup is **armed** (candidate) and a **triangle** when that setup **confirms** within a user-defined number of bars. A **gray “X”** marks a timeout (candidate canceled).
> Tip: This entry tool works best when paired with a trend context filter and a dedicated exit tool.
---
## How to use it (operational workflow)
1. **Read the regime**
* **Bull trend**: fast > slow > long EMA **and** 60-min slope up.
* **Bear trend**: fast < slow < long EMA **and** 60-min slope down.
* **Range**: neither bull nor bear.
2. **Wait for a candidate (dot)**
Two families:
* **Reclaim (trend-following):** price crosses the **KC basis** with acceptable |Z| (not overstretched) and passes the TSI gate.
* **Fade (range-revert):** price **pokes a KC band**, prints a **reversal wick**, |Z| is stretched, and TSI gate agrees.
3. **Trade the confirmation (triangle)**
The confirm must occur **within N bars** and follow your chosen **Confirm mode** logic (see Inputs). If confirmation doesn’t arrive in time, an **X** cancels the candidate.
4. **Use guards to avoid junk**
Session windows (US focus), minimum ATR%, gap guard, and optional **market alignment** (e.g., SPY above EMA20 for longs).
5. **Manage the position**
* Entries: take **triangles** in the direction of your playbook (reclaims with trend; fades in clean ranges).
* Filters and exits: use your own process or pair with a trend/exit companion.
---
## Visual semantics & alerts
* **Candidate L / S (dot)** → a setup armed on this bar.
* **CONFIRM L / S (triangle)** → actionable signal that met confirm rules within your time window.
* **Cancel L / S (X)** → candidate expired without confirmation; ignore the dot.
**Alerts (stable names for automation):**
* **ABS FS — Confirmed** → fires on confirmed long or short.
* **ABS FS — Candidate Armed** → fires as a candidate arms.
---
## Non-repainting behavior (why signals don’t repaint)
* All HTF requests use **lookahead\_off**.
* With **Strict NR = true**, the 60-min slope uses the **prior completed** 60-min bar and arming/confirming only occurs on confirmed bars.
* Confirmation triangles finalize on bar close.
* If you disable strictness, signals may appear slightly earlier but with more intrabar sensitivity.
---
## Inputs reference (what each control does and the trade-offs)
### A) Behavior / Modes
**Mode** (`Turbo / Aggressive / Balanced / Conservative`)
Changes multiple internal thresholds:
* **Turbo** → most signals; relaxes prior-bar break & VWAP-side checks and time/vol/gap guards. Highest frequency, highest noise.
* **Aggressive** → more signals than Balanced, fewer than Turbo.
* **Balanced** → default; steady trade-off of frequency vs. quality.
* **Conservative** → tightens |Z| and other checks; fewest but cleanest signals.
**Strict NR (bar close + prior HTF 60m)**
* **true** = safer: uses prior 60-min slope; arms/confirms on confirmed bars → **fewer/cleaner** signals.
* **false** = earlier and more reactive; slightly noisier.
---
### B) Keltner Channel (location engine)
* **KC EMA Length (`kcLen`)**
Higher → smoother basis (fewer basis crosses). Lower → snappier basis (more crosses).
* **ATR Length (`atrLen`)**
Higher → steadier band width; Lower → more reactive band width.
* **KC ATR Mult (`kcMult`)**
Higher → wider bands (fewer edge pokes → fewer fades). Lower → narrower (more fades).
---
### C) Trend & HTF slope
* **Trend EMA Fast/Slow/Long (`emaFastLen / emaSlowLen / emaLongLen`)**
Larger = slower regime flips (fewer reclaims); smaller = faster flips (more reclaims).
* **HTF EMA Len (60m) (`htfLen`)**
Larger = steadier HTF slope (fewer signals); smaller = more sensitive (more signals).
---
### D) VWAP Z-Score (stretch / mean-revert logic)
* **VWAP Z-Length (`zLen`)**
Window for Z over session-anchored VWAP distance. Larger = smoother |Z| (fewer fades/re-entries). Smaller = more reactive (more).
* **Range Fade |Z| (base) (`zFadeBase`)**
Minimum |Z| to allow **fades** in ranges. Raise to demand more stretch (fewer fades). Lower to take more fades.
* **Max |Z| Trend Re-entry (base) (`maxZTrendBase`)**
Caps how stretched price can be and still permit **reclaims** with trend. Lower = stricter (avoid chases). Higher = will chase further.
---
### E) TSI Momentum Gate
* **TSI Long/Short/Signal (`tsiLong / tsiShort / tsiSig`)**
Larger = smoother/laggier momentum; smaller = snappier.
* **TSI gate (`CrossOnly / CrossOrSlope / Off`)**
* **CrossOnly**: require TSI cross of its signal (strict).
* **CrossOrSlope**: cross *or* favorable slope (balanced default).
* **Off**: no momentum gate (most signals, most noise).
---
### F) Guards (filters to avoid low-quality tape)
* **US focus 09:35–10:30 & 14:00–15:45 (base) (`useTimeBase`)**
`true` limits to high-quality windows. `false` trades all session.
* **Skip N bars after 09:30 ET (`skipFirst`)**
Skips the open scramble. Larger = skip longer.
* **Min volatility ATR% (base)** = `useVolMinBase` + `atrPctMinBase`
Requires `ATR(10)/Close*100 ≥ atrPctMinBase`. Raise threshold to avoid dead tape; lower to accept quieter sessions.
* **Gap guard (base)** = `gapGuardBase` + `gapMul`
Blocks signals when the opening gap exceeds `gapMul * ATR`. Increase `gapMul` to allow more gapped opens; decrease to be stricter.
---
### G) Visuals & Sides
* **Plot Keltner (`plotKC`)** → show/hide basis & bands.
* **Show Longs / Show Shorts** → enable/disable each side.
---
### H) Fail-Safe Confirmation
* **Confirm mode (`BreakHighOnly / BreakHigh+Hold / TwoBarImpulse`)**
* **BreakHighOnly**: confirm by taking out the armed bar’s extreme. Fastest, most frequent.
* **BreakHigh+Hold**: must **break**, have **body ≥ X·ATR**, **and** hold above/below the basis → higher quality, fewer signals.
* **TwoBarImpulse**: decisive follow-through vs. prior bar with **body ≥ X·ATR** → momentum-biased confirmations.
* **Confirm within N bars (`confirmBars`)**
Confirmation window size. Smaller = faster validation; larger = more patience (can be later).
* **Impulse body ≥ X·ATR (`impulseBodyATR`)**
Raise for stronger confirmations (fewer weak triangles). Lower to accept lighter pushes.
* **Require market alignment (`needMarket`) + `marketTicker`**
When enabled: Longs require **market > EMA20 (5m)**; Shorts require **market < EMA20 (5m)**.
* **Diagnostics: Show debug letters (`debug`)**
Tiny “B/C” audit marks for base/confirm while tuning.
---
## Tuning recipes (quick, practical)
* **If you’re getting chopped:**
* Set **Mode = Conservative**
* **Confirm mode = BreakHigh+Hold**
* Raise **impulseBodyATR** (e.g., 0.45)
* Keep **needMarket = true**
* Keep **Strict NR = true**
* **If you need more signals:**
* **Mode = Aggressive** (or Turbo if you accept more noise)
* **Confirm mode = BreakHighOnly**
* Lower **impulseBodyATR** (0.25–0.30)
* Increase **confirmBars** to 3
* **Range-day focus (fades):**
* Keep session guard on
* Raise **zFadeBase** to demand real stretch
* Keep **maxZTrendBase** moderate (don’t chase)
* **Trend-day focus (reclaims):**
* Slightly **lower `maxZTrendBase`** (avoid chasing excessive stretch)
* Use **CrossOrSlope** TSI gating
* Consider turning **needMarket** on
---
## Best practices & notes
* **Instrument specificity:** Tune Z, TSI, and guards per symbol and timeframe.
* **Session awareness:** Session filter uses **exchange-local** time; adjust for non-US markets.
* **Automation:** Use the two provided alert names; they’re stable.
* **Risk management:** Confirmation improves quality but doesn’t remove risk. Always pre-define stop/size logic.
---
## Suggested starting point (balanced profile)
* **Mode = balanced**
* **Strict NR = true**
* **Confirm mode = BreakHigh+Hold**
* **confirmBars = 2**
* **impulseBodyATR ≈ 0.35**
* **needMarket = off** (turn on for extra confluence)
* Leave Keltner/TSI defaults; then nudge `zFadeBase` and `maxZTrendBase` to match your symbol.
---
*This tool is a signal generator, not a broker or strategy. Validate on your markets/timeframes and integrate with your risk plan.*

Squeeze Pro Momentum BAR color - KLTDescription:
The Squeeze Pro Momentum indicator is a powerful tool designed to detect volatility compression ("squeeze" zones) and visualize momentum shifts using a refined color-based system. This script blends the well-known concepts of Bollinger Bands and Keltner Channels with an optimized momentum engine that uses dynamic color gradients to reflect trend strength, direction, and volatility.
It’s built for traders who want early warning of potential breakouts and clearer insight into underlying market momentum.
🔍 How It Works:
📉 Squeeze Detection:
This indicator identifies "squeeze" conditions by comparing Bollinger Bands and Keltner Channels:
When Bollinger Bands are inside Keltner Channels → Squeeze is ON
When Bollinger Bands expand outside Keltner Channels → Squeeze is OFF
You’ll see squeeze zones classified as:
Wide
Normal
Narrow
Each represents varying levels of compression and breakout potential.
⚡ Momentum Engine:
Momentum is calculated using linear regression of the price's deviation from a dynamic average of highs, lows, and closes. This gives a more accurate representation of directional pressure in the market.
🧠 Smart Candle Coloring (Optimized):
The momentum color logic is inspired by machine learning principles (no hardcoded thresholds):
EMA smoothing and rate of change (ROC) are used to detect momentum acceleration.
ATR-based filters help remove noise and false signals.
Colors are dynamically assigned based on both direction and trend strength.
🧪 How to Use It:
Look for Squeeze Conditions — especially narrow squeezes, which tend to precede high-momentum breakouts.
Confirm with Momentum Color — strong colors often indicate trend continuation; fading colors may signal exhaustion.
Combine with Price Action — use this tool with support/resistance or patterns for higher probability setups.
Recommended For:
Trend Traders
Breakout Traders
Volatility Strategy Users
Anyone who wants visual clarity on trend strength
📌 Tip: This indicator works great when layered with volume and price action patterns. It is fully non-repainting and supports overlay on price charts.

TTM Squeeze Value OscillatorThis indicator is specifically designed for use with TradingView's Stock Screener, not for chart analysis. It provides numerical values and binary signals that allow traders to efficiently scan stocks for specific TTM Squeeze conditions, momentum patterns, and EMA alignments.
What It Does
The TTM Squeeze Value Oscillator converts the popular TTM Squeeze indicator into a screenable format by outputting specific numerical values and binary signals (1 or 0) that can be filtered in TradingView's screener tool.
Key Features
1. TTM Squeeze Compression Levels
Value 0: Low Compression (Black) - Bollinger Bands inside outer Keltner Channels
Value 1: Mid Compression (Red) - Bollinger Bands inside middle Keltner Channels
Value 2: High Compression (Orange) - Bollinger Bands inside inner Keltner Channels
Value 3: Squeeze Fired (Green) - Bollinger Bands outside Keltner Channels
2. Momentum Analysis
Four distinct momentum conditions based on TTM Squeeze methodology:
Buy Momentum Increasing - Positive momentum growing stronger
Buy Momentum Decreasing - Positive momentum weakening
Sell Momentum Increasing - Negative momentum growing stronger
Sell Momentum Decreasing - Negative momentum weakening
3. EMA Stacking Analysis
Three EMA alignment patterns using 8, 21, and 48 period EMAs:
EMA Stacked Bullish - 8 EMA > 21 EMA > 48 EMA (uptrend alignment)
EMA Stacked Bearish - 8 EMA < 21 EMA < 48 EMA (downtrend alignment)
EMA Mixed - EMAs not in clear bullish or bearish alignment
4. Consecutive Day Counters
Tracks how many consecutive days each squeeze condition has persisted:
Low Compression Days
Mid Compression Days
High Compression Days
Squeeze Fired Days
5. Combined Signal Analysis
Pre-calculated combinations of squeeze conditions with momentum:
All squeeze levels combined with all four momentum conditions
16 total combined signals for advanced screening

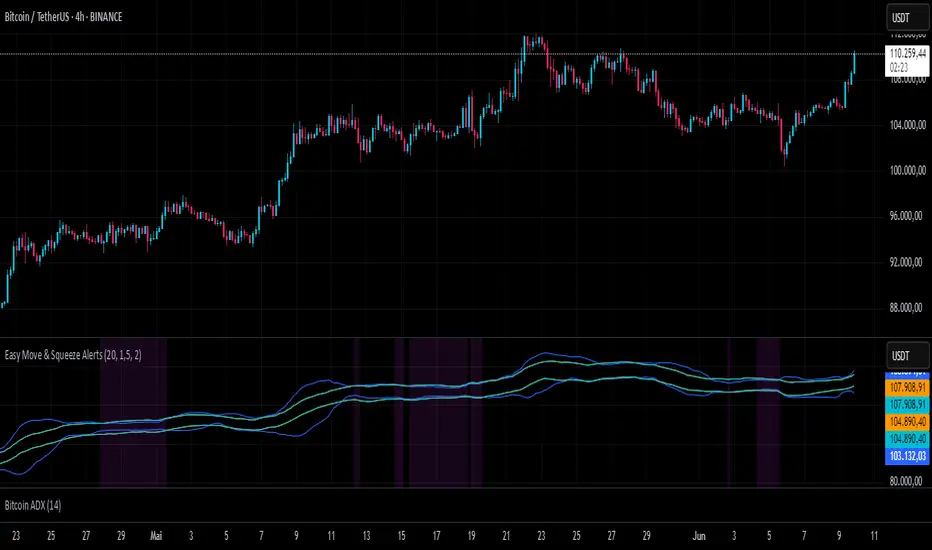
Easy Move & Squeeze Alerts1. Overview
The Easy Move & Squeeze Alerts indicator combines two proven techniques to help you anticipate major price swings and spot volatility compressions (long/short squeezes) early on. It offers:
Automated Alerts via TradingView’s alert engine
On-chart Visual Cues for immediate context
Flexible Inputs to fine-tune sensitivity, lookback length, and display options
2. TTM Squeeze (Volatility Compression)
Core Concept: Compares Bollinger Bands (standard deviation channels) with Keltner Channels (ATR-based channels).
Squeeze On: BBs lie completely inside Keltner Channels → volatility is compressed, signaling a potential buildup.
Squeeze Off: BBs break outside Keltner Channels → typically the start of a strong directional move.
Alert: When the squeeze releases, the indicator fires an alert:
💥 Squeeze Release – Volatility incoming!
Chart Label: A small, purple “🔒 Squeeze” label appears above the high of each bar while compression persists, giving you a real-time visual flag.
3. ATR Breakouts (Detecting Large Moves)
Core Concept: Builds a dynamic price channel around an EMA using ATR (Average True Range) multiplied by your chosen factor.
Cross Events:
Price crosses above the upper ATR band → potential bullish breakout.
Price crosses below the lower ATR band → potential bearish breakdown.
Alert Conditions: Separate alert triggers for “🚀 Move Up” and “📉 Move Down” fire the moment the close breaches the ATR-based bounds.
4. Visualization & Usage
Channel Plots:
Bollinger Bands in blue
Keltner Channels in orange
ATR Channels in aqua (optional)
Toggle all channel plots on or off with the showZones input.
Background Highlight: During a squeeze, the chart background lightly tints purple for quick visual confirmation.
Alerts Setup:
Simply click Create Alert in TradingView, select this indicator, and choose the event(s) you want (squeeze release, ATR breakouts).
You can route notifications via email, webhook, SMS, or platform pop-ups.
5. Deployment & Customization
Timeframes: Effective across all timeframes; most popular for day- and swing-trading.
Parameter Tuning:
Increase the len value to smooth channels and focus on only the most significant compressions/moves.
Adjust the ATR or BB multipliers to make alerts more or less sensitive.
With this indicator, you gain a clear, actionable framework for spotting both volatility squeezes and breakouts before they unfold—empowering you to enter trades ahead of the crowd. Enjoy customizing and putting it to work!
Multiple (12) Strong Buy/Sell Signals + Momentum
Indicator Manual: "Multiple (12) Strong Buy/Sell Signals + Momentum"
This indicator is designed to identify strong buy and sell signals based on 12 configurable conditions, which include a variety of technical analysis methods such as trend-following indicators, pattern recognition, volume analysis, and momentum oscillators. It allows for customizable alerts and visual cues on the chart. The indicator helps traders spot potential entry and exit points by displaying buy and sell signals based on the selected conditions.
Key Observations:
• The script integrates multiple indicators and pattern recognition methods to provide comprehensive buy/sell signals.
• Trend-based indicators like EMAs and MACD are combined with pattern recognition (flags, triangles) and momentum-based signals (RSI, ADX, and volume analysis).
• User customization is a core feature, allowing adjustments to the conditions and thresholds for more tailored signals.
• The script is designed to be responsive to market conditions, with multiple conditions filtering out noise to generate reliable signals.
________________________________________
Key Features:
1. 12 Combined Buy/Sell Signal Conditions: This indicator incorporates a diverse set of conditions based on trend analysis, momentum, and price patterns.
2. Minimum Conditions Input: You can adjust the threshold of conditions that need to be met for the buy/sell signals to appear.
3. Alert Customization: Set alert thresholds for both buy and sell signals.
4. Dynamic Visualization: Buy and sell signals are shown as triangles on the chart, with momentum signals highlighted as circles.
________________________________________
Detailed Description of the 12 Conditions:
1. Exponential Moving Averages (EMA):
o Conditions: The indicator uses EMAs with periods 3, 8, and 13 for quick trend-following signals.
o Bullish Signal: EMA3 > EMA8 > EMA13 (Bullish stack).
o Bearish Signal: EMA3 < EMA8 < EMA13 (Bearish stack).
o Reversal Signal: The crossing over or under of these EMAs can signify trend reversals.
2. MACD (Moving Average Convergence Divergence):
o Fast MACD (2, 7, 3) is used to confirm trends quickly.
o Bullish Signal: When the MACD line crosses above the signal line.
o Bearish Signal: When the MACD line crosses below the signal line.
3. Donchian Channel:
o Tracks the highest high and lowest low over a given period (default 20).
o Breakout Signal: Price breaking above the upper band is bullish; breaking below the lower band is bearish.
4. VWAP (Volume-Weighted Average Price):
o Above VWAP: Bullish condition (price above VWAP).
o Below VWAP: Bearish condition (price below VWAP).
5. EMA Stacking & Reversal:
o Tracks the order of EMAs (3, 8, 13) to confirm strong trends and reversals.
o Bullish Reversal: EMA3 < EMA8 < EMA13 followed by a crossing to bullish.
o Bearish Reversal: EMA3 > EMA8 > EMA13 followed by a crossing to bearish.
6. Bull/Bear Flags:
o Bull Flag: Characterized by a strong price movement (flagpole) followed by a pullback and breakout.
o Bear Flag: Similar to Bull Flag but in the opposite direction.
7. Triangle Patterns (Ascending and Descending):
o Detects ascending and descending triangles using pivot highs and lows.
o Ascending Triangle: Higher lows and flat resistance.
o Descending Triangle: Lower highs and flat support.
8. Volume Sensitivity:
o Identifies price moves with significant volume increases.
o High Volume: When current volume is significantly above the moving average volume (set to 1.2x of the average).
9. Momentum Indicators:
o RSI (Relative Strength Index): Confirms overbought and oversold levels with thresholds set at 65 (overbought) and 35 (oversold).
o ADX (Average Directional Index): Confirms strong trends when ADX > 28.
o Momentum Up: Momentum is upward with strong volume and bullish RSI/ADX conditions.
o Momentum Down: Momentum is downward with strong volume and bearish RSI/ADX conditions.
10. Bollinger & Keltner Squeeze:
o Squeeze Condition: A contraction in both Bollinger Bands and Keltner Channels indicates low volatility, signaling a potential breakout.
o Squeeze Breakout: Price breaking above or below the squeeze bands.
11. 3 Consecutive Candles Condition:
o Bullish: Price rises for three consecutive candles with higher highs and lows.
o Bearish: Price falls for three consecutive candles with lower highs and lows.
12. Williams %R and Stochastic RSI:
o Williams %R: A momentum oscillator with signals when the line crosses certain levels.
o Stochastic RSI: Provides overbought/oversold levels with smoother signals.
o Combined Signals: You can choose whether to require both WPR and StochRSI to signal a buy/sell.
________________________________________
User Inputs (Inputs Tab):
1. Minimum Conditions for Buy/Sell:
o min_conditions: Number of conditions required to trigger a buy/sell signal on the chart (1 to 12).
o Alert_min_conditions: User-defined alert threshold (how many conditions must be met before an alert is triggered).
2. Donchian Channel Settings:
o Show Donchian: Toggle visibility of the Donchian channel.
o Donchian Length: The length of the Donchian Channel (default 20).
3. Bull/Bear Flag Settings:
o Bull Flag Flagpole Strength: ATR multiplier to define the strength of the flagpole.
o Bull Flag Pullback Length: Length of pullback for the bull flag pattern.
o Bull Flag EMA Length: EMA length used to confirm trend during bull flag pattern.
Similar settings exist for Bear Flag patterns.
4. Momentum Indicators:
o RSI Length: Period for calculating the RSI (default 9).
o RSI Overbought: Overbought threshold for the RSI (default 65).
o RSI Oversold: Oversold threshold for the RSI (default 35).
5. Bollinger/Keltner Squeeze Settings:
o Squeeze Width Threshold: The maximum width of the Bollinger and Keltner Bands for squeeze conditions.
6. Stochastic RSI Settings:
o Stochastic RSI Length: The period for calculating the Stochastic RSI.
7. WPR Settings:
o WPR Length: Period for calculating Williams %R (default 14).
________________________________________
User Inputs (Style Tab):
1. Signal Plotting:
o Control the display and colors of the buy/sell signals, momentum indicators, and pattern signals on the chart.
o Buy/Sell Signals: Can be customized with different colors and shapes (triangle up for buys, triangle down for sells).
o Momentum Signals: Custom circle placement for momentum-up or momentum-down signals.
2. Donchian Channel:
o Show Donchian: Toggle visibility of the Donchian upper, lower, and middle bands.
o Band Colors: Choose the color for each band (upper, lower, middle).
________________________________________
How to Use the Indicator:
1. Adjust Minimum Conditions: Set the minimum number of conditions that must be met for a signal to appear. For example, set it to 5 if you want only stronger signals.
2. Set Alert Threshold: Define the number of conditions needed to trigger an alert. This can be different from the minimum conditions for visual signals.
3. Customize Appearance: Modify the colors and styles of the signals to match your preferences.
________________________________________
Conclusion:
This comprehensive trading indicator uses a combination of trend-following, pattern recognition, and momentum-based conditions to help you spot potential buy and sell opportunities. By adjusting the input settings, you can fine-tune it to match your specific trading strategy, making it a versatile tool for different market conditions.
Signal Reliability Based on Condition Count
The reliability of the buy/sell signals increases as more conditions are met. Here's a breakdown of the probabilities:
1. 1-3 Conditions Met: Lower Probability
o Signals that meet only 1-3 conditions tend to have lower reliability and are considered less probable. These signals may represent false positives or weaker market movements, and traders should approach them with caution.
2. 4 Conditions Met: More Reliable Signal
o When 4 conditions are met, the signal becomes more reliable. This indicates that multiple indicators or market patterns are aligning, increasing the likelihood of a valid buy/sell opportunity. While not foolproof, it's a stronger indication that the market may be moving in a particular direction.
3. 5-6 Conditions Met: Strong Signal
o A signal meeting 5-6 conditions is considered a strong signal. This indicates a well-confirmed move, with several technical indicators and market factors aligning to suggest a higher probability of success. These are the signals that traders often prioritize.
4. 7+ Conditions Met: Rare and High-Confidence Signal
o Signals that meet 7 or more conditions are rare and should be considered high-confidence signals. These represent a significant alignment of multiple factors, and while they are less frequent, they are highly reliable when they do occur. Traders can be more confident in acting on these signals, but they should still monitor market conditions for confirmation.
________________________________________
You can adjust the number of conditions as needed, but this breakdown should give a clear structure on how the signal strength correlates with the number of conditions met!

Adaptive Bollinger BandsAdaptive Bollinger Bands
This indicator displays Bollinger Bands with parameters that dynamically adjust based on market volatility. Unlike standard Bollinger Bands with fixed parameters, this version adaptively modifies both the period and standard deviation multiplier in real-time based on measured market conditions.
Key Features
Dynamic adjustment of period and standard deviation based on normalized volatility
Color-coded visualization of current volatility regime (expanding, normal, contracting)
Integration with Keltner Channels for band refinement
Bandwidth analysis for volatility regime identification
Optional on-chart parameter labels showing current settings
Band cross alerts and visual markers
Volatility Visualization
The indicator uses color-coding to display different volatility regimes:
Red: Expanding volatility regime (higher measured volatility)
Blue: Normal volatility regime (average measurements)
Green: Contracting volatility regime (lower measured volatility)
Technical Information
The indicator calculates volatility by analyzing price returns over a configurable lookback period (default 50 bars). The standard deviation of returns is normalized against historical extremes to create an adaptive scaling factor.
Band adaptation occurs through two primary mechanisms:
1. Period adjustment: Higher volatility uses shorter periods (more responsive), while lower volatility uses longer periods (more stable)
2. Standard deviation multiplier adjustment: Higher volatility increases the multiplier (wider bands), while lower volatility decreases it (tighter bands)
The middle band uses a simple moving average with the adaptive period. Additional refinement occurs through Keltner Channel integration, which can tighten bands when contained within Keltner boundaries.
Volatility regimes are determined by analyzing Bollinger Bandwidth relative to its recent history, providing contextual information about the current market state.
Settings Customization
The indicator provides extensive customization options:
- Base parameters (period and standard deviation)
- Adaptive range limits (min/max period and standard deviation)
- Keltner Channel parameters for band refinement
- Bandwidth analysis settings
- Display options for visual elements
Limitations and Considerations
All technical indicators have inherent limitations and should not be used in isolation
Past performance does not guarantee future results
The indicator requires sufficient historical data for proper volatility normalization
Smaller timeframes may produce more noise in the adaptive calculations
Parameters may require adjustment for different markets and trading styles
Band crosses are not trading signals on their own and should be evaluated with other factors
This indicator is designed to provide objective information about market volatility conditions and potential support/resistance zones. Always combine with other analysis methods within a comprehensive trading approach.
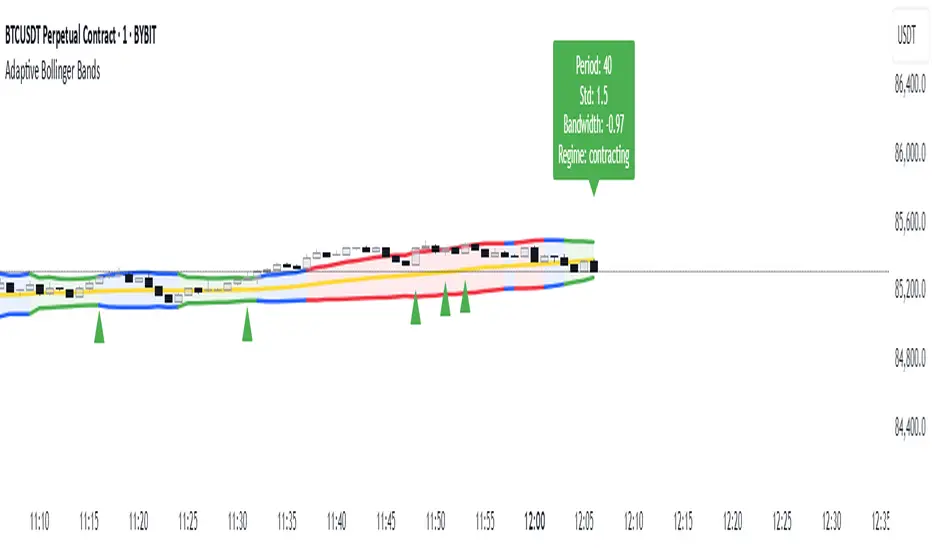
[COG] Adaptive Squeeze Intensity 📊 Adaptive Squeeze Intensity (ASI) Indicator
🎯 Overview
The Adaptive Squeeze Intensity (ASI) indicator is an advanced technical analysis tool that combines the power of volatility compression analysis with momentum, volume, and trend confirmation to identify high-probability trading opportunities. It quantifies the degree of price compression using a sophisticated scoring system and provides clear entry signals for both long and short positions.
⭐ Key Features
- 📈 Comprehensive squeeze intensity scoring system (0-100)
- 📏 Multiple Keltner Channel compression zones
- 📊 Volume analysis integration
- 🎯 EMA-based trend confirmation
- 🎨 Proximity-based entry validation
- 📱 Visual status monitoring
- 🎨 Customizable color schemes
- ⚡ Clear entry signals with directional indicators
🔧 Components
1. 📐 Squeeze Intensity Score (0-100)
The indicator calculates a total squeeze intensity score based on four components:
- 📊 Band Convergence (0-40 points): Measures the relationship between Bollinger Bands and Keltner Channels
- 📍 Price Position (0-20 points): Evaluates price location relative to the base channels
- 📈 Volume Intensity (0-20 points): Analyzes volume patterns and thresholds
- ⚡ Momentum (0-20 points): Assesses price momentum and direction
2. 🎨 Compression Zones
Visual representation of squeeze intensity levels:
- 🔴 Extreme Squeeze (80-100): Red zone
- 🟠 Strong Squeeze (60-80): Orange zone
- 🟡 Moderate Squeeze (40-60): Yellow zone
- 🟢 Light Squeeze (20-40): Green zone
- ⚪ No Squeeze (0-20): Base zone
3. 🎯 Entry Signals
The indicator generates entry signals based on:
- ✨ Squeeze release confirmation
- ➡️ Momentum direction
- 📊 Candlestick pattern confirmation
- 📈 Optional EMA trend alignment
- 🎯 Customizable EMA proximity validation
⚙️ Settings
🔧 Main Settings
- Base Length: Determines the calculation period for main indicators
- BB Multiplier: Sets the Bollinger Bands deviation multiplier
- Keltner Channel Multipliers: Three separate multipliers for different compression zones
📈 Trend Confirmation
- Four customizable EMA periods (default: 21, 34, 55, 89)
- Optional trend requirement for entry signals
- Adjustable EMA proximity threshold
📊 Volume Analysis
- Customizable volume MA length
- Adjustable volume threshold for signal confirmation
- Option to enable/disable volume analysis
🎨 Visualization
- Customizable bullish/bearish colors
- Optional intensity zones display
- Status monitor with real-time score and state information
- Clear entry arrows and background highlights
💻 Technical Code Breakdown
1. Core Calculations
// Base calculations for EMAs
ema_1 = ta.ema(close, ema_length_1)
ema_2 = ta.ema(close, ema_length_2)
ema_3 = ta.ema(close, ema_length_3)
ema_4 = ta.ema(close, ema_length_4)
// Proximity calculation for entry validation
ema_prox_raw = math.abs(close - ema_1) / ema_1 * 100
is_close_to_ema_long = close > ema_1 and ema_prox_raw <= prox_percent
```
### 2. Squeeze Detection System
```pine
// Bollinger Bands setup
BB_basis = ta.sma(close, length)
BB_dev = ta.stdev(close, length)
BB_upper = BB_basis + BB_mult * BB_dev
BB_lower = BB_basis - BB_mult * BB_dev
// Keltner Channels setup
KC_basis = ta.sma(close, length)
KC_range = ta.sma(ta.tr, length)
KC_upper_high = KC_basis + KC_range * KC_mult_high
KC_lower_high = KC_basis - KC_range * KC_mult_high
```
### 3. Scoring System Implementation
```pine
// Band Convergence Score
band_ratio = BB_width / KC_width
convergence_score = math.max(0, 40 * (1 - band_ratio))
// Price Position Score
price_range = math.abs(close - KC_basis) / (KC_upper_low - KC_lower_low)
position_score = 20 * (1 - price_range)
// Final Score Calculation
squeeze_score = convergence_score + position_score + vol_score + mom_score
```
### 4. Signal Generation
```pine
// Entry Signal Logic
long_signal = squeeze_release and
is_momentum_positive and
(not use_ema_trend or (bullish_trend and is_close_to_ema_long)) and
is_bullish_candle
short_signal = squeeze_release and
is_momentum_negative and
(not use_ema_trend or (bearish_trend and is_close_to_ema_short)) and
is_bearish_candle
```
📈 Trading Signals
🚀 Long Entry Conditions
- Squeeze release detected
- Positive momentum
- Bullish candlestick
- Price above relevant EMAs (if enabled)
- Within EMA proximity threshold (if enabled)
- Sufficient volume confirmation (if enabled)
🔻 Short Entry Conditions
- Squeeze release detected
- Negative momentum
- Bearish candlestick
- Price below relevant EMAs (if enabled)
- Within EMA proximity threshold (if enabled)
- Sufficient volume confirmation (if enabled)
⚠️ Alert Conditions
- 🔔 Extreme squeeze level reached (score crosses above 80)
- 🚀 Long squeeze release signal
- 🔻 Short squeeze release signal
💡 Tips for Usage
1. 📱 Use the status monitor to track real-time squeeze intensity and state
2. 🎨 Pay attention to the color gradient for trend direction and strength
3. ⏰ Consider using multiple timeframes for confirmation
4. ⚙️ Adjust EMA and proximity settings based on your trading style
5. 📊 Use volume analysis for additional confirmation in liquid markets
📝 Notes
- 🔧 The indicator combines multiple technical analysis concepts for robust signal generation
- 📈 Suitable for all tradable markets and timeframes
- ⭐ Best results typically achieved in trending markets with clear volatility cycles
- 🎯 Consider using in conjunction with other technical analysis tools for confirmation
⚠️ Disclaimer
This technical indicator is designed to assist in analysis but should not be considered as financial advice. Always perform your own analysis and risk management when trading.

True Amplitude Envelopes (TAE)The True Envelopes indicator is an adaptation of the True Amplitude Envelope (TAE) method, based on the research paper " Improved Estimation of the Amplitude Envelope of Time Domain Signals Using True Envelope Cepstral Smoothing " by Caetano and Rodet. This indicator aims to create an asymmetric price envelope with strong predictive power, closely following the methodology outlined in the paper.
Due to the inherent limitations of Pine Script, the indicator utilizes a Kernel Density Estimator (KDE) in place of the original Cepstral Smoothing technique described in the paper. While this approach was chosen out of necessity rather than superiority, the resulting method is designed to be as effective as possible within the constraints of the Pine environment.
This indicator is ideal for traders seeking an advanced tool to analyze price dynamics, offering insights into potential price movements while working within the practical constraints of Pine Script. Whether used in dynamic mode or with a static setting, the True Envelopes indicator helps in identifying key support and resistance levels, making it a valuable asset in any trading strategy.
Key Features:
Dynamic Mode: The indicator dynamically estimates the fundamental frequency of the price, optimizing the envelope generation process in real-time to capture critical price movements.
High-Pass Filtering: Uses a high-pass filtered signal to identify and smoothly interpolate price peaks, ensuring that the envelope accurately reflects significant price changes.
Kernel Density Estimation: Although implemented as a workaround, the KDE technique allows for flexible and adaptive smoothing of the envelope, aimed at achieving results comparable to the more sophisticated methods described in the original research.
Symmetric and Asymmetric Envelopes: Provides options to select between symmetric and asymmetric envelopes, accommodating various trading strategies and market conditions.
Smoothness Control: Features adjustable smoothness settings, enabling users to balance between responsiveness and the overall smoothness of the envelopes.
The True Envelopes indicator comes with a variety of input settings that allow traders to customize the behavior of the envelopes to match their specific trading needs and market conditions. Understanding each of these settings is crucial for optimizing the indicator's performance.
Main Settings
Source: This is the data series on which the indicator is applied, typically the closing price (close). You can select other price data like open, high, low, or a custom series to base the envelope calculations.
History: This setting determines how much historical data the indicator should consider when calculating the envelopes. A value of 0 will make the indicator process all available data, while a higher value restricts it to the most recent n bars. This can be useful for reducing the computational load or focusing the analysis on recent market behavior.
Iterations: This parameter controls the number of iterations used in the envelope generation algorithm. More iterations will typically result in a smoother envelope, but can also increase computation time. The optimal number of iterations depends on the desired balance between smoothness and responsiveness.
Kernel Style: The smoothing kernel used in the Kernel Density Estimator (KDE). Available options include Sinc, Gaussian, Epanechnikov, Logistic, and Triangular. Each kernel has different properties, affecting how the smoothing is applied. For example, Gaussian provides a smooth, bell-shaped curve, while Epanechnikov is more efficient computationally with a parabolic shape.
Envelope Style: This setting determines whether the envelope should be Static or Dynamic. The Static mode applies a fixed period for the envelope, while the Dynamic mode automatically adjusts the period based on the fundamental frequency of the price data. Dynamic mode is typically more responsive to changing market conditions.
High Q: This option controls the quality factor (Q) of the high-pass filter. Enabling this will increase the Q factor, leading to a sharper cutoff and more precise isolation of high-frequency components, which can help in better identifying significant price peaks.
Symmetric: This setting allows you to choose between symmetric and asymmetric envelopes. Symmetric envelopes maintain an equal distance from the central price line on both sides, while asymmetric envelopes can adjust differently above and below the price line, which might better capture market conditions where upside and downside volatility are not equal.
Smooth Envelopes: When enabled, this setting applies additional smoothing to the envelopes. While this can reduce noise and make the envelopes more visually appealing, it may also decrease their responsiveness to sudden market changes.
Dynamic Settings
Extra Detrend: This setting toggles an additional high-pass filter that can be applied when using a long filter period. The purpose is to further detrend the data, ensuring that the envelope focuses solely on the most recent price oscillations.
Filter Period Multiplier: This multiplier adjusts the period of the high-pass filter dynamically based on the detected fundamental frequency. Increasing this multiplier will lengthen the period, making the filter less sensitive to short-term price fluctuations.
Filter Period (Min) and Filter Period (Max): These settings define the minimum and maximum bounds for the high-pass filter period. They ensure that the filter period stays within a reasonable range, preventing it from becoming too short (and overly sensitive) or too long (and too sluggish).
Envelope Period Multiplier: Similar to the filter period multiplier, this adjusts the period for the envelope generation. It scales the period dynamically to match the detected price cycles, allowing for more precise envelope adjustments.
Envelope Period (Min) and Envelope Period (Max): These settings establish the minimum and maximum bounds for the envelope period, ensuring the envelopes remain adaptive without becoming too reactive or too slow.
Static Settings
Filter Period: In static mode, this setting determines the fixed period for the high-pass filter. A shorter period will make the filter more responsive to price changes, while a longer period will smooth out more of the price data.
Envelope Period: This setting specifies the fixed period used for generating the envelopes in static mode. It directly influences how tightly or loosely the envelopes follow the price action.
TAE Smoothing: This controls the degree of smoothing applied during the TAE process in static mode. Higher smoothing values result in more gradual envelope curves, which can be useful in reducing noise but may also delay the envelope’s response to rapid price movements.
Visual Settings
Top Band Color: This setting allows you to choose the color for the upper band of the envelope. This band represents the resistance level in the price action.
Bottom Band Color: Similar to the top band color, this setting controls the color of the lower band, which represents the support level.
Center Line Color: This is the color of the central price line, often referred to as the carrier. It represents the detrended price around which the envelopes are constructed.
Line Width: This determines the thickness of the plotted lines for the top band, bottom band, and center line. Thicker lines can make the envelopes more visible, especially when overlaid on price data.
Fill Alpha: This controls the transparency level of the shaded area between the top and bottom bands. A lower alpha value will make the fill more transparent, while a higher value will make it more opaque, helping to highlight the envelope more clearly.
The envelopes generated by the True Envelopes indicator are designed to provide a more precise and responsive representation of price action compared to traditional methods like Bollinger Bands or Keltner Channels. The core idea behind this indicator is to create a price envelope that smoothly interpolates the significant peaks in price action, offering a more accurate depiction of support and resistance levels.
One of the critical aspects of this approach is the use of a high-pass filtered signal to identify these peaks. The high-pass filter serves as an effective method of detrending the price data, isolating the rapid fluctuations in price that are often lost in standard trend-following indicators. By filtering out the lower frequency components (i.e., the trend), the high-pass filter reveals the underlying oscillations in the price, which correspond to significant peaks and troughs. These oscillations are crucial for accurately constructing the envelope, as they represent the most responsive elements of the price movement.
The algorithm works by first applying the high-pass filter to the source price data, effectively detrending the series and isolating the high-frequency price changes. This filtered signal is then used to estimate the fundamental frequency of the price movement, which is essential for dynamically adjusting the envelope to current market conditions. By focusing on the peaks identified in the high-pass filtered signal, the algorithm generates an envelope that is both smooth and adaptive, closely following the most significant price changes without overfitting to transient noise.
Compared to traditional envelopes and bands, such as Bollinger Bands and Keltner Channels, the True Envelopes indicator offers several advantages. Bollinger Bands, which are based on standard deviations, and Keltner Channels, which use the average true range (ATR), both tend to react to price volatility but do not necessarily follow the peaks and troughs of the price with precision. As a result, these traditional methods can sometimes lag behind or fail to capture sudden shifts in price momentum, leading to either false signals or missed opportunities.
In contrast, the True Envelopes indicator, by using a high-pass filtered signal and a dynamic period estimation, adapts more quickly to changes in price behavior. The envelopes generated by this method are less prone to the lag that often affects standard deviation or ATR-based bands, and they provide a more accurate representation of the price's immediate oscillations. This can result in better predictive power and more reliable identification of support and resistance levels, making the True Envelopes indicator a valuable tool for traders looking for a more responsive and precise approach to market analysis.
In conclusion, the True Envelopes indicator is a powerful tool that blends advanced theoretical concepts with practical implementation, offering traders a precise and responsive way to analyze price dynamics. By adapting the True Amplitude Envelope (TAE) method through the use of a Kernel Density Estimator (KDE) and high-pass filtering, this indicator effectively captures the most significant price movements, providing a more accurate depiction of support and resistance levels compared to traditional methods like Bollinger Bands and Keltner Channels. The flexible settings allow for extensive customization, ensuring the indicator can be tailored to suit various trading strategies and market conditions.
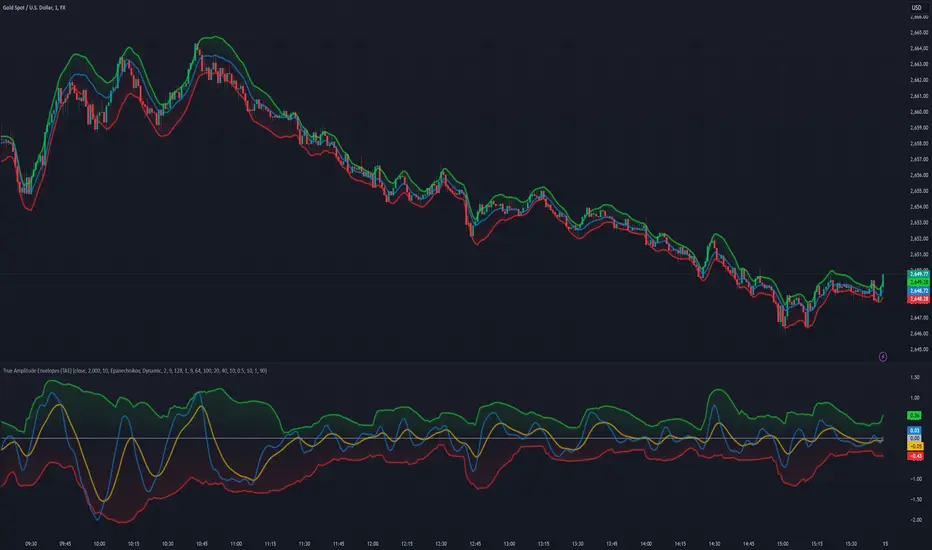
Adaptive Squeeze Momentum StrategyThe Adaptive Squeeze Momentum Strategy is a versatile trading algorithm designed to capitalize on periods of low volatility that often precede significant price movements. By integrating multiple technical indicators and customizable settings, this strategy aims to identify optimal entry and exit points for both long and short positions.
Key Features:
Long/Short Trade Control:
Toggle Options: Easily enable or disable long and short trades according to your trading preferences or market conditions.
Flexible Application: Adapt the strategy for bullish, bearish, or neutral market outlooks.
Squeeze Detection Mechanism:
Bollinger Bands and Keltner Channels: Utilizes the convergence of Bollinger Bands inside Keltner Channels to detect "squeeze" conditions, indicating a potential breakout.
Dynamic Squeeze Length: Calculates the average squeeze duration to adapt to changing market volatility.
Momentum Analysis:
Linear Regression: Applies linear regression to price changes over a specified momentum length to gauge the strength and direction of momentum.
Dynamic Thresholds: Sets momentum thresholds based on standard deviations, allowing for adaptive sensitivity to market movements.
Momentum Multiplier: Adjustable setting to fine-tune the aggressiveness of momentum detection.
Trend Filtering:
Exponential Moving Average (EMA): Implements a trend filter using an EMA to align trades with the prevailing market direction.
Customizable Length: Adjust the EMA length to suit different trading timeframes and assets.
Relative Strength Index (RSI) Filtering:
Overbought/Oversold Signals: Incorporates RSI to avoid entering trades during overextended market conditions.
Adjustable Levels: Set your own RSI oversold and overbought thresholds for personalized signal generation.
Advanced Risk Management:
ATR-Based Stop Loss and Take Profit:
Adaptive Levels: Uses the Average True Range (ATR) to set stop loss and take profit points that adjust to market volatility.
Custom Multipliers: Modify ATR multipliers for both stop loss and take profit to control risk and reward ratios.
Minimum Volatility Filter: Ensures trades are only taken when market volatility exceeds a user-defined minimum, avoiding periods of low activity.
Time-Based Exit:
Holding Period Multiplier: Defines a maximum holding period based on the momentum length to reduce exposure to adverse movements.
Automatic Position Closure: Closes positions after the specified holding period is reached.
Session Filtering:
Trading Session Control: Limits trading to predefined market hours, helping to avoid illiquid periods.
Custom Session Times: Set your preferred trading session to match market openings, closings, or specific timeframes.
Visualization Tools:
Indicator Plots: Displays Bollinger Bands, Keltner Channels, and trend EMA on the chart for visual analysis.
Squeeze Signals: Marks squeeze conditions on the chart, providing clear visual cues for potential trade setups.
Customization Options:
Indicator Parameters: Fine-tune lengths and multipliers for Bollinger Bands, Keltner Channels, momentum calculation, and ATR.
Entry Filters: Choose to use trend and RSI filters to refine trade entries based on your strategy.
Risk Management Settings: Adjust stop loss, take profit, and holding periods to match your risk tolerance.
Trade Direction Control: Enable or disable long and short trades independently to align with your market strategy or compliance requirements.
Time Settings: Modify the trading session times and enable or disable the time filter as needed.
Use Cases:
Trend Traders: Benefit from aligning entries with the broader market trend while capturing breakout movements.
Swing Traders: Exploit periods of low volatility leading to significant price swings.
Risk-Averse Traders: Utilize advanced risk management features to protect capital and manage exposure.
Disclaimer:
This strategy is a tool to assist in trading decisions and should be used in conjunction with other analyses and risk management practices. Past performance is not indicative of future results. Always test the strategy thoroughly and adjust settings to suit your specific trading style and market conditions.

Prometheus TTM SqueezeThe TTM indicator is an indicator used to better understand an underlying’s direction and volatility. Positive values indicate a rising price, negative falling. There is also an element of the underlying's volatility, explained below.
When, in this particular indicator, the zero line is the aqua color, that means that the volatility has picked up. In literal terms, it means that the upper Keltner Channel is above the upper Bollinger Band and the lower Keltner Channel is below the lower Bollinger Band. The range of the Keltner Channels is greater than the range of the Bollinger bands. What this is supposed to correlate to with price action is a more volatile choppier area. See below.
This is an example of volatility picking up being shown as the speed of the underlying. When the line turns aqua the move following tends to be sharp in the respective direction. Not a smooth delivery of price.
Regarding why this script is different from the others, with this script you do not need to input a bar's back value if you do not want to. Bars back being the amount of bars used in the indicator calculation. This is because of the use of Sum of Squared Errors, or SSE. How we do it is we calculate a Simple Moving Average or SMA and the indicator using a lot of different bars back values. Then if there is an event, characterized by the oscillator crossing over or under the 0 line, we subtract the close by the SMA and square it. If there is no event we return a big value, we want the error to be as small as possible. Because we loop over every value for bars back, we get the value with the smallest error. Or the SMA closest to the price ensuring we are following it as close as we can. This also becomes the value used as the multiplier for the Keltner Channels and Bollinger Bands, we simply divide them by 10 to normalize it. This leads to ease of use. A user does not need to worry about finding the best bars back for each ticker and time frame. We have you covered! SSE is not to be regarded to be the best given values for a pocket of the market, simply an estimation.
Of course we have the option for users to enter their own bars back or multipliers. Here is a comparison of the SSE at work and a 20 period bar’s back with 2 as the multiplier on a 4 hour $QQQ.
The top one is the SSE, the bottom is 20. I turned off showing the SMA, and alerts for better visibility. We see the SSE version does not cross above 0 again until the trend totally reverses. I would much rather overestimate risk than underestimate it.
The BULL and BEAR plotted on the chart is a result of the following conditions. A BULL if the price is above our auto optimized SMA and the oscillator crosses over 0. BEAR is the opposite, price below the SMA and an oscillator cross below 0. Here is the Daily NYSE:PLTR chart to show some.
Users have the options to toggle on and off the BULL and BEAR plots, SMA, as well as input their own lookback and multipliers.
We encourage traders to not follow indicators blindly, none are 100% accurate. SSE does not guarantee that the values generated will be the best for a given moment in time. Please comment on any desired updates, all criticism is welcome!
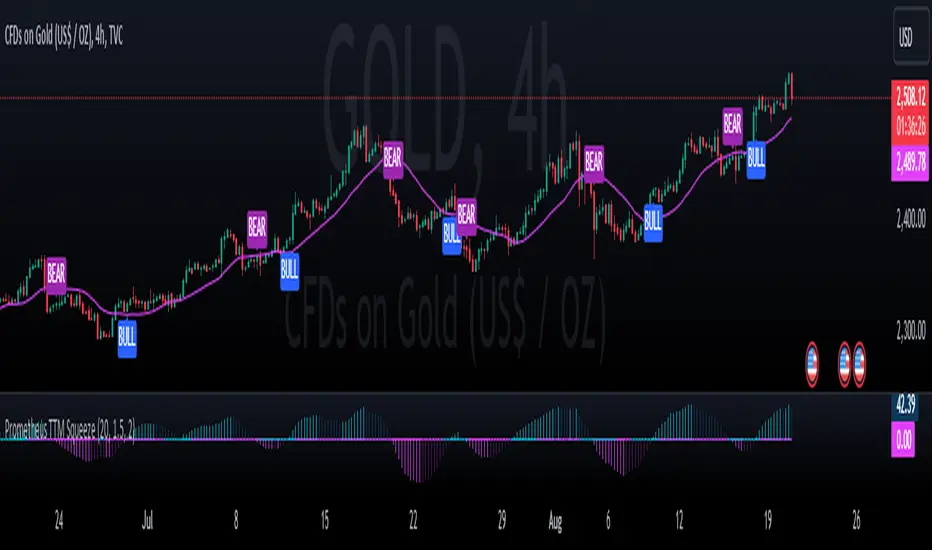
Octopus Nest Strategy Hello Fellas,
Hereby, I come up with a popular strategy from YouTube called Octopus Nest Strategy. It is a no repaint, lower timeframe scalping strategy utilizing PSAR, EMA and TTM Squeeze.
The strategy considers these market factors:
PSAR -> Trend
EMA -> Trend
TTM Squeeze -> Momentum and Volatility by incorporating Bollinger Bands and Keltner Channels
Note: As you can see there is a potential improvement by incorporating volume.
What's Different Compared To The Original Strategy?
I added an option which allows users to use the Adaptive PSAR of @loxx, which will hopefully improve results sometimes.
Signals
Enter Long -> source above EMA 100, source crosses above PSAR and TTM Squeeze crosses above 0
Enter Short -> source below EMA 100, source crosses below PSAR and TTM Squeeze crosses below 0
Exit Long and Exit Short are triggered from the risk management. Thus, it will just exit on SL or TP.
Risk Management
"High Low Stop Loss" and "Automatic High Low Take Profit" are used here.
High Low Stop Loss: Utilizes the last high for short and the last low for long to calculate the stop loss level. The last high or low gets multiplied by the user-defined multiplicator and if no recent high or low was found it uses the backup multiplier.
Automatic High Low Take Profit: Utilizes the current stop loss level of "High Low Stop Loss" and gets calculated by the user-defined risk ratio.
Now, follows the bunch of knowledge for the more inexperienced readers.
PSAR: Parabolic Stop And Reverse; Developed by J. Welles Wilders and a classic trend reversal indicator.
The indicator works most effectively in trending markets where large price moves allow traders to capture significant gains. When a security’s price is range-bound, the indicator will constantly be reversing, resulting in multiple low-profit or losing trades.
TTM Squeeze: TTM Squeeze is a volatility and momentum indicator introduced by John Carter of Trade the Markets (now Simpler Trading), which capitalizes on the tendency for price to break out strongly after consolidating in a tight trading range.
The volatility component of the TTM Squeeze indicator measures price compression using Bollinger Bands and Keltner Channels. If the Bollinger Bands are completely enclosed within the Keltner Channels, that indicates a period of very low volatility. This state is known as the squeeze. When the Bollinger Bands expand and move back outside of the Keltner Channel, the squeeze is said to have “fired”: volatility increases and prices are likely to break out of that tight trading range in one direction or the other. The on/off state of the squeeze is shown with small dots on the zero line of the indicator: red dots indicate the squeeze is on, and green dots indicate the squeeze is off.
EMA: Exponential Moving Average; Like a simple moving average, but with exponential weighting of the input data.
Don't forget to check out the settings and keep it up.
Best regards,
simwai
---
Credits to:
@loxx
@Bjorgum
@Greeny

Improved Scalping Consolidation and Squeeze IndicatorThe Improved Scalping Consolidation and Squeeze Indicator (Improved Scalp C&S) is a custom TradingView indicator designed for short-term trading, specifically scalping. It detects price consolidation and potential breakout scenarios using a combination of technical analysis tools, such as the Rate of Change (ROC), Relative Strength Index (RSI), Moving Average Convergence Divergence (MACD), Bollinger Bands, and Keltner Channels. To reduce the number of false signals, this improved version introduces a "consolidation strength" parameter, which represents the minimum number of consecutive bars required for a valid consolidation or squeeze signal.
How it works:
Consolidation Detection:
The indicator identifies price consolidation when the following conditions are met:
a. RSI is between 45 and 55, indicating a lack of strong momentum.
b. The absolute value of the MACD histogram is less than 0.1% of the closing price, suggesting a lack of directional movement.
c. The Rate of Change (ROC) is less than 1.5%, indicating relatively stable prices over the specified period.
Squeeze Detection:
The indicator detects a squeeze (a potential breakout scenario) when the Bollinger Bands are within the Keltner Channels, represented by the following conditions:
a. The lower Bollinger Band is above the lower Keltner Channel.
b. The upper Bollinger Band is below the upper Keltner Channel.
Consolidation Strength:
The consolidation strength parameter filters out weaker signals by requiring a minimum number of consecutive bars for a valid consolidation or squeeze signal. By adjusting this parameter, traders can control the sensitivity of the indicator to short-term price movements and potentially reduce the number of false signals.
When the consolidation strength criteria are met, the indicator colors the price bars within the pattern yellow for consolidation and orange for a squeeze, signaling potential trading opportunities.
Trading Strategy:
The Improved Scalping Consolidation and Squeeze Indicator can be used in various ways, depending on the trader's strategy and risk appetite. Here are some suggestions:
Range trading: During consolidation (yellow bars), traders can buy at support levels and sell at resistance levels within the range, using stop-loss orders to manage risk. However, this approach might not work well in the case of a sudden breakout.
Breakout trading: When a squeeze is detected (orange bars), traders can wait for a confirmed breakout from the consolidation pattern before entering a trade. A breakout can be confirmed by a strong price move accompanied by increased volume, a significant change in momentum, or a breach of important support or resistance levels.
Momentum-based strategies: Traders can use other momentum-based indicators (e.g., Stochastic Oscillator, On Balance Volume) in conjunction with the Improved Scalp C&S indicator to identify potential entry and exit points during consolidation or breakout scenarios.
Fine-tuning the consolidation strength: Adjust the "consolidation strength" input to find the optimal balance between the number of signals and their accuracy. A higher value will result in fewer signals, potentially reducing the number of false signals, but it may also make the indicator less sensitive to short-term price movements.

[DuDu95] SSL 4C MACD Laugerre RSI StrategyHello Guys! Nice to meet you all!
Before I start, my nickname has changed to 'DuDu95'!!
This is the Strategy introduced by youtube channel.
I made this based on the open source indicator by kevinmck100, vkno422, KivancOzbilgic. Thank you All!
### Entry Logic
1. Long Entry Logic
- close > SSL Hybrid baseline upper k (keltner channel)
- macd signal > 0 and current MACD value > previous MACD value
- Laguerre RSI < overbought Line.
2. short Entry Logic
- close < SSL Hybrid baseline lower k (keltner channel)
- macd signal < 0 and current MACD value < previous MACD value
- Laguerre RSI > overbought Line.
### Exit Logic
1. Long Exit Logic
- close < SSL Hybrid baseline lower k (keltner channel)
- macd signal < 0
2. short Entry Logic
- close > SSL Hybrid baseline upper k (keltner channel)
- macd signal > 0
### StopLoss
1. Can Choose Stop Loss Type: Percent, ATR, Previous Low / High.
2. Can Chosse inputs of each Stop Loss Type.
### Take Profit
1. Can set Risk Reward Ratio for Take Profit.
- To simplify backtest, I erased all other options except RR Ratio.
- You can add Take Profit Logic by adding options in the code.
2. Can set Take Profit Quantity.
### Risk Manangement
1. Can choose whether to use Risk Manangement Logic.
- This controls the Quantity of the Entry.
- e.g. If you want to take 3% risk per trade and stop loss price is 6% below the long entry price,
then 50% of your equity will be used for trade.
2. Can choose How much risk you would take per trade.
### Plot
1. Added Labels to check the data of entry / exit positions.
2. Changed and Added color different from the original one. (green: #02732A, red: #D92332, yellow: #F2E313)

StapleIndicatorsLibrary "StapleIndicators"
This Library provides some common indicators commonly referenced from other studies in Pine Script
squeeze(bbSrc, bbPeriod, bbDev, kcSrc, kcPeriod, kcATR, signalPeriod) Volatility Squeeze
Parameters:
bbSrc : (Optional) Bollinger Bands Source. By default close
bbPeriod : (Optional) Bollinger Bands Period. By default 20
bbDev : (Optional) Bollinger Bands Standard Deviation. By default 2.0
kcSrc : (Optional) Keltner Channel Source. By default close
kcPeriod : (Optional) Keltner Channel Period. By default 20
kcATR : (Optional) Keltner Channel ATR Multiplier. By default 1.5
signalPeriod : (Optional) Keltner Channel ATR Multiplier. By default 1.5
Returns:
adx(diPeriod, adxPeriod, signalPeriod, adxTier1, adxTier2, adxTier3) ADX: Average Directional Index
Parameters:
diPeriod : (Optional) Directional Indicator Period. By default 14
adxPeriod : (Optional) ADX Smoothing. By default 14
signalPeriod : (Optional) Signal Period. By default 13
adxTier1 : (Optional) ADX Tier #1 Level. By default 20
adxTier2 : (Optional) ADX Tier #2 Level. By default 15
adxTier3 : (Optional) ADX Tier #3 Level. By default 10
Returns:
smaPreset(srcMa) Delivers a set of frequently used Simple Moving Averages
Parameters:
srcMa : (Optional) MA Source. By default 'close'
Returns:
emaPreset(srcMa) Delivers a set of frequently used Exponential Moving Averages
Parameters:
srcMa : (Optional) MA Source. By default 'close'
Returns:
maSelect(ma, srcMa) Filters and outputs the selected MA
Parameters:
ma : (Optional) MA text. By default 'Ema-21'
srcMa : (Optional) MA Source. By default 'close'
Returns: maSelected
periodAdapt(modeAdaptative, src, maxLen, minLen) Adaptative Period
Parameters:
modeAdaptative : (Optional) Adaptative Mode. By default 'Average'
src : (Optional) Source. By default 'close'
maxLen : (Optional) Max Period. By default '60'
minLen : (Optional) Min Period. By default '4'
Returns: periodAdaptative
azlema(modeAdaptative, srcMa) Azlema: Adaptative Zero-Lag Ema
Parameters:
modeAdaptative : (Optional) Adaptative Mode. By default 'Average'
srcMa : (Optional) MA Source. By default 'close'
Returns: azlema
ssma(lsmaVar, srcMa, periodMa) SSMA: Smooth Simple MA
Parameters:
lsmaVar : Linear Regression Curve.
srcMa : (Optional) MA Source. By default 'close'
periodMa : (Optional) MA Period. By default '13'
Returns: ssma
jvf(srcMa, periodMa) Jurik Volatility Factor
Parameters:
srcMa : (Optional) MA Source. By default 'close'
periodMa : (Optional) MA Period. By default '7'
Returns:
jBands(srcMa, periodMa) Jurik Bands
Parameters:
srcMa : (Optional) MA Source. By default 'close'
periodMa : (Optional) MA Period. By default '7'
Returns:
jma(srcMa, periodMa, phase) Jurik MA (JMA)
Parameters:
srcMa : (Optional) MA Source. By default 'close'
periodMa : (Optional) MA Period. By default '7'
phase : (Optional) Phase. By default '50'
Returns: jma
maCustom(ma, srcMa, periodMa, lrOffset, almaOffset, almaSigma, jmaPhase, azlemaMode) Creates a custom Moving Average
Parameters:
ma : (Optional) MA text. By default 'Ema'
srcMa : (Optional) MA Source. By default 'close'
periodMa : (Optional) MA Period. By default '13'
lrOffset : (Optional) Linear Regression Offset. By default '0'
almaOffset : (Optional) Alma Offset. By default '0.85'
almaSigma : (Optional) Alma Sigma. By default '6'
jmaPhase : (Optional) JMA Phase. By default '50'
azlemaMode : (Optional) Azlema Adaptative Mode. By default 'Average'
Returns: maTF
