Wave Trend w/ VWMA overlayThis is a trend-following strategy and indicator which combines the Wave Trend Strategy (Lazy Bear) by thomas.gigure with the cRSI + Waves Strategy with VWMA overlay by Dr_Roboto .
You may update the parameters of the Wave Trend oscillator or the VWMA indicator to match your own preferences. You may also adjust the Base Quantity used for determining trade size (as described below) to suit your account size and risk tolerance.
The strategy identifies potential signals based on the on the Wave Trend oscillator, originally ported to TradingView by LazyBear. When a signal is produced by the Wave Trend oscillator, trade size is determined by the VWMA.
When the VWMA is trending against the direction of the Wave Trend signal, Base Quantity x 1 is used
When the VWMA is trending neutral, Base Quantity x 2 is used
When the VWMA is trending with the direction of the Wave Trend signal, Base Quantity x 4 is used
The strategy includes the ability to limit trade signals to certain defined periods of time ("Sessions") during the trading day and, optionally, to close any open position at the end of either or both "Sessions." This may be enabled/disabled via the Limit Signals to Trading Sessions? option on the "Inputs" tab of the strategy's "Settings" window.
If you are trading on a daily chart (or longer) you must disable the Limit Signals to Trading Sessions? in order for the strategy to produce signals.
Tìm kiếm tập lệnh với "LazyBear"

Comprehensive BandsComprehensive Bands is an unabashed mashup combining Bollinger Bands, STARC Bands, and Keltner Channels. STARC Bands are modified Keltner Channels whichdo a better job than the Bollinger Bands when it comes to showing where the top and bottom ranges of natural volatility exist. The pale white exterior cloud is your STARC Band fill. The white line is the STARC basis line. Next closest to the center we have the Bollinger Bands in yellow without a basis line (because BB basis lines aren't that great). Bollinger Bands will help to highlight when volatility breakouts are about to happen. Keltner Channels are based on an exponential moving average represented by the purple basis line in the center usually accompanied by a pair of channel lines above and below, in this case represented as a blue fill.
Every component of this indicator can represent support and resistance on the go. You can use this as a trading system. The method in this case would be similar to the Bollinger Band trading method. The Bollinger Band method involves waiting for price to hit a support or resistance line where it then prints a reversal candle, and to trade in the direction of that reversal. This indicator can improve the Bollinger Band trading method by providing a better idea of when a trend has reached a reversal point through the use of superior maximum/minimum representations and superior basis lines. All this while configured in a visual representation that's light on noise. I'd suggest using this indicator in conjunction with an oscillator you feel comfortable with such as the MacD or RSI. Happy hunting.
Shoutout to LazyBear.
Note: I'm aware that this does not contain Donchian channels and have no regrets.

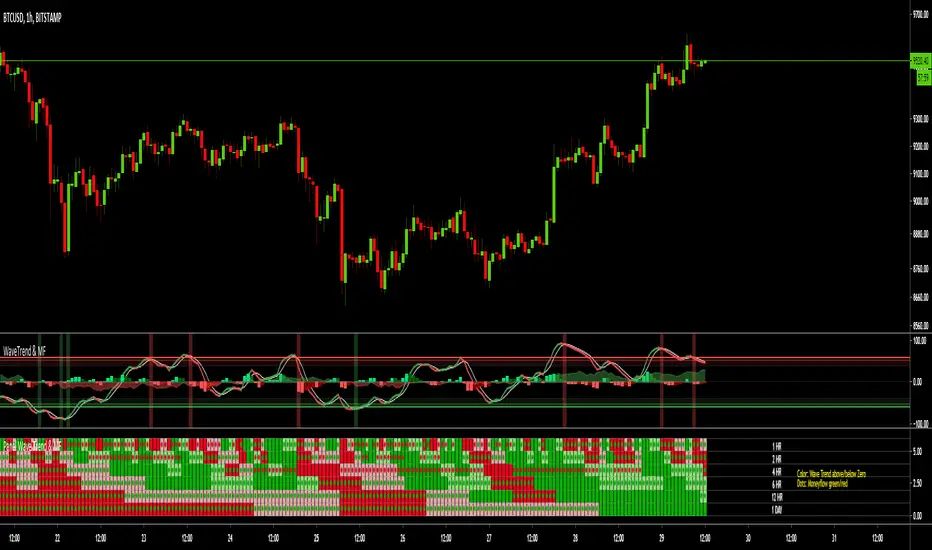
MTF Wave Trend & Money Flow - Monitoring PanelAnother indicator based on the famous "Wave Trend Oscillator" by LazyBear.
Monitoring panel showing the Wave Trend as color for 6 different timeframes. Additionaly the Money Flow (positive or negative) is indicated as green or red dots.
I find it helpful that with one glance the current Wave Trend and Money Flow on many timeframes is visible.
(Timeframes can be changed, but the description labels are currently hardcoded - if you want to change it, just copy the script and change them)
Meanings of the Colors:
WT above Zero and rising : Dark Green
WT above Zero and declining : Light Green
WT below Zero and declining : Dark Red
WT below Zero and rising : Light Red
Money flow positive : Green dot
Monet flow negative : Red dot
(Currently there are two additional timeframes commented in the code - if you want to use them, just copy the script and uncomment them)
Have fun and as always I am open for constructive feedback.
Cheers!
MTF Wave Trend CrossThis indicator is based on the famous "Wave Trend Oscillator" by LazyBear.
I have noticed that the Wave Trend Crosses (not the waves themselves) give a pretty good indication on the current status of the market (above Zero = bullish / below Zero = bearish ).
This new indicator is a Multi TF Version of this where it is possible to define 4 fixed Higher Time Frames and 4 fixed Lower Time Frames.
The results are then plotted above (higher TF) and below (lower TF) of the result of the current TF. (Offset can be flexibly changed in the settings)
This allows to judge the trend based on the various TFs.
Basically the greener it looks, the more bullish the situation is at the moment. More red color indicates a more bearish situation.
Enjoy.

Acc/Dist OscillatorThis is basically the code from the Volume Oscillator by LazyBear.
I just added 'accdist' as input source, made it a histogram and added a signal line.
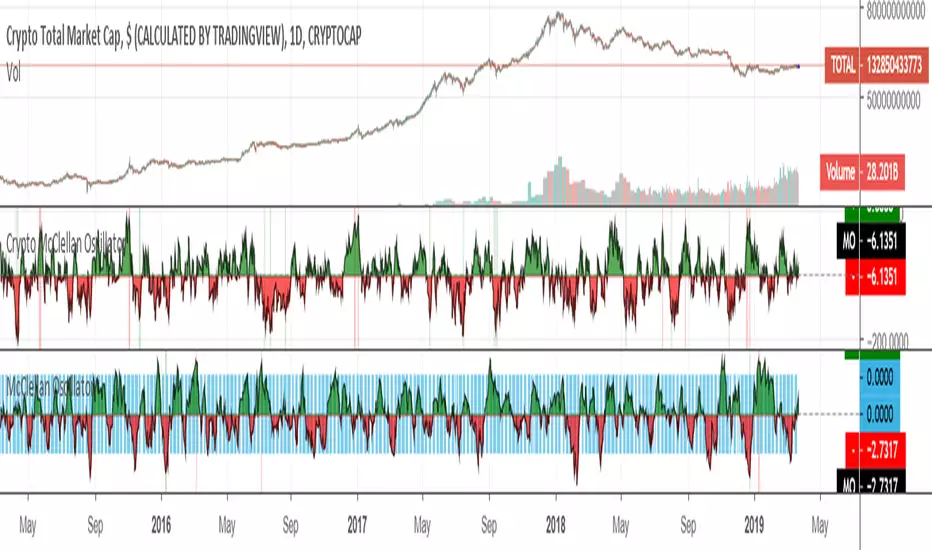
Crypto McClellan OscillatorMcClellan Oscillator for cryptocurrency, taking into account only the top 40 cryptos.
Original code was by LazyBear.

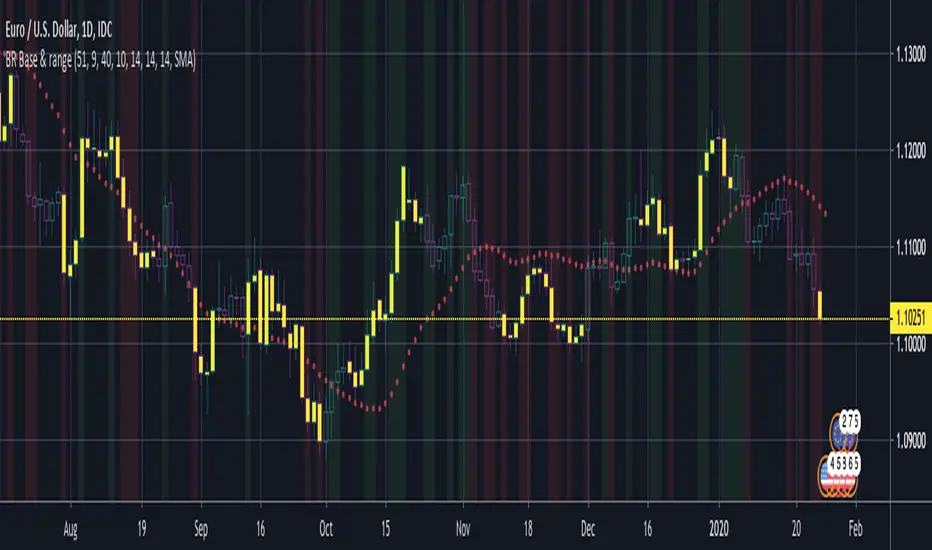
BERLIN Renegade - Baseline & RangeThis is the baseline and range candles part of a larger algorithm called the "BERLIN Renegade". It is based on the NNFX way of trading, with some modifications.
The baseline is used for price crossover signals, and consists of the LSMA. When price is below the baseline, the background turns red, and when it is above the baseline, the background turns green.
It also includes a modified version of the Range Identifier by LazyBear. This version calculates the same, but draws differently. It remove the baseline signal color if the Range Identifier signals there is a possible trading range forming.
The main way of identifying ranges is using the BERLIN Range Index. A panel version of this indicator is included in another part of the algorithm, but the bar color version is included here, to make the ranges even more visible and easier to avoid.
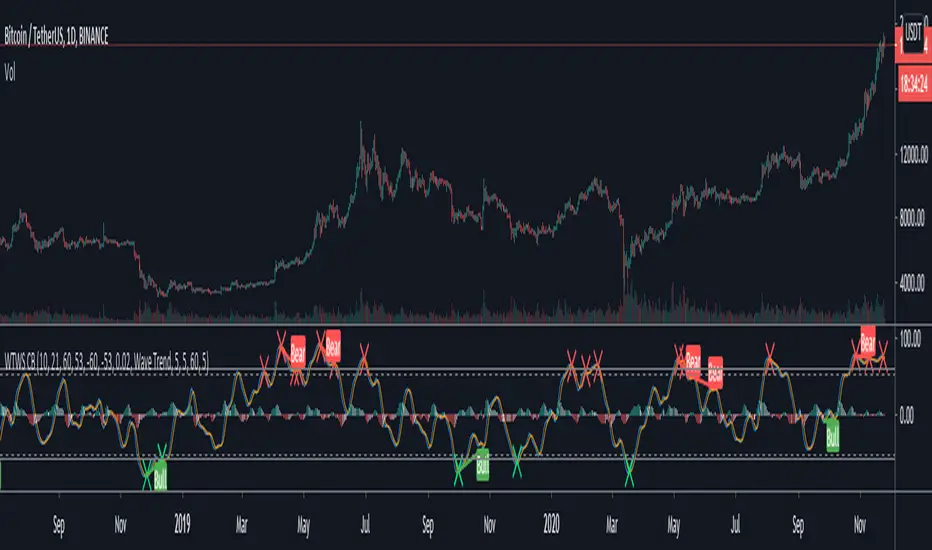
Wave Trend With Signals [ChuckBanger]A wave trend script based on LazyBears script but with added signals and a histogram...
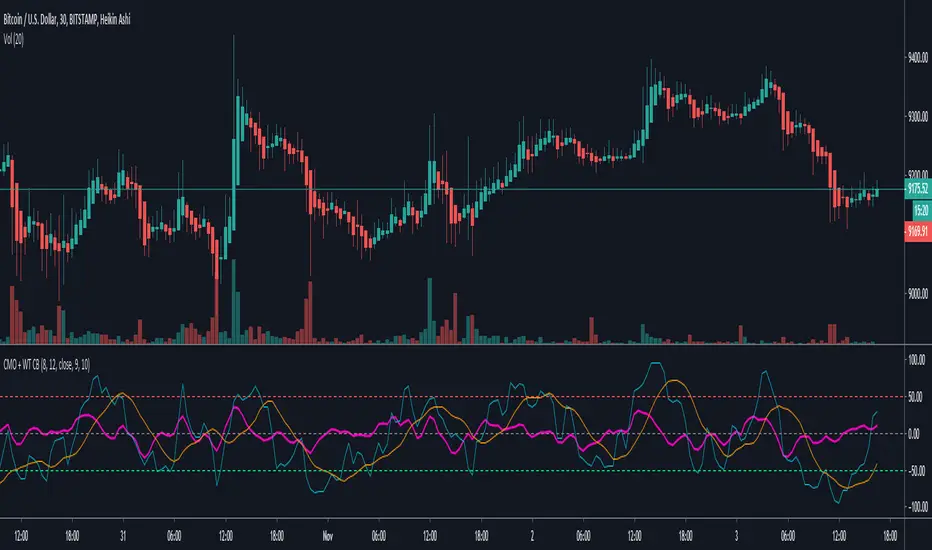
Chande Momentum Oscillator + WaveTrend Oscillator [ChuckBanger]This is a combination of Lazybears WaveTrend Oscillator (purple line) and Chande Momentum Oscillator (blue line with the orange line as a signal line). Use WaveTrend as a confirmation tool. It is consider as a selling point when CMO is over the red horizontal dotted line. The opposite applies if CMO line is under the red horizontal dotted line.
You can also use this with WaveTrand to confirm the sell or buy point. When WT line is over center line and CMO has crossed over it's signal line. It is a buy point. The opposite applies if WT line is under the center line and CMO is under its signal line.
Decision BFFor XBT/USD pairs.
Based on Decision Point oscillator by LazyBear.
I added a Rate of Change component based on code by kiasaki - this stops trading in a sideways market.
You can adjust stop loss and take profit values in the settings.
INSTRUCTIONS
Go Long when the background turns from red to green
Go Short when the background turns from green to red
Do not trade when background is white since this is a sideways market

Crypto McClellan OscillatorMcClellan Oscillator for cryptocurrency, taking into account only the top 40 cryptos.
Original code was by LazyBear.
ETH HawkEye Aggregated Volume IndicatorThis is combined Aggregated ETH Exchange Volume by Neobutane with HawkEye volume clone indicator by LazyBear.
Indicator includes aggregated raw ETH volume from 7 user selectable fiat and tether exchanges on USD, USDT, BTC, EUR, GBP, JPY pairs + Exponential MA + hawkeye bar coloring where: green is bullish volume , red - bearish and white - volume neutral to the market:
Bitfinex
Coinbase
Bitstamp
Kraken
Binance
Poloniex
Bittrex
*There is a TV bug that doesn't display a whole volume history if some pair was added later than date intended to be analysed by operator eg, if you want to watch older data you should exclude all secondary pairs that were added later and switch off "newer" exchanges like Binance.

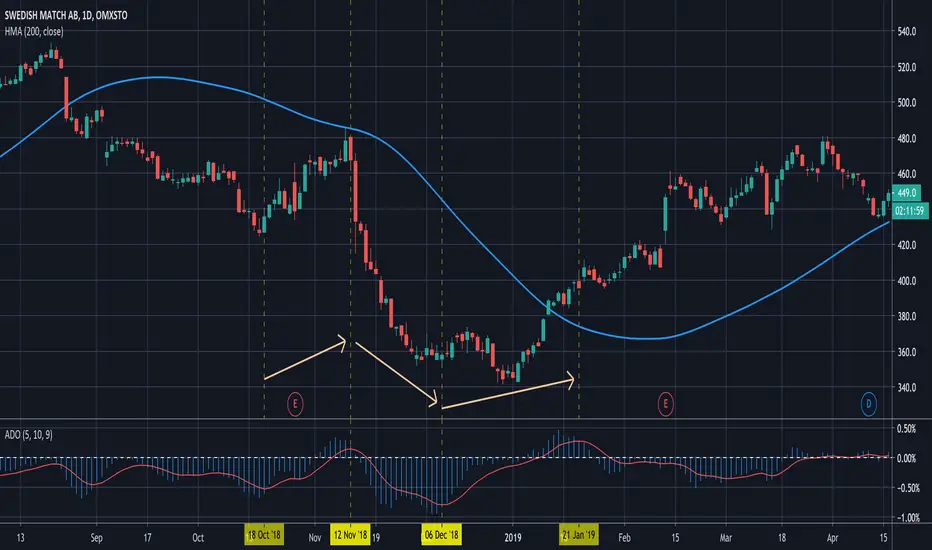
Bull Bear Divergence IndicatorThe script is written for Constance Brown-like anayis with divergence signals between price and indicator (i.e. stock close / RSI divergence)
Note: Though the example here with NVDA shows good reversal predictions, best results generally are optained with un-normalized indicators and oscilators like CB#s comosite index.
(For Trading view written by LazyBear.) I use two different lines: an indi high line for baerish, and an indi low line for bullish divergences.
The script only shows divergences to pivot pairs next to each other, not between actual pivot and those "a few pivots ago"
For individual work, chose your indicator and replace rsi in line 10 with it, anything else is auto. Sript bottom: optional comparison lines addable.

HEAVI - HawkEye Aggregated Volume IndicatorThis is combined Aggregated BTC Exchange Volume by Neobutane with HawkEye volume clone indicator by LazyBear.
Indicator includes aggregated raw BTC volume from 9 user selectable fiat and tether exchanges + Exponential MA + hawkeye bar coloring where: green is bullish volume, red - bearish and white - volume neutral to the market:
Bitfinex
Coinbase
Bitstamp
Kraken
Binance
Poloniex
Bittrex
bitFlyer
Bithumb

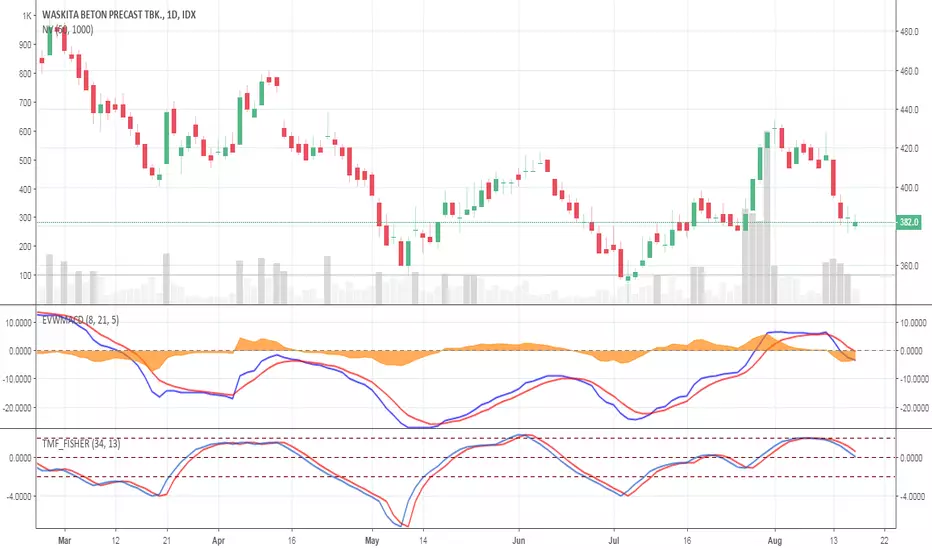
Elastic Volume Weighted MACD ( EVWMACD )The Elastic Volume Weighted MACD is a variation of standard MACD.
The Difference is that this script apply the formula of standard MACD with the Elastic Volume Weighted Moving Average.
I took the formula of EVWMA from public library coded by LazyBear.
I use EVWMACD as a trend confirmation indicator.
Just tune all lengths and parameters according to your instruments
[naoligo] 12x MA DT (5, 15, 30 & 60)This indicator is based on "Generic 8x MA Plotter", by @LazyBear.
It is also based on my own indicator "10x MA (H, D, W, M)", which is good for Swing Trading and/or Position.
This one is focused in daytrade and it will plot three Moving Averages based on current time interval (under 5 minutes) and nine based on chosen periods by 5, 15, 30 and 60 minutes. You will be able to see where is, for example, a 50 period's SMA of 15 minutes when using a 2 minutes time interval chart. I find it very useful to analyze, in a snap, possible price ranges and enter/exit points. All reference values are from setups known and used by daytraders.
you can choose between EMA or SMA (default: SMA) for each time interval, that are distributed in:
3x MA current time interval;
3x MA 5 minutes;
2x MA 15 minutes;
2x MA 30 minutes;
2x MA 60 minutes.
I've tried to keep the code as simple as possible, so you can increase the number of MA or modify the type for each time interval.
Cons: Use it wisely, because if you choose to plot all the 12 Moving Averages, it will may consume a lot of your navigator resources.
Enjoy!


[naoligo] 10x MA (H, D, W, M)This one is based on "Generic 8x MA Plotter" indicator, by @LazyBear.
It will plot three Moving Averages based on current time interval and seven based on chosen periods by hour, day, week and month. You will be able to see where is, for example, a 50 days SMA when using a 5 minutes time interval chart. I find it very useful to analyze, in a snap, possible price ranges and enter/exit points. All reference values are from setups known and used by traders.
Cons: Use it wisely, because if you choose to plot all the 10 Moving Averages, he will consume a lot of the computer resources.
Enjoy!!
Edit: I forgot to mention that you can choose between EMA or SMA for each time interval, that are distributed in:
2x MA Hour;
2x MA Day;
2x MA Week;
1x MA Month.
I've tried to keep the code as simple as possible, so you can increase that number or modify the Moving Average that each time interval will use.
Peace!

Drexel StrategyThis is my variation of the famous Drexel Strategy. I've modified a few of the things, for instance using a JMA smoothing average as well as the RSX calculation from LazyBear. This strategy does not repaint I do not think, when I called the high and low I used or calculated things from open. I believe I avoided curve fitting because I get similar results across most pairs. This works best on the 1hr and below time frames. Hope you get lots of use out of it.
Auto FibTook the code from LazyBears rsi-fib and made it so you could apply it to a chart. It plots fib levels between the high and low of a timeframe of your choosing. Seems to line up well with custom drawn fib levels.
Not sure if it's any better than just drawing the lines yourself, but whatever.

ZeroLag ema + adx = trueCombined LazyBears ZeroLag EMA and CapnOscars moving average ADX. Here's the result.
I figured it could be used as a trend trendtrading system,
ADX red + ema cross downards = short.
ADX green + ema cross up = long.
ADX black + ema cross = no trade
Or something along those line. A way filter out whipsaws.
This is just something I threw together in 5 min, so din't go all in tho. Haven't had time to test.
2 ADX
3 Z-EMAs
Colors/settings can be customized.

Squeeze Momentum Pro + Divergencias RCTSqueeze Momentum Pro + Divergences RCT"
This indicator combines the core logic of the LazyBear Squeeze Momentum oscillator with divergence detection logic, as modified and integrated by Carlos Mauricio Vizcarra for the Rafael Cepeda Trader community. It displays the classic Squeeze Momentum histogram and zero-cross line, while simultaneously identifying potential regular and hidden bullish and bearish divergences based on the internal momentum oscillator (val) and price pivots.
This code is provided exclusively for demonstrative and academic purposes. It is intended for study, analysis, and educational use within the context of algorithmic trading indicator development. The code is subject to the Mozilla Public License 2.0 (MPL 2.0).

RCT FUSION PRO – Convergent Squeeze, Momentum & Trend SystemDescripción del script :
This indicator integrates three core technical concepts into a single decision-support framework: Bollinger-Keltner squeeze compression, directional trend strength (ADX/DMI), and multi-timeframe market wave momentum. The goal is not merely to overlay indicators, but to create a convergent signal system where confirmation across components increases the reliability of potential trade setups.
1. Squeeze Momentum (LazyBear’s method):
Detects periods of low volatility (squeeze) using Bollinger Bands inside Keltner Channels. When the squeeze “fires,” the linear regression-based oscillator (val) reveals the direction and acceleration of the breakout. Green/lime = bullish momentum; red/maroon = bearish.
2. Adaptive ADX & DMI Scaling:
The standard ADX (14-period) and +/-DI lines are dynamically scaled to match the amplitude of the squeeze oscillator. This allows traders to visually assess whether a breakout occurs alongside strong trend confirmation (ADX > 23) and directional bias (+DI > -DI or vice versa). The key level is offset by -7 units for better alignment.
3. Fibonacci Wave Momentum (A/B/C):
Three MACD-style histograms (Wave A: 55, Wave B: 144, Wave C: 233) use EMA crossovers with Fibonacci lengths to identify short-, medium-, and long-term momentum shifts. These appear as semi-transparent areas and help contextualize the squeeze signal within broader market cycles.
4. Divergence Detection (Non-repainting):
Automatically identifies regular and hidden bullish/bearish divergences between price and the squeeze oscillator. All divergence lines and labels are drawn only after the candle closes, preventing repainting. Alerts are included for all four divergence types.
How to use:
A squeeze release (black → gray background) combined with rising green histogram and +DI > -DI suggests a high-probability long setup.
Confirm with Wave A/B/C alignment (all turning positive) and/or a bullish divergence below zero.
Use the Key Level line (white) as a dynamic reference for ADX strength relative to momentum.
This system is designed for swing and intraday traders seeking confluence between volatility compression, trend strength, and cyclical momentum. No single component is traded in isolation—convergence is the core principle.
Versión en español :
Este indicador combina tres conceptos técnicos clave en un solo marco de apoyo a la decisión: compresión de squeeze (Bollinger-Keltner), fuerza direccional de tendencia (ADX/DMI) y momento de ondas de mercado en múltiples plazos. No se trata de una simple superposición, sino de un sistema donde la convergencia de señales aumenta la confiabilidad de las entradas.
El Squeeze Momentum detecta baja volatilidad y muestra la dirección del impulso tras la liberación.
El ADX y los DM+/- se escalan dinámicamente para alinearse visualmente con el oscilador, permitiendo evaluar si el impulso coincide con una tendencia fuerte.
Las Ondas A/B/C (55, 144, 233) muestran el momento en distintos horizontes temporales mediante áreas coloreadas.
Las divergencias (regulares y ocultas) se detectan sin repintado y generan alertas.
Se recomienda operar solo cuando múltiples componentes coinciden, no de forma aislada. Ideal para traders de swing e intradía que buscan confluencia.
