Anup Algo + For Full Version Contact on Whatsapp +918123456805Best indicator For Algo Trading Auto Buys & Sells, Auto Tp & Sl Works for All pairs forex commodities crypto
Contact on Whatsapp +918123456805 for full version
Tìm kiếm tập lệnh với "algo"

NAS Ultimate Algo v2.5NAS Ultimate Algo v2.5 has following features:
1. Dynamic Trailing SL Label
2. Auto-Hide on TP Hit
3. Dynamic Take-Profit Targets (ATR-based)
4. Label Colour Customization

Ryan Liquidity Hunt Algo Premium Liquidity Hunt Algo — detects institutional swing liquidity, order blocks, and premium/discount zones.
Shows auto-drawn swing boxes, liquidity lines (daily/weekly/monthly), FVG gaps, and optional OI/volume filters to highlight high-probability areas — designed for clear structure-based trade decisions and visual clarity.

Ultimate Algo ProUltimate Algo Pro एक multi-layered market analysis system है जो price behavior, volatility structure और trend dynamics को combine करके साफ़ तथा actionable trading signals प्रदान करता है।
इसका उद्देश्य market conditions को simplify करके traders को स्पष्ट दिशा और disciplined decision-making में मदद देना है।
Core Features
Market strength और directional shifts को identify करने वाला dynamic signal engine
Momentum shifts पर आधारित automatic long/short indications
Price structure के अनुसार adaptive zones और reaction levels
Volatility को ध्यान में रखकर बनाया गया risk framework, जिसमें automated levels शामिल हैं
Trend environment समझने के लिए optimized visual component
Compact dashboard जो system status को एक नज़र में दिखाता है
Use Case
यह system short-term से लेकर medium-term trading तक किसी भी style में इस्तेमाल किया जा सकता है।
Script का उद्देश्य
✔ clearer signals
✔ reduced noise
✔ structured trade planning
provide करना है ताकि trader को market flow बेहतर समझ आए।

EMA + RSI Autotrade Webhook - VarunOverview
The EMA + RSI Autotrade Webhook is a powerful trend-following indicator designed for automated crypto futures trading. This indicator combines the reliability of Exponential Moving Average (EMA) crossovers with RSI momentum filtering to generate high-probability buy and sell signals optimized for webhook integration with crypto exchanges like Delta Exchange, Binance Futures, and Bybit.Key Features
Simple & Effective: Uses proven EMA 9/21 crossover strategy
RSI Momentum Filter: Eliminates low-probability trades in ranging markets
Webhook Ready: Two clean alerts (LONG Entry, SHORT Entry) for seamless automation
Exchange Compatible: Works with Delta Exchange, 3Commas, Alertatron, and other webhook platforms
Zero Lag Signals: Real-time alerts on crossover confirmation
Visual Clarity: Clean chart markers for easy signal identification
How It Works
Entry Signals:
LONG Entry: Triggers when EMA 9 crosses above EMA 21 AND RSI is above 52 (bullish momentum confirmed)
SHORT Entry: Triggers when EMA 9 crosses under EMA 21 AND RSI is below 48 (bearish momentum confirmed)
Technical Components:
Fast EMA: 9-period (tracks short-term price action)
Slow EMA: 21-period (identifies primary trend)
RSI: 14-period (confirms momentum strength)
RSI Long Threshold: 52 (filters weak bullish signals)
RSI Short Threshold: 48 (filters weak bearish signals)
Best Use Cases
Crypto Futures Trading: Bitcoin, Ethereum, Altcoin perpetual contracts
Automated Trading Bots: Integration with Delta Exchange webhooks, TradingView alerts
Timeframes: Optimized for 15-minute charts (works on 5min-1H)
Markets: Trending crypto markets with clear directional moves
Risk Management: Best used with 1-2% stop loss per trade (managed externally)
Webhook Automation Setup
Add indicator to your TradingView chart
Create alerts for "LONG Entry" and "SHORT Entry"
Configure webhook URL from your exchange (Delta Exchange, Binance, etc.)
Use alert message: Entry LONG {{ticker}} @ {{close}} or Entry SHORT {{ticker}} @ {{close}}
Exchange automatically reverses positions on opposite signals
Advantages
✅ No manual trading required - fully automated
✅ Eliminates emotional trading decisions
✅ Catches trending moves early with EMA crossovers
✅ RSI filter reduces whipsaws in choppy markets
✅ Works 24/7 without monitoring
✅ Simple two-alert system (easy to manage)
✅ Compatible with multiple exchanges via webhooksStrategy Philosophy
This indicator follows a trend-following with momentum confirmation approach. By waiting for both EMA crossover AND RSI confirmation, it ensures you're entering trades with genuine momentum behind them, not just random price noise. The tight RSI thresholds (52/48) keep you aligned with the prevailing trend.Recommended Settings
Timeframe: 15-minute (primary), 5-minute (scalping), 1-hour (swing)
Markets: BTC/USDT, ETH/USDT, high-liquidity altcoin perpetuals
Position Sizing: 100% capital per signal (exchange manages reversals)
Stop Loss: 2% (managed via exchange or external bot)
Leverage: 1-2x for conservative approach, up to 5x for aggressive
Important Notes
⚠️ This indicator generates entry signals only - position reversals are handled automatically by your exchange
⚠️ Always backtest on historical data before live trading
⚠️ Use proper risk management and position sizing
⚠️ Best performance in trending markets; may generate false signals in tight ranges
⚠️ Requires TradingView Premium or higher for webhook functionalityTags
cryptocurrency futures automated-trading ema-crossover rsi webhook delta-exchange tradingview-alerts trend-following momentum bitcoin ethereum crypto-bot algo-trading 15-minute-strategy

(Mustang Algo) Trend 5/15/30/1H + EMA Lines + Aligned Signal═══════════════════════════════════════════════════════════
MUSTANG ALGO - MULTI-TIMEFRAME TREND ALIGNMENT
═══════════════════════════════════════════════════════════
📊 OVERVIEW:
This indicator analyzes trend alignment across four key timeframes (5m, 15m, 30m, 1H) using customizable moving averages. It helps traders identify high-probability setups when multiple timeframes confirm the same trend direction.
🎯 KEY FEATURES:
✓ Multi-Timeframe Analysis (5m/15m/30m/1H)
- Monitors trend direction on 4 different timeframes simultaneously
- Visual table showing real-time trend status for each period
- Optional price display for each timeframe
✓ Flexible Moving Average System
- Choose from 5 MA types: EMA, SMA, SMMA (RMA), WMA, VWMA
- Customizable Fast MA (default: 20) and Slow MA (default: 50)
- Visual cloud between moving averages (green=bullish, red=bearish)
✓ Alignment Signals
- "4x UP" triangle: All 4 timeframes bullish (strong uptrend)
- "4x DOWN" triangle: All 4 timeframes bearish (strong downtrend)
- Signals appear only when ALL timeframes agree
✓ Visual Enhancements
- MA cloud with transparency for better chart readability
- Optional candle coloring based on local trend
- Clean, customizable dashboard display
✓ Alert System
- Built-in alerts for bullish alignment (4 TF aligned up)
- Built-in alerts for bearish alignment (4 TF aligned down)
- Perfect for automated trading setups
📈 HOW TO USE:
1. **Trend Confirmation**: Wait for alignment signals (triangles) before entering trades
2. **Dashboard Monitoring**: Check the top-right table to see individual TF trends
3. **MA Cloud**: Use the cloud as dynamic support/resistance
4. **Entry Timing**: Enter on local timeframe when higher TFs are aligned
⚙️ CUSTOMIZABLE PARAMETERS:
- Fast MA Length (default: 20)
- Slow MA Length (default: 50)
- MA Type (EMA/SMA/SMMA/WMA/VWMA)
- Toggle dashboard display
- Toggle price display in dashboard
- Toggle MA cloud
- Toggle candle coloring
⚠️ BEST PRACTICES:
- Use on 5m or 15m charts for optimal multi-TF analysis
- Combine with price action and volume for best results
- Alignment signals are rare but highly significant
- Not a standalone system - use as confluence tool
💡 STRATEGY IDEAS:
- Scalping: Enter on local TF when all TFs aligned
- Swing Trading: Hold positions while alignment maintained
- Risk Management: Exit if alignment breaks
- Confluence: Combine with support/resistance levels
📌 NOTES:
- Works on all markets (Crypto, Forex, Stocks, Indices)
- Repaints minimally (only on MA calculations)
- Low resource usage, efficient code
═══════════════════════════════════════════════════════════
Created by Mustang Spirit Trading Academy
For educational purposes - Always manage your risk!
═══════════════════════════════════════════════════════════

Institutional Compression Breakout (ICBO Algo) [@darshakssc]The ICBO Algo is a smart intraday trading tool that detects institutional compression zones followed by breakout confirmation. It combines candle range analysis, volume compression, EMA filtering, and ATR-based Risk/Reward zones to highlight high-probability trade setups with visual clarity.
This script is designed for educational and research purposes only, fully aligned with TradingView’s Pine Script policy and publishing guidelines.
🔍 Key Features
🌀 Compression Zone Detection
Identifies low-range, low-volume candles often formed before institutional breakouts.
📈📉 Breakout Signals
Triggered after confirmed price + EMA breakout post-compression.
📊 Dashboard Panel
Displays breakout phase, current R:R ratio, and zone status in real-time.
🟢🔴 Buy/Sell Labels with Emojis
Clean and non-intrusive labels for immediate action recognition.
🔔 Alerts Included
Receive real-time push, email, or webhook alerts for breakout signals.
⚙️ How It Works
Compression Phase:
When the candle range and volume are significantly lower than the moving average, the script flags it as a compression zone.
Breakout Confirmation:
A breakout signal is confirmed when the price breaks the previous high/low and is above/below the trend EMA.
Entry Logic:
📈 Buy: Price > previous high + above EMA after compression
📉 Sell: Price < previous low + below EMA after compression
⚠️ Disclaimer
This script is intended for educational and research purposes only. It does not constitute financial advice or recommendations of any kind. Always use proper risk management. Past performance does not guarantee future results.

Hybrid Trend Line-J-AlgoOverview
The Hybrid Trend Line-J-Algo is an advanced multi-layered trendline detection system that identifies market trends across three distinct timeframes simultaneously. This indicator combines confirmed, developing, and real-time trend analysis to provide traders with a comprehensive view of market structure and momentum shifts.
Key Features
[✅ Three-Tier Trend Detection System:
Confirmed Trendlines (⚡T💧/⚡T🩸) - High-probability, established trends with 20-period confirmation
Developing Trendlines (⚡D💧/⚡D🩸) - Emerging trends with 8-period detection for early entries
Real-Time Trendlines (⚡R💧/⚡R🩸) - Immediate trend identification with minimal lag (10-period lookback)
✅ Visual Channel System:
Gradient-filled channels between trendlines and parallel support/resistance zones
Adjustable channel padding for volatility-based spacing
Color-coded bullish (blue/teal/lime) and bearish (gray/red/orange) trends
✅ Customizable Display:
Toggle each trendline type independently
Adjustable detection lengths for all three systems
Custom colors and label sizes
Optional gradient fills or solid colors
✅ Smart Trendline Management:
Automatic trendline extension to current price
Pivot-based detection for accurate swing points
Dynamic slope calculations
Labeled indicators for easy trend identification
How It Works
Confirmed Trendlines use pivot highs/lows with a 20-bar lookback to identify well-established trends. These represent the most reliable trend structure and are ideal for position trading and trend confirmation.
Developing Trendlines employ an 8-bar detection period to catch trends as they form. These provide earlier signals than confirmed lines, making them suitable for swing trading and anticipating trend continuations.
Real-Time Trendlines track the most recent price action with minimal lag, connecting recent highs and lows to identify immediate momentum shifts. Perfect for intraday trading and quick reversals.
Best Use Cases
📈 Trend Following - Align trades with confirmed trendlines for high-probability setups
📉 Early Entry Detection - Use developing trendlines to enter before the crowd
⚡ Scalping & Day Trading - Real-time trendlines provide instant trend direction
🎯 Multi-Timeframe Analysis - View all three trend layers simultaneously for confluence
Settings Guide
Confirmed Trend Lines:
Detection Length: 20 (default) - Higher = fewer, stronger signals
Colors: Customizable bullish/bearish
Developing Trend Lines:
Detection Length: 8 (default) - Lower = more responsive
Dashed style for visual distinction
Real-Time Trend Lines:
Lookback: 10 (default) - Minimal lag for immediate feedback
Dotted style for differentiation
Visual Settings:
Gradient Fills: Toggle smooth color transitions
Channel Padding: Adjust spacing (2.0 default)
Label Size: Choose from Tiny to Huge
Trading Tips
💡 Look for confluence when multiple trendline types align in the same direction
💡 Watch for breaks of confirmed trendlines as potential reversal signals
💡 Use developing trendlines to anticipate confirmed trend formations
💡 Combine with volume and momentum indicators for enhanced accuracy
💡 Respect the channel boundaries as dynamic support/resistance zones
Unique Advantages
✨ No Repainting - All trendlines are based on confirmed pivots and historical data
✨ Clean Visual Design - Emoji labels and gradient fills for intuitive interpretation
✨ Fully Customizable - Adapt to any trading style or timeframe
✨ Multiple Confirmation Levels - Reduces false signals through multi-tier analysis
✨ Beginner Friendly - Clear visual cues with labeled trend indicators
Disclaimer
This indicator is for educational and informational purposes only. It does not constitute financial advice. Always conduct your own analysis and risk management before making trading decisions.
Version: 6
Type: Overlay Indicator
Max Lines/Labels: 500
Perfect for: Trend traders, swing traders, day traders, and multi-timeframe analysts

Longhorn Algo Session LevelsThe Longhorn Algo Session Levels indicator automatically plots key intraday reference points across the Asia, London, and Pre-Market (New York) sessions. It is designed to help traders track session-to-session order flow, liquidity grabs, and directional bias as the trading day develops.
Features
Plots highs and lows for Asia, London, and Pre-Market sessions.
Calculates and displays each session’s Line in the Sand (LIS), defined as the session’s average price.
Marks Previous Day High (PDH) and Previous Day Low (PDL) for daily context.
Session ranges reset automatically with each new trading day (18:00 EST roll).
Fully customizable colors, styles, and line widths for every level.
Labels each level directly on the chart for clear identification.
How to Use
Identify where the New York session opens relative to prior Asia, London, and Pre-Market LIS levels.
Watch for liquidity sweeps around session highs/lows.
Use LIS stacking (Asia vs London vs Pre-Market) to gauge directional bias.
This tool is especially useful for futures, forex, and indices traders who rely on session behavior to anticipate market structure and intraday momentum shifts.

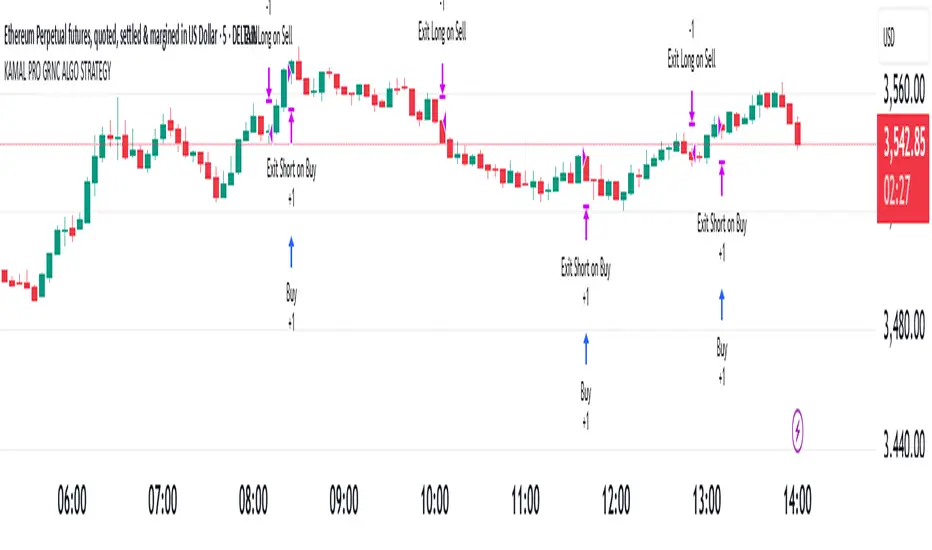
KAMAL PRO GRNC ALGO STRATEGY candles breakout strategy for all index and commodities and forex and crypto trade.and also use for algo trade
[Mustang Algo] Channel Strategy# Mustang Algo Channel Strategy - Universal Market Sentiment Oscillator
## 🎯 ORIGINAL CONCEPT
This strategy employs a unique market sentiment oscillator that works on ALL financial assets. It uses Bitcoin supply dynamics combined with stablecoin market capitalization as a macro sentiment indicator to generate universal timing signals across stocks, forex, commodities, indices, and cryptocurrencies.
## 🌐 UNIVERSAL APPLICATION
- **Any Asset Class:** Stocks, Forex, Commodities, Indices, Crypto, Bonds
- **Market-Wide Timing:** BTC/Stablecoin ratio serves as a global risk sentiment gauge
- **Cross-Market Signals:** Trade any instrument using macro liquidity conditions
- **Ecosystem Approach:** One oscillator for all financial markets
## 🧮 METHODOLOGY
**Core Calculation:** BTC Supply / (Combined Stablecoin Market Cap / BTC Price)
- **Data Sources:** DAI + USDT + USDC market capitalizations
- **Signal Generation:** RSI(14) applied to the ratio, double-smoothed with WMA
- **Timing Logic:** Crossover signals filtered by overbought/oversold zones
- **Multi-Timeframe:** Configurable timeframe analysis (default: Daily)
## 📈 TRADING STRATEGY
**LONG Entries:** Bullish crossover when market sentiment is oversold (<48)
**SHORT Entries:** Bearish crossover when market sentiment is overbought (>55)
**Universal Timing:** These macro signals apply to trading any financial instrument
## ⚙️ FLEXIBLE RISK MANAGEMENT
**Three SL/TP Calculation Modes:**
- **Percentage Mode:** Traditional % based (4% SL, 12% TP default)
- **Ticks Mode:** Precise tick-based calculation (50/150 ticks default)
- **Pips Mode:** Forex-style pip calculation (50/150 pips default)
**Realistic Parameters:**
- Commission: 0.1% (adjustable for different asset classes)
- Slippage: 2 ticks
- Position sizing: 10% of equity (conservative)
- No pyramiding (single position management)
## 📊 KEY ADVANTAGES
✅ **Universal Application:** One strategy for all asset classes
✅ **Macro Foundation:** Based on global liquidity and risk sentiment
✅ **False Signal Filtering:** Overbought/oversold zones reduce noise
✅ **Flexible Risk Management:** Multiple SL/TP calculation methods
✅ **No Lookahead Bias:** Clean backtesting with realistic results
✅ **Cross-Market Correlation:** Captures broad market risk cycles
## 🎛️ CONFIGURATION GUIDE
1. **Asset Selection:** Apply to stocks, forex, commodities, indices, crypto
2. **Timeframe Setup:** Daily recommended for swing trading
3. **Sentiment Bounds:** Adjust 48/55 levels based on market volatility
4. **Risk Management:** Choose appropriate SL/TP mode for your asset class
5. **Direction Filter:** Select Long Only, Short Only, or Both
## 📋 BACKTESTING STANDARDS
**Compliant with TradingView Guidelines:**
- ✅ Realistic commission structure (0.1% default)
- ✅ Appropriate slippage modeling (2 ticks)
- ✅ Conservative position sizing (10% equity)
- ✅ Sustainable risk ratios (1:3 SL/TP)
- ✅ No lookahead bias (proper historical simulation)
- ✅ Sufficient sample size potential (100+ trades possible)
## 🔬 ORIGINAL RESEARCH
This strategy introduces a revolutionary approach to financial markets by treating the BTC/Stablecoin ratio as a global risk sentiment gauge. Unlike traditional indicators that analyze individual asset price action, this oscillator captures macro liquidity flows that affect ALL financial markets - from stocks to forex to commodities.
## 🎯 MARKET APPLICATIONS
**Stocks & Indices:** Risk-on/risk-off sentiment timing
**Forex:** Global liquidity flow analysis for major pairs
**Commodities:** Risk appetite for inflation hedges
**Bonds:** Flight-to-safety vs. risk-seeking behavior
**Crypto:** Native application with direct correlation
## ⚠️ RISK DISCLOSURE
- Designed for intermediate to long-term trading across all timeframes
- Market sentiment can remain extreme longer than expected
- Always use appropriate position sizing for your specific asset class
- Adjust commission and slippage settings for different markets
- Past performance does not guarantee future results
## 🚀 INNOVATION SUMMARY
**What makes this strategy unique:**
- First to use BTC/Stablecoin ratio as universal market sentiment indicator
- Applies macro-economic principles to technical analysis across all assets
- Single oscillator provides timing signals for entire financial ecosystem
- Bridges traditional finance with digital asset insights
- Combines fundamental liquidity analysis with technical precision

CPD Approach Algo Line [ValiantTrader]CPD Approach Algo Line Indicator - Explanation
This indicator, developed by ValiantTrader, is a sophisticated tool for analyzing price action and volume distribution across different timeframes. Here's how it works and how traders can use it:
Core Functionality
The indicator performs a "Candle Price Distribution" (CPD) analysis by:
Collecting data from a higher timeframe (configurable via input)
Dividing the price range into horizontal zones (either by tick size or evenly distributed)
Analyzing price behavior within each zone
Key Features and Trading Applications
1. Price Zone Analysis
Divides the price range into customizable zones (default 24 zones)
Shows how many candles have traded in each zone
Displays what percentage of total candles occurred in each zone
Trading Use: Identifies high-probability support/resistance areas where price has historically spent more time.
2. Delta Calculation
Shows the difference in candle counts between adjacent zones
Color-coded (green for positive, red for negative)
Trading Use: Helps spot areas where price behavior changes significantly (potential reversal zones).
3. Volume Clusters
Aggregates volume traded within each price zone
Visualized as colored backgrounds
Trading Use: Identifies high-volume nodes which often act as strong support/resistance.
4. Pressure Zones
Scores each zone based on where candles closed within the zone
Positive pressure (green) when candles closed in upper part
Negative pressure (red) when candles closed in lower part
Trading Use: Shows where buyers or sellers were more dominant at each price level.
5. Advanced Candle Pattern Detection
Tracks wick engulfing patterns
Measures body engulfing patterns
Counts rejection candles (long wicks)
Identifies dominant candles (large bodies)
Trading Use: Provides additional confirmation of potential reversal or continuation patterns.
6. Draggable Reference Line
Allows traders to place a horizontal line at any price level
Automatically shows statistics for the zone containing the line
Trading Use: Quickly analyze any price level's historical significance.
Practical Trading Applications
Support/Resistance Identification: The zones with highest candle counts typically represent strong support/resistance levels.
Breakout Trading: When price moves into zones with few previous candles, it may indicate breakout potential.
Reversal Trading: Zones where delta changes significantly (from positive to negative or vice versa) can signal potential reversals.
Volume-Weighted Analysis: Combining candle counts with volume clusters helps identify the most significant price levels.
Multi-Timeframe Analysis: By setting the custom timeframe to a higher period, traders can see where institutional levels exist on weekly/daily charts while trading on lower timeframes.
The indicator is particularly useful for traders who employ volume profile, market profile, or order flow concepts in their trading strategy. The visual presentation makes it easy to quickly assess the most significant price levels on any chart.

Candle Liquidity Algo [ValiantTrader]Explanation of the "Candle Liquidity Algo" Indicator
This indicator is designed to help traders identify potential trading opportunities by analyzing liquidity zones and divergences between price action and these zones on higher timeframes.
Key Components:
1. Timeframe Settings
The indicator allows you to select a custom timeframe (like 'D' for daily, '60' for 60 minutes, etc.)
It then displays the first candle of each new period on this higher timeframe directly on your chart
2. Liquidity Zones
Creates smoothed high and low levels (using a simple moving average) from the higher timeframe
These act as potential support/resistance zones where liquidity may be concentrated
3. Divergence Detection
Looks for divergences between price action and the liquidity zones:
Bullish Divergence: When price makes a lower low but the liquidity zone low is higher
Bearish Divergence: When price makes a higher high but the liquidity zone high is lower
4. Visual Elements
Plots the first candle of each new higher timeframe period on your chart (colored green for up, red for down)
Draws labels when divergences are detected (green "Bullish Div" below price for bullish divergences, red "Bearish Div" above for bearish)
Draws temporary lines marking the relevant price levels where divergences occur
5. Alerts
The indicator can trigger alerts when divergences are detected, which can be useful for traders who want notifications about potential trading setups
How to Use in Trading:
Identify the Higher Timeframe Structure: The indicator shows you how the higher timeframe is developing while you're looking at a lower timeframe chart.
Watch for Divergences: When you see:
Price making lower lows but liquidity zones making higher lows → potential bullish reversal
Price making higher highs but liquidity zones making lower highs → potential bearish reversal
Use Liquidity Zones as Targets/Stops: The smoothed high/low levels can act as potential take-profit areas or stop-loss levels.
Combine with Other Confirmation: Like any indicator, it's best used with other confirmation signals (price action patterns, volume analysis, etc.)
The indicator is particularly useful for traders looking to align their trades with higher timeframe structure while operating on lower timeframes for entry precision.

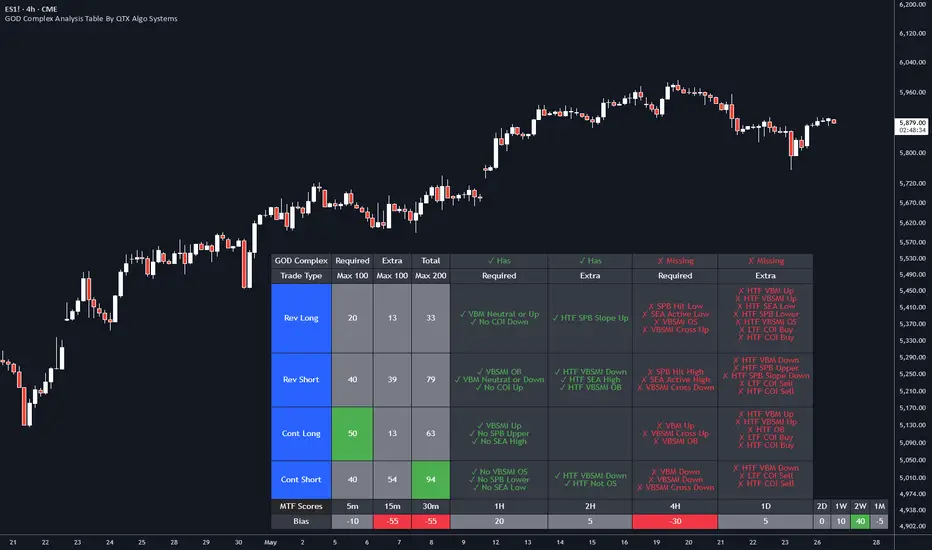
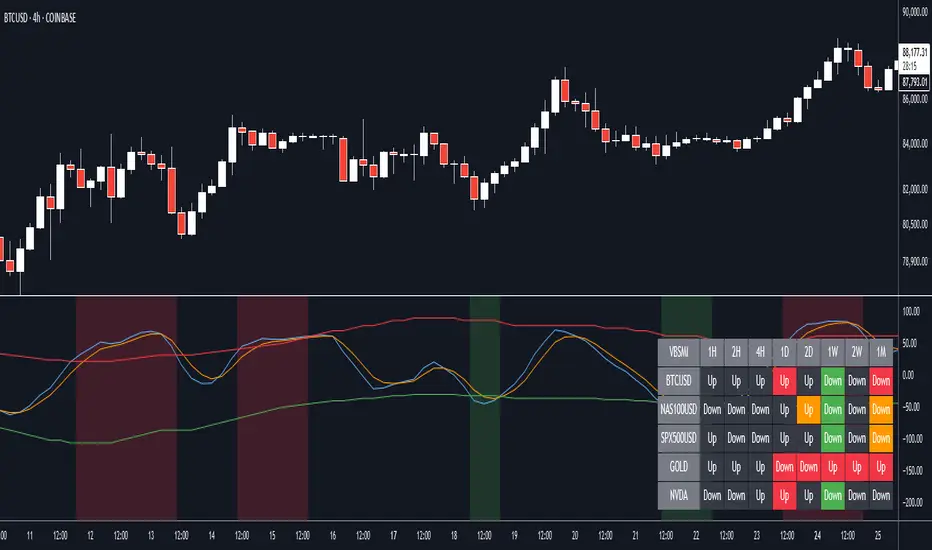
GOD Complex Analysis Table By QTX Algo SystemsGOD Complex Analysis Table by QTX Algo Systems
Overview
The GOD Complex Analysis Table is a powerful visual companion for traders using the GOD Complex ecosystem. It displays detailed confluence scores for each trade type (Reversal Long, Reversal Short, Continuation Long, Continuation Short), offering a breakdown of required vs. extra signals, as well as multi-timeframe (MTF) scores and bias.
This tool is designed to help discretionary traders better understand how multiple conditions across timeframes align to support high-quality trade setups. It is not a standalone signal generator but rather an advanced diagnostic table that reveals the logic driving the GOD Complex entries.
How It Works
Each row in the table represents a trade type (e.g., Reversal Long), and includes:
Required Score – Based on must-have conditions for that trade type (e.g., oversold levels, statistical extremes, key momentum shifts).
Extra Score – Bonus confluence points from higher timeframe agreement, slope shifts, or secondary confirmation indicators.
Total Score – Combined Required + Extra score (max 200), useful for comparing relative strength across trade types.
Breakdown Columns – Show exactly which conditions are currently satisfied or missing, categorized as Required or Extra.
MTF Scores – Score-based analysis across 5m to 1M timeframes, highlighting how confluence changes with zoomed-out perspectives.
MTF Bias Row – Net bullish vs. bearish confluence per timeframe (positive = green, negative = red).
Indicators Used (All Proprietary QTX Tools)
VBM (Volatility-Based Momentum): Confirms directional trend and volatility environment.
VBSMI (Volatility-Based SMI): Adapts momentum oscillator based on market conditions and tilt logic.
SEA (Statistically Extreme Areas): Identifies when price reaches statistically rare volatility/range zones.
SPB (Statistical Price Bands): Tracks dynamically adjusted support/resistance based on percentile deviation.
COI (Continuation Opportunity Indicator): Detects pullback exhaustion and momentum re-acceleration opportunities.
Each trade type (Reversal or Continuation) is scored based on these tools across local and higher timeframes.
Key Table Features
🔍 Reversal Scoring Logic
Reversal trades must meet key oversold/overbought criteria (e.g., VBSMI extremes, SEA/SPB triggers) and be supported by trend weakness or exhaustion in the COI/VBM logic. High confluence across timeframes boosts the score.
📈 Continuation Scoring Logic
Continuations require strong trend alignment (VBM, COI), confirmation of momentum (VBSMI cross + slope), and lack of statistical extremes (no SEA/SPB hits). HTF agreement increases the score further.
🧠 Multi-Timeframe (MTF) Scoring
MTF scores are generated by evaluating each trade type’s core confluence across timeframes (e.g., 5m, 1H, 1D, etc.). This helps traders gauge how well a setup aligns with the broader market structure.
📊 Bias Coloring
The MTF Bias row shows net directional strength. Green = bullish bias. Red = bearish bias. Gray = neutral.
🔎 Factors Breakdown
View factors for each trade type. These factors explain which required and extra conditions are currently contributing or missing.
Customization Options
Table position (top/bottom, left/right)
Table size (small, medium, large)
Show/hide trade type rows
Enable/disable breakdown details
Toggle MTF Score section
Use Cases
Analyze high-confluence setups for discretionary trade planning
Cross-check live trades to understand setup quality
Confirm MTF alignment before entries
Study historical patterns to build intuition and strategy
Disclaimer
This indicator is for educational purposes only. It does not provide financial advice or trade recommendations. Always backtest and validate strategies before use.
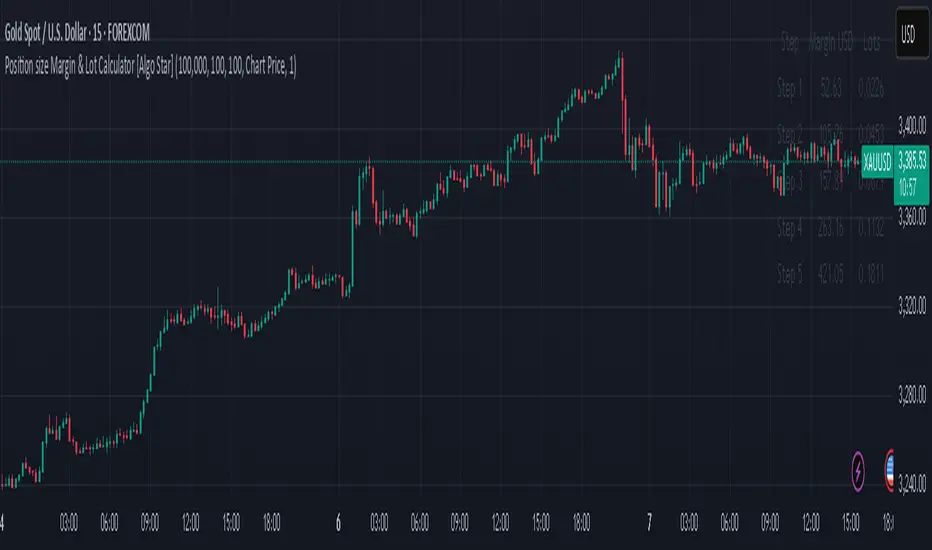
Position size Margin & Lot Calculator [Algo Star]Position Size Margin & Lot Calculator is a lightweight Pine v5 indicator that helps you scale into a trade with five incremental “steps.”
What it does:
Takes your total capital and leverage settings
Splits your risk into five proportioned entries
Shows both the USD margin required and the corresponding MT4/MT5 lot size for each entry
Why you’ll love it:
No manual calculations—everything is displayed in a neat on-chart table
Fully configurable: set your account size, leverage, contract size and price source
Ideal for pyramiding or averaging in with controlled risk at each step
Just add it to any chart, tweak your inputs, and immediately see exactly how much margin and how many lots to allocate at each of the five pre-defined steps—perfect for systematic position sizing without the headache.
OnePunch Algo Scalper V6Overview:
OnePunch Algo Scalper V6 is an invite-only script designed for short-term trend scalping and extreme reversal detection. It uniquely combines classic momentum and volume indicators, enhanced with multi-time session awareness, to deliver precise high-probability entry alerts.
Core Concepts:
RSI and CCI are used together to identify momentum exhaustion points for early reversal spotting.
CMF is integrated to filter buy signals only when volume flow confirms bullish intent, avoiding weak uptrends.
SMA overlays track medium to long-term trends to confirm direction bias for safer scalping entries.
MACD Histogram weakness detection adds a momentum weakening filter to confirm whether bullish/bearish pressure is losing strength — improving risk-reward setups.
Stochastic crossovers help predict short-term pullbacks, allowing for precision "Prepare for CALL/PUT" signals.
Session-based background coloring indicates high-probability trading windows (Morning, Midday, Afternoon), guiding users to focus on optimal times.
Signals Generated:
✅ "Trending Up": Momentum acceleration uptrend signal (RSI + CCI crossover with volume confirmation).
✅ "Trending Down": Momentum deceleration sell signal.
✅ "Reversal Up" / "Bearish Down": Extreme oversold/overbought reversals.
✅ "Prepare for PUTs/CALLs": Anticipation signals based on stochastic weakening + MACD histogram convergence.
Chart Setup:
The script draws clean shape labels on the chart for each event (e.g., "Up Trend", "Bearish") for clarity.
Background highlights show different sessions to help traders recognize the most liquid periods.
No other indicators are required on the chart.
Usage Notes:
This script is ideal for scalping or short intraday swing trades on liquid assets like indices, crypto, or forex.
Best results when combined with manual Support/Resistance marking (use "Prepare for PUTs/CALLs" near S/R zones).

VBSMI Strategy by QTX Algo SystemsVolatility Based SMI Strategy by QTX Algo Systems
Overview
The Volatility Based SMI Strategy transforms our popular VBSMI with Dynamic Bands indicator into a fully automated strategy that traders can backtest inside TradingView. It retains all core logic from the indicator—including adaptive volatility scaling and trend-based overbought/oversold thresholds—but adds two configurable entry methods, exit conditions, and a dual-mode trade execution engine.
This script is published separately from the VBSMI indicator because some traders use VBSMI as a confluence tool within their existing system, while others prefer a rules-based strategy that can be simulated, optimized, and tracked over time. This script serves the latter use case.
How It Works
Like the original indicator, this strategy uses:
Double-Smoothed SMI Calculation: Based on smoothed momentum using EMA of the relative and full range.
Adaptive Volatility Scaling: Uses a normalized BBWP-based factor to reflect current market volatility.
Dynamic Band Adjustment: Trend direction and strength shift overbought/oversold levels upward or downward.
Band Tilt & Compression Controls: Inputs allow users to define how aggressively the bands shift with trend conditions.
What’s different is the strategy layer—you now choose from two types of entry and exit logic, and two execution styles.
🛠️ Entry & Exit Modes
There are two logic modes for both entry and exit, allowing you to adapt the strategy to your own philosophy:
Cross Mode (SMI Crosses EMA):
Entry: Buy when SMI crosses above its EMA
Exit: Close when SMI crosses below its EMA
Exit OB/OS Mode (Band Exit Logic):
Entry: Buy when price exits dynamic oversold zone (crosses back above tilted oversold band)
Exit: Close when price exits dynamic overbought zone (crosses back below tilted overbought band)
You can mix and match the modes (e.g., enter on Cross, exit on Band Exit).
⚙️ Spot vs. Leverage Mode
Spot Mode
Designed for traders who prefer long-only setups
Enters a long position and holds until the exit condition is met
Prevents overlapping trades—ensures only one position at a time
Leverage Mode
Designed for those testing bi-directional systems (e.g., long/short switching)
Automatically flips between long and short entries depending on the signals
Useful for testing symmetrical strategies or inverse conditions
Both modes work across any asset class and timeframe.
Customization Options
Users can adjust:
Smoothing K/D: Controls how fast or slow the momentum reacts
SMI EMA Length: Determines the responsiveness of the signal line
Trend Lookback Period: Influences how stable the dynamic band tilt is
Band Tilt & Compression Strengths: Refines how far bands adjust based on trend
Entry/Exit Logic Type: Choose between “Cross” or “Exit OB/OS” logic
Trading Mode: Select either "Spot" or "Leverage" depending on your use case
Why It’s Published Separately
This script is not a cosmetic or minor variation of the original indicator. It introduces:
Entry/exit logic
Order execution
Strategy testing capabilities
Mode selection (Spot vs. Leverage)
Signal logic control (Cross vs. Band Exit)
Because the original VBSMI indicator is widely used as a charting and confirmation tool, converting it into a strategy changes how it functions. This version is intended for strategy evaluation and automation, while the original remains available for discretionary and visual use.
Use Cases
This strategy is best suited for:
Evaluating VBSMI-based signals in backtests
Comparing entry and exit logic over time
Testing setups on different assets and timeframes
Automating VBSMI-based logic in a structured and risk-aware framework
Disclaimer
This strategy is for educational purposes only. It does not guarantee future results or profitability. Always test in simulation before using any strategy live, and use proper risk management and trade discipline.

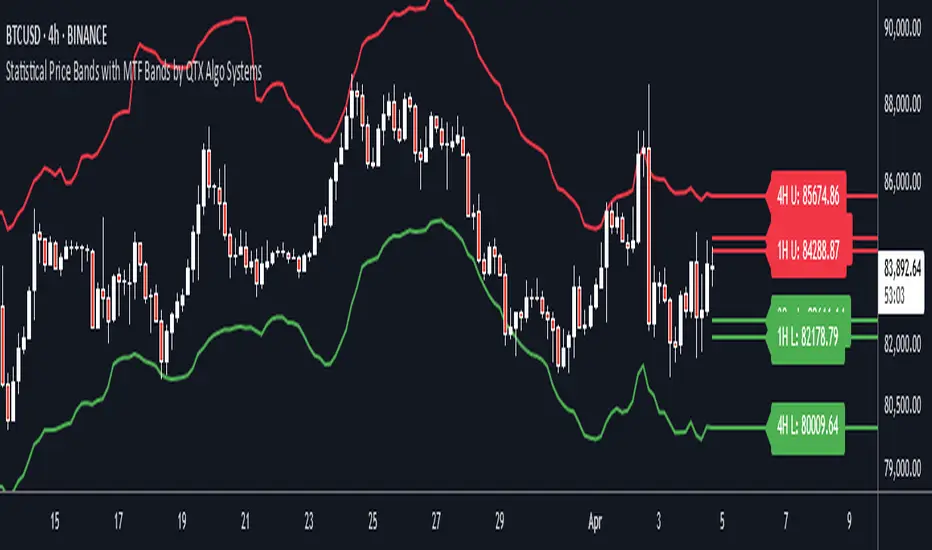
Statistical Price Bands with MTF Bands by QTX Algo SystemsStatistical Price Bands with MTF Bands by QTX Algo Systems
Overview
This indicator builds on the original Statistical Price Bands with Trend Filtering script by introducing Multi-Timeframe (MTF) Band Visualization. While the base version calculated adaptive price bands using statistical percentiles, trend filtering, and volatility adjustments, this enhanced version adds support/resistance bands from multiple timeframes onto the current chart.
This is not a minor cosmetic update. The MTF version includes additional request.security() logic and significantly increases context by allowing traders to reference band extremes from longer or shorter timeframes without switching charts. For this reason, the original and MTF versions are maintained separately, as this script requires a Pro+ or Premium TradingView plan to function correctly.
What’s New in This Version
Multi-Timeframe Band Support: Fetches and displays upper and lower bands from other timeframes (e.g., 30min, 1H, 4H, 1D, 1W, 1M).
Chart-Based MTF Labels: Each band is labeled with its source timeframe (e.g., “1D U” = 1-Day Upper Band) for easy visual reference.
Custom Timeframe Control: Users can toggle specific timeframes on/off depending on their preferences and strategy.
Core Calculation Method (Unchanged)
Statistical Percentile Calculation:
Determines upper and lower thresholds using a historical percentile method applied to price deviations from a VWMA anchor.
Volatility Adjustment:
Dynamically scales the percentile thresholds based on a volatility factor (standard deviation vs. moving average).
Trend Filtering:
Adds a directional bias based on whether price is above or below its VWMA, pushing the bands higher in uptrends and lower in downtrends.
MTF Band Integration
This version calculates additional statistical bands using the same logic as the chart’s timeframe, but applies it to other timeframes selected by the user. These values are fetched using request.security() and then plotted onto the current chart using lines and labels.
This functionality allows traders to:
See if current price is extended compared to higher timeframe extremes.
Spot trend continuation or exhaustion relative to intraday or macro levels.
Identify areas of confluence for trade entries, exits, or stop placement.
Inputs & Customization
Statistical Percentile (default: 95)
Controls how extreme the bands are. Higher values = wider bands.
Lookback Period (default: 350)
Number of bars used to calculate percentiles. Longer = smoother bands.
VWMA Length (default: 20)
Sets the moving average anchor for calculating relative price deviation.
Volatility Factor Multiplier (default: 1.0)
Scales the influence of market volatility on band width.
Trend Strength Multiplier (default: 10.0)
Adjusts how far bands shift in the direction of the trend.
Timeframe Toggles (MTF)
Select which timeframes (e.g., 1H, 4H, 1D, 1W) to show on the chart.
Label Offset
Controls how far right MTF labels appear on the chart.
Use Case Scenarios
Overextension Detection:
Price touching or breaching an MTF band may suggest exhaustion, especially if confirmed by confluence or divergence.
Trend Confirmation:
Bands tilting in one direction across multiple timeframes can suggest strong trend alignment.
Risk Management:
Use bands from higher timeframes as trailing stops or invalidation zones.
Why This Is a Separate Script
This version uses request.security() to retrieve values from multiple timeframes, which:
Requires an upgraded TradingView plan (Pro+ or higher).
May impact performance on lower-tier plans.
Provides a major functional difference from the original, not a minor tweak or cosmetic upgrade.
To maintain compatibility and accessibility for all users, both versions are published separately:
The original for single-timeframe users.
This version for those using a multi-timeframe workflow.
Disclaimer
This script is for educational purposes only. It is intended to support your analysis—not to predict outcomes or replace risk management. Past performance is not indicative of future results. Always perform your own analysis and trade responsibly.
VBSMI with Dynamic Bands and MTF Screener by QTX Algo SystemsVolatility Based SMI with Dynamic Bands & MTF Screener by QTX Algo Systems
Overview
This enhanced version of the Volatility Based SMI with Dynamic Bands (VBSMI) expands on the original design by integrating a Multi-Timeframe (MTF) Screener. It maintains the core momentum detection and volatility-responsive adjustments of the standard VBSMI while providing expanded multi-timeframe analysis across multiple assets in a tabular format.
By allowing users to track momentum shifts, reversals, and trend conditions across multiple timeframes and multiple assets, this version enhances market awareness and helps traders make more informed decisions.
How It Works
Enhanced SMI Calculation
The core SMI calculation uses double smoothing through Exponential Moving Averages (EMAs) to refine price movements.
Inputs for Smoothing K and Smoothing D control how much noise is filtered.
A final SMI EMA is applied to help confirm momentum direction.
Adaptive Volatility Scaling
A fixed Bollinger Band Width Percentile (BBWP) calculation is used to create an Adaptive Adjustment Factor for the SMI.
This ensures the oscillator adapts to current volatility levels, making signals more context-aware.
Dynamic Threshold Adjustment
The overbought and oversold thresholds (default 50 and -50) adjust in real time based on market conditions.
These adjustments use three proprietary factors:
Trend Lookback Period – Determines historical trend strength using a VWMA-based comparison.
Upper & Lower Band Tilt Strength – Controls how aggressively the bands shift in response to trends.
Opposite Band Compression – Adjusts the speed of threshold contraction when trends reverse, making it more responsive.
Multi-Timeframe and Multi-Asset Screener (MTF) – New Feature
The integrated MTF Screener provides a real-time overview of the VBSMI's conditions across multiple timeframes and assets.
It includes:
✅ User-selectable timeframes (Default: 1H, 4H, 1D, 3D, 1W, 1M).
✅ Up to 6 additional tickers for multi-asset analysis.
✅ Real-time VBSMI color-coded conditions for easier signal interpretation.
How to Read the MTF Screener Table
Each cell in the table provides a momentum reading based on VBSMI conditions in different timeframes:
🟢 Green Background → Oversold Condition (Potential Buy Zone)
🔴 Red Background → Overbought Condition (Potential Sell Zone)
📊 Label: "Up" or "Down" → Shows whether VBSMI is above or below its EMA.
🟠 Orange Background → VBSMI crossovers from oversold/overbought conditions
How to Use & Adjust Inputs
Momentum Confirmation & Reversals
Use the dynamically adjusting thresholds to confirm when momentum is overextended or entering a new trend phase.
Monitor crossovers between the SMI and its EMA—these can be potential reversal or trend continuation signals.
Multi-Timeframe Trend Confirmation
Look for alignment across multiple timeframes in the MTF Screener (e.g., if the 1H, 4H, and 1D all show green, it strengthens a bullish case).
Use the multi-ticker feature to see how different assets align with your primary asset’s momentum signals.
Fine-Tuning the Inputs
Smoothing K & D: Controls how much the SMI is smoothed. Lower values make the indicator respond faster but can introduce noise, while higher values produce smoother signals with a slight delay.
SMI EMA Length: Adjusts the sensitivity of the exponential moving average applied to the SMI. A lower value makes the EMA react more quickly, while a higher value slows it down for more stable signals.
Trend Lookback Period: Defines how far back the indicator looks to assess trend strength. A shorter lookback makes it more reactive to recent price movements, while a longer period smooths out fluctuations for a broader trend perspective.
Band Tilt Strengths: Determines how much the overbought and oversold levels shift in response to market trends. Increasing this value causes the thresholds to adjust more aggressively, making the indicator more sensitive to trend direction.
Opposite Band Compression: Controls how quickly the opposite band contracts when a trend reversal occurs. A higher value results in faster compression, making the indicator more responsive to sudden market shifts.
What Makes This Unique?
Unlike traditional Stochastic Momentum Index (SMI) indicators, which rely on fixed overbought/oversold levels, this version:
✔ Adjusts the SMI based on relevant volatility
✔ Adapts thresholds based on volatility & trend strength
✔ Incorporates multi-timeframe screening for trend confirmation
✔ Uses an MTF table for real-time, multi-asset tracking
Disclaimer
This indicator is for educational purposes only and is meant to support trading strategies—not replace independent analysis.
No financial guarantees are provided. Past performance does not guarantee future results. Always use proper risk management.
Extreme Areas with MTF Screener by QTX Algo SystemsStatistically Extreme Areas with MTF Screener by QTX Algo Systems
Overview
This indicator is designed to automatically highlight zones where prices become statistically overextended, signaling potential reversal opportunities. Enhanced with a Multi Time Frame (MTF) Screener, it verifies these extremes across several timeframes for a comprehensive, multi-dimensional view of market conditions.
How It Works
Baseline Statistical Analysis:
The indicator establishes a baseline price range using historical data through a statistical percentile approach. This baseline reflects typical price extremes over time.
Volatility and Momentum Filters:
It incorporates a Bollinger Band Width Percentile (BBWP) to measure real-time volatility and combines this with a double‐smoothed SMI and a Price – Moving Average Ratio (PMARP) to assess short-term momentum. This dual-filter system ensures that signals are generated only when both volatility and momentum conditions are satisfied.
Directional Oscillator (BBO) Analysis:
A Bollinger Band Oscillator (BBO) is used to evaluate the slopes of the upper and lower bands, adding an extra layer of confirmation for identifying true market extremes.
MTF Screener Integration:
The added MTF Screener scans multiple timeframes, confirming that the statistically extreme conditions are not isolated events. This cross-verification provides a more robust signal, ensuring that the identified reversal zones are consistent across the market.
Customizable Visual Alerts:
The indicator allows for customizable color coding for various conditions (e.g., extreme low warnings, extreme high warnings, and potential reversals), offering clear, visual guidance for traders.
Why It’s Different and Valuable
This tool is more than just a simple merger of common indicators—it’s a carefully integrated system that validates price extremes across several dimensions. By combining statistical analysis with real-time volatility, momentum verification, and multi-timeframe confirmation, it provides a dynamic framework that helps traders identify high-probability reversal zones while minimizing false signals. The added MTF Screener ensures that these signals are consistent and reliable across different market views, enhancing the overall decision-making process.
How to Use
Monitor Visual Cues: Look for the color-coded signals that indicate statistically extreme price levels.
Confirm Across Timeframes: Use the MTF Screener component to ensure that the extreme conditions appear consistently across various timeframes.
Integrate with Your Strategy: Use this indicator alongside other technical tools to refine entry, exit, and stop-loss decisions.
Disclaimer
This indicator is for educational purposes only and is intended to support your trading analysis. It does not guarantee performance, and past results are not indicative of future outcomes. Always use proper risk management and conduct your own analysis before trading.

Volatility Based Momentum with MTF Screener by QTX Algo SystemsVolatility Based Momentum with MTF Screener by QTX Algo Systems
Overview
This indicator builds on our original Volatility Based Momentum tool by integrating a Multi Time Frame (MTF) Screener that provides real-time, cross-market momentum analysis. It dynamically adjusts momentum signals using adaptive volatility measurements, ensuring that signals reflect true market strength across various timeframes and assets.
How It Works
Core Momentum Analysis:
The indicator uses a double‐smoothed SMI combined with a Price – Moving Average Ratio (PMARP) to assess short-term momentum. These metrics filter out noise and generate per-candle signals based on sustained market energy.
Adaptive Volatility Measurement:
An adaptive volatility factor—derived from a Bollinger Band Width Percentile (BBWP) calculation—scales the momentum readings, ensuring that only strong signals in a sufficiently volatile market are considered.
MTF Screener Integration:
The MTF Screener scans multiple timeframes simultaneously, confirming that a momentum signal is consistent across different market views. This extra layer of screening reduces false signals and helps ensure that the detected momentum is robust and reliable.
Real-Time Visual Feedback:
Dynamic visual cues, such as color changes and signal markers, indicate when the momentum and volatility align, providing a clear, actionable overview.
Why It’s Different and Valuable
This indicator isn’t just a simple overlay of standard momentum and volatility measures—it’s a multi-layered system that verifies signals across multiple timeframes. The integrated MTF Screener provides broader context and cross-validation, making it a more dependable tool for confirming trend strength. This level of depth in analysis offers enhanced clarity and helps traders make more confident decisions compared to using conventional indicators in isolation.
How to Use
Review Per-Candle Signals: Observe the momentum signals generated on your chart and note when they are confirmed by the adaptive volatility measure.
Cross-Check with MTF Screener: Ensure that signals appear consistently across multiple timeframes before taking action.
Adjust Settings for Your Style: Customize the volatility threshold, and MTF settings to match your specific trading approach.
Integrate with Your Strategy: Use the insights from this indicator alongside other analysis tools to optimize your entry and exit points.
Disclaimer
This indicator is for educational purposes only and is intended to support your trading strategy. It does not guarantee performance, and past results are not indicative of future outcomes. Always apply proper risk management and conduct your own analysis before trading.

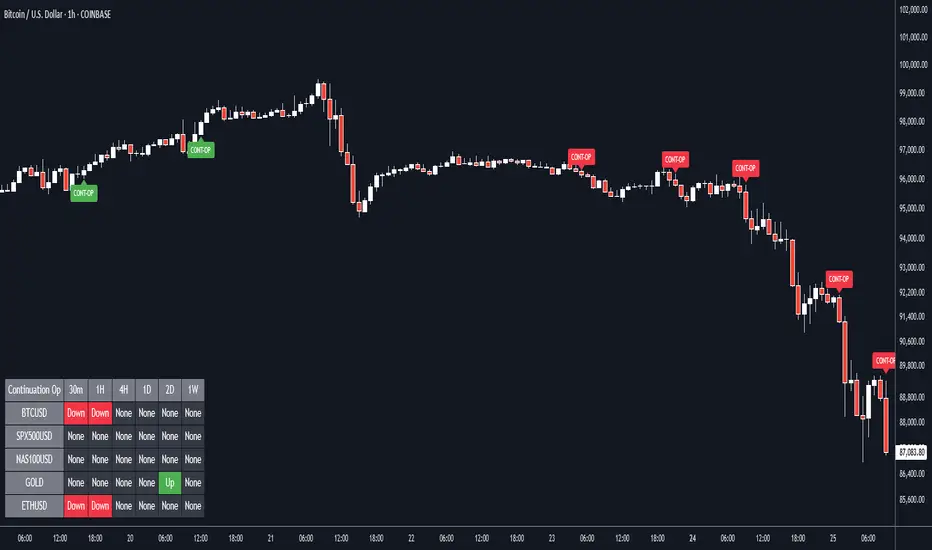
Continuation Opportunity with MTF Screener by QTX Algo SystemsContinuation Opportunity Indicator with MTF Screener by QTX Algo Systems
Overview
This enhanced indicator is designed to pinpoint key moments when an established trend is likely to continue. By combining traditional momentum analysis with dual volatility measures—and now integrating a powerful Multi Time Frame (MTF) Screener—it offers a multi-dimensional view of trend behavior. This tool not only detects when a pullback is simply a temporary consolidation (characterized by reduced volatility) but also confirms that the overall trend is poised to resume, validated across several timeframes.
How It Works
Core Methodology:
The base indicator uses a double‐smoothed Stochastic Momentum Index (SMI) combined with a Price – Moving Average Ratio (PMARP) to detect momentum crossovers that signal trend continuation. It also uses volatility filters to ensure that the signals occur only when market activity is strong.
Dual Volatility Analysis:
A Bollinger Band Width Percentile (BBWP) measure and historical volatility metrics work together to ensure that only meaningful pullbacks trigger signals—distinguishing between noise and genuine consolidation.
MTF Screener Integration:
The new MTF Screener feature extends the analysis beyond a single timeframe. It scans multiple assets and timeframes concurrently, confirming that a detected pullback or resumption signal appears consistently across the broader market view. This cross-verification minimizes false signals and provides traders with confidence that the trend continuation is robust.
Enhanced Visual Cues:
Color-coded backgrounds and well-defined signal triggers help traders quickly interpret when a pullback is likely just a consolidation phase and when increased volatility signals the trend’s resumption.
Why It’s Different and Valuable
Unlike a simple combination of separate indicators, this tool integrates each element in a systematic, layered approach. The MTF Screener adds an extra dimension by validating signals across different timeframes—ensuring that traders are not basing decisions on isolated, potentially misleading data. This cohesive design enhances overall accuracy and provides actionable insights that are more robust than what individual indicators would offer on their own.
How to Use
Monitor Visual Signals: Look for color-coded cues and momentum crossovers that appear after a pullback.
Validate Across Timeframes: Use the MTF Screener’s output to confirm that the continuation signal is consistent across various timeframes.
Integrate with Other Tools: Combine these signals with your existing technical analysis methods to refine your entry and exit points.
Disclaimer
This indicator is provided for educational purposes only and is intended to support your trading analysis. It does not guarantee performance, and past results are not indicative of future outcomes. Always use proper risk management and perform your own analysis before trading.
Statistically Extreme Areas by QTX Algo SystemsStatistically Extreme Areas by QTX Algo Systems
Overview
This indicator helps traders pinpoint potential reversal zones by detecting when prices become statistically overextended. By combining advanced statistical analysis with volatility and momentum metrics—including BBWP, SMI, PMARP, and Bollinger Band Oscillator (BBO) slope analysis—it provides clear visual cues for identifying market extremes and managing risk.
How It Works
Baseline Statistical Calculation:
The indicator starts by establishing a baseline price range using historical data through a statistical percentile approach. This captures the typical extremes over a significant period and forms the foundation for further analysis.
Volatility Adjustment:
A Bollinger Band Width Percentile (BBWP) measure is used to assess recent price variability. This dynamic volatility factor adjusts the baseline, ensuring that signals are only generated when overall market volatility exceeds a minimum threshold.
Momentum and Trend Verification:
A double‐smoothed Stochastic Momentum Index (SMI) captures short-term momentum, while a Price – Moving Average Ratio (PMARP) confirms the prevailing trend's strength. Additionally, a Bollinger Band Oscillator (BBO) calculates the slopes of the upper and lower bands to further refine the detection of extreme conditions without relying solely on a simple mashup of standard indicators.
Why It's Different
Rather than merely merging common indicators, this tool integrates distinct layers of analysis to produce a cohesive and dynamic framework. The synthesis of statistical extremes, real-time volatility adjustments, and momentum/trend verification helps filter out noise and false signals, offering traders a robust method to identify reversal zones and set precise stop-loss levels. This multi-dimensional approach delivers actionable insights that go beyond what traditional support/resistance or momentum indicators can offer on their own.
How to Use
Interpret the Visual Cues:
Watch for the color-coded background changes that signal statistically extreme conditions.
Integrate with Your Analysis:
Use these visual alerts alongside other technical tools to refine your entry and exit decisions and to enhance your overall risk management.
Disclaimer
This indicator is for educational purposes only and is intended to support your trading analysis. It does not guarantee performance, and past results are not indicative of future outcomes. Always use proper risk management and perform your own analysis before trading.
