Trading bot gridsGuide: Price Lines – Arithmetic vs. Geometric
This script draws horizontal price lines (grids) between a start price and an end price.
You can choose whether the lines are distributed evenly (arithmetic) or by percentage (geometric).
🔧 Inputs
Start Price → Lower or upper boundary of the price range.
End Price → Opposite boundary of the price range.
Number of Lines → Total number of lines to be drawn between the start and end prices.
Distribution →
Arithmetic: Fixed USDT distance between each line.
Geometric: Fixed percentage distance between each line.
Grid Color → Color of the drawn lines.
📈 How it Works
The script calculates the lower (lo) and upper (hi) boundaries, regardless of which is entered first.
Arithmetic distribution: Each line is spaced by a fixed amount in USDT.
Geometric distribution: Each line is spaced by the same percentage difference from the previous one.
Lines are created only once at the first bar and remain on the chart.
All lines are extended across the entire visible chart.
💡 Tips
Useful for Grid Bot backtesting or visualizing price zones.
Works for both long and short price ranges.
In geometric mode, lines appear closer together near the lower price range and farther apart toward the upper range.
Tìm kiếm tập lệnh với "backtest"

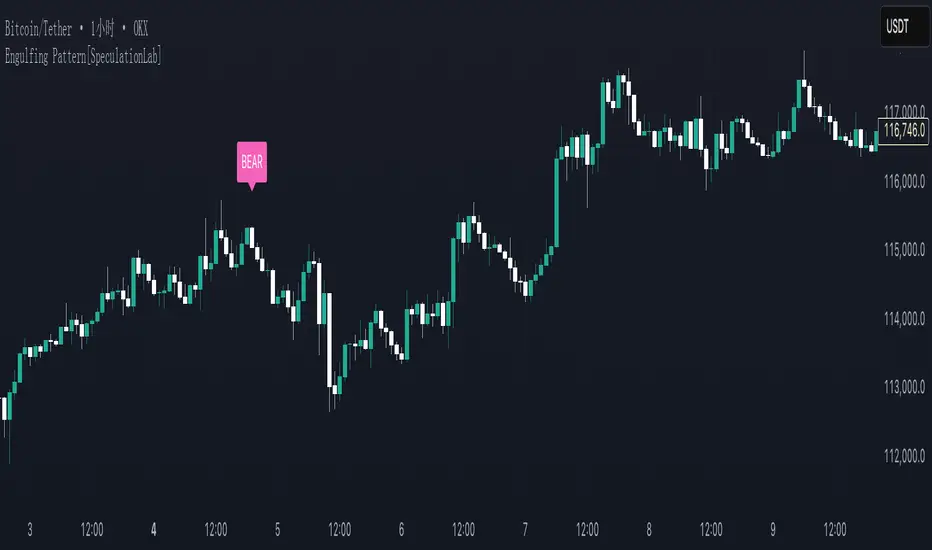
Engulfing Pattern[SpeculationLab]Overview
This script detects two types of engulfing / outer bar patterns and marks them directly on the chart:
Body Engulfing – The current candle’s body range (open–close) completely covers the entire range (high–low) of the previous candle.
Range Engulfing – The current candle’s full range (high–low, including wicks) completely covers the entire range (high–low) of the previous candle.
Direction logic:
Bull – The previous candle is bearish and the selected engulfing rule is met.
Bear – The previous candle is bullish and the selected engulfing rule is met.
Optional: Require the current candle to have the opposite color of the previous one.
This is an open-source pattern recognition tool for learning, backtesting, and chart review. It is not financial advice.
Key Features
Two detection modes:
body – Body engulfs previous entire range
range – Wicks engulf previous entire range
Direction detection based on the previous candle’s color, with optional opposite-color confirmation
Chart markers: “BULL” /“BEAR” above bars
Alert-ready: built-in conditions for bullish and bearish engulfing patterns
Parameters
Engulfing Type: body / range
body: Current body must fully cover the previous candle’s high–low range
range: Current full range (high–low) must fully cover the previous candle’s high–low range
Require Opposite Previous Candle (default: off):
When enabled, the engulfing pattern must also have the opposite color from the previous candle to trigger
Usage Tips
Engulfing patterns are price action structures; combine with trend, key levels, and volume for context
Signals confirm on bar close (barstate.isconfirmed) to reduce repainting
Can be used with personal risk management rules (stop-loss, take-profit, filters)
Disclaimer
For educational and research purposes only – not financial advice
Past performance of patterns does not guarantee future results
Trading involves risk; always manage it responsibly
This script is open-source – feel free to learn from or modify it, but credit the original source and author (SpeculationLab)
脚本简介
本脚本用于识别两类包裹/外包形态,并在图表上以标记提示:
Body(实体包裹):当前K线的实体区间(开—收)完全覆盖上一根K线的整个区间(上一根的高—低)。
Range(影线外包):当前K线的影线区间(高—低)完全覆盖上一根K线的整个区间(上一根的高—低)。
方向判定:
Bull(多):上一根为阴线且满足所选包裹规则;
Bear(空):上一根为阳线且满足所选包裹规则;
可选项:要求“当前K线颜色与上一根相反”后再确认(见参数)。
本脚本为开源形态识别工具,适合技术分析学习、回测与复盘,不构成任何投资建议。
主要功能
两种识别模式:body(实体包裹上一根整段) / range(影线包裹上一根整段)。
方向识别:按上一根K线颜色判断多空;可选“当前颜色与上一根相反”的二次确认。
图表提示:plotshape 在K线上方标注 “BULL / BEAR”。
提醒支持:内置 Bullish Engulf / Bearish Engulf 提醒条件。
参数说明
Engulfing Type:body / range
body:当前实体须完全覆盖上一根的高—低整段;
range:当前高—低须完全覆盖上一根的高—低整段。
Require Opposite Previous Candle(默认关闭):
开启后,除满足包裹规则外,还需当前K线颜色与上一根相反才触发标记。
使用建议
包裹/外包是价格行为结构,建议结合趋势、关键价位、成交量等因素综合判断。
信号在收盘时确认(barstate.isconfirmed),以减少重绘干扰。
可与个人风格的风险控制规则(止损、止盈、过滤条件)配合使用。
合规与免责声明
本脚本仅用于技术研究与学习,不构成任何形式的投资建议或收益承诺。
历史形态并不代表未来结果,交易有风险,请自行评估并承担责任。
本脚本开源,欢迎学习与二次开发;转载或改用请注明来源与作者(SpeculationLab / 投机实验室)。
Enhanced RSI KDE | Advanced FiltersThis is an enhanced version of the excellent RSI (Kernel Optimized) indicator originally created by @fluxchart. Full credit goes to fluxchart for the innovative KDE (Kernel Density Estimation) concept and the solid foundation that made this enhancement possible.
🙏 CREDITS & ACKNOWLEDGMENTS
Original Creator: @fluxchart - RSI (Kernel Optimized)
Original Concept: Kernel Density Estimation applied to RSI pivot analysis
Enhancement: Advanced filtering system and signal optimization- profitgang
License: Mozilla Public License 2.0
🚀 WHAT'S NEW IN THIS ENHANCED VERSION
Building upon fluxchart's brilliant KDE RSI foundation, this version adds:
🔥 Advanced Filtering System:
Multi-Timeframe Confluence - Confirms signals across higher timeframes
Volume Confirmation - Only signals on above-average volume
Volatility Range Filter - Avoids signals in choppy or extreme conditions
Trend Context Analysis - Considers overall market direction
Adaptive Pivot Detection - Adjusts sensitivity based on market volatility
🎯 Signal Quality Improvements:
Confluence Scoring - Each signal gets a quality score (1-6)
Label Cooldown System - Prevents chart clutter with smart spacing
Higher Activation Thresholds - More selective signal generation
Risk Management Integration - Auto stop-loss and take-profit levels
📊 Enhanced Dashboard:
Real-time filter status monitoring
KDE probability percentages
Confluence scores for both directions
Volume and volatility readings
⚙️ HOW IT WORKS
The indicator maintains fluxchart's core KDE methodology:
Collects RSI values at historical pivot points
Creates probability density functions using Gaussian/Uniform/Sigmoid kernels
Identifies high-probability zones for potential reversals
NEW: Multiple filters must align before generating signals, dramatically reducing false positives while maintaining the accuracy of high-probability setups.
🎛️ RECOMMENDED SETTINGS
Confluence Score: 5/6 (very selective)
Activation Threshold: Medium or High
Multi-Timeframe: Enabled with 2/2 alignment
Volume Filter: Enabled (1.5x threshold)
All other filters: Enabled for maximum quality
📈 BEST USE CASES
Swing Trading - Higher timeframe confirmation reduces whipsaws
Quality over Quantity - Fewer but much higher probability signals
Risk Management - Built-in stop/target levels for each signal
Multi-Asset Analysis - Works on stocks, crypto, forex, commodities
⚠️ IMPORTANT NOTES
This is a quality-focused indicator - expect fewer but better signals
Backtest thoroughly on your specific assets and timeframes
The original fluxchart indicator remains excellent for different trading styles
Consider this an alternative approach, not a replacement
🤝 COLLABORATION & FEEDBACK
Special thanks to @fluxchart for creating the original innovative KDE RSI concept. This enhancement wouldn't exist without that solid foundation.
Feel free to suggest improvements or share your results! The goal is to build upon great work in the community.

Intraday Volume Pulse GSK-VIZAG-AP-INDIAIntraday Volume Pulse Indicator
Overview
This indicator is designed to track and visualize intraday volume dynamics during a user-defined trading session. It calculates and displays key volume metrics such as buy volume, sell volume, cumulative delta (difference between buy and sell volumes), and total volume. The data is presented in a customizable table overlay on the chart, making it easy to monitor volume pulses throughout the session. This can help traders identify buying or selling pressure in real-time, particularly useful for intraday strategies.
The indicator resets its calculations at the start of each new day and only accumulates volume data from the specified session start time onward. It uses simple logic to classify volume as buy or sell based on candle direction:
Buy Volume: Assigned to green (up) candles or half of neutral (doji) candles.
Sell Volume: Assigned to red (down) candles or half of neutral (doji) candles.
All calculations are approximate and based on available volume data from the chart. This script does not incorporate external data sources, order flow, or tick-level information—it's purely derived from standard OHLCV (Open, High, Low, Close, Volume) bars.
Key Features
Session Customization: Define the start time of your trading session (e.g., market open) and select from common timezones like Asia/Kolkata, America/New_York, etc.
Volume Metrics:
Buy Volume: Total volume attributed to bullish activity.
Sell Volume: Total volume attributed to bearish activity.
Cumulative Delta: Net difference (Buy - Sell), highlighting overall market bias.
Total Volume: Sum of all volume during the session.
Formatted Display: Volumes are formatted for readability (e.g., in thousands "K", lakhs "L", or crores "Cr" for large numbers).
Color-Coded Table: Uses a patriotic color scheme inspired by general themes (Saffron, White, Green) with dynamic backgrounds based on positive/negative values for quick visual interpretation.
Table Options: Toggle visibility and position (top-right, top-left, etc.) for a clean chart layout.
How to Use
Add to Chart: Apply this indicator to any symbol's chart (works best on intraday timeframes like 1-min, 5-min, or 15-min).
Configure Inputs:
Session Start Hour/Minute: Set to your market's open time (default: 9:15 for Indian markets).
Timezone: Choose the appropriate timezone to align with your trading hours.
Show Table: Enable/disable the metrics table.
Table Position: Place the table where it doesn't obstruct your view.
Interpret the Table:
Monitor for spikes in buy/sell volume or shifts in cumulative delta.
Positive delta (green) suggests buying pressure; negative (red) suggests selling.
Use alongside price action or other indicators for confirmation—e.g., high total volume with positive delta could indicate bullish momentum.
Limitations:
Volume classification is heuristic and not based on actual order flow (e.g., it splits doji volume evenly).
Data accumulation starts from the session time and resets daily; historical backtesting may be limited by the max_bars_back=500 setting.
This is for educational and visualization purposes only—do not use as sole basis for trading decisions.
Calculation Details
Session Filter: Uses timestamp() to define the session start and filters bars with time >= sessionStart.
New Day Detection: Resets volumes on daily changes via ta.change(time("D")).
Volume Assignment:
Buy: Full volume if close > open; half if close == open.
Sell: Full volume if close < open; half if close == open.
Cumulative Metrics: Accumulated only during the session.
Formatting: Custom function f_format() scales large numbers for brevity.
Disclaimer
This script is for educational and informational purposes only. It does not provide financial advice or signals to buy/sell any security. Always perform your own analysis and consult a qualified financial professional before making trading decisions.
© 2025 GSK-VIZAG-AP-INDIA

13/48 EMA Trading Scalper (ATR TP/SL)13/48 EMA Trading Scalper (ATR TP/SL)
What it does:
This tool looks for price “touches” of the 13-EMA, only takes CALL entries when the 13 is above the 48 (uptrend) and PUT entries when the 13 is below the 48 (downtrend), and confirms with a simple candle pattern (green > red with expansion for calls, inverse for puts). Touch sensitivity is ATR-scaled, so signals adapt to volatility. Each trade gets auto-drawn entry, TP, and SL lines, colored labels with $ / % distance from entry, plus optional TP/SL hit alerts. A rotating color palette and per-bar label staggering help keep the chart readable. Old objects are auto-pruned via maxTracked.
How it works
Trend filter: 13-EMA vs 48-EMA.
Entry: ATR-scaled touch of the 13-EMA + candle confirmation.
Risk: TP/SL = ATR multiples you control.
Visuals: Entry/TP/SL lines (extend right), vertical entry marker (optional), multi-line labels.
Hygiene: maxTracked keeps only the last N trades’ objects; labels are staggered to reduce overlap.
Alerts: Buy Call, Buy Put, Take Profit Reached, Stop Loss Hit.
Key Inputs
Fast EMA (13), Trend EMA (48), ATR Length (14)
Touch Threshold (x ATR) – how close price must come to the EMA
Take Profit (x ATR), Stop Loss (x ATR)
maxTracked – number of recent trades to keep on chart
Tips
Start with Touch = 0.10–0.20 × ATR; TP=2×ATR, SL=1×ATR, then tune per symbol/timeframe.
Works on intraday and higher TFs; fewer, cleaner signals on higher TFs.
This is an indicator, not a broker—always backtest and manage risk.
CTA-min D1 — Donchian 55/20 Trend Breakout (ATR Risk)What it is
A clean, daily trend-following breakout inspired by classic CTA/Turtle logic. It buys strength and sells weakness, then lets winners run with a channel-based trailing stop. No curve-fitting, no clutter—just rules.
How it trades
Timeframe: Daily (D1)
Entry: Close breaks the previous 55-bar Donchian channel (above for longs, below for shorts).
Exit/Trail: Trailing stop at the 20-bar Donchian channel on the opposite side (no fixed TP).
Risk: Initial stop = ATR(N) × stopMult (ATR is smoothed). Position size risks riskPct% of equity based on stop distance.
Labels: “BUY/SELL” only on the entry bar; “STOP BUY/STOP SELL” only on the exit bar.
Pyramiding: Off (one position at a time).
Regime Alignment with EMAs (recommended filter, not enforced by code)
Add EMA 50 and EMA 200 to the D1 chart.
Long bias: take BUY signals only when EMA50 > EMA200 (bullish regime).
Short bias: take SELL signals only when EMA50 < EMA200 (bearish regime).
Optional: for extra selectivity, require the H4 EMAs (50/200) to align with D1 before acting on a signal.
Inputs
entryN (55), exitN (20), atrLen (20), atrSmooth (10), stopMult (2.0), riskPct (0.5%–1.0% recommended).
Works well on (tested by user)
BTCUSD (Bitcoin), EURUSD, GBPJPY, NAS100/US100, USDJPY, AUDUSD, XAGUSD (Silver), US30 (Dow), JP225 (Nikkei), EURGBP, NZDUSD, EURCHF, USDCHF.
How to use
Apply to D1 charts. Review once per day after the daily close and execute next session open to mirror backtest assumptions. Best used as a portfolio strategy across multiple uncorrelated markets. Use the EMA alignment above as a discretionary regime filter to reduce false breakouts.
Notes
For educational use. Markets involve risk; past performance does not guarantee future results. Use responsible position sizing.

VRD-5: Volume Reversal Detector (5 Bars)Overview
This Pine Script indicator detects potential trend reversals based on volume patterns over a 5-bar period. It identifies accumulation (bullish) and distribution (bearish) patterns using volume analysis combined with price action.
Key Features
Volume Analysis:
Compares current volume to a 34-period SMA
Identifies strong/weak volume using configurable thresholds
Calculates volume "energy" as a 5-bar average ratio
Pattern Detection:
Bearish Signal: Looks for decreasing volume after a strong volume bar
Bullish Signal: Looks for increasing volume after weak volume bars
Visualization:
Colored volume histogram (bullish/bearish/neutral)
SMA volume line
Labels for detected signals
Customization Options:
Adjustable lookback period (3-10 bars)
Configurable thresholds for volume strength
Strict mode requiring confirming price action
Suggested Improvements
Performance Optimization:
Reduce the max_labels_count (currently 500) to improve performance
Consider using barstate.isconfirmed for more efficient calculations
Enhanced Visualization:
Add arrows on price chart for better visibility
Include a background color highlight for signal periods
Add option to display the energy level as a separate line
Additional Features:
Incorporate RSI or MACD for confirmation
Add multi-timeframe analysis capability
Include a strategy version for backtesting
Code Structure:
Separate the logic into distinct functions for better readability
Add more detailed comments for complex calculations
Consider using varip for real-time updates if needed
User Experience:
Add input options for label text size/position
Include sound options for alerts
Add a toggle for the information table
This indicator provides a solid foundation for volume-based reversal detection that could be further enhanced with these improvements while maintaining its core functionality.

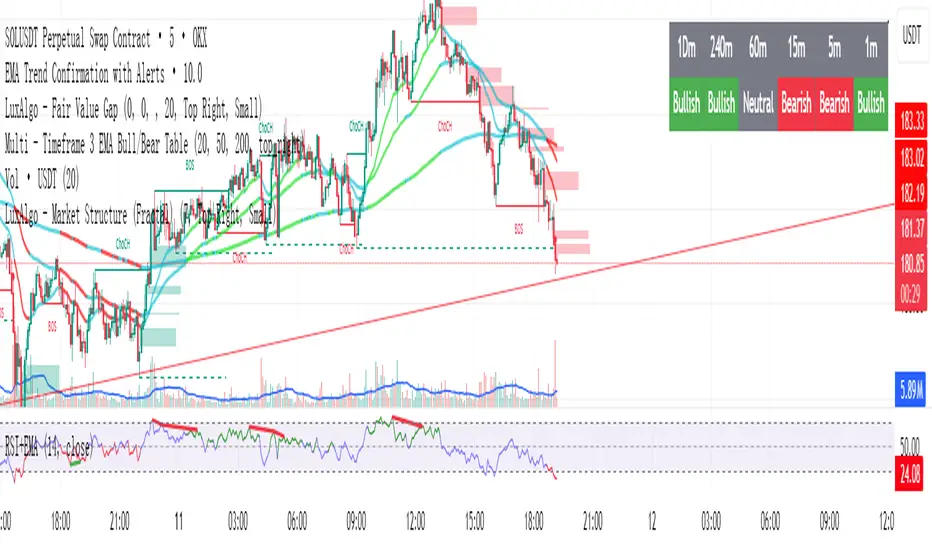
Multi - Timeframe 3 EMA Bull/Bear Table此指标是一个图标指标,适用于短线交易以及中线交易,它明确的显示出来了用EMA来表示方向指示,1分钟不可使用,此图表更新了多次以及修改了多次,在实际回测中有明显的提醒作用,不过多用于参考,不可作为主要指标使用,代码稍复杂如有加以改进的地方请提出,其中核心使用了EMA的20,50,200周期来作为参考,目的是能识别多周期和时间的方向指示,注意:此指标建议仅用于方向参考,不用于主要指标交易。
This indicator is a graphical indicator suitable for short-term and medium-term trading. It clearly shows the direction indicated by the EMA. It cannot be used for 1-minute intervals. This chart has been updated and modified multiple times, and it has a significant alerting effect in actual backtesting; however, it is mainly for reference and should not be used as the primary indicator. The code is somewhat complex, so please suggest improvements if there are any. The core uses the 20, 50, and 200 EMA periods as references, with the aim of identifying the direction indicators across multiple periods and timeframes. Note: This indicator is recommended only for directional reference and not for main indicator trading.
Bar TimeBar Time is a simple utility for traders who rely on backtesting, Bar Replay, and detailed price action analysis. It solves a common but frustrating problem: knowing the exact time of the bar you are looking at.
While most time indicators show your computer's live clock time, this tool displays the bar's own timestamp, perfectly synchronized with your chart's data and timezone.
Why Is This Important?
When you are deep in a Bar Replay session or analyzing a historical setup, the live clock is irrelevant. You need to know when that critical breakout or reversal candle actually happened. Was it during the pre-market? At the London open? In the last five minutes of the US session? This indicator provides that vital context instantly, without you needing to squint at the small print on the x-axis.
Key Use Cases
1. Mastering Bar Replay
As you click through bars in Replay mode, the displayed time updates with each new bar. This allows you to simulate a live trading session with full awareness of the time of day, helping you train your decision-making under more realistic conditions.
2. Analyzing Screener Signals
This is one of the most powerful uses. Imagine your screener finds a "BUY" signal on a stock from two bars ago. You switch to that stock's chart to investigate. Instead of hunting for the exact bar, this tool instantly shows you the date and time of the bar you are currently hovering over. It dramatically speeds up the workflow of moving from a screener alert to actionable analysis.
3. Detailed Price Action Study
Quickly identify key session timings, see how price reacts to news events at a specific time, or analyze intraday volume patterns with complete temporal clarity.
Features & Customization
The tool is designed to be lightweight, efficient, and fully customizable to match your charting environment.
Timezone-Aware Accuracy: Automatically detects your chart's timezone for a perfect match between the label and the x-axis.
Fully Customizable Position: Place the time display in any of nine screen positions (e.g., Top Left, Bottom Center) using a simple dropdown menu.
Custom Colors: Easily set the background and text colors to blend seamlessly with your chart's theme.
Vertical Line Timeline 10 Inputs by LK**Vertical Line Timeline (10 Inputs)**
This TradingView indicator plots vertical lines on your chart at up to **10 specific times of day**. You can define each time in **HH.MM format** (e.g., `9.30` for 9:30 AM). When the current bar’s time matches any of the defined times (based on the chart’s timezone), the indicator automatically draws a **full-height vertical line** at that bar.
**Features:**
* **Up to 10 custom time inputs** (HH.MM format)
* **Custom color** for each time marker
* **Adjustable line width** (1–6 px)
* **Solid or dotted style** toggle
* **Full-height vertical lines** (extend through the entire chart height)
* Works on any intraday timeframe where bar start times can match the defined times
* No labels or extra elements — clean and minimal display
**Use cases:**
* Marking important market sessions (e.g., London Open, New York Open, Asian Close)
* Highlighting personal trade execution windows
* Visual cues for strategy backtesting or time-based setups
Breakout Volume Momentum [5m]Breakout Volume Momentum Indicator (Pine Script v5)
This TradingView Pine Script v5 indicator plots a green dot below a 5-minute price bar whenever all the breakout and volume conditions are met. It is optimized for live intraday trading (not backtesting) and includes customizable inputs for thresholds and trading session times. Key features and conditions of this indicator:
Gap Up Threshold: Current price is up at least X% (default 20%) from the previous day’s close (uses higher-timeframe daily data) before any signal can trigger.
Relative Volume (RVOL): Current bar’s volume is at least Y× (default 2×) the average volume of the last 20 bars. This ensures unusually high volume is present, indicating strong interest.
Trend Alignment: Price is trading above the VWAP (Volume-Weighted Average Price) and above a fast EMA. In addition, the fast EMA (default 9) is above the slower EMA (default 20) to confirm bullish momentum
tradingview.com
tradingview.com
. These filters ensure the stock is in an intraday uptrend (above the average price and rising EMAs).
Intraday Breakout (optional): Optionally require the price to break above the recent intraday high (default last 30 bars). If enabled, a signal only occurs when the stock exceeds its prior range high, confirming a breakout. This can be toggled on/off in the settings.
Avoid Parabolic Spikes: The script skips any bar with an excessively large range (default >12% from low to high), to avoid triggering on spiky or unsustainable parabolic candles.
Time Window Filter: Signals are restricted to a specific session window (by default 09:30 – 11:00 exchange time, typically the morning session) and will not trigger outside these hours. The session window is adjustable via inputs
stackoverflow.com
.
Alerts: An alert condition is provided so you can set a Trading View alert to send a push notification when a green dot signal fires. The alert message includes the ticker and price at the time of signal.

Structure From Start – MTF (body-close BOS)Displays higher-timeframe market structure from a chosen start date using body-close BOS logic, with trend state, guard levels, and BOS markers plotted on your current chart.
Multi-Timeframe Market Structure with Body-Close BOS Logic
This indicator tracks market structure from a chosen start date on a higher-timeframe (HTF) of your choice, then displays it on your current chart for intraday context.
It detects swing highs/lows using pivot logic, confirms Break of Structure (BOS) only when a candle closes beyond the swing level (body-close rule), and maintains the “valid swing” level that invalidates the current bias.
Key Features:
• Works on any HTF you select (e.g., H1, H4) while you operate on lower TFs like M5 or M1.
• Start reading structure from any date/time you choose for focused backtesting or scenario analysis.
• Highlights trend state (long/short/neutral) with background colors.
• Plots the active “guard” level (valid swing high/low) that would flip bias if broken.
• Marks BOS events directly on your trading TF, updating only when the HTF candle closes.
Ideal for combining a clear higher-timeframe bias with lower-timeframe execution, without manually tracking HTF structure changes during live markets.

Relative Strength Buy/Sell SignalsThis Pine Script builds on the MarketSurge-style Relative Strength indicator. It calculates the RS line by comparing the stock's close to a benchmark (default: SPY). Buy signals are generated when the RS line crosses above its moving average (default 10-period SMA), indicating improving relative strength. Sell signals occur when it crosses below, suggesting weakening relative strength. Signals are labeled "BUY" (green) and "SELL" (red) on the chart, with background highlights.
It also retains the new 52-week RS highs (orange circles) and lows (purple circles), which can serve as additional confirmation for outperformance or underperformance.
Note: This approximates relative strength for trading signals but does not replicate the proprietary IBD RS Rating (a 1-99 percentile rank across all stocks). For best results, use on daily charts and combine with other analysis. Backtest thoroughly, as no strategy guarantees profits

SMI Base-Trigger Bullish Re-acceleration (Higher High)Description
What it does
This indicator highlights a two-step bullish pattern using Stochastic Momentum Index (SMI) plus an ATR distance filter:
1. Base (orange) – Marks a momentum “reset.” A base prints when SMI %K crosses up through %D while %K is below the Base level (default -70). The base stores the base price and starts a waiting window.
2. Trigger (green) – Confirms momentum and price strength. A trigger prints only if, before the timeout window ends:
• SMI %K crosses up through %D again,
• %K is above the Trigger level (default -60),
• Close > Base Price, and
• Price has advanced at least Min ATR multiple (default 1.0× the 14-period ATR) above the base price.
A dashed green line connects the base to the trigger.
Why it’s useful
It seeks a bullish divergence / reacceleration: momentum recovers from deeply negative territory, then price reclaims and exceeds the base by a volatility-aware margin. This helps filter out weak “oversold bounces.”
Signals
• Base ▲ (orange): Potential setup begins.
• Trigger ▲ (green): Confirmation—momentum and price agree.
Inputs (key ones)
• %K Length / EMA Smoothing / %D Length: SMI construction.
• Base when %K < (default -70): depth required for a valid reset.
• Trigger when %K > (default -60): strength required on confirmation.
• Base timeout (days) (default 100): maximum look-ahead window.
• ATR Length (default 14) and Min ATR multiple (default 1.0): price must exceed the base by this ATR-scaled distance.
How traders use it (example rules)
• Entry: On the Trigger.
• Risk: A common approach is a stop somewhere between the base price and a multiple of ATR below trigger; or use your system’s volatility stop.
• Exits: Your choice—trend MA cross, fixed R multiple, or structure-based levels.
Notes & tips
• Works best on liquid symbols and mid-to-higher timeframes (reduce noise).
• Increase Min ATR multiple to demand stronger price confirmation; tighten or widen Base/Trigger levels to fit your market.
• This script plots signals only; convert to a strategy to backtest entries/exits.

Opening Range BreakoutThis indicator is designed for Opening Range Breakout (ORB) traders who want automatic calculation of breakout levels and multiple price targets.
It is optimised for NSE intraday trading, capturing the first 15-minute range from 09:15 to 09:30 and plotting key breakout targets for both long and short trades.
✨ Features:
Automatic daily reset — fresh levels are calculated every trading day.
Opening Range High & Low plotted immediately after 09:30.
Two profit targets for both Buy & Sell breakouts based on the opening range size:
T1 = 100% of range added/subtracted from OR high/low.
T2 = 200% of range added/subtracted from OR high/low.
Clear breakout signals (BUY / SELL labels) when price crosses the OR High or Low.
Custom alerts for both buy and sell triggers.
Designed to work on any intraday timeframe (1min, 3min, 5min, etc.).
📊 How it works:
From 09:15 to 09:30, the script records the highest and lowest prices.
At 09:30, the range is locked in and breakout targets are calculated automatically.
Buy and Sell signals are generated when price breaks above the OR High or below the OR Low.
Targets and range lines automatically reset for the next day.
⚠️ Notes:
This script is tuned for NSE market timings but can be adapted for other markets by changing the session input.
Works best on intraday charts for active traders.
This is not financial advice — always backtest before trading live.

Dynamic Swing Anchored VWAP (Zeiierman)█ Overview
Dynamic Swing Anchored VWAP (Zeiierman) is a price–volume tool that anchors VWAP at fresh swing highs/lows and then adapts its responsiveness as conditions change. Instead of one static VWAP that drifts away over time, this indicator re-anchors at meaningful structure points (swings). It computes a decayed, volume-weighted average that can speed up in volatile markets and slow down during quiet periods.
Blending swing structure with an adaptive VWAP engine creates a fair-value path that stays aligned with current price behavior, making retests, pullbacks, and mean reversion opportunities easier to spot and trade.
█ How It Works
⚪ Swing Anchor Engine
The script scans for swing highs/lows using your Swing Period.
When market direction flips (new pivot confirmed), the indicator anchors a new VWAP at that pivot and starts tracking from there.
⚪ Adaptive VWAP Core
From each anchor , VWAP is computed using a decay model (recent price×volume matters more; older data matters less).
Adaptive Price Tracking lets you set the base responsiveness in “bars.” Lower = more reactive, higher = smoother.
Volatility Adjustment (ATR vs Avg ATR) can automatically speed up the VWAP during spikes and slow it during compression, so the line stays relevant to live conditions.
█ Why This Adaptive Approach Beats a Simple VWAP
Standard VWAP is cumulative from the anchor point. As time passes and volume accumulates, it often drifts far from current price, especially in prolonged trends or multi-session moves. That drift makes retests rare and unreliable.
Dynamic Swing Anchored VWAP solves this in two ways:
⚪ Event-Driven Anchoring (Swings):
By restarting at fresh swing highs/lows, the VWAP reference reflects today’s structure. You get frequent, meaningful retests because the anchor stays near the action.
⚪ Adaptive Responsiveness (Volatility-Aware):
Markets don’t move at one speed. When volatility expands, a fixed VWAP lags; when volatility contracts, it can overreact to noise. Here, the “tracking speed” can auto-adjust using ATR vs its average.
High Volatility → faster tracking: VWAP hugs price more tightly, preserving retest relevance.
Low Volatility → smoother tracking: VWAP filters chop and stays stable.
Result: A VWAP that follows price more accurately, creating plenty of credible retest opportunities and more trustworthy mean-reversion/continuation reads than a simple, ever-growing VWAP.
█ How to Use
⚪ S wing-Aware Fair Value
Use the VWAP as a dynamic fair-value guide that restarts at key structural pivots. Pullbacks to the VWAP after impulsive moves often provide retest entries.
⚪ Trend Trading
In trends, the adaptive VWAP will ride closer to price, offering continuation pullbacks.
█ Settings
Swing Period: Number of bars to confirm swing highs/lows. Larger = bigger, cleaner pivots (slower); smaller = more frequent pivots (noisier).
Adaptive Price Tracking: Sets the base reaction speed (in bars). Lower = faster, tighter to price; higher = smoother, slower.
Adapt APT by ATR ratio: When ON, the tracking speed auto-adjusts with market volatility (ATR vs its own average). High vol → faster; low vol → calmer.
Volatility Bias: Controls how strongly volatility affects the speed. >1 = stronger effect; <1 = lighter touch.
-----------------
Disclaimer
The content provided in my scripts, indicators, ideas, algorithms, and systems is for educational and informational purposes only. It does not constitute financial advice, investment recommendations, or a solicitation to buy or sell any financial instruments. I will not accept liability for any loss or damage, including without limitation any loss of profit, which may arise directly or indirectly from the use of or reliance on such information.
All investments involve risk, and the past performance of a security, industry, sector, market, financial product, trading strategy, backtest, or individual's trading does not guarantee future results or returns. Investors are fully responsible for any investment decisions they make. Such decisions should be based solely on an evaluation of their financial circumstances, investment objectives, risk tolerance, and liquidity needs.
