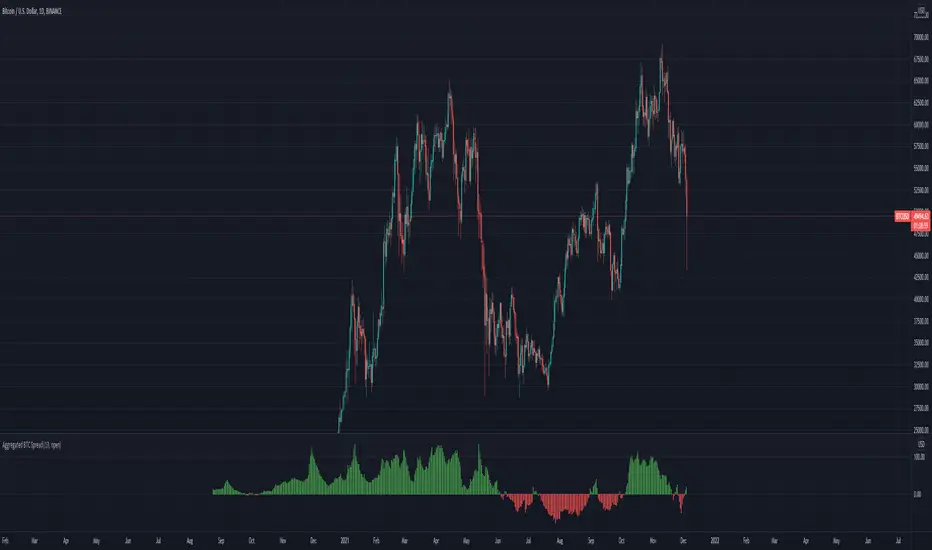
Scalping using RSI 2 indicator with TSLThis strategy implements a simply scalping using the RSI (calculated on two periods), the slopes of two MAs ( EMA or SMA ) having different lengths (by default, I use 50 and 200).
A trailing stop loss (%) is used.
Entry conditions:
.) Fast MA > Slow MA and Price > Slow MA and RSI < Oversold Threshold ------> go Long
.) Fast MA < Slow MA and Price < Slow MA and RSI > Overbought Threshold ------> go Short
Exit conditions:
.) Long entry condition is true and (close >= TP or close <= TSL ) ----> close short position
.) Short entry condition is true and (close <= TP or close >= TSL ) ----> close long position
The strategy performed best on Bitcoin and the most liquid and capitalized Altcoins but works excellent on volatile assets, mainly if they often go trending.
Works best on 3h - 4h time frame.
There's also an optional Volatility filter, which opens the position only if the difference between the two slopes is more than a specific value, which can be set in the study inputs. The purpose is not opening positions if the price goes sideways and the noise is way > than the signal.
Note:
.) the RSI length is 2;
.) the oversold Threshold is 90%;
.) the overbought Threshold is 10%;
.) by default, the trailing stop loss per cent is 1%;
.) by default, the fast MA length is 50;
.) by default, the slow MA length is 200;
.) by default, the MA used is EMA.
Cheers.
Tìm kiếm tập lệnh với "bitcoin"
RSI Classic Strategy (by Coinrule)One of the questions hobbyist traders more often ask is: what is the perfect trading indicator?
Every indicator is just a tool, so its efficiency is proportional to your ability to read its signals and translate them into an actionable trading strategy. The RSI is likely the most flexible and easy to use among the technical indicators.
This trading strategy tries to catch short-term swings on the coins of your choice with a simple yet profitable setup.
Buy when the RSI is lower than 30 (you can adjust it to 35 in times of steep uptrend).
Sell when the RSI is greater than 65 (the target may range between 60 and 75 depending on the volatility of the coin).
Note that the buy signal comes when the indicator crosses below 30 and not when it crosses above 30 as it happens on the built-in RSI strategy on Tradingview.
The present script overperforms the built-in strategy, even adding trading fees and using a lower amount of capital for each trade (30%). That means that the system can deliver higher net-profits with lower risk levels.
A typical example of market conditions where this strategy works perfectly is as follows.
The first initial breakout indicates that a new leg up in the trend may start. Bitcoin starts to trade within a range which you can identify when it reaches the point 3. That is the perfect time to start the rule because
- trading within a channel anticipates possible swings up and down
- the trend is on the upside, providing low downside risk in buying the dips.
This strategy works well with selected coins of your choice, and it's a great fit on leverage exchanges like Binance Futures.
If you prefer to run it across all available coins on the market, instead, you may choose an optimized version.
CT Reverse Pi Cycle Bitcoin Top IndicatorIntroducing the Reverse BTC Pi Market Cycle Top indicator
Much respect to Philip Swift the original creator of this idea and big thanks to Tradingview author Ninorigo for sharing the script which this indicator is based on.
Philip Swift has noted that:
Using the x2 multiple of the 350 day moving average along with the 111 day moving average provides an interesting market cycle indicator.
Over the past three market cycles, when the 350DMA x2 crosses below the 111DMA, Bitcoin price peaks in its market cycle, this has been accurate to within three days of Bitcoin price topping out.
Here I have modified an existing script by Tradingview author @Ninorigo which shows the moving averages and gives signals upon crossover by adding the following features:
A function which shows the price at which the 350DMA will Cross Below the 111DMA.
(This is calculated from the prior bar closing data and does not repaint)
An “anticipated cross” function which may give a 1 bar advanced warning of a cross.
(this is calculated from current bar values and may change and repaint)
The crossover levels are shown in an info label to the right of the current price.
When there is a BTC Pi Market Cycle Top anticipated cross on the next bar there will be an orange background signal.
When there is an actual BTC Pi Market Cycle Top cross there will be a red background signal
When there is an anticipated cross back there will be a blue background signal
When there is an actual cross back there will be a green background signal
This indicator will show the appropriate moving averages and crossover information from the daily timeframe regardless of the timeframe you are using.
This should be helpful in more accurately identifying the price level where the Pi Market Cycle moving averages will cross denoting a possible market cycle top.
It is interesting to note:
350 / 111 = 3.153
Which is the closest we can get to Pi when dividing 350 by another whole number.
This is a script to give another view and metric on an interesting experimental idea. This is not financial advice.
rocketLaunchI wanted to see if I could programmatically identify the conditions I saw just before Bitcoin broke its all-time high end of 2020. The signal picks up several rocket launch moments prior to launching which is quite cool. It also picks up a few false starts, however. In any case, I would have loved to be stopped out on those false starts but been there for all the starts this thing picks up.
It could probably use more confirmatory elements such as trailing conditions and volume perhaps?
BINANCE:BTCUSDTPERP
GBTC premium as a percentage of the bitcoin pricePlots the GBTC premium as a percentage of the bitcoin price at the close. It also includes the annual management fee (2% at the moment). It accrues on a daily, weekly or monthly basis depending on the chart resolution. (intraday not supported) The amount of bitcoin per gbtc share and the annual fee may be changed by Grayscale in the future. Those values can be easily update in the script settings.
gold price levels denominated in usd/gramsPlots the gold price (USD) for the quantities (grams) identified as support or resistance in the indicator settings. Default values are:
75 gold grams
300 gold grams
500 gold grams
1000 gold grams
5000 gold grams
More context: The purchasing power of Bitcoin
[MACLEN] HODL ZONE RENKO
PLEASE READ!
Trade at your own risk. Please read about renko charts before using this indicator. This indicator is for educational purposes only.
This Indicator is only valid in renko charts with 1 second timeframe. For BTCUSDT . With the traditional method and the size box of 80.
With this indicator we can detect zones of buy and sell. Even that is not recommended to use leverage, I use it to find an entry and use only small leverages. It could be also used to accumulate and HODL bitcoin .
Please, comment anything.
POR FAVOR LEER!
Tradea bajo tu propio riesgo. Por favor lee sobre las graficas renko antes de usar este indicador. Este indicador es solamente con fines educativos.
Este indicador es válido solamente en graficas renko con un timeframe de 1 segundo. Para BTCUSDT . Con cajas del método tradicional de un tamaño de 80.
Con este indicador podemos detectar zonas de compra y venta. A pesar de que no es recomendable usar apalancamiento, yo lo uso para encontrar entradas y solo uso apalancamientos pequeños. También podría usarse para acumular y holdear bitcoin .
Por favor, escríbeme cualquier duda o comentario.
GBTC & BTCE Premium Indicator- This indicator illustrates the premium of GBTC and the European equivalent, BTCE. Relative to the spot price of Bitcoin
- It represents the premium investors are willing to pay to be able to gain exposure to Bitcoin . Whilst holding them in an investment vehicle such as a 401k or an ISA.
- The premiums can be plotted. GBTC vs BTCUSD and BTCE vs BTCEUR
OR
- The "real price" of BTCUSD , GBTC and BTCE (denominated in USD) can be plotted against each other
My BTC log curveLogarithmic regression of the USD price of Bitcoin , calculated according to the equation:
y=A*exp(beta*x^lambda + c) + m*x + b
where x is the number of days since the genesis block. All parameters are editable in the script options.
[SCL] Bitcoin Hashrate Dips (Miner Capitulation)Gives long-term buy signals for Bitcoin from dips and recoveries in the hashrate (the "miner capitulation" theory). It has an overlay and a standalone mode and is fully configurable. It uses Williams Lows and ATR instead of moving averages.
Features that might be interesting for Pinescripters:
+ Automatic (as far as is possible currently) adjustment of plots for overlay and standalone display modes.
+ A neat label function for debugging floats
+ Fully commented
+ The debug that I used to overcome problems in developing it is left in
+ Ideas for how to deal with a wildly oscillating and exponentially increasing data source
You need to run this indicator on the Bitcoin daily chart for it to make any sense. The best is a BTC/USD chart with a long history, such as BNC:BLX.
Stablecoin Volume Flow [kingthies_]Stablecoin Volume Flow into BTCUSD/BTC-Stablecoin pairings
Exchanges Used
Coinbase
Kraken
Bittrex
Binance
Huobi
Bitstamp
Gemini
Bitfinex
Our aim here is simple...to combine the overall volume flow from Fiat or stable currencies into the crypto-markets.
This is the first portion of a series I plan to share involving a holistic approach to understanding the overall crypto-ecosystem. I've included several of the highest ranking by volume exchanges and their accompanying older/well known stablecoins.
Also, the historic data for the newer stable coins made the study invalid due to limited sample size. That included coins like USDC, DAI, GUSD, BUSD and more. For this reason, the 10 sources of data here adequately provide the data needed to see a full view of the market volume going in and out of bitcoin at any given moment
Noldo Blockchain Cryptocurrency Indicator
Hello, this script has the same logic as Noldo CFTC COT Forex Indicator :
And Noldo CFTC COT Commodities Indicator :
*
Script briefly calculates the period length between two signals of Pivot Reversal Strategy when new signal arrives and allows us to see relative Blockchain data and price changes of Major Cryptocurrencies over that automatic length.
This saves us from the hassle and time wasting of searching for a reference point.
Usage
This script works only on all Bitcoin / U.S Dollar pairs and futures.
It only works on 1W graphics.
ICOT data are pulled via Quandl
NOTE :
Since blockchain data is very votalile, 7-day ema values are adjusted to take into account.
Regards.
Performante's Average Bitcoin Volume IndicatorPerformante's Bitcoin Volume Indicator takes the volume from the biggest exchanges and plots the average volume.
Happy Trading!
EMA Slope Cross Trend Follower StrategyThis strategy uses the cross of the slopes of two EMAs having different lengths to generate trend follower signals. By default, I use 130 and 400, which behave very well.
The conditions which make the strat enter the market are:
- Fast Slope > Slow Slope and price > EMA 200 : go Long
- Fast Slope < Slow Slope and price < EMA200 : go Short
The simple slopes cross in the opposite direction, closes the position.
The strategy performs best on Bitcoin and the most liquid and capitalized Altcoins, but works greatly on volatile assets as well, in particular if they often go trending.
Works best on 4h time frame.
There's also an optional Volatility filter, which opens the position only if the difference between the two slopes is more than a specific value, which can be set in the strategy inputs. The purpose is not opening positions if price is going sideways and the noise is way > than the signal.
Enjoy it!
Hash Ribbons Backtest - Bitcoin Beats YT
Hello Hello Hello and welcome back to Bitcoin Beats!
This is a script written by capriole_charles
Go check out the original!
I have added leverage and stoploss % but also made it a strategy so we can look back at past trades to see patterns and profit.
Personally I feel this is not enough data to trade off as BTC is such a young asset. However I have seen other models similar to this for other assets that hold strong.
Trade safe!
Good bye from bitcoin beats!
Not Meant For The 1H! My Bad! higher timeframes are better!
The "Spring" is the confirmed Miner capitulation period:
The 1st "gray" circle is the start of Capitulation (1 month Hash Rate crosses UNDER 2 month Hash Rate)
Last "green" circle is the end of Capitulation (1 month Hash Rate crosses OVER 2 month Hash Rate)
The "greener" the spring gets (up until blue) represents Hash Rate recovery (it is increasing)
The "blue" circle is the first instance of positive momentum following recovery of Hash Rate (1m HR > 2m HR). This is historically a rewarding place to buy with limited downside.
Hashrate Mining of BiznesFilosofIn addition to technical analysis, you also need to pay attention to fundamental analysis. Bitcoin has one of these indicators, it is the network hashrate. And it’s important to know when mining becomes disadvantageous. Those. when network participants turn off the equipment. And there are critical points that depend on the price and number of miners in the network.
When the blue bars of the indicator grow, then you can stand in long. When stools are reduced, then it is time to close positions or hedge risks in the derivatives market.
The vertical line indicates halving.
A red flag indicates a dangerous moment, and a green flag indicates the time of purchase.
The oscillator is based on fundamental indicators and the intersection of moving averages.
===
Кроме теханализа нужно ещё обращать внимание на фундаментальный анализ. У биткоина один из таких показателей, это хэшрейт сети. И важно зать, когда майнинг становится невыгоден. Т.е. когда участники сети отключают оборудование. И есть критические точки, зависящие от цены и количества майнеров в сети.
Когда синие столбики индикатора растут, тогда можно стоять в лонг. Когда столюики уменьшаются, тогда пора закрывать позиции или хеджировать риски на рынке деривативов.
Вертикальной линией обозначен халвинг.
Красный флаг показывает опасный момент, а зелёный флаг указывает на время покупок.
Осцилятор основан на фундаментальных показателях и пересечении скользящих средних.
Rolling CorrelationsThis script calculates rolling correlations for up to 3 different assets at a time, compared to the main asset that is on the screen. Right now, it's best set up to use with Bitcoin and traditional assets. Created due to the recent high correlations.
VIX MonitorSimple VIX Monitor to track spikes.
Spikes in VIX are often followed by big moves up in stocks.
Useful when paired with "Correlation & Beta" Indicator.
For Bitcoin Traders: when Bitcoin is highly correlated to Stocks (such as now) it could be a good opportunity for a short-term long trade.
BTC Growth CurveA function which maps Bitcoin supply fundamentals to an estimated demand growth model via price.