Moon Phases + Daily, Weekly, Monthly, Quarterly & Yearly Breaks█ Moon Phases
From LuxAlgo description.
Trading moon phases has become quite popular among traders, believing that there exists a relationship between moon phases and market movements.
This strategy is based on an estimate of moon phases with the possibility to use different methods to determine long/short positions based on moon phases.
Note that we assume moon phases are perfectly periodic with a cycle of 29.530588853 days (which is not realistically the case), as such there exists a difference between the detected moon phases by the strategy and the ones you would see. This difference becomes less important when using higher timeframes.
█ Daily, Weekly, Monthly, Quarterly & Yearly Breaks
This indicator marks the start of the selected periods with a vertical line that help with identifying cycles.
It allows to enable or disable independently the daily, weekly, monthly, quarterly and yearly session breaks.
This script is based on LuxAlgo and kaushi / icostan scripts.
Moon Phases Strategy
Year/Quarter/Month/Week/Day breaks
Month/week breaks
Tìm kiếm tập lệnh với "break"

Inside Bar SetupScript Details
- This script plots Inside Bar for given day in selected time-frame (applicable only for Timeframes < Day)
- Basis plotted inside bar, relevant targets are marked on the chart
- Targets can be customised from script settings. Example, if range of mother candle is 10 points, then T1 is 10 * x above/below mother candle and T2 is 10 * y above/below mother candle. This x & y are configured via script settings
How to use this script ?
- This script works well on 10-15 mins timeframe for stocks, 15/30 mins timeframe for nifty index and 30/60 mins time frame for bank nifty index
- If mother candle high is broken, take long trade with SL of mother candle low and if low is broken, take short trade with SL of mother candle high
Remember:
1. Above logic is to be combined with support/resistances i.e. price action. This script is an add-on to price action analysis giving you more conviction.
2. If range of mother candle is very high, it is recommended to avoid the trade.
3. Basis inside bar formed on higher time frame, take trade on basis of lower time frame i.e if inside bar is formed on 60 mins, take trade on the basis of 10-15 mins time frame
Example:
1. As seen in the chart, Nifty is near it's resistance and we are seeing Inside Bar being formed, In such scenario, even if High of Mother Candle is broken, we should be more interested to short as we are near resistance and probability of getting our targets in long side is less.
2. So, if I see breakdown of mother candle i.e. price going below low of mother candle, we will short with SL of high of mother candle.
3. As seen in the chart, both the targets are achieved.
Additional Info:
1. Targets on Long/Short Side can be configured via settings. For indices 1 times/1.5 times the range works well.
2. This script plots targets basis the first inside bar formed in the day for selected time frame.
3. Inside bars formed through out the day are coloured separately but lines are plotted only on the basis of 1st formed inside bar as this strategy works well for the first formed inside bar)
4. Don't forget to check volume in case of breakout/breakdown.
Note:
1. Mother Candle - First Candle of Inside Bar
2. Child Candle - Candle formed inside Mother Candle (Second Candle of Inside Bar)
Happy Trading :)

Pre Market \ Opening Range High LowGreen vertical lines are showing pre market open and then the opening range as the first hour of market NYSE market open
Pre market high and low are blue lines | intraday opening range high low are in white
Trades are taken in the current direction above | below range breaks with the direction of price action using the moving averages
Price breaking through moving averages and a range is the optimal trade to enter - exit at next range for target - stop loss below the lower | higher moving average depending on short or long
A break above or below the intraday high or low and pre market high or low can give massive profits trailing your stop loss as price runs
Using MA 5 and 12 to filter out entries and exits above or below the ranges short or long is also another strategy to implement
BEST TIME FRAME TO USE IS 5 MINUTE

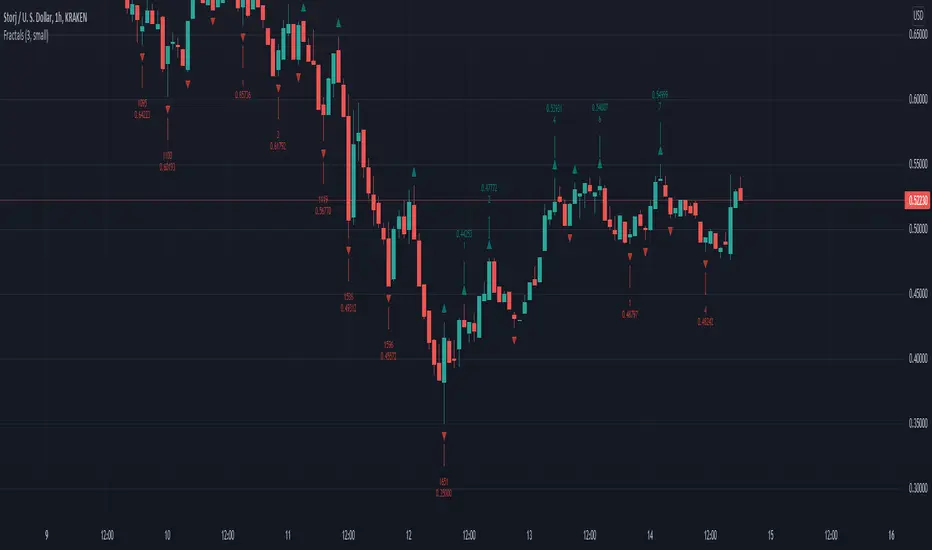
Williams Fractals with BreaksThis is a Bill Williams fractal indicator with breaks.
I was turned onto fractals and the importance of their breaks by ChaosTrader63.
I know several version of this indicator have been done.
I chose this as a first project because of it's simplicity , but also because of the poor code quality of some other versions I looked at.
This is the first draft that successfully met my three criteria:
* Must identify all fractals, including simultaneous up/down fractals.
* Must identify fractal breaks with a clear indicator.
* Must provide information on how many fractals
For the first bullet, I wanted to provide a more concise modern version than the boolean logic composition I was seeing in other examples.
The later two required tracking the past which was not present in the other versions I looked at.
Code here can be improved for more uses and better integration, but it is functional and elegant enough to use.
Thanks for checking it out.
Jolly Wizard
EMA MTF PlusI like trading the 1 minute and 3 minutes time-frames. I'm what is commonly called a "scalper". Long term investments yes, I have some, but for trading, I don't have neither the time,
nor the patience to wait hours or days for my trade to be complete.
This doesn't mean I discount the higher time-frames, no, I actually rely heavily on them. I found that EMAs do a decent job as support/resistance, sometimes to a tick level of precision. And this is important for a 1 minute trader.
As such, I made this script that tracks the higher time-frames EMAs and displays the last value as a line.
I do not need the whole EMA, I'm not interested in crossovers or crossunders, these are anyway late signals for me.
What's with the triangles? These are local tops/bottoms , candles that have a have decent size of the wick. These tops and bottoms are by no means "final", they are merely a rejection at certain levels of price. Due to markets complexities (and human erratic behaviors hehe) these levels could be breached at the very next candle. For a more "final" version (nothing is really final but..) I added Schaff Trend Cycle as filter, so a triangle will pop only when a trend is mature enough ( STC with a value near 0 or near 100).
Colored bars. When the body of the candle is big, it shows strength. Strong bars tend to have follow through, especially when breaking key levels. The script looks at the body of the candle and compares it with ATR (Average True Range), if it's at least 0.8 of ATR it changes the bar color to yellow (bull candles) or fuchsia(bear candles).
Range identifier. This code is copied from Lazy Bear (if there are any issues please let me know), it's very useful in conjunction with colored bars.
I look for breakout candles that go outside of the range as a signal for a trade.
There are many ways in which this script can be useful, like trading mean reversions or momentum trades (breakouts) or simply trend following trades.
I hope you guys find it useful, you can play with default values and change them as you like, these are what I found to be working best for me and my trading universe (mostly crypto).
Special thanks for the original work of:
LazyBear
everget
Jim8080

Volume Positive Negative (VPN) [LevelUp]The idea and calculations for the Volume Positive Negative (VPN) indicator were created by Markos Katsanos. Markos wrote about the indicator in the article Detecting High-Volume Breakouts, published in Technical Analysis of Stocks & Commodities April, 2021 (Vol. 39, Issue 5).
The goal of the VPN indicator is to detect breakouts using only volume. The basic idea is to compare volume on up days versus volume on down days. The indicator can oscillate between the range of -100 and 100. Values between 0 and 20 are generally considered bullish, negative are bearish.
When the plotted VPN crosses over what Markos refers to as the critical value, that may indicate a high volume breakout. The critical value can be adjusted between 0 to 20, 10 is the default,
Volume Positive Negative Calculation (VPN)
VPN = (VP - VN) / MAV / Period * 100
VP - sum of positive volume
VN - sum of negative volume
MAV - moving average of volume
Volume is considered positive when the average price is higher than the previous day's price by more than .1 of the ATR (average true range).

Please help to make Larry Williams' volatility breakthrough.Hello Traders!
I'm going to backtest Larry Williams' volatility breakthrough strategy.
However, contrary to my expectation, orders at certain bars are made the next day.
Is there anything I missed at my pine script code?
Please give me any tiny tips.
Thank you!!

False BreakoutA false breakout is when the price temporarily moves above or below a key support or resistance level, but then later retreats back to the same side as it started.
The “False Breakout” indicator reveals false breakouts in comparison to the previous candle.
In case we're looking to trade the stock for long this would mean that the price of the stock broke the previous low (support) and then got back above that low.
In case we're looking to trade the stock for short then a false breakout would mean the stock broke the previous high (resistance) and then got back below that high.
How to use the indicator?
First choose the direction you're looking to trade, meaning either long or short.
Then choose how strict you want to be about the Falls brakes.
There are three options:
The first option named “All“ means that it's enough that the stock broke the previous level and then get back to the original side.
The second option is “Supporting Change” meaning not only that the stock broke the previous key level (support or resistance), but also the change at the end of the candle is supporting the main direction - meaning the change is positive for long or negative for short.
The third option is “Engulfing”. This is a well-known candle, but to make it clear, in our case “Engulfing” means that not only the stock broke the previous level but it also ended the day on the other side of the candle - higher than the previous high, in case of long, and lower than the previous low, in case of short.
When you choose the level of strictness you determine how many indications you're going to get on the chart.
If you choose the highest level of strictness, meaning “Engulfing”, you would only see the red flags indicating engulfing candles.
If you choose the lowest level of strictness, meaning “All”, you will get more indications on your chart, including every false breakout.
When the direction you're looking for is long, all indications would appear below the candles.
When the direction you're looking for is short, then all indications would appear above the candles.
The Engulfing candles are represented by Red flags, and the Simple breakouts candles are represented by yellow. All colors may be adjusted to your preference.
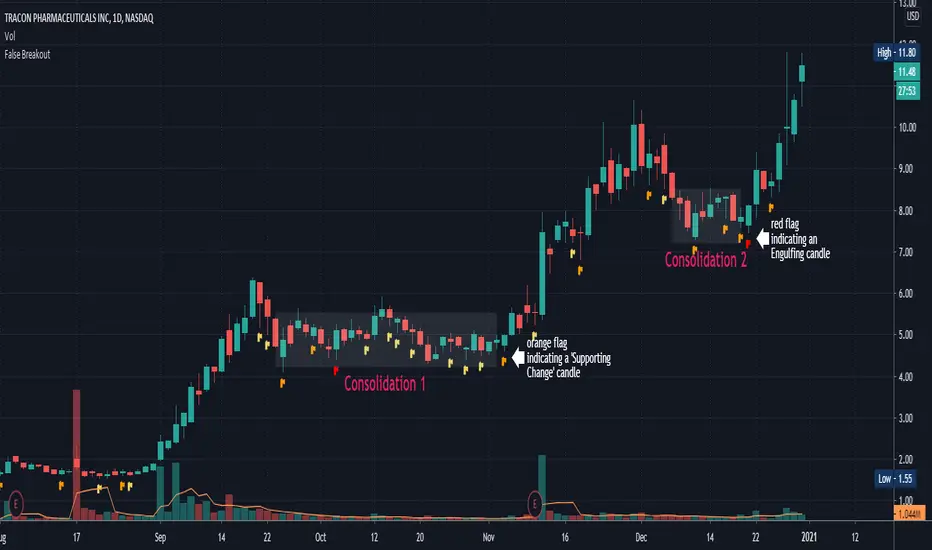
Explaining the example above:
In the chart above we can see two consolidations. At the end of each consolidation, we can see a candle with an indication from the indicator that points out that this could be the end of the consolidation and the stock might continue its move.
In “consolidation 1” we can see that there is an orange flag below the candle right before the stock began to move up again.
In “consolidation 2” we can see that there is a red flag below the candle, right before the stock began another move.
Wishing you all the best :)
SMT - Smart Money Thursday Boxes
The Smart Money Trading Thursday - is a very specific trading system. You only trade it on a Thursday.
The script/indicator will color Thursdays as two boxes. If you just want one color, use same color for
both boxes. The boxes is there to indicate London/New York sessions.
SETTINGS
In the setting you find a numeric value as 1700-0400:5
The "5" indicate Thursday. You can change that if you prefer to color another specific day.
For example "4" would indicate Wednesday. And you can change the hours to fit your
sessions and trading style.
You can also use the 2 boxes on different days. If you for example would like to color up
London for Wednesday and Thursday. Then set hours to fit London session and adjust the
:5 to 4 on the 1st box and 5 on the 2nd.
HOW TO USE IT?
The Smart Money works in a way retail trading does not. Smart Money has an objective
to locate retail patterns, where there will be a lot of stop loss volume to be grabbed.
So when a retail trader see a setup like a "Double Top / Bottom". The Institutional
will see $$$ of dumb money, ready to be taken. The best moves happen on a Thursday
but if you are a skilled trader, you can see the move also occur on Wednesday or Friday.
The first thing that will happen, is that the Smart Money Breaks out of session. Meaning
they will leave the current weeks high/low range. To start collect negative contracts
of the retail volume.
When you see that happen. And you see a breakout that consist of 4 in a row 1 hour
chart candles. Then you have your first rule meet.
#1 Thursday breakout of current weeks high/low. And the move is a clean 4 hour move
as 4x H1 candles. The move can start within range. But must end clearly outside.
Visual Example:
#2 Next, we await an engulf at peak or near peak. That is where Institutional
may have problem to match any more contracts, and since they used their own
money to make this move. They must now mitigate orders, and return back to
the original retail pattern as most retail traders are now stopped out.
(Normally this is a long/clear candle out of range. they rarely go lower
then retail traders entry in the 1st push. This to not save any souls :)
#3 Price returns back to where the breakout from the retail happens.
You can now take your profit as a Smart Money Trader. Trading with less risk,
you can take profit of the return of that latest 4x H1 candle move. (Order
Block)
CONCLUSION
The best trade is when you can combine a retail pattern, followed by a
breakout which holds 4x 1 hour candles in the outbreak direction.
2nd best is when you have the 4x H1 breakout and really no clear retail
pattern. Still is the same game. Just not as clear as the one above.
Study the steps in this image and you see what to look after:
Good Luck with your trading!
Regards,
The Hunter Trading Group

Soldiers Pattern ModifiedThis can be perceived as modified 3 soldiers, relaxed NR4 or even extended harami candlestick pattern.
Works for any instrument and any timeframe.
The idea is to find out any number of candles having their individual highs and lows, all within high and low range of base candle.
The count of soldiers and if they must be of same color, both can be configured.
Additional configurable settings is to add further check of having body of soldiers as well within body of base candle.
Trading strategy: Trade high or low breakout of base candle, having other as stop loss, for a risk reward ratio of 1:2.

Big Breakout IndexBig Breakout Index is a great indicator for detecting breakouts. When the current close breaks out of consolidation, the indicator will tell you.
Green - Buy
Red - Sell

Force IndexWhat is the force index ?
The force index is an oscillator used to confirm price breakout strengths and identify potential trends.
It was popularized by A. Elder.
How the force index is computed ?
Knowing that volume is the fuel of a price movement, reliable breakouts and trend continuation are more likely to occur on high volume breakouts. This is why the force index is computed with the intensity of the price movement, and it's volume , using the formula ema13((close(n) - close(n-1)) * volume ) .
How to use the force index
An important change in the force index indicate a strong momentum in the price action.
You can read more about the force index interpretation on Investopedia
Customization
You can display the indicator as an histogram, or as a line chart.
You can change EMA length, although it's recommended to keep it at default value.

CPR by Anand with PDL/PDH & Breakouts 15/30 minsThis is an enhanced version of CPR by Anand with Configurable previous day high and low and option to configure breakout lines of 15 and 30 mins.
Will be an useful tool for day traders who follows CPR tricks and breakouts.

1H ETH Volume Breakout [ADX Filtered]Title: 1H ETH Volume Breakout w/ ADX Filter
Description:
🚀 Strategy Overview
This strategy is a high-precision Volatility Breakout system designed specifically for Ethereum (ETH) on the 1H timeframe. It focuses on catching explosive moves while aggressively filtering out market noise and "chop" to protect capital.
Unlike standard breakout strategies that get wrecked in sideways markets, this script uses a multi-layer confirmation system (Volume + Trend + Momentum + ADX) to ensure high-probability entries.
🧠 The Logic (How it works)
Keltner Channel Breakout: We use Keltner Channels (Length 22, Multiplier 2.0) instead of Bollinger Bands because they adapt better to ETH's unique volatility, reducing fake-outs.
Volume Confirmation: A trade is only taken if the current volume spikes above the moving average. "No Volume = No Trade."
Trend Filter (220 EMA): We only trade Long when price is above the 220 EMA, and Short when below. We trade with the dominant trend, never against it.
The "Chop Killer" (ADX Filter): An added ADX filter ensures the trend has real strength before entering. If the market is flat (ADX < 20), the strategy sits on the sideline.
🛡️ Risk Management (The "Fee Crusher")
Dynamic Stop Loss: Uses ATR (4.0) to give trades room to breathe without getting wicked out.
Trailing Stop: Activates after a 3% gain to lock in profits during big pumps.
Money Management: Includes a built-in Compounding feature (Optional).
⚙️ Recommended Settings
Coin: ETH/USD or ETH/USDT
Timeframe: 1 Hour (1H)
Leverage: 2x (Recommended)
Exchange Fees: Tuned for 0.1% fees.
⚠️ Disclaimer
Past performance is not indicative of future results. Please backtest with your own exchange settings before using real capital. This is an open-source tool for educational purposes.

Custom Time-Range Breakout with 4x EMA Filter Time-Range Breakout Monitor with 4x EMA FilterThis indicator is a powerful tool designed to capture volatility during specific market hours (like London or New York opens). It monitors a custom price range (High/Low) and tracks whether these levels are breached, using a 4x EMA ribbon as a trend filter.Key Features:Adjustable Range: Define your own start and end time (hours and minutes) to mark the session range.Breakout Tracking: The indicator visually tracks if the High or Low of the session has been taken (Broken) and displays the status in a real-time dashboard.4x EMA Ribbon: Integrated trend filter with specific color coding for quick visual confirmation.Smart Alerts: Built-in alerts for both Bullish (Up) and Bearish (Down) breakouts.EMA Color Legend (Rafał's Setup):EMA PeriodColorRoleEMA 20GrayShort-term momentumEMA 50GreenMedium-term trend confirmationEMA 100YellowIntermediate support/resistanceEMA 200RedLong-term baseline (The "Trendline")How to Use:Set the Session: Input your target range in the settings (e.g., 09:00 - 10:00).Monitor the Dashboard: The top-right table shows "TAK" (YES) or "NIE" (NO) if the levels have been breached during the current day.Confirm the Trend: * Long: Price breaks above the range AND is supported by the Green (50) and Red (200) EMAs.Short: Price breaks below the range AND is trending under the Green (50) and Red (200) EMAs.Settings:Start/End Hour & Minute: Full control over the tracked time window.Alerts: Enable "Wybicie Górą" or "Wybicie Dołem" in the TradingView Alert menu.

RSI Apex: Breakout & DivergenceRSI Apex: Breakout & Divergence System
RSI Apex:突破与背离交易系统
🇬🇧 English Description
RSI Apex is a comprehensive trading system designed to capture both Trend Breakouts and Market Reversals. Unlike traditional RSI indicators that rely solely on fixed levels (70/30), RSI Apex integrates Donchian Channels, Volatility Squeeze, and the Libertus Divergence Algorithm to provide high-probability signals.
🚀 Key Features
Trend Push System (Donchian Breakout):
Detects when RSI momentum is strong enough to push the upper/lower Donchian Channel bands.
Signal: Displays ▲ (Bull) or ▼ (Bear) at levels 20/80.
Libertus Divergence (No-Lag):
Uses a real-time pivot tracking algorithm to identify divergences between Price and RSI without the lag of traditional pivot points.
Signal: Displays "Div" labels at levels 30/70.
Smart Coloring (Extreme Highlight):
Green/Red: Normal Trend.
White (Extreme): When RSI breaches 70 (Overbought) or 30 (Oversold), the line turns bright White. This highlights the most volatile zones where reversals or strong continuations occur.
Volatility Squeeze Filter:
Monitors market volatility. When the Donchian Channel compresses significantly (below historical average), the background turns Purple.
Meaning: "Calm before the storm"—expect a major move soon.
🛠 How to Use
Trend Following: Enter when you see Green/Red RSI lines accompanied by ▲ / ▼ signals. This indicates a "Trend Push."
Reversal Trading: Look for "Div" signals when the RSI line is White (Extreme). This suggests momentum is fading despite price action.
Exit/Take Profit: Watch for the "Weak" label, which appears when RSI falls back into the neutral zone.
Dashboard: Monitor real-time RSI Value, Market State (Bullish/Bearish/Extreme), and Volatility (Squeeze/Expanding) in the bottom-right table.
🇨🇳 中文简介
RSI Apex 是一套旨在捕捉趋势爆发 (Breakout) 和 市场反转 (Reversal) 的综合交易系统。与仅依赖固定 70/30 线的传统 RSI 不同,本指标融合了 唐奇安通道 (Donchian Channels)、波动率挤压 (Squeeze) 以及 Libertus 无滞后背离算法,以提供高胜率的交易信号。
🚀 核心功能
强趋势推动系统 (唐奇安突破):
检测 RSI 动能是否强劲到足以推动唐奇安通道的上轨或下轨扩张。
信号: 在 20/80 轴位置显示 ▲ (多头推动) 或 ▼ (空头推动)。
Libertus 智能背离 (无滞后):
采用实时 Pivot 追踪算法,精准识别价格与 RSI 之间的背离,解决了传统背离指标的滞后问题。
信号: 在 30/70 轴位置显示 "Div" 标签。
智能变色 (极端行情高亮):
绿色/红色: 正常趋势状态。
白色 (White): 极端区域。当 RSI 突破 70 (超买) 或跌破 30 (超卖) 时,线条会强制变为醒目的亮白色,提示此处为变盘/背离高发区。
波动率挤压 (Squeeze) 过滤器:
实时监控市场波动率。当通道宽度显著收窄(低于历史平均水平)时,背景会填充为半透明紫色。
含义: “暴风雨前的宁静”——预示着大行情即将爆发,此时应空仓等待突破方向。
🛠 使用策略
顺势交易 (Trend): 当 RSI 呈现 绿色/红色 并伴随 ▲ / ▼ 信号时进场。这代表动能极强,处于主升/主跌浪。
左侧反转 (Reversal): 重点关注 RSI 线条变为 白色 (Extreme) 时出现的 "Div" 背离信号。这通常意味着价格虽创新高,但动能已耗尽。
止盈/离场: 留意 "Weak" (衰竭) 标签,它出现在 RSI 掉回中间震荡区时。
仪表盘: 右下角面板实时显示 RSI 数值、市场状态 (极值/背离/趋势) 以及波动率状态 (挤压/扩张)。

Stop Loss Hunting Zones This Pine Script indicator identifies and visualizes potential "stop loss hunting zones" on charts. It marks price levels where institutional traders or market makers might trigger retail stop losses before reversing direction, helping traders avoid false breakouts and better time their entries.
Key Features:
Four Types of Detection Zones-
1.Swing Zones (Red/Green): Identifies swing highs and lows using pivot point analysis where stop losses typically cluster above resistance and below support levels.
2.Breakout Zones (Orange): Detects consolidation periods and marks levels where false breakouts might occur, trapping traders who enter too early.
3.Wick Trap Zones (Purple): Highlights candles with disproportionately large wicks relative to body size, indicating potential stop loss raids with quick reversals.
4.Volume Reversal Zones (Blue): Identifies high-volume reversal patterns where price briefly touches a level before sharply reversing, suggesting stop loss absorption.
Customizable Parameters:
Swing Lookback: Period for pivot point detection (5-100 bars)
Swing Threshold: Minimum percentage move to qualify as a swing (0.5-10%)
Volume Threshold: Multiplier for detecting unusual volume (1-5x average)
Wick Ratio: Minimum wick-to-total range ratio for trap detection (0.3-0.9)
ATR Settings: Length and multiplier for zone buffer calculation
Zone Management: Maximum zones per type and minimum distance between zones
Display Options: Toggle individual zone types, heatmap intensity, labels, and transparency
Visual Features:
Heatmap Mode: Colour intensity reflects how often price has tested each zone
Smart Zone Management: Prevents chart cluttering by limiting zones and removing those too close together
Dynamic Labels: Clear zone identification with customizable display
Adjustable Transparency: Control zone visibility (10-90%)
How It Works:
The indicator uses ATR-based buffers to create zones around detected levels. It tracks price history to calculate "intensity" scores for the heatmap feature, helping identify the most significant hunting zones. The algorithm ensures zones are meaningful by enforcing minimum distances and limiting total zones displayed.
Avoid placing stop losses at obvious levels where hunting is likely
Identify potential reversal points for counter-trend trades
Recognize false breakout patterns before they complete
Time entries after stop loss hunts are absorbed
Technical Details:
Maximum 500 boxes, lines, and labels for comprehensive zone tracking
Compatible with all timeframes
Works on any market (stocks, forex, crypto, futures)
Real-time detection as new bars confirm
This indicator is designed for traders who want to understand where institutional players might target retail stop losses and use that information to their advantage. Please boost & follow for more. Happy trading !!
Disclaimer: This indicator is for educational and informational purposes only. It should not be considered financial advice. Always perform your own analysis and risk management before trading.

Borna Zones Entry First Close BreakThis indicator marks close-based entry signals for DAX / GER40 on the 1-minute timeframe, using two fixed intraday zones:
08:00 candle → Zone 08
09:00 candle → Zone 09
If the zones overlap, an entry is marked on the first candle close breaking the combined zone.
If the zones are separated, an entry is marked on the first candle close breaking the 09:00 zone, in the direction of the 08:00 zone.
Entries are shown only between 09:00 and 11:00 and only on the first valid breakout (no repeated signals).

SNIPER ORB V4SNIPER ORB V4
### What It Does
Draws 5/15/30 minute Opening Range Breakout levels with confirmation patterns.
### Session Times
| Session | Hours (ET) |
|---------|------------|
| London | 3:00 - 9:30 |
| New York | 9:30 - 17:00 |
### Levels Drawn
| Level | Color Default | Purpose |
|-------|---------------|---------|
| 5m ORB H/L | Blue | Scalp levels |
| 15m ORB H/L | Cyan | Swing levels |
| 30m ORB H/L | Purple | **Primary levels** |
| Targets 1x-3x | Green/Red | Profit targets |
### Signals
| Signal | Meaning | Priority |
|--------|---------|----------|
| `ORB↑` | Confirmed breakout up | ⭐⭐ |
| `ORB↓` | Confirmed breakout down | ⭐⭐ |
| `RT↑` | Retest long entry | ⭐⭐⭐ **BEST** |
| `RT↓` | Retest short entry | ⭐⭐⭐ **BEST** |
| `FVG↑` | FVG zone long | ⭐⭐⭐ |
| `FVG↓` | FVG zone short | ⭐⭐⭐ |
| `ABS` | Absorption (caution) | ⚠️ Warning |
| `FK!` | Fakeout detected | ❌ Avoid |
### FVG Zones (Blue Boxes)
- **Bullish FVG** = Gap below price → Support zone
- **Bearish FVG** = Gap above price → Resistance zone
- **Best Entry** = Price touches FVG + Engulfing candle
### Bar Colors
| Color | Meaning |
|-------|---------|
| Bright Green | Bullish breakout confirmed |
| Bright Red | Bearish breakout confirmed |
| Light Green | Bullish retest entry |
| Light Red | Bearish retest entry |
### Info Table Key
| Field | Green = Good | Yellow/Orange = Caution |
|-------|--------------|-------------------------|
| Volume | HIGH VOL | Normal |
| Body | STRONG (70%+) | Normal/Weak |
| Status | BROKE HIGH/LOW | IN RANGE |
### Quick Trade Plan
```
LONG:
1. Wait for 30m ORB to complete
2. Watch for ORB↑ breakout
3. WAIT for pullback to ORB High
4. Enter on RT↑ or FVG↑ signal
5. SL = Below 30m ORB Low
6. TP = Target 1x or 2x
SHORT:
1. Wait for 30m ORB to complete
2. Watch for ORB↓ breakout
3. WAIT for pullback to ORB Low
4. Enter on RT↓ or FVG↓ signal
5. SL = Above 30m ORB High
6. TP = Target 1x or 2x
```
---

SNIPER Initial Balance V1SNIPER INITIAL BALANCE V1
### What It Does
Draws the first hour's high/low range with extensions and breakout signals.
### IB Times (Auto-Selected)
| Market Type | IB Period (ET) |
|-------------|----------------|
| Index (ES/NQ/YM) | 9:30 - 10:30 |
| Gold (GC/MGC) | 8:30 - 9:30 |
| Energy (CL) | 9:00 - 10:00 |
### Levels Drawn
| Level | Style | Purpose |
|-------|-------|---------|
| IB High | Solid | Resistance |
| IB Low | Solid | Support |
| IB Mid | Dashed | Mean reversion |
| 50% Ext | Dotted | Target 1 |
| 100% Ext | Dotted | Target 2 |
| 1SD (1.28x) | Dashed | 80% range |
| 2SD (2.0x) | Dashed | 95% range |
### Signals
| Signal | Meaning | Action |
|--------|---------|--------|
| `IB↑` | Breakout above IB High | Look for long |
| `IB↓` | Breakout below IB Low | Look for short |
| `RT↑` | Retest long entry | **BEST ENTRY** - Go long |
| `RT↓` | Retest short entry | **BEST ENTRY** - Go short |
| `FK` | Fakeout warning | **AVOID** - Don't enter |
### Entry Requirements (All Must Be True)
- ✅ Close above/below level (not just wick)
- ✅ Volume ≥ 1.3x average
- ✅ Body ≥ 60% of candle
- ✅ Minimal adverse wick
### Quick Trade Plan
```
LONG: Wait for RT↑ → SL below IB Low → TP at 50% or 100% ext
SHORT: Wait for RT↓ → SL above IB High → TP at 50% or 100% ext
```
---

Smart Money Concept Change of Character Break of StructureSMC Structure
Visualizes Change of Character (CHoCH) and Break of Structure (BoS) - two fundamental Smart Money Concepts for identifying trend reversals and continuations.
This is the 1st version of an implementation of this concept.
It is NOT supposed to be used as a signal but a confirmation. Best use during NYSE hours.
Full Description
Overview
This indicator automatically detects and displays two core Smart Money Concepts (SMC) directly on your chart:
CHoCH (Change of Character) – The first structural break against the prevailing trend, signaling a potential reversal
BoS (Break of Structure) – A structural break in the direction of the current trend, confirming continuation
These concepts are essential building blocks of SMC trading methodology, helping traders identify where institutional players may be entering or exiting positions.
How It Works
The indicator uses pivot-based swing detection to identify significant highs and lows. When price breaks through these levels, it classifies the move as either a CHoCH or BoS based on the current trend context.
CHoCH (Change of Character)
Occurs when price breaks structure AGAINST the current trend
First warning sign that the trend may be reversing
Displayed as a solid horizontal line with "CHoCH" label
Green = Bullish reversal | Red = Bearish reversal
BoS (Break of Structure)
Occurs when price breaks structure IN THE DIRECTION of the current trend
Confirms that the existing trend remains intact
Displayed as a dashed horizontal line with "BoS" label
Teal = Bullish continuation | Maroon = Bearish continuation
Visual Example
Uptrend with BoS (continuation):
HH ◄── BoS (trend continues)
/
HL
/
HH
/
HL
Uptrend → CHoCH → Downtrend (reversal):
HH
/ \
HL \
LL ◄── CHoCH (trend reversal!)
Settings
Pivot Settings
Pivot Lookback: Number of bars used to identify swing highs/lows (default: 5). Higher values = fewer but more significant structure points.
Display Options
Show CHoCH: Toggle CHoCH visualization
Show BoS: Toggle BoS visualization
Show Swing Points: Display SH/SL labels at detected pivots
Extend Lines to Right: Extend structure lines into future bars
Show Info Table: Display current trend and last swing levels
Show Trend Background: Color the chart background based on trend direction
Colors
Fully customizable colors for all elements
How to Use
Identify the trend: Look at the sequence of CHoCH and BoS signals to understand market structure
Watch for CHoCH: A CHoCH signals potential reversal – wait for confirmation before trading against the previous trend
Trade with BoS: BoS confirms trend continuation – look for entries on pullbacks in the direction of the trend
Combine with other SMC concepts: Works great alongside Order Blocks, Fair Value Gaps, and liquidity concepts
Tips
Use higher pivot lookback values on higher timeframes for cleaner signals
A CHoCH doesn't guarantee reversal – it's the first warning sign, not confirmation
Multiple BoS signals in a row indicate a strong, healthy trend
Look for CHoCH occurring at key levels (support/resistance, order blocks) for higher probability setups
Feedback Welcome!
This is an open-source indicator and I'd love to hear your thoughts!
Please comment below if you have:
Feature requests or ideas for improvements
Bug reports or issues
Suggestions for additional SMC concepts to add
Your feedback helps make this indicator better for everyone. Happy trading! 🚀

Custom Session ORB - Extending Past Current CandleCustom Session ORB - Extending Past Current Candle
This indicator plots Opening Range Breakout (ORB) levels for one or two customizable trading sessions directly on your chart. It dynamically tracks the high, low, and midpoint of the defined session(s) and extends these levels beyond the session using a configurable offset.
Features:
Supports two custom sessions.
New York and Asia pre-saved.
Automatically tracks session High, Low, and Mid.
Option to extend ORB levels past the live candle.
Option to display only the most recent ORB for a clean chart.
Configurable line thickness, style, and label size.
Works in Eastern Standard Time (EST) without manual adjustment.
Settings:
Show Labels: Toggle to display ORB values on chart.
Label Font Size: Small, Normal, Large.
Mid Line Style: Solid, Dashed, or Dotted.
ORB Line Thickness: Set line thickness of ORB levels.
Extend Past Current Candle by N Bars: Controls how far the ORB extends visually.
Show Only Current ORB: Cleans chart by removing previous session ORB levels.
Enable Session 1 / 2: Toggle individual sessions on/off.
Session Time: Set the start and end times for each session (automatically in EST).
How It Works:
The indicator monitors the defined session time, records the high, low, and midpoint, and draws lines at those levels. When the session ends, the lines are extended by the specified offset for easy breakout visualization. Labels can optionally show the exact price levels.

High Volume Breakout DetectorThis indicator is a dedicated volume analysis tool displayed in a separate pane below the price chart. It visually highlights significant volume surges (spikes) by comparing the current bar's volume to a dynamic threshold based on a Simple Moving Average (SMA) of volume.
Key Concepts and Methodology:
- The core calculation uses a user-configurable Simple Moving Average (default: 20 periods) of historical volume to establish a baseline of "normal" trading activity.
- A customizable multiplier (default: 1.50, meaning 150% of the SMA) defines the threshold for a volume spike. When the current bar's volume meets or exceeds this threshold, it is classified as a spike—indicating unusually high participation that often accompanies breakouts, reversals, climaxes, or institutional activity.
- Volume bars are plotted as columns and colored based on two factors:
- Candle direction: Green shades for bullish candles (close ≥ open), red shades for bearish candles (close < open).
- Spike status: Brighter/solid colors for confirmed spikes, muted/translucent colors for normal volume. This candle-matched coloring helps traders quickly assess whether the surge supports buying pressure (green spike on up candle) or selling/distribution (red spike on down candle).
- Optional overlays include the volume SMA line (blue) and the dynamic threshold line (orange, plotted as circles for easy distinction).
Features and Customization:
- Fully adjustable inputs: SMA length, multiplier threshold, colors for up/down/normal/spike bars, and toggles for showing the SMA line, threshold line, or background highlighting on spikes.
- Built-in alert condition triggers reliably on volume spikes (≥ selected multiplier of SMA), with a constant message string including ticker, timeframe, volume value, and threshold reference.
How to Use:
- Add to any chart in a separate pane (overlay=false).
- Look for brighter colored volume bars as potential signals of conviction in price moves. For example:
- Green spikes on up candles may signal strong accumulation or breakout confirmation.
- Red spikes on down candles may indicate distribution or exhaustion selling.
- Combine with price action, support/resistance, or trend indicators for confluence.
- Ideal for day trading, swing trading, or spotting volume climaxes on stocks, forex, crypto, or futures across any timeframe.
The unique combination of candle-direction-matched coloring for spikes, visual threshold plotting, and focused spike highlighting provides clearer, more actionable insight into directional volume pressure compared to standard volume displays.
