Limited Growth Stock-to-Flow (LGS2F) [AlgoAlpha]Description:
The "∂ Limited Growth Stock-to-Flow (LG-S2F)" indicator, developed by AlgoAlpha, is a technical analysis tool designed to analyze the price of Bitcoin (BTC) based on the Stock-to-Flow model. The indicator calculates the expected price range of BTC by incorporating variables such as BTC supply, block height, and model parameters. It also includes error bands to indicate potential overbought and oversold conditions.
How it Works:
The LG-S2F indicator utilizes the Stock-to-Flow model, which measures the scarcity of an asset by comparing its circulating supply (stock) to its newly produced supply (flow). In this script, the BTC supply and block height data are obtained to calculate the price using the model formula. The formula includes coefficients (a, b, c) and exponentiation functions to derive the expected price.
The script incorporates error bands based on uncertainty values derived from the standard errors of the model parameters. These error bands indicate the potential range of variation in the expected price, accounting for uncertainties in the model's parameters. The upper and lower error bands visualize potential overbought and oversold conditions, respectively.
Usage:
Traders can utilize the LG-S2F indicator to gain insights into the potential price movements of Bitcoin. The indicator's main line represents the expected price, while the error bands highlight the potential range of variation. Traders may consider taking long positions when the price is near or below the lower error band and short positions when the price is close to or above the upper error band.
It's important to note that the LG-S2F indicator is specifically designed for Bitcoin and relies on the Stock-to-Flow model. Users should exercise caution and consider additional analysis and factors before making trading decisions solely based on this indicator.
Originality:
The LG-S2F indicator, developed by QuantMario and AlgoAlpha, is an original implementation that combines the Stock-to-Flow model with error bands to provide a comprehensive view of BTC's potential price range. While the concept of Stock-to-Flow analysis exists, the specific calculations, incorporation of error bands, and customization options in this script are unique to QuantMario's methodology. The script is released under Mozilla Public License 2.0, allowing users to utilize and modify it while adhering to the license terms.
Tìm kiếm tập lệnh với "btc股市下跌"

Satoshi Indicator
This is a very simple price comparison indicator.
People who are familiar with PineScript can easily create it, but most people who are not familiar with PineScript often double-check BTC pair's charts to compare Bitcoin and other symbols.
This indicator made for that process easier.
The indicator is basically supposed to show the price ratio of BTC and the symbol you're looking at.
However, if you like, you can also select other symbol to compare in the settings of the indicator.
In addition, if you select 'Color with RSI' in the settings of the indicator, you can see the RSI for the current Pair Chart through the color of the line.
----
이것은 아주 간단한 가격 비교용 인디케이터입니다.
파인스크립트에 익숙한 사람은 간단히 만들어낼 수 있지만, 파인스크립트에 익숙하지 않은 대부분의 사람들은 비트코인과 그 외의 종목들을 비교하기 위해 BTC pair의 차트를 다시 확인하곤 합니다.
그러한 과정을 좀 더 편하게 하기 위해 이 지표를 만들었습니다.
해당 지표는 기본적으로 BTC 와 현재 보고 있는 차트의 가격 비율을 표시하도록 되어있습니다.
하지만 원한다면, 지표의 설정에서 비교할 다른 차트를 선택할 수도 있습니다.
또한, 지표의 설정에서 'Color with RSI'를 선택한다면, 현재 btc pair 차트에 대한 RSI를 line의 색상을 통해 확인할 수 있습니다.
.srb suiteThe essential suite Indicator.
that are well integrated to ensure visibility of essential items for trading.
it is very cumbersome to put symbol in the Tradingview chart and combine essential individual indicators one by one.
Moreover even with such a combination, the chart is messy and visibility is not good.
This is because each indicator is not designed with the others in mind.
This suite was developed as a composite-solution to that situation, and will make you happy.
designed to work in the same pane with open-source indicator by default.
Recommended visual order ; Back = .srb suite, Front = .srb suite vol & info
individually turn on/off only what you need on the screen.
BTC-agg. Volume
4 BTC-spot & 4 BTC-PERP volume aggregated.
It might helps you don't miss out on important volume flows.
Weighted to spot trading volume when using PERP+spot volume .
If enabled, BTC-agg.Vol automatically applied when selecting BTC-pair.
--> This is used in calculations involving volumes, such as VWAP.
Moving Average
1 x JMA trend ribbon ; Accurately follow short-term trend changes.
3 x EMA ribbon ; zone , not the line.
MA extension line ; It provide high visibility to recognize the direction of the MA.
SPECIAL TOOLS
VWAP with Standard Deviation Bands
VWAP ruler
BB regular (Dev. 2.0, 2.5)
BB Extented (Dev. 2.5, 3.0, 3.5)
Fixed Range Volume Profile ; steamlined one, performace tuned & update.
SPECIAL TOOLS - Auto Fibonacci Retracement - New GUI
'built-in auto FBR ' has been re-born
It shows - retracement Max top/ min bottom ; for higher visibility
It shows - current retracement position ; for higher visibility
The display of the Fib position that exceeds the regular range is auto-determined according to the price.
tradingview | chart setting > Appearance > Top margin 0%, Bottom margin 0% for optimized screen usage
tradingview | chart setting > Appearance > Right margin 57
.srb suite vol & info --> Visual Order > Bring to Front
.srb suite vol & info --> Pin to scale > No scale (Full-screen)
Visual order ; Back = .srb suite, Front = .srb suite vol & info
1. Fib.Retracement core is from tradingview built-in FBR ---> upgrade new-type GUI, and performance tuned.
2. Fixed-range volume-profile core is from the open-source one ---> some update & perf.tuned.
---------------------------------------------------------------------------------------------------------------------------------------
if you have any questions freely contact to me by message on tradingview.
but please understand that responses may be quite late.
Special thanks to all of contributors of community.
The script may be freely distributed under the MIT license.

Joker Trailing TP BotTrailing Take Profit is used by the traders to increase their gains when the prices moves in a favorable direction. Let’s have a look at what is Trailing Take Profit and how it works.
What Is a Trailing Take Profit?
Trailing Take Profit is a term largely used in crypto, whereas you may encounter the term Trailing Stop in traditional trading describing almost the same thing, So what’s the difference between Trailing Take Profit and Trailing Stop? Trailing Stop is a type of Stop Loss automatically moving in the same direction as the asset’s price. Trailing Take Profit is nothing else than Trailing Stop activated after initial Take Profit is reached.
The main difference between these two is that Trailing Take Profit takes the profit in any case (altough it might be later annihilated by Trailing Stop). Thus, Trailing Take Profit reduces the risks that might’ve occurred using Trailing Stop alone. Trailing Take Profit is bound to the maximum of Take Profit price instead of just a price increase/decrease.
As you might notice, the terms Trailing Take Profit and Stop Loss are quite similar. To avoid confusion, in this article we will be talking about Trailing Take Profit as defined above.
Trailing Take Profit only moves in one direction. It is designed to lock in profit and limit losses. The trailing profit only moves up (in case of a long strategy) once the price has surpassed previous high and a new high has been established. If the trailing take profit moves up, it cannot move back down, thus securing the profit and preventing losses.
Trailing Take Profit allows the trade to remain open and continue to profit as long as the price is moving in the investor’s favor. If the price changes direction and the change surpasses the previously set percentage the order will be closed.
How Does it Work?
For example if you buy BTC at the price of 10000, if you set a Take Profit at 11000 and a Trailing Take Profit at 5% :
If the price goes up to 10500, nothing happens because the Take Profit at 11000 has not been reached.
Then if the BTC price goes up top 11000, a Stop Order at 10450 will be set.
Then if the BTC price goes down to 10500, the Stop Order stays at 104500.
Then if the BTC price goes up to 12000, the Stop Order moves to 11400.
Then if the BTC price goes down to 11000, the Stop Order at 11400 is executed.
You see that without Trailing Take Profit, the buy order would have been sold at 11000. Thus, a trader would miss an earning opportunity at 11400.

Brrrrr strategyTheory
When Tether prints new USDT the price of BTC rises.
When Tether burns USDT the price of BTC goes down.
Idea
Open a long position when Tether starts printing new USDT.
Close a long position when Tether begins to burn USDT.
Optional: open a short position.
(Short positions can be disabled in this script's settings.)
Donchian Channel
USDT changes frequently and almost every day. Therefore it is necessary to reduce the number of signals. This way there will be less false loss signals. The Donchian channel is well suited for this task.
If the amount of USDT has exceeded the maximum for the last 50 days, it is a signal to open a long position.
If the amount of USDT has become less than the minimum over the last 50 days, it is a signal to close a long position. Or to open a short position.
The number of days can be changed in the settings of this script.
Data
The data is only available for 1-day timeframe. The data provider is Glassnode.
For
Only for BTC /USD (or BTC /USDT, BTC/USDC , etc)
For 1 day timeframe only

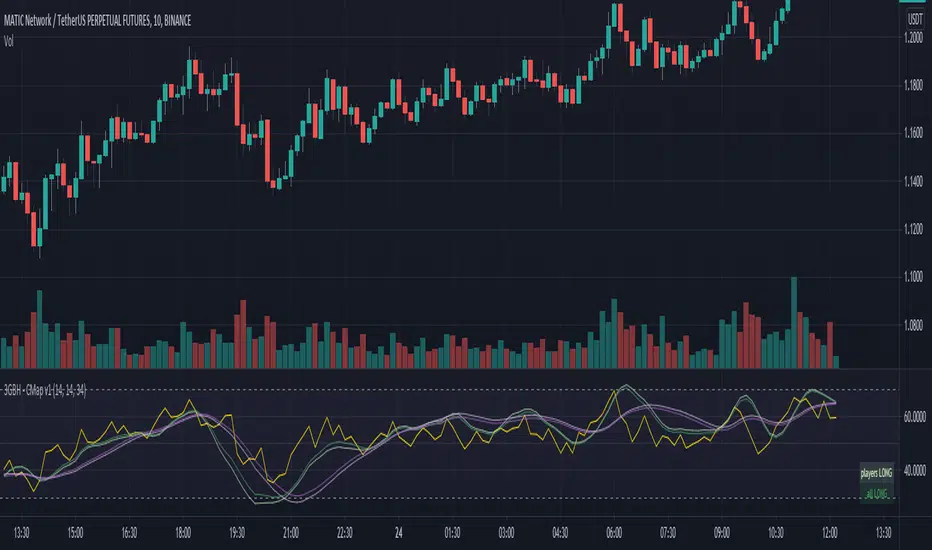
3GBH - CapMap v1This indicator compares the RSI of the symbol you're viewing against;
- TOTAL ( market cap of the entire cryptocurrency market )
- TOTAL2 ( market cap of the entire cryptocurrency market excluding BTC )
- BTCs market cap
- ETHs market cap
-----
This helps to track the trend of a certain symbol and to quickly see how it's performing in contrast to key market players ( BTC & ETH ).
It also allows you to see the current state of the crypto market as a whole.
I tend to use TOTAL & TOTAL2 for technical analysis on BTC, and BTC & ETH for technical analysis on alt-coins.
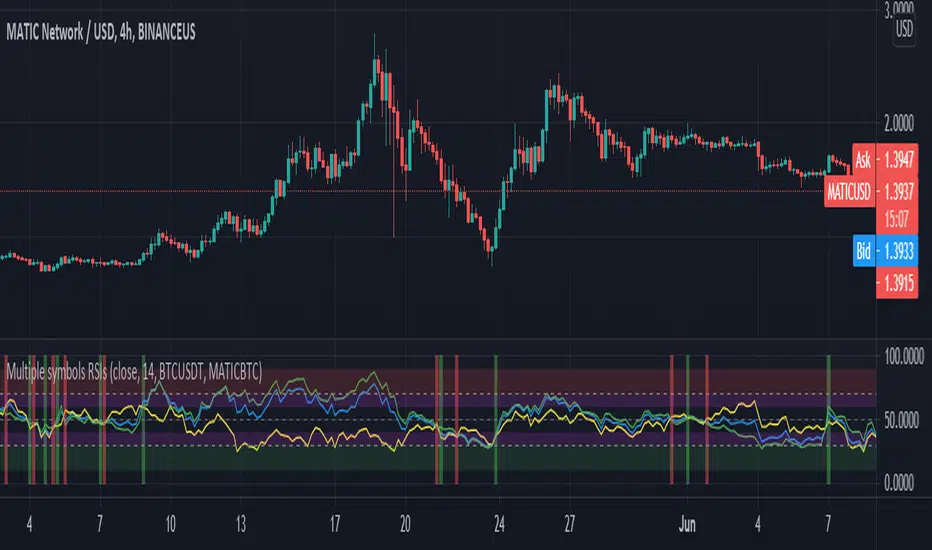
Crypto Tripple RSIGives an ability to compare 3 RSIs:
current altcoin + BTC (e.g. ADABTC) - green by default
current pair (e.g. ADAUSDT) - blue by default
BTC (e.g. BTCUSDT) - yellow by default
It helps to understand the cause of price change - whether BTC provokes price change or not. Also it shows performance of an altcoin - the bigger gaps between RSIs, the stronger (RSI of BTC is on the bottom)/ weaker (RSI of BTC is on the top) altcoin is.
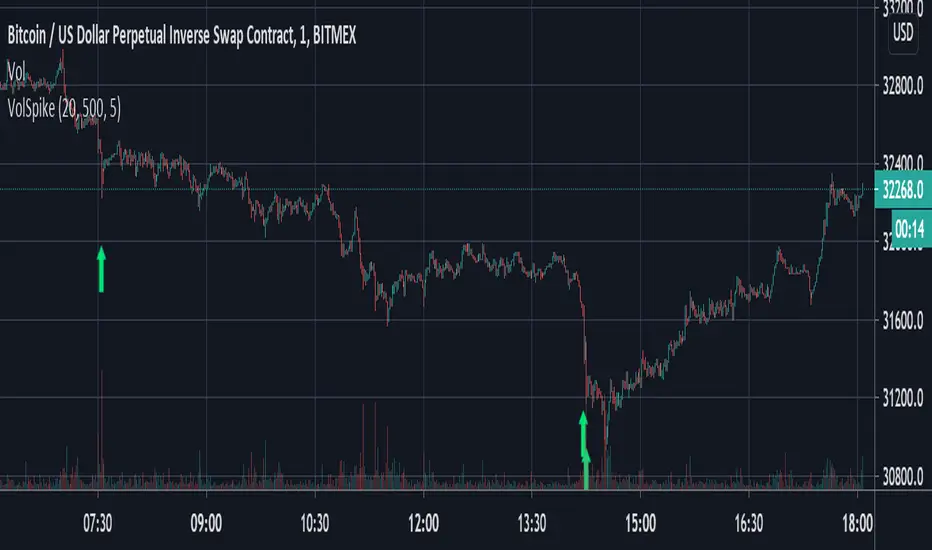
Volume Spike Strategy This is a Pine Script implementation of “Capitalize AI: Volume Spike Strategy" by Bitcoin Trading Challenge (copied with permission).
Original Capital AI formula :
If BTC/USD 1 minute volume > BTC/USD average volume in 20-1m bar by at least 500% and if BTC/USD is below the MA (5,1m,close) of BTC/USD then buy 10,000 USD WORTH of BTC/USD
Tested on XBTUSD 1 minute.
Original strategy is buy-only. Option for sells was added (enable in settings).
First published script -- comments/feedback appreciated
Ruckard TradingLatinoThis strategy tries to mimic TradingLatino strategy.
The current implementation is beta.
Si hablas castellano o espanyol por favor consulta MENSAJE EN CASTELLANO más abajo.
It's aimed at BTCUSDT pair and 4h timeframe.
STRATEGY DEFAULT SETTINGS EXPLANATION
max_bars_back=5000 : This is a random number of bars so that the strategy test lasts for one or two years
calc_on_order_fills=false : To wait for the 4h closing is too much. Try to check if it's worth entering a position after closing one. I finally decided not to recheck if it's worth entering after an order is closed. So it is false.
calc_on_every_tick=false
pyramiding=0 : We only want one entry allowed in the same direction. And we don't want the order to scale by error.
initial_capital=1000 : These are 1000 USDT. By using 1% maximum loss per trade and 7% as a default stop loss by using 1000 USDT at 12000 USDT per BTC price you would entry with around 142 USDT which are converted into: 0.010 BTC . The maximum number of decimal for contracts on this BTCUSDT market is 3 decimals. E.g. the minimum might be: 0.001 BTC . So, this minimal 1000 amount ensures us not to entry with less than 0.001 entries which might have happened when using 100 USDT as an initial capital.
slippage=1 : Binance BTCUSDT mintick is: 0.01. Binance slippage: 0.1 % (Let's assume). TV has an integer slippage. It does not have a percentage based slippage. If we assume a 1000 initial capital, the recommended equity is 142 which at 11996 USDT per BTC price means: 0.011 BTC. The 0.1% slippage of: 0.011 BTC would be: 0.000011 . This is way smaller than the mintick. So our slippage is going to be 1. E.g. 1 (slippage) * 0.01 (mintick)
commission_type=strategy.commission.percent and commission_value=0.1 : According to: binance . com / en / fee / schedule in VIP 0 level both maker and taker fees are: 0.1 %.
BACKGROUND
Jaime Merino is a well known Youtuber focused on crypto trading
His channel TradingLatino
features monday to friday videos where he explains his strategy.
JAIME MERINO STANCE ON BOTS
Jaime Merino stance on bots (taken from memory out of a 2020 June video from him):
'~
You know. They can program you a bot and it might work.
But, there are some special situations that the bot would not be able to handle.
And, I, as a human, I would handle it. And the bot wouldn't do it.
~'
My long term target with this strategy script is add as many
special situations as I can to the script
so that it can match Jaime Merino behaviour even in non normal circumstances.
My alternate target is learn Pine script
and enjoy programming with it.
WARNING
This script might be bigger than other TradingView scripts.
However, please, do not be confused because the current status is beta.
This script has not been tested with real money.
This is NOT an official strategy from Jaime Merino.
This is NOT an official strategy from TradingLatino . net .
HOW IT WORKS
It basically uses ADX slope and LazyBear's Squeeze Momentum Indicator
to make its buy and sell decisions.
Fast paced EMA being bigger than slow paced EMA
(on higher timeframe) advices going long.
Fast paced EMA being smaller than slow paced EMA
(on higher timeframe) advices going short.
It finally add many substrats that TradingLatino uses.
SETTINGS
__ SETTINGS - Basics
____ SETTINGS - Basics - ADX
(ADX) Smoothing {14}
(ADX) DI Length {14}
(ADX) key level {23}
____ SETTINGS - Basics - LazyBear Squeeze Momentum
(SQZMOM) BB Length {20}
(SQZMOM) BB MultFactor {2.0}
(SQZMOM) KC Length {20}
(SQZMOM) KC MultFactor {1.5}
(SQZMOM) Use TrueRange (KC) {True}
____ SETTINGS - Basics - EMAs
(EMAS) EMA10 - Length {10}
(EMAS) EMA10 - Source {close}
(EMAS) EMA55 - Length {55}
(EMAS) EMA55 - Source {close}
____ SETTINGS - Volume Profile
Lowest and highest VPoC from last three days
is used to know if an entry has a support
VPVR of last 100 4h bars
is also taken into account
(VP) Use number of bars (not VP timeframe): Uses 'Number of bars {100}' setting instead of 'Volume Profile timeframe' setting for calculating session VPoC
(VP) Show tick difference from current price {False}: BETA . Might be useful for actions some day.
(VP) Number of bars {100}: If 'Use number of bars (not VP timeframe)' is turned on this setting is used to calculate session VPoC.
(VP) Volume Profile timeframe {1 day}: If 'Use number of bars (not VP timeframe)' is turned off this setting is used to calculate session VPoC.
(VP) Row width multiplier {0.6}: Adjust how the extra Volume Profile bars are shown in the chart.
(VP) Resistances prices number of decimal digits : Round Volume Profile bars label numbers so that they don't have so many decimals.
(VP) Number of bars for bottom VPOC {18}: 18 bars equals 3 days in suggested timeframe of 4 hours. It's used to calculate lowest session VPoC from previous three days. It's also used as a top VPOC for sells.
(VP) Ignore VPOC bottom advice on long {False}: If turned on it ignores bottom VPOC (or top VPOC on sells) when evaluating if a buy entry is worth it.
(VP) Number of bars for VPVR VPOC {100}: Number of bars to calculate the VPVR VPoC. We use 100 as Jaime once used. When the price bounces back to the EMA55 it might just bounce to this VPVR VPoC if its price it's lower than the EMA55 (Sells have inverse algorithm).
____ SETTINGS - ADX Slope
ADX Slope
help us to understand if ADX
has a positive slope, negative slope
or it is rather still.
(ADXSLOPE) ADX cut {23}: If ADX value is greater than this cut (23) then ADX has strength
(ADXSLOPE) ADX minimum steepness entry {45}: ADX slope needs to be 45 degrees to be considered as a positive one.
(ADXSLOPE) ADX minimum steepness exit {45}: ADX slope needs to be -45 degrees to be considered as a negative one.
(ADXSLOPE) ADX steepness periods {3}: In order to avoid false detection the slope is calculated along 3 periods.
____ SETTINGS - Next to EMA55
(NEXTEMA55) EMA10 to EMA55 bounce back percentage {80}: EMA10 might bounce back to EMA55 or maybe to 80% of its complete way to EMA55
(NEXTEMA55) Next to EMA55 percentage {15}: How much next to the EMA55 you need to be to consider it's going to bounce back upwards again.
____ SETTINGS - Stop Loss and Take Profit
You can set a default stop loss or a default take profit.
(STOPTAKE) Stop Loss % {7.0}
(STOPTAKE) Take Profit % {2.0}
____ SETTINGS - Trailing Take Profit
You can customize the default trailing take profit values
(TRAILING) Trailing Take Profit (%) {1.0}: Trailing take profit offset in percentage
(TRAILING) Trailing Take Profit Trigger (%) {2.0}: When 2.0% of benefit is reached then activate the trailing take profit.
____ SETTINGS - MAIN TURN ON/OFF OPTIONS
(EMAS) Ignore advice based on emas {false}.
(EMAS) Ignore advice based on emas (On closing long signal) {False}: Ignore advice based on emas but only when deciding to close a buy entry.
(SQZMOM) Ignore advice based on SQZMOM {false}: Ignores advice based on SQZMOM indicator.
(ADXSLOPE) Ignore advice based on ADX positive slope {false}
(ADXSLOPE) Ignore advice based on ADX cut (23) {true}
(STOPTAKE) Take Profit? {false}: Enables simple Take Profit.
(STOPTAKE) Stop Loss? {True}: Enables simple Stop Loss.
(TRAILING) Enable Trailing Take Profit (%) {True}: Enables Trailing Take Profit.
____ SETTINGS - Strategy mode
(STRAT) Type Strategy: 'Long and Short', 'Long Only' or 'Short Only'. Default: 'Long and Short'.
____ SETTINGS - Risk Management
(RISKM) Risk Management Type: 'Safe', 'Somewhat safe compound' or 'Unsafe compound'. ' Safe ': Calculations are always done with the initial capital (1000) in mind. The maximum losses per trade/day/week/month are taken into account. ' Somewhat safe compound ': Calculations are done with initial capital (1000) or a higher capital if it increases. The maximum losses per trade/day/week/month are taken into account. ' Unsafe compound ': In each order all the current capital is gambled and only the default stop loss per order is taken into account. That means that the maximum losses per trade/day/week/month are not taken into account. Default : 'Somewhat safe compound'.
(RISKM) Maximum loss per trade % {1.0}.
(RISKM) Maximum loss per day % {6.0}.
(RISKM) Maximum loss per week % {8.0}.
(RISKM) Maximum loss per month % {10.0}.
____ SETTINGS - Decimals
(DECIMAL) Maximum number of decimal for contracts {3}: How small (3 decimals means 0.001) an entry position might be in your exchange.
EXTRA 1 - PRICE IS IN RANGE indicator
(PRANGE) Print price is in range {False}: Enable a bottom label that indicates if the price is in range or not.
(PRANGE) Price range periods {5}: How many previous periods are used to calculate the medians
(PRANGE) Price range maximum desviation (%) {0.6} ( > 0 ): Maximum positive desviation for range detection
(PRANGE) Price range minimum desviation (%) {0.6} ( > 0 ): Mininum negative desviation for range detection
EXTRA 2 - SQUEEZE MOMENTUM Desviation indicator
(SQZDIVER) Show degrees {False}: Show degrees of each Squeeze Momentum Divergence lines to the x-axis.
(SQZDIVER) Show desviation labels {False}: Whether to show or not desviation labels for the Squeeze Momentum Divergences.
(SQZDIVER) Show desviation lines {False}: Whether to show or not desviation lines for the Squeeze Momentum Divergences.
EXTRA 3 - VOLUME PROFILE indicator
WARNING: This indicator works not on current bar but on previous bar. So in the worst case it might be VP from 4 hours ago. Don't worry, inside the strategy calculus the correct values are used. It's just that I cannot show the most recent one in the chart.
(VP) Print recent profile {False}: Show Volume Profile indicator
(VP) Avoid label price overlaps {False}: Avoid label prices to overlap on the chart.
EXTRA 4 - ZIGNALY SUPPORT
(ZIG) Zignaly Alert Type {Email}: 'Email', 'Webhook'. ' Email ': Prepare alert_message variable content to be compatible with zignaly expected email content format. ' Webhook ': Prepare alert_message variable content to be compatible with zignaly expected json content format.
EXTRA 5 - DEBUG
(DEBUG) Enable debug on order comments {False}: If set to true it prepares the order message to match the alert_message variable. It makes easier to debug what would have been sent by email or webhook on each of the times an order is triggered.
HOW TO USE THIS STRATEGY
BOT MODE: This is the default setting.
PROPER VOLUME PROFILE VIEWING: Click on this strategy settings. Properties tab. Make sure Recalculate 'each time the order was run' is turned off.
NEWBIE USER: (Check PROPER VOLUME PROFILE VIEWING above!) You might want to turn on the 'Print recent profile {False}' setting. Alternatively you can use my alternate realtime study: 'Resistances and supports based on simplified Volume Profile' but, be aware, it might consume one indicator.
ADVANCED USER 1: Turn on the 'Print price is in range {False}' setting and help us to debug this subindicator. Also help us to figure out how to include this value in the strategy.
ADVANCED USER 2: Turn on the all the (SQZDIVER) settings and help us to figure out how to include this value in the strategy.
ADVANCED USER 3: (Check PROPER VOLUME PROFILE VIEWING above!) Turn on the 'Print recent profile {False}' setting and report any problem with it.
JAIME MERINO: Just use the indicator as it comes by default. It should only show BUY signals, SELL signals and their associated closing signals. From time to time you might want to check 'ADVANCED USER 2' instructions to check that there's actually a divergence. Check also 'ADVANCED USER 1' instructions for your amusement.
EXTRA ADVICE
It's advised that you use this strategy in addition to these two other indicators:
* Squeeze Momentum Indicator
* ADX
so that your chart matches as close as possible to TradingLatino chart.
ZIGNALY INTEGRATION
This strategy supports Zignaly email integration by default. It also supports Zignaly Webhook integration.
ZIGNALY INTEGRATION - Email integration example
What you would write in your alert message:
||{{strategy.order.alert_message}}||key=MYSECRETKEY||
ZIGNALY INTEGRATION - Webhook integration example
What you would write in your alert message:
{ {{strategy.order.alert_message}} , "key" : "MYSECRETKEY" }
CREDITS
I have reused and adapted some code from
'Directional Movement Index + ADX & Keylevel Support' study
which it's from TradingView console user.
I have reused and adapted some code from
'3ema' study
which it's from TradingView hunganhnguyen1193 user.
I have reused and adapted some code from
'Squeeze Momentum Indicator ' study
which it's from TradingView LazyBear user.
I have reused and adapted some code from
'Strategy Tester EMA-SMA-RSI-MACD' study
which it's from TradingView fikira user.
I have reused and adapted some code from
'Support Resistance MTF' study
which it's from TradingView LonesomeTheBlue user.
I have reused and adapted some code from
'TF Segmented Linear Regression' study
which it's from TradingView alexgrover user.
I have reused and adapted some code from
"Poor man's volume profile" study
which it's from TradingView IldarAkhmetgaleev user.
FEEDBACK
Please check the strategy source code for more detailed information
where, among others, I explain all of the substrats
and if they are implemented or not.
Q1. Did I understand wrong any of the Jaime substrats (which I have implemented)?
Q2. The strategy yields quite profit when we should long (EMA10 from 1d timeframe is higher than EMA55 from 1d timeframe.
Why the strategy yields much less profit when we should short (EMA10 from 1d timeframe is lower than EMA55 from 1d timeframe)?
Any idea if you need to do something else rather than just reverse what Jaime does when longing?
FREQUENTLY ASKED QUESTIONS
FAQ1. Why are you giving this strategy for free?
TradingLatino and his fellow enthusiasts taught me this strategy. Now I'm giving back to them.
FAQ2. Seriously! Why are you giving this strategy for free?
I'm confident his strategy might be improved a lot. By keeping it to myself I would avoid other people contributions to improve it.
Now that everyone can contribute this is a win-win.
FAQ3. How can I connect this strategy to my Exchange account?
It seems that you can attach alerts to strategies.
You might want to combine it with a paying account which enable Webhook URLs to work.
I don't know how all of this works right now so I cannot give you advice on it.
You will have to do your own research on this subject. But, be careful. Automating trades, if not done properly,
might end on you automating losses.
FAQ4. I have just found that this strategy by default gives more than 3.97% of 'maximum series of losses'. That's unacceptable according to my risk management policy.
You might want to reduce default stop loss setting from 7% to something like 5% till you are ok with the 'maximum series of losses'.
FAQ5. Where can I learn more about your work on this strategy?
Check the source code. You might find unused strategies. Either because there's not a substantial increases on earnings. Or maybe because they have not been implemented yet.
FAQ6. How much leverage is applied in this strategy?
No leverage.
FAQ7. Any difference with original Jaime Merino strategy?
Most of the times Jaime defines an stop loss at the price entry. That's not the case here. The default stop loss is 7% (but, don't be confused it only means losing 1% of your investment thanks to risk management). There's also a trailing take profit that triggers at 2% profit with a 1% trailing.
FAQ8. Why this strategy return is so small?
The strategy should be improved a lot. And, well, backtesting in this platform is not guaranteed to return theoric results comparable to real-life returns. That's why I'm personally forward testing this strategy to verify it.
MENSAJE EN CASTELLANO
En primer lugar se agradece feedback para mejorar la estrategia.
Si eres un usuario avanzado y quieres colaborar en mejorar el script no dudes en comentar abajo.
Ten en cuenta que aunque toda esta descripción tenga que estar en inglés no es obligatorio que el comentario esté en inglés.
CHISTE - CASTELLANO
¡Pero Jaime!
¡400.000!
¡Tu da mun!

Odin's Kraken (TK Cross Strategy)A simple, yet profitable, trend following system based on 1 hour TK Crosses and ADX.
Works best on ETH/BTC, but is also profitable on other large-cap altcoin BTC pairs (ADA/BTC, EOS/BTC, and TRX/BTC ).
I'm still just getting started in the algo trading world, but if you have any questions I am more than happy to answer them in the comment section here or on Twitter (@pascaltmn).
Cheers.

Noro's Candles testRegularity of 62% for cryptocurrencies. Demo.
"BTC/USD", Bitstamp, 2 bars
- trades 1645
- long 66%
- short 56%
- all 61%
"BTC/USD", Bitfinex, 2 bars
- trades 1619
- long 68%
- short 57%
- all 62%
"ETH/USD", Bitfinex, 2 bars
- trades 1576
- long 65%
- short 58%
- all 61%
"ETH/BTC", Bitfinex, 2 bars
- trades 1598
- long 61%
- short 62%
- all 61%
"XRP/BTC", Bitfinex, 2 bars
- trades 1085
- long 59%
- short 67%
- all 63%
"XRP/BTC", Bitfinex, 2 bars
- trades 284
- long 58%
- short 67%
- all 63%

Understanding contract sizes in a strategyThis simple strat fires up on green bars, down on red bars. cannot get any simpler. So, it's a good example to check how returns are calculated.
First, the internal firing mechanism for the strategy.entry function is something hardcore. As result, the entry points can be confusing, and seem to appear in a wrong bar (as the 2nd and 3rd signals are good examples), but i'll put that aside to keep it simple. And, because i don't yet get it myself ;)
The example is simple, so that numbers can be followed easy. Chart in BTC/USD, so USD is the "base" currency used by strat to calculate. A contract/unit is the value of 1 unit in base currency. 1 Apple share is 600$, 1 bitcoin is 600$, 1 oz gold is 1330 bucks. So, here in each bar, the value of 1 contract is the value of the BTC in USD. simple as that.
The strat properties, can be passed as input fields (line 2) or accessed/changed in the right click->properties pop-up. To make it easier, initial capital is 1000 bucks, and "order size" is 1 contract. This means that the strat will open a position of 1 BTC when it fires. Value "Initial capital" makes no difference at all, at least with these choices. It's just for show. Try to put 1$ and 1 contract, the strat will still trade anyway. It manages to trade 1 contract(or BTC) values at ~600$, with a single dollar. nice ;)
Check the chart. see the little blue "BarUp +1" ? that's it, strat goes long 1 BTC. there's a little blue triangle on the bar, points to the value of entry.
Then later, on second move, the "BarDn -2", the strat goes short 2BTC. 1BTC to close the long +1 more to open a short.
The profit here is the difference between the value of the long opening and the long closing. The extra BTC (shorted) is part of the next position. Since this dumb strat just reverses the direction, there are always +2, -2 , +2.... 1 to close previous position, 1 to open another. At the strategy tester tab, the option "list of trades" shows in details each of the moves
Checking each move and comparing what we see with the chart itself helps to achieve ilumination :)
Bonus feature: as soon as you get it, try to increase the option "pyramiding" and see how the strat adds more contracts, and how it reverses the positions. sometimes it even makes sense!!!! :)

EMA 12-26-100 Momentum Strategy# Triple EMA Multi-Signal Momentum Strategy
## 📊 Overview
**Triple EMA Multi-Signal** is a comprehensive trend-following momentum strategy designed specifically for cryptocurrency markets. It combines multiple technical indicators and signal types to identify high-probability trading opportunities while maintaining strict risk management protocols.
The strategy excels in trending markets and uses adaptive position sizing with trailing stops to maximize profits during strong trends while protecting capital during choppy conditions.
## 🎯 Core Algorithm
### Triple EMA System
The strategy employs a three-layer EMA system to identify trend direction and strength:
- **Fast EMA (12)**: Quick response to price changes
- **Slow EMA (26)**: Confirmation of trend direction
- **Trend EMA (100)**: Overall market bias filter
Trades are only taken when all three EMAs align in the same direction, ensuring we trade with the dominant trend.
### Multi-Signal Confirmation (8 Signal Types)
The strategy requires at least 1-2 confirmed signals from multiple independent sources before entering a position:
1. **EMA Crossover** - Fast EMA crossing Slow EMA (primary signal)
2. **MACD Cross** - MACD line crossing signal line (momentum confirmation)
3. **RSI Reversal** - RSI bouncing from oversold/overbought zones
4. **Price Action** - Strong bullish/bearish candles (>60% of range)
5. **Volume Spike** - Above-average volume confirmation
6. **Breakout** - Price breaking 20-period high/low with volume
7. **Pullback to EMA** - Trend continuation after healthy retracement
8. **Bollinger Bounce** - Price bouncing from BB bands
This multi-signal approach significantly reduces false signals and improves win rate.
## 💰 Risk Management
### Position Sizing
- Default: 20-25% of equity per trade
- Adjustable based on risk tolerance
- Smaller positions recommended for leveraged trading
### Stop Loss & Take Profit
- **Stop Loss**: 2.0% (tight control of risk)
- **Take Profit**: 5.5% (2.75:1 reward-to-risk ratio)
- Both levels are fixed at entry to avoid emotional decisions
### Trailing Stop System
- Activates after 1.8% profit
- Trails at 1.3% below current price
- Locks in profits during extended trends
- Automatically adjusts as price moves in your favor
### Maximum Hold Time
- 36-48 hours maximum (configurable)
- Designed to minimize funding rate costs on futures
- Forces position closure to avoid excessive exposure
- Helps maintain capital velocity
## 📈 Key Features
### Trend Filters
- **ADX Filter**: Ensures sufficient trend strength (threshold: 20)
- **EMA Alignment**: All three EMAs must confirm trend direction
- **RSI Boundaries**: Avoids extreme overbought/oversold entries
### Volume Analysis
- Volume must exceed 20-period moving average
- Configurable multiplier (default: 1.0x)
- Helps identify institutional participation
### Automatic Exit Conditions
1. Take Profit target reached
2. Stop Loss triggered
3. Trailing stop activated
4. Trend reversal (EMA cross in opposite direction)
5. Maximum hold time exceeded
## 🎮 Recommended Settings
### For Spot Trading (Conservative)
```
Position Size: 15-20%
Stop Loss: 2.5%
Take Profit: 6.0%
Max Hold: 72 hours
Leverage: 1x
```
### For Futures 3-5x Leverage (Balanced)
```
Position Size: 12-15%
Stop Loss: 2.0%
Take Profit: 5.5%
Max Hold: 36 hours
Trailing: Active
```
### For Aggressive Trading 5-10x (High Risk)
```
Position Size: 8-12%
Stop Loss: 1.5%
Take Profit: 4.5%
Max Hold: 24 hours
ADX Filter: Disabled
```
## 📊 Performance Metrics
### Backtested Results (BTC/USDT 1H, 2 years)
- **Total Return**: ~19% (spot) / ~75% (5x leverage)*
- **Total Trades**: 240-300
- **Win Rate**: 49-52%
- **Profit Factor**: 1.25-1.50
- **Max Drawdown**: ~18-22%
- **Average Trade**: 0.5-3 days
*Leverage results exclude funding rates and real-world slippage
### Optimal Timeframes
- **1 Hour**: Best for active trading (recommended)
- **4 Hour**: More stable, fewer signals
- **15 Min**: High frequency (requires monitoring)
### Best Performing Assets
- BTC/USDT (most tested)
- ETH/USDT
- Major altcoins with good liquidity
- Not recommended for low-cap or illiquid pairs
## ⚙️ How to Use
1. **Add to Chart**: Apply strategy to 1H BTC/USDT chart
2. **Adjust Settings**: Configure risk parameters based on your preference
3. **Review Signals**: Green = Long, Red = Short, labels show signal count
4. **Monitor Performance**: Check strategy tester for detailed statistics
5. **Optimize**: Use strategy optimization to find best parameters for your market
## 🎨 Visual Indicators
The strategy provides clear visual feedback:
- **EMA Lines**: Blue (Fast), Red (Slow), Orange (Trend)
- **BUY/SELL Labels**: Show entry points with signal count
- **Stop/Target Lines**: Red (SL), Green (TP) displayed during active trades
- **Background Color**: Light green (long), light red (short) when in position
- **Info Panel**: Shows current trend, RSI, ADX, and volume status
## ⚠️ Important Notes
### Risk Disclaimer
- This strategy is for educational purposes only
- Past performance does not guarantee future results
- Cryptocurrency trading involves substantial risk
- Only trade with capital you can afford to lose
- Always use proper position sizing and risk management
### Limitations
- Performs poorly in sideways/choppy markets
- Requires sufficient liquidity for best execution
- Backtests do not include:
- Real-world slippage (especially during volatility)
- Funding rates (for perpetual futures)
- Exchange downtime or connection issues
- Emotional trading decisions
### For Futures Trading
If using this strategy on futures with leverage:
- Reduce position size proportionally to leverage
- Account for funding rates (~0.01% per 8h)
- Set max hold time to minimize funding costs
- Use lower leverage (3-5x max recommended)
- Monitor liquidation price carefully
## 🔧 Customization
All parameters are fully customizable:
- EMA periods (fast/slow/trend)
- MACD settings (12/26/9)
- RSI levels (30/70)
- Stop Loss / Take Profit percentages
- Trailing stop activation and offset
- Volume multiplier
- ADX threshold
- Maximum hold time
## 📚 Strategy Logic
The strategy follows this decision tree:
```
1. Check Trend Direction (EMA alignment)
↓
2. Scan for Entry Signals (8 types)
↓
3. Confirm with Filters (ADX, Volume, RSI)
↓
4. Enter Position with Fixed SL/TP
↓
5. Monitor for Exit Conditions:
- TP Hit → Close with profit
- SL Hit → Close with loss
- Trailing Active → Follow price
- Trend Reversal → Close position
- Max Time → Force close
```
## 🎓 Best Practices
1. **Start Conservative**: Use smaller position sizes initially
2. **Track Performance**: Monitor actual vs backtested results
3. **Optimize Regularly**: Market conditions change, adapt parameters
4. **Combine with Analysis**: Don't rely solely on automated signals
5. **Manage Emotions**: Stick to the system, avoid manual overrides
6. **Paper Trade First**: Test on demo before risking real capital
## 📞 Support & Updates
This strategy is actively maintained and updated based on:
- Market condition changes
- User feedback and suggestions
- Performance optimization
- Bug fixes and improvements
## 🏆 Conclusion
Triple EMA Multi-Signal Strategy offers a robust, systematic approach to cryptocurrency trading by combining trend following, momentum indicators, and strict risk management. Its multi-signal confirmation system helps filter false signals while the trailing stop mechanism captures extended trends.
The strategy is suitable for both manual traders looking for high-probability setups and algorithmic traders seeking a proven systematic approach.
**Remember**: No strategy wins 100% of the time. Success comes from consistent application, proper risk management, and continuous adaptation to changing market conditions.
---
*Version: 1.0*
*Last Updated: November 2025*
*Tested on: BTC/USDT, ETH/USDT (1H, 4H timeframes)*
*Recommended Capital: $5,000+ for optimal position sizing*

Ultimate Multi-Asset Correlation System by able eiei Ultimate Multi-Asset Correlation System - User Guide
Overview
This advanced TradingView indicator combines WaveTrend oscillator analysis with comprehensive multi-asset correlation tracking. It helps traders understand market relationships, identify regime changes, and spot high-probability trading opportunities across different asset classes.
Key Features
1. WaveTrend Oscillator
Main Signal Lines: WT1 (blue) and WT2 (red) plot momentum and its moving average
Overbought/Oversold Zones: Default levels at +60/-60
Cross Signals:
🟢 Bullish: WT1 crosses above WT2 in oversold territory
🔴 Bearish: WT1 crosses below WT2 in overbought territory
Higher Timeframe (HTF) Analysis: Shows WT1 from 4H, Daily, and Weekly timeframes for trend confirmation
2. Multi-Asset Correlation Tracking
Monitors relationships between:
Major Assets: Gold (XAUUSD), Dollar Index (DXY), US 10-Year Yield, S&P 500
Crypto Assets: Bitcoin, Ethereum, Solana, BNB
Cross-Asset Analysis: Correlation between traditional markets and crypto
3. Market Regime Detection
Automatically identifies market conditions:
Risk-On: High correlation + positive sentiment (🟢 Green background)
Risk-Off: High correlation + negative sentiment (🔴 Red background)
Crypto-Risk-On: Strong crypto correlations (🟠 Orange background)
Low-Correlation: Divergent market behavior (⚪ Gray background)
Neutral: Mixed signals (🟡 Yellow background)
How to Use
Basic Setup
Add to Chart: Apply the indicator to any chart (works on all timeframes)
Choose Display Mode (Display Options):
All: Shows everything (recommended for comprehensive analysis)
WaveTrend Only: Focus on momentum signals
Correlation Only: View market relationships
Heatmap Only: Simplified correlation view
Enable Asset Groups:
✅ Major Assets: Traditional markets (stocks, bonds, commodities)
✅ Crypto Assets: Digital currencies
Mix and match based on your trading focus
Reading the Charts
WaveTrend Section (Bottom Panel)
Above 0 = Bullish momentum
Below 0 = Bearish momentum
Above +60 = Overbought (potential reversal)
Below -60 = Oversold (potential bounce)
Lighter lines = Higher timeframe trends
Correlation Histogram (Colored Bars)
Blue bars: Major asset correlations
Orange bars: Crypto correlations
Purple bars: Cross-asset correlations
Bar height: Correlation strength (-50 to +50 scale)
Background Color
Intensity reflects correlation strength
Color shows market regime
Dashboard Elements
🎯 Market Regime Analysis (Top Left)
Current Regime: Overall market condition
Average Correlation: Strength of relationships (0-1 scale)
Risk Sentiment: -100% (risk-off) to +100% (risk-on)
HTF Alignment: Multi-timeframe trend agreement
Signal Quality: Confidence level for current signals
📊 Correlation Matrix (Top Right)
Shows correlation values between asset pairs:
1.00: Perfect positive correlation
0.75+: Strong correlation (🟢 Green)
0.50+: Medium correlation (🟡 Yellow)
0.25+: Weak correlation (🟠 Orange)
Below 0.25: Negative/no correlation (🔴 Red)
🔥 Correlation Heatmap (Bottom Right)
Visual matrix showing:
Gold vs. DXY, BTC, ETH
DXY vs. BTC, ETH
BTC vs. ETH
Color-coded strength
📈 Performance Tracker (Bottom Left)
Tracks individual asset momentum:
WT1 Values: Current momentum reading
Status: OB (overbought) / OS (oversold) / Normal
Trading Strategies
1. High-Probability Trend Following
✅ Entry Conditions:
WaveTrend bullish/bearish cross
HTF Alignment matches signal direction
Signal Quality > 70%
Correlation supports direction
2. Regime Change Trading
🎯 Watch for regime shifts:
Risk-Off → Risk-On = Consider long positions
High correlation → Low correlation = Reduce position size
Crypto-Risk-On = Focus on crypto longs
3. Divergence Trading
🔍 Look for:
Strong correlation breakdown = Potential volatility
Cross-asset correlation surge = Follow the leader
Volume-price correlation extremes = Trend confirmation
4. Overbought/Oversold Reversals
⚡ Trade reversals when:
WT crosses in extreme zones (-60/+60)
HTF alignment shows opposite trend weakening
Correlation confirms mean reversion setup
Customization Tips
Fine-Tuning Parameters
WaveTrend Core:
Channel Length (10): Lower = more sensitive, Higher = smoother
Average Length (21): Adjust for your timeframe
Correlation Settings:
Length (50): Longer = more stable, Shorter = more responsive
Smoothing (5): Reduce noise in correlation readings
Market Regime:
Risk-On Threshold (0.6): Lower = earlier regime signals
High Correlation Threshold (0.75): Adjust sensitivity
Custom Asset Selection
Replace default symbols with your preferred markets:
Major Assets: Any forex, indices, bonds
Crypto: Any digital currencies
Must use correct exchange prefix (e.g., BINANCE:BTCUSDT)
Alert System
Enable "Advanced Alerts" to receive notifications for:
✅ Market regime changes
✅ Correlation breakdowns/surges
✅ Strong signals with high correlation
✅ Extreme volume-price correlation
✅ Complete HTF alignment
Correlation Interpretation Guide
ValueMeaningTrading Implication+0.75 to +1.0Strong positiveAssets move together+0.5 to +0.75Moderate positiveGenerally aligned+0.25 to +0.5Weak positiveLoose relationship-0.25 to +0.25No correlationIndependent movements-0.5 to -0.25Weak negativeSlight inverse relationship-0.75 to -0.5Moderate negativeTend to move opposite-1.0 to -0.75Strong negativeStrongly inversely correlated
Best Practices
Use Multiple Timeframes: Check HTF alignment before trading
Confirm with Correlation: Strong signals work best with supportive correlations
Watch Regime Changes: Adjust strategy based on market conditions
Volume Matters: Enable volume-price correlation for confirmation
Quality Over Quantity: Trade only high-quality setups (>70% signal quality)
Common Patterns to Watch
🔵 Risk-On Environment:
Gold-BTC positive correlation
DXY negative correlation with risk assets
High crypto correlations
🔴 Risk-Off Environment:
Flight to safety (Gold up, stocks down)
DXY strength
Correlation breakdowns
🟡 Transition Periods:
Low correlation across assets
Mixed HTF signals
Use caution, reduce position sizes
Technical Notes
Calculation Period: Uses HLC3 (average of high, low, close)
Correlation Window: Rolling correlation over specified length
HTF Data: Accurately calculated using security() function
Performance: Optimized for real-time calculation on all timeframes
Support
For optimal performance:
Use on 15-minute to daily timeframes
Enable only needed asset groups
Adjust correlation length based on trading style
Combine with your existing strategy for confirmation
Enjoy comprehensive multi-asset analysis! 🚀

GME Cash FloorsPlots three fundamental “floor value” lines for GameStop based on its balance sheet:
Cash/Share (Gross + BTC) – total cash & equivalents per share, optionally including the BTC treasury at current BTCUSD price.
Net Cash/Share – cash (plus optional BTC) minus total debt, per share.
2030 Carry Floor – projected net cash per share in 2030 assuming the cash portion compounds at a user-set rate while the 0% notes are repaid at maturity.
Inputs let you update cash, debt, share count, interest rate, years to 2030, and toggle BTC on/off so the lines stay in sync with the latest 10-Q.

Asset vs Total Market Cap & Relative Strength Purpose
This indicator allows traders to compare a selected asset to the major market benchmarks:
BTC – primary crypto market leader
ETH – secondary crypto market leader
USDT.D – shows market risk-on vs risk-off sentiment
TOTAL – total crypto market capitalization, useful for overall market trends
It also provides relative strength calculations:
Rel. Strength = Asset % change - USDT.D % change
Rel. Strength vs Total = Asset % change - Total % change
This allows you to see if your asset is outperforming or underperforming broader benchmarks.
The table covers multiple timeframes, making it easy to scan both short-term and longer-term trends:
Row Timeframe
0 Current
1 15m
2 1H
3 4H
4 1D
Selected Asset / BTC / ETH:
Green for positive % change
Red for negative % change
Gradient intensity proportional to magnitude (maxAbsChange input)
USDT.D:
Orange if rising (risk-off)
Teal if falling (risk-on)
Total Market Cap / Rel. Strength:
Gradient reflects asset performance relative to total market, independent of USDT.D.
Positives
Compact dashboard: Everything is in one table for quick scanning.
Multi-timeframe comparison: Traders can instantly see short-term vs long-term strength.
Relative performance visualization: Gradients immediately highlight outperformers and underperformers.
Benchmark comparisons: Asset vs BTC, ETH, USDT.D, and Total Market Cap.
Independent Rel. Strength: Highlights whether the asset is outperforming even if the total market moves.
Customizable gradient sensitivity: maxAbsChange and maxRelChange allow tuning how “strong” the colors appear.
Chart plotting: Rel. Strength vs total market is plotted for further visual reference.
How to Use
Green table cells → strong positive movement
Red table cells → negative movement
Rel. Strength > 0 → asset outperforming
Rel. Strength < 0 → asset underperforming
Use table to compare relative performance vs BTC, ETH, and total market for informed trading decisions.

Hilly's Advanced Crypto Scalping Strategy - 5 Min ChartTo determine the "best" input parameters for the Advanced Crypto Scalping Strategy on a 5-minute chart, we need to consider the goals of optimizing for profitability, minimizing false signals, and adapting to the volatile nature of cryptocurrencies. The default parameters in the script are a starting point, but the optimal values depend on the specific cryptocurrency pair, market conditions, and your risk tolerance. Below, I'll provide recommended input values based on common practices in crypto scalping, along with reasoning for each parameter. I’ll also suggest how to fine-tune them using TradingView’s backtesting and optimization tools.
Recommended Input Parameters
These values are tailored for a 5-minute chart for liquid cryptocurrencies like BTC/USD or ETH/USD on exchanges like Binance or Coinbase. They aim to balance signal frequency and accuracy for day trading.
Fast EMA Length (emaFastLen): 9
Reasoning: A 9-period EMA is commonly used in scalping to capture short-term price movements while remaining sensitive to recent price action. It reacts faster than the default 10, aligning with the 5-minute timeframe.
Slow EMA Length (emaSlowLen): 21
Reasoning: A 21-period EMA provides a good balance for identifying the broader trend on a 5-minute chart. It’s slightly longer than the default 20 to reduce noise while confirming the trend direction.
RSI Length (rsiLen): 14
Reasoning: The default 14-period RSI is a standard choice for momentum analysis. It works well for detecting overbought/oversold conditions without being too sensitive on short timeframes.
RSI Overbought (rsiOverbought): 75
Reasoning: Raising the overbought threshold to 75 (from 70) reduces false sell signals in strong bullish trends, which are common in crypto markets.
RSI Oversold (rsiOversold): 25
Reasoning: Lowering the oversold threshold to 25 (from 30) filters out weaker buy signals, ensuring entries occur during stronger reversals.
MACD Fast Length (macdFast): 12
Reasoning: The default 12-period fast EMA for MACD is effective for capturing short-term momentum shifts in crypto, aligning with scalping goals.
MACD Slow Length (macdSlow): 26
Reasoning: The default 26-period slow EMA is a standard setting that works well for confirming momentum trends without lagging too much.
MACD Signal Smoothing (macdSignal): 9
Reasoning: The default 9-period signal line is widely used and provides a good balance for smoothing MACD crossovers on a 5-minute chart.
Bollinger Bands Length (bbLen): 20
Reasoning: The default 20-period Bollinger Bands are effective for identifying volatility breakouts, which are key for scalping in crypto markets.
Bollinger Bands Multiplier (bbMult): 2.0
Reasoning: A 2.0 multiplier is standard and captures most price action within the bands. Increasing it to 2.5 could reduce signals but improve accuracy in highly volatile markets.
Stop Loss % (slPerc): 0.8%
Reasoning: A tighter stop loss of 0.8% (from 1.0%) suits the high volatility of crypto, helping to limit losses on false breakouts while keeping risk manageable.
Take Profit % (tpPerc): 1.5%
Reasoning: A 1.5% take-profit target (from 2.0%) aligns with scalping’s goal of capturing small, frequent gains. Crypto markets often see quick reversals, so a smaller target increases the likelihood of hitting profits.
Use Candlestick Patterns (useCandlePatterns): True
Reasoning: Enabling candlestick patterns (e.g., engulfing, hammer) adds confirmation to signals, reducing false entries in choppy markets.
Use Volume Filter (useVolumeFilter): True
Reasoning: The volume filter ensures signals occur during high-volume breakouts, which are more likely to sustain in crypto markets.
Signal Arrow Size (signalSize): 2.0
Reasoning: Increasing the arrow size to 2.0 (from 1.5) makes buy/sell signals more visible on the chart, especially on smaller screens or volatile price action.
Background Highlight Transparency (bgTransparency): 85
Reasoning: A slightly higher transparency (85 from 80) keeps the background highlights subtle but visible, avoiding chart clutter.
How to Apply These Parameters
Copy the Script: Use the Pine Script provided in the previous response.
Paste in TradingView: Open TradingView, go to the Pine Editor, paste the code, and click "Add to Chart."
Set Parameters: In the strategy settings, manually input the recommended values above or adjust them via the input fields.
Test on a 5-Minute Chart: Apply the strategy to a liquid crypto pair (e.g., BTC/USDT, ETH/USDT) on a 5-minute chart.
Fine-Tuning for Optimal Performance
To find the absolute best parameters for your specific trading pair and market conditions, use TradingView’s Strategy Tester and optimization features:
Backtesting:
Run the strategy on historical data for your chosen pair (e.g., BTC/USDT on Binance).
Check metrics like Net Profit, Profit Factor, Win Rate, and Max Drawdown in the Strategy Tester.
Focus on a sample period of at least 1–3 months to capture various market conditions (bull, bear, sideways).
Parameter Optimization:
In the Strategy Tester, click the settings gear next to the strategy name.
Enable optimization for key inputs like emaFastLen (test range: 7–12), emaSlowLen (15–25), slPerc (0.5–1.5), and tpPerc (1.0–3.0).
Run the optimization to find the combination with the highest net profit or best Sharpe ratio, but avoid over-optimization (curve-fitting) by testing on out-of-sample data.
Market-Specific Adjustments:
Volatile Pairs (e.g., DOGE/USDT): Use tighter stop losses (e.g., 0.5–0.7%) and smaller take-profit targets (e.g., 1.0–1.2%) to account for rapid price swings.
Stable Pairs (e.g., BTC/USDT): Slightly wider stop losses (e.g., 1.0–1.2%) and take-profit targets (e.g., 1.8–2.5%) may work better.
Trending Markets: Increase emaSlowLen (e.g., to 25–30) to follow stronger trends.
Choppy Markets: Tighten bbMult (e.g., to 1.8) and lower rsiOverbought/rsiOversold (e.g., to 70/30) to filter noise.
Forward Testing:
After backtesting, run the strategy in real-time on a demo account for 1–2 weeks to validate performance under current market conditions.
Important Notes
No Universal "Best" Numbers: Optimal parameters vary by crypto pair, exchange, and market conditions (e.g., bull vs. bear market). The suggested values are a starting point based on common scalping practices.
Risk Management: Never risk more than 1–2% of your account per trade. Adjust position sizing in TradingView’s strategy settings to align with your risk tolerance.
Market Volatility: Crypto markets are highly volatile. Test the strategy on your specific pair and adjust parameters if signals are too frequent or too rare.
Not Financial Advice: This is an educational tool. Backtest thoroughly and use a demo account before trading with real funds.
If you want me to generate a chart showing backtest performance for specific parameters or to tweak the script further (e.g., adding more indicators or adjusting signal logic), let me know!can you add clear buy ans sell signs above the candles in this codeTo add clear buy and sell signals above the candles in the provided Pine Script, I'll modify the existing code to include prominent text labels directly above (for sell signals) and below (for buy signals) the candles. These labels will be larger, color-coded, and positioned to avoid clutter, ensuring they are easily visible on the chart. The core strategy logic (EMA, RSI, MACD, Bollinger Bands, candlestick patterns, and volume filter) will remain unchanged, and I'll reuse the same artifact_id since this is an update to the previous script.AdvancedCryptoScalpingStrategy.pinex-pine

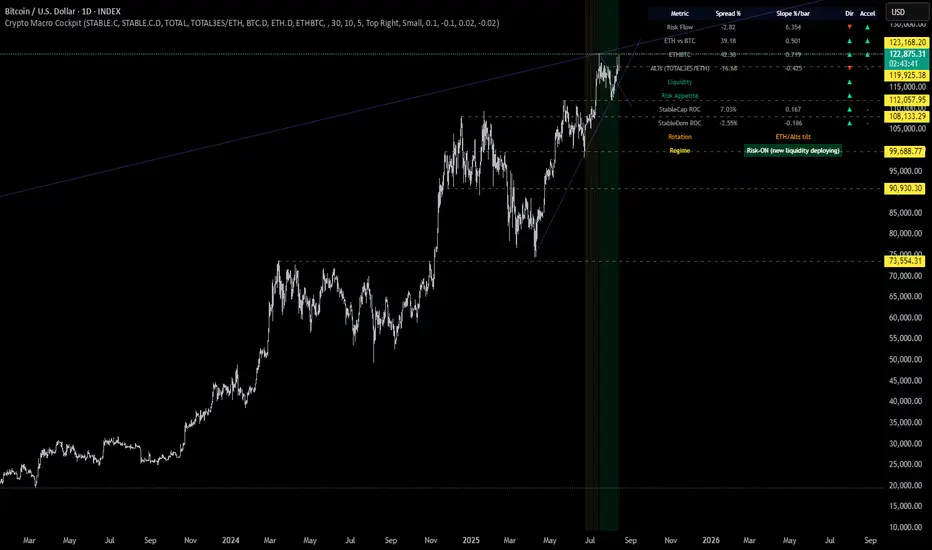
Crypto Macro CockpitCrypto Macro Cockpit — Institutional Liquidity Regime Detection
🔍 Overview
This script introduces a modern macro framework for crypto market regime detection, leveraging newly added stablecoin market data on TradingView. It’s designed to guide traders through the evolving institutional era of crypto — where liquidity, not just price, is king.
🌐 Why This Matters
Historically, traditional proxies like M2 money supply or bond yields were referenced to infer macro liquidity shifts. But with the regulatory green light and institutional embrace of stablecoins, on-chain fiat liquidity is now directly observable.
Stablecoins = The new M2 for crypto.
This script utilizes real-time data from:
📊 CRYPTOCAP:STABLE.C (Total Stablecoin Market Cap)
📊 CRYPTOCAP:STABLE.C.D (Stablecoin Dominance)
to assess dry powder, risk appetite, and macro regime transitions.
📋 How to Read the Crypto Macro Cockpit
This dashboard updates every few bars and is organized into four actionable segments:
1️⃣ Macro Spreads
Metric --> Interpretation
Risk Flow --> Measures capital flow between stablecoins and total crypto market cap. → Green = risk deploying.
ETH vs BTC --> Shift in dominance between ETH and BTC → rotation gauge.
ETHBTC --> Price ratio movement → confirms leadership tilt.
ALTs (TOTAL3ES) --> Momentum in altcoin market, excluding BTC/ETH/stables → key for alt season timing.
2️⃣ Liquidity & Risk Appetite
Metric --> Interpretation
Liquidity --> Directional change in stablecoin cap → more stables = more dry powder.
Risk Appetite --> Inverse of stablecoin dominance → falling dominance = capital rotating into risk.
3️⃣ Stablecoin Context
Metric --> Interpretation
StableCap ROC --> Growth rate of stablecoin market cap → proxy for fiat inflows.
StableDom ROC --> Change in stablecoin dominance → reflects market caution or aggression.
4️⃣ Composite Labels
Label --> Interpretation
Rotation --> Sector tilt (BTC-led vs ETH/Alts)
Regime --> Synthesized macro environment → "Risk-ON", "Caution", "Waiting", or "Risk-OFF"
Background Color --> Optional tint reflecting regime for quick glance validation
All metrics are evaluated with directional arrows (▲/▼/•) and acceleration overlays, using user-defined thresholds scaled by timeframe for precision.
🔔 Built-in Alerts
Predefined, non-repainting alerts include:
Regime transitions
Sector rotations
Confirmed ETH/ALT rotations
Stablecoin market cap spikes
Risk Flow acceleration
You can use these alerts for discretionary trading or automated system triggers.
⚠️ Disclaimer
This script is for educational and informational purposes only. It does not constitute financial advice. Trading cryptocurrencies involves risk, and past performance does not guarantee future results. Always do your own research and manage risk responsibly.
✅ Ready to Use
No configuration needed — just load the script
Works on all timeframes (optimized for 1D)
Thresholds and smoothing are customizable
Table positioning and sizing is user-controlled
If you find this helpful, feel free to ⭐️ favorite or leave feedback. Questions welcome in the comments.
Let’s trade with macro awareness in this new era.
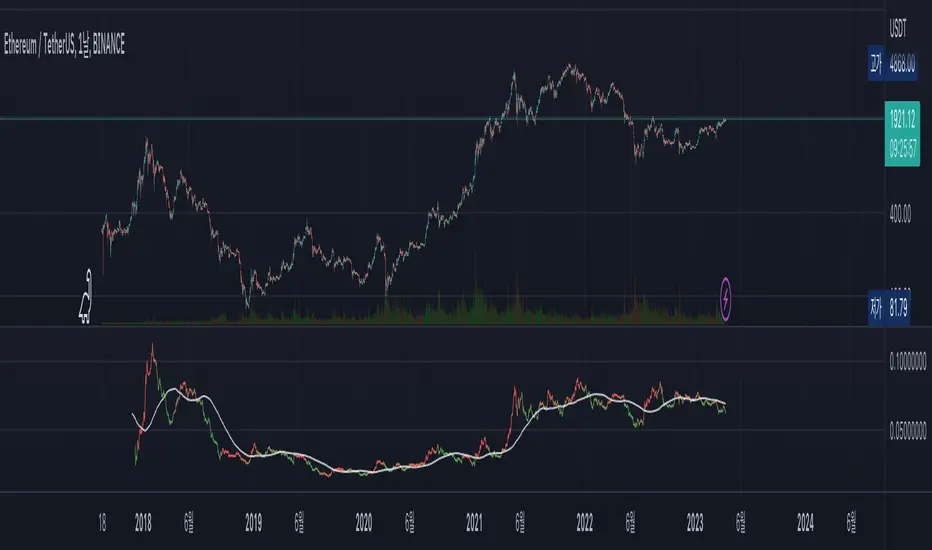
Two assets correlation trackerHi, I made this simple script to see how two correlated assets are actually performing short-term. The idea comes from correlation between BTC and ETH that that usually stands 0.9 (Pearson's correlation). However Pearson's correlation doesn't indicate the relative price difference and cannot be used trading correlation when used alone.
My approach is simple - we can select the date/time from which we will start tracking the price change, and instead of tracking the price, we track 100 USD worth of BTC and ETH and how this investment perform. This gives us the price difference relative to a point in the near future, I would suggest using latest trend shift, for example.
On example of how this can be used: If we see that BTC is falling slower than ETH since trend shift, we can long BTC and short ETH in equal parts and expect to gain from the difference while hedging potential loss.

Alt Szn Oracle - Institutional GradeThe Alt Szn Oracle is a macro-level indicator built to help traders front-run altseason by tracking liquidity, dominance rotation, sentiment, and capital flows—all in one signal. It’s designed for those who don’t just chase pumps, but want to understand when the tide is turning and why. This tool doesn't predict specific coin breakouts—it tells you when the market as a whole is gearing up to rotate into higher beta assets like altcoins, including memes and microcaps.
The index consolidates ten macro inputs into a normalized, smoothed score from 0–100. These include Bitcoin and Ethereum dominance, ETH/BTC, altcoin market cap (Total3), relative volume flows, and stablecoin supply (USDT, USDC, DAI)—which act as proxies for risk-on appetite and dry powder entering the system. It also incorporates manually updated sentiment metrics from Google Trends and the Fear & Greed Index, giving it a behavioral edge that most indicators lack.
The logic is simple but powerful: when BTC dominance is falling, ETH/BTC is rising, altcoin volume increases relative to BTC/ETH, and stablecoins start moving—you're likely in the early innings of rotation. The index is also filtered through a volatility threshold and smoothed with an EMA to eliminate chop and fakeouts.
Use this indicator on macro charts like TOTAL3, TOTAL2, or ETHBTC to gauge market health, or overlay it on specific coins like PEPE, DOGE, or SOL to confirm if the tide is in your favor. Interpreting the score is straightforward: readings above 80 suggest euphoria and signal it’s time to de-risk, 60–80 indicates expansion and confirms altseason is underway, 40–60 is neutral, and 20–40 is a capitulation zone where smart money accumulates.
What sets this apart is that it doesn’t just track price—it reflects the flow of capital, the positioning of liquidity, and the sentiment of the crowd. Most altseason indicators are lagging, overfitted, or too simplistic. This one is modular, forward-looking, and grounded in real capital rotation theory.
If you're a trader who wants to time the cycle, not guess it, this is your tool. Refine it, fork it, or expand it to your niche—DeFi, NFTs, meme coins, or L1s. It’s a framework for reading the macro winds, not a signal service. Use it with discipline, and you’ll catch the wave while others drown in noise.

Coinbase Premium IndicatorPurpose
Indicates whether a crypto asset listed on a Coinbase spot market is trading at a premium or discount to other spot (Tether) markets.
How It Works
The script takes the base currency for the pair loaded in that TradingView window and searches for its Coinbase spot market. It also maps the base currency to the USDT (Tether) spot markets on Binance, Bybit, and OKX.
The Premium/ Discount is: (coin-btc-usd) - (sum(bnce-btc-usdt, bybt-btc-usdt, okx-btc-usdt))
General Notes
The status line of the Indicator displays the value of the premium/ discount and the market prices of the pair for each constituent exchange.

Williams R Zone Scalper v1.0[BullByte]Originality & Usefulness
Unlike standard Williams R cross-over scripts, this strategy layers five dynamic filters—moving-average trend, Supertrend, Choppiness Index, Bollinger Band Width, and volume validation —and presents a real-time dashboard with equity, PnL, filter status, and key indicator values. No other public Pine script combines these elements with toggleable filters and a custom dashboard. In backtests (BTC/USD (Binance), 5 min, 24 Mar 2025 → 28 Apr 2025), adding these filters turned a –2.09 % standalone Williams R into a +5.05 % net winner while cutting maximum drawdown in half.
---
What This Script Does
- Monitors Williams R (length 14) for overbought/oversold reversals.
- Applies up to five dynamic filters to confirm trend strength and volatility direction:
- Moving average (SMA/EMA/WMA/HMA)
- Supertrend line
- Choppiness Index (CI)
- Bollinger Band Width (BBW)
- Volume vs. its 50-period MA
- Plots blue arrows for Long entries (R crosses above –80 + all filters green) and red arrows for Short entries (R crosses below –20 + all filters green).
- Optionally sets dynamic ATR-based stop-loss (1.5×ATR) and take-profit (2×ATR).
- Shows a dashboard box with current position, equity, PnL, filter status, and real-time Williams R / MA/volume values.
---
Backtest Summary (BTC/USD(Binance), 5 min, 24 Mar 2025 → 28 Apr 2025)
• Total P&L : +50.70 USD (+5.05 %)
• Max Drawdown : 31.93 USD (3.11 %)
• Total Trades : 198
• Win Rate : 55.05 % (109/89)
• Profit Factor : 1.288
• Commission : 0.01 % per trade
• Slippage : 0 ticks
Even in choppy March–April, this multi-filter approach nets +5 % with a robust risk profile, compared to –2.09 % and higher drawdown for Williams R alone.
---
Williams R Alone vs. Multi-Filter Version
• Total P&L :
– Williams R alone → –20.83 USD (–2.09 %)
– Multi-Filter → +50.70 USD (+5.05 %)
• Max Drawdown :
– Williams R alone → 62.13 USD (6.00 %)
– Multi-Filter → 31.93 USD (3.11 %)
• Total Trades : 543 vs. 198
• Win Rate : 60.22 % vs. 55.05 %
• Profit Factor : 0.943 vs. 1.288
---
Inputs & What They Control
- wrLen (14): Williams R look-back
- maType (EMA): Trend filter type (SMA, EMA, WMA, HMA)
- maLen (20): Moving-average period
- useChop (true): Toggle Choppiness Index filter
- ciLen (12): CI look-back length
- chopThr (38.2): CI threshold (below = trending)
- useVol (true): Toggle volume-above-average filter
- volMaLen (50): Volume MA period
- useBBW (false): Toggle Bollinger Band Width filter
- bbwMaLen (50): BBW MA period
- useST (false): Toggle Supertrend filter
- stAtrLen (10): Supertrend ATR length
- stFactor (3.0): Supertrend multiplier
- useSL (false): Toggle ATR-based SL/TP
- atrLen (14): ATR period for SL/TP
- slMult (1.5): SL = slMult × ATR
- tpMult (2.0): TP = tpMult × ATR
---
How to Read the Chart
- Blue arrow (Long): Williams R crosses above –80 + all enabled filters green
- Red arrow (Short) : Williams R crosses below –20 + all filters green
- Dashboard box:
- Top : position and equity
- Next : cumulative PnL in USD & %
- Middle : green/white dots for each filter (green=passing, white=disabled)
- Bottom : Williams R, MA, and volume current values
---
Usage Tips
- Add the script : Indicators → My Scripts → Williams R Zone Scalper v1.0 → Add to BTC/USD chart on 5 min.
- Defaults : Optimized for BTC/USD.
- Forex majors : Raise `chopThr` to ~42.
- Stocks/high-beta : Enable `useBBW`.
- Enable SL/TP : Toggle `useSL`; stop-loss = 1.5×ATR, take-profit = 2×ATR apply automatically.
---
Common Questions
- * Why not trade every Williams R reversal?*
Raw Williams R whipsaws in sideways markets. Choppiness and volume filters reduce false entries.
- *Can I use on 1 min or 15 min?*
Yes—adjust ATR length or thresholds accordingly. Defaults target 5 min scalping.
- *What if all filters are on?*
Fewer arrows, higher-quality signals. Expect ~10 % boost in average win size.
---
Disclaimer & License
Trading carries risk of loss. Use this script “as is” under the Mozilla Public License 2.0 (mozilla.org). Always backtest, paper-trade, and adjust risk settings to your own profile.
---
Credits & References
- Pine Script v6, using TradingView’s built-in `ta.supertrend()`.
- TradingView House Rules: www.tradingview.com
Goodluck!
BullByte

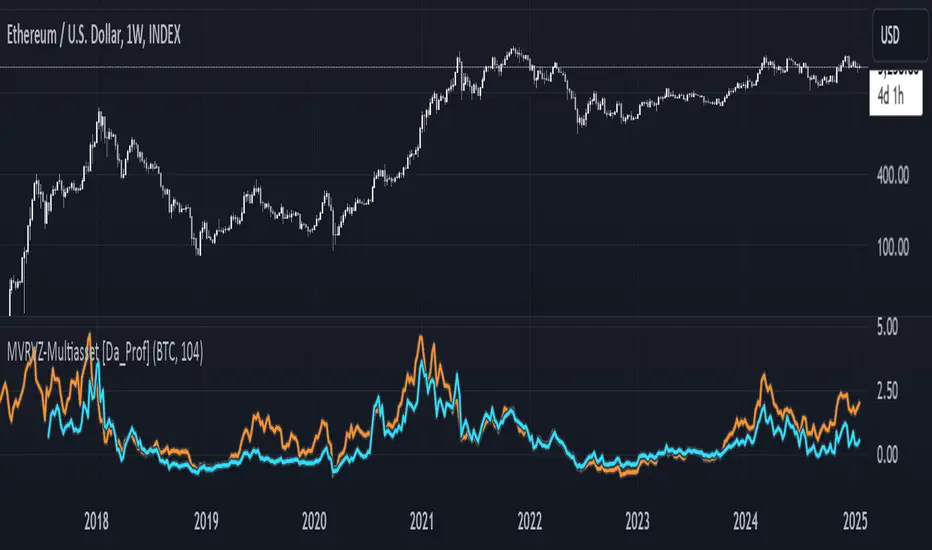
Multiasset MVRVZ - MVRVZ for Multiple Crypto Assets [Da_Prof]This indicator shows the Market Value-Realized Value Z-score (MVRVZ) for Multiple Assets. The MVRV-Z score measures the value of a crypto asset by comparing its market cap to the realized value and dividing by the standard deviation of the market cap (market cap – realized cap) / stdev(market cap) to get a z-score. When the market value is significantly higher than the realized value, the asset may be considered "overvalued". Conversely, market values below the realized value may indicate the asset is "undervalued". For some assets (e.g., BTC) historically high values have generally signaled price tops and historically low values have signaled bottoms.
The indicator displays two lines: 1) the MVRV-Z of the current chart symbol if the data is available through Coin Metrics (this is displayed in light blue), and 2) the MVRV-Z of the symbol selected from the dropdown (displayed in orange). The MVRV-Z of BTC is the default selected orange line. The example chart shows CRYPTOCAP:ETH 's MVRV-Z in blue and CRYPTOCAP:BTC 's MVRV-Z in orange.
The MVRV-Z in this indicator is calculated on the weekly and will display consistently on lower timeframes. Some MVRV-Z indicators calculate this value from collection of all data from the beginning of the chart on the timeframe of the chart. This creates inconsistency in the standard deviation calculation and ultimately the z-score calculation when moving between time frames. This indicator calculates MVRV-Z based on the set number of weeks prior from the source data directly (default is two years worth of weekly data). This allows consistent MVRV-Z values on weekly and lower timeframes.