MACD + Stochastic, Double Strategy (by ChartArt)This strategy combines the classic stochastic strategy to buy when the stochastic is oversold with a classic MACD strategy to buy when the MACD histogram value goes above the zero line. Only difference to the classic stochastic is a default setting of 71 for overbought (classic setting 80) and 29 for oversold (classic setting 20).
Therefore this strategy goes long if the MACD histogram goes above zero and the stochastic indicator detects a oversold condition (value below 29). If the inverse logic is true, the strategy goes short (stochastic overbought condition with a value above 71 and the MACD histogram falling below the zero line value).
Please be aware that this pure double strategy using simply two classic indicators does not have any stop loss or take profit money management logic.
All trading involves high risk; past performance is not necessarily indicative of future results. Hypothetical or simulated performance results have certain inherent limitations. Unlike an actual performance record, simulated results do not represent actual trading. Also, since the trades have not actually been executed, the results may have under- or over-compensated for the impact, if any, of certain market factors, such as lack of liquidity. Simulated trading programs in general are also subject to the fact that they are designed with the benefit of hindsight. No representation is being made that any account will or is likely to achieve profits or losses similar to those shown.
Tìm kiếm tập lệnh với "chart"

Bollinger + RSI, Double Strategy (by ChartArt) v1.1This strategy uses the RSI indicator together with the Bollinger Bands to sell when the price is above the upper Bollinger Band (and to buy when this value is below the lower band). This simple strategy only triggers when both the RSI and the Bollinger Band indicators are at the same time in a overbought or oversold condition.
UPDATE
In this updated version 1.1 the strategy was both simplified for the user (less inputs) and made more successful in backtesting by now using a 200 period for the SMA which is the basis for the Bollinger Band. I also reduced the number of color alerts to show fewer, but more relevant trading opportunities.
And just like the first version this strategy does not use close prices from higher-time frame and should not repaint after the current candle has closed. It might repaint like every Tradingview indicator while the current candle hasn't closed.
All trading involves high risk; past performance is not necessarily indicative of future results. Hypothetical or simulated performance results have certain inherent limitations. Unlike an actual performance record, simulated results do not represent actual trading. Also, since the trades have not actually been executed, the results may have under- or over-compensated for the impact, if any, of certain market factors, such as lack of liquidity. Simulated trading programs in general are also subject to the fact that they are designed with the benefit of hindsight. No representation is being made that any account will or is likely to achieve profits or losses similar to those shown.
P.S. For advanced users if you want access to more functions of this strategy script, then please use version 1.0:
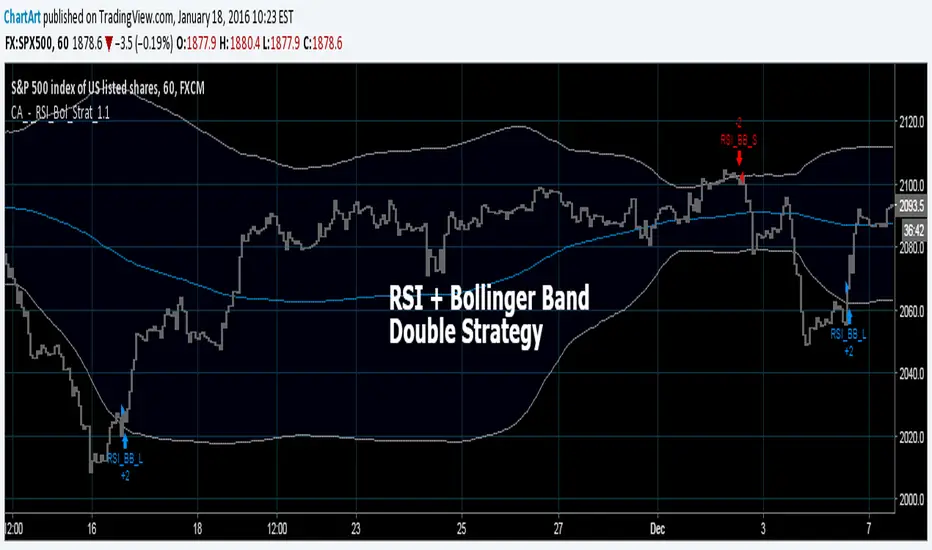
Bollinger + RSI, Double Strategy (by ChartArt)Bollinger Bands + RSI, Double Strategy
This strategy uses a slower RSI with period 16 to sell when the RSI increases over the value of 55 (or to buy when the value falls below 45), with the classic Bollinger Bands strategy to sell when the price is above the upper Bollinger Band and falls below it (and to buy when the price is below the lower band and rises above it). This strategy only triggers when both the RSI and the Bollinger Bands indicators are at the same time in the described overbought or oversold condition. In addition there are color alerts which can be deactivated.
This basic strategy is based upon the "RSI Strategy" and "Bollinger Bands Strategy" which were created by Tradingview and uses no money management like a trailing stop loss and no scalping methods. Every win/loss trade is simply counted from the last overbought/oversold condition to the next one.
This strategy does not use close prices from higher-time frame and should not repaint after the current candle has closed. It might repaint like every Tradingview indicator while the current candle hasn't closed.
All trading involves high risk; past performance is not necessarily indicative of future results. Hypothetical or simulated performance results have certain inherent limitations. Unlike an actual performance record, simulated results do not represent actual trading. Also, since the trades have not actually been executed, the results may have under- or over-compensated for the impact, if any, of certain market factors, such as lack of liquidity. Simulated trading programs in general are also subject to the fact that they are designed with the benefit of hindsight. No representation is being made that any account will or is likely to achieve profits or losses similar to those shown.

Moving Average Consecutive Up/Down Strategy (by ChartArt)This simple strategy goes long (or short) if there are several consecutive increasing (or decreasing) moving average values in a row in the same direction. The bars can be colored using the raw moving average trend. And the background can be colored using the consecutive moving average trend setting. In addition a experimental line of the moving average change can be drawn.
The strategy is based upon the "Consecutive Up/Down Strategy" which was created by Tradingview.
All trading involves high risk; past performance is not necessarily indicative of future results. Hypothetical or simulated performance results have certain inherent limitations. Unlike an actual performance record, simulated results do not represent actual trading. Also, since the trades have not actually been executed, the results may have under- or over-compensated for the impact, if any, of certain market factors, such as lack of liquidity. Simulated trading programs in general are also subject to the fact that they are designed with the benefit of hindsight. No representation is being made that any account will or is likely to achieve profits or losses similar to those shown.

Rounded Weekly Pivot (by ChartArt)Trade with the trend. This is an overlay indicator which shows the weekly pivot (rounded) either as line or circle drawing, select-able by the user. The width of the pivot line (or circle) overlay is also adjustable.
In addition the bars can be colored by the trend, depending if the close price is above or below both the weekly and monthly pivots. If the close price is neither above or below both the weekly and monthly pivot prices the trend color is neutral blue.
The weekly pivot indicator with the optional setting that the pivot price is drawn as circles instead of a line:
And here with the pivot drawing disabled, showing only the pivot bar trend color

Outsidebar vs Insidebar, Illusion Strategy (by ChartArt)WARNING: This strategy does not work! Please don't trade with this strategy
I'm sharing this strategy for the following three educational reasons:
1. You can easily find 100% strategies, but if they only seem to work 100% on one asset, they actually don't work at all. Therefore never backtest your strategy only on one asset, especially forward testing is useless, because it tends to repeat the old patterns. Your strategy has to work on as many different assets as possible.
2. The pyramiding of orders can have an impact on the strategy. In this case if you manually change the strategy settings by increasing it from 1 to 100 pyramiding orders changes the percent profitable on "UKOIL" monthly from 100% to 90% profitable. On other assets you can see very different results. Allowing much more pyramiding orders in this case results in opening orders where the background color highlights appear.
3. The Tradingview backtest beta version currently does not close the last open trade during the backtest. In this case going long on "UKOIL" near the top in 2011 as this strategy did would result in a big loss in 2015. But since the trade is still open and not canceled out by a new short order it still appears as if this strategy works 100% profitable. Which it doesn't.

Moving Average Cross Alert, Multi-Timeframe (MTF) (by ChartArt)See when two moving averages cross. With the option to choose between four moving average calculations:
SMA = simple moving average
EMA = exponential moving average (default)
WMA = weighted moving average
Linear = linear regression
The moving averages can be plotted from different time-frames, like e.g. the weekly or 4 hour time-frame using HL2, HLC3 or OHLC4 as price source for the calculation. In addition there is a background color alert and arrows when the moving averages cross each other when the price also rises or falls. And the moving averages are colored depending on their trend direction (if they are trending up or down).

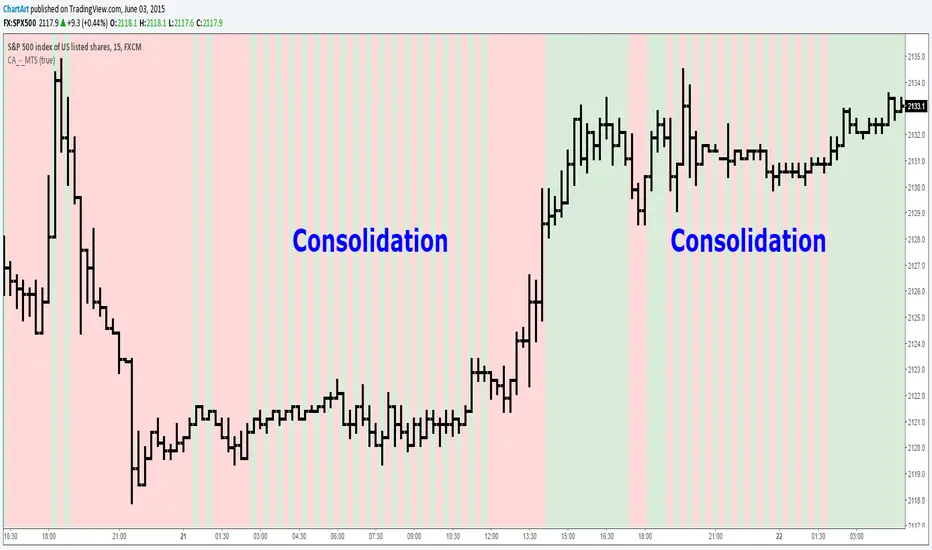
Market Trend Strength (MTS) (by ChartArt)See the current trend strength of the market. An additional filter makes trend consolidation areas visible. The color changes there each bar back and forth between green and red.
This area was interesting. Would have been a better example:
If the filter is deactivated the indicator shows the last measured price trend (green for up and down for red).

Multi-Ticker Overlay V6 [SPY/QQQ/ES]Key Improvements in this Version:Triple Ticker Support: You now have three distinct sections in the settings (SPY, QQQ, and ES1!). You can toggle them on or off individually.Flexible Symbols: While I defaulted them to SPY, QQQ, and ES, you can use the Ticker Symbol input to change them to anything (e.g., change ES to "DIA" to see Dow Jones levels).Decimal Increments: I changed the increment to a float. You can now set SPY to 1.0 and QQQ to 0.5 or 5.0 depending on how much "clutter" you want.Individual Aesthetics:Colors: Each ticker has its own color picker.Labels: Labels are prefixed with the symbol name (e.g., "QQQ 450") so you don't get confused about which line belongs to which ticker.Smart Ratio Engine: All three tickers respect the "Freeze at 16:00" rule if you turn it on, ensuring the levels stay mathematically accurate based on the market close.Note on Performance: Because this script draws many lines (up to 3 tickers $\times$ 21 lines each), I set the extend to none. The lines will appear as short segments to the right of the current price to keep your chart clean.

Initial Balance with AlertsThis indicator is a comprehensive tool for Auction Market Theory (AMT) practitioners who rely on the Initial Balance (IB) to determine the day's likely structure. It automatically plots the High and Low of the opening session (user-definable) and extends those levels to provide key support and resistance zones for the remainder of the trading day.
Unlike standard IB indicators, this script features Smart Alerts that are time-filtered. You can define a specific "Active Alert Window" (e.g., RTH only) to ensure you are notified of breakouts during key hours, while avoiding spam notifications during overnight or low-volume sessions.
Key Features:
1. Customizable Initial Balance
Flexible Session: Define the exact start and end time for your IB calculation (Default: 08:30–09:30).
Visual Clarity: Plots IB High, IB Low, and the 50% Midpoint with fully customizable line styles, colors, and widths.
2. Smart Time-Filtered Alerts
Breakout Detection: Triggers an alert when price crosses above the IB High or below the IB Low.
Session Filter: Includes a unique "Allowed Alert Time" input. Alerts will only fire if the breakout happens within this window (Default: 08:30–15:00), preventing unwanted notifications during overnight chop.
3. Advanced Extensions & Targets
Extensions: Option to display multiples of the IB range (2x, 3x) to serve as statistical targets for trend days.
Intermediate Levels: Option to display half-step extensions (e.g., 1.5x) for tighter scalping targets.
4. IB Delta Analytics Dashboard
Context is Key: An optional on-screen dashboard tracks the size of the Initial Balance over the last 20 days.
Sentiment: Automatically categorizes today's IB as "Huge," "Medium," or "Small" compared to the 20-day average. This helps you anticipate if the day is likely to be a "Range Day" (Large IB) or a "Trend Day" (Small IB).
Settings Overview:
Calculation Period: The time used to measure the high and low (e.g., first 60 mins).
Allowed Alert Time: The window during which alerts are active.
Show Extra Levels: Toggles the 2x and 3x extensions.
Fill IB Areas: Adds a background color to the opening range for better visibility.
Delta Analytics: Toggles the statistics table on/off.
Author's Instructions
How to Configure the Time Settings: This script uses two distinct time inputs to give you maximum control:
"Calculation period": This is when the script measures the High and Low.
Example: 0830-0930 (The first hour of the NYSE session).
"Allowed Alert Time (RTH)": This is when the script is allowed to send you alerts.
Example: 0830-1500 (The full trading day).
Why this matters: If price breaks the IB High at 18:00 (during the overnight session), the script will ignore it if your alert time ends at 15:00. This saves you from waking up to low-probability signals.
Setting Up Alerts: To activate the alerts, add the indicator to your chart, click the "Alerts" button (clock icon) in the top toolbar, select this indicator from the "Condition" list, and choose "Any alert() function call".
Disclaimer: This tool is for informational purposes only. Past performance does not guarantee future results.

AMT Structure: 80% Traverse, PD Levels & nPOCsHere is a clean, professional description formatted for the TradingView description box. It highlights the methodology (AMT/80% Rule), the specific features, and the credits.
Title: AMT Structure: 80% Traverse, PD Levels & nPOCs
Description:
This indicator is a comprehensive toolkit designed for futures traders utilizing Auction Market Theory (AMT) and Volume Profile strategies. It consolidates multiple scripts into a single, unified overlay to declutter your chart while providing essential structural references for the 80% Traverse setup, intraday context, and longer-term auction targets.
Key Features:
1. 80% Rule / Traverse Setup (Chart Champions Logic)
Automated RTH Open Detection: Hardcoded to the 08:30 AM CT Open to ensure accuracy for US Futures (ES/NQ) regardless of your chart's timezone settings.
Value Area Logic: Automatically calculates the Previous Day's Value Area High (VAH), Value Area Low (VAL), and Point of Control (POC).
Setup Detection: If the market opens outside of the previous day's value, the script highlights the Value Area in color (default: Purple), signaling that an 80% traverse (filling the value area) is structurally possible if price re-enters value.
Background Fill: Optional shading between VAH and VAL to clearly visualize the "playing field" for the traverse.
2. Auction Market Theory (AMT) Premarket Levels
Overnight High/Low: Automatically captures the highest and lowest prices traded during the overnight session (17:00 - 08:30 CT).
Breakout Alerts: Includes logic to detect and alert when these overnight levels are broken during the RTH session.
Auto-Cleanup: Lines can be set to auto-delete after a specified time (default: 60 mins into the session) to keep the chart clean after the Initial Balance (IB) period.
3. Structural Reference Levels
Previous Day Levels: Plots Previous Day High, Low, and Equilibrium (Midpoint) as standard reference lines.
Initial Balance (IB): Option to display the First Hour High and Low (08:30 - 09:30 CT) to assess day type (Neutral, Trend, Normal Variation, etc.).
RTH VWAP: An anchored VWAP that resets specifically at the RTH Open (08:30 CT), distinct from the standard 24-hour VWAP.
4. Naked Points of Control (nPOCs)
Multi-Timeframe Tracking: Tracks and plots Naked POCs for Daily, Weekly, and Monthly profiles.
Auto-Cleanup: Lines automatically delete themselves the moment price touches them, ensuring you only see untested levels.
Customization: Toggle each timeframe on/off individually.
Settings & Customization:
Global Offset: Move all text labels to the right with a single setting to prevent price action from obscuring text.
8:30 Open Offset: Independent offset for the Open label to distinguish it from other opening references.
Smart Coloring: Text labels automatically match their corresponding line colors for easy identification.
Modular Toggles: Every section (AMT, VWAP, PD Levels, CCV, nPOCs) can be turned on or off individually to suit your specific trading plan.
Usage: This tool is specifically tuned for ES and NQ futures trading but can be adapted for other instruments. It replaces the need for separate indicators for Overnight Highs/Lows, Previous Day Levels, and Volume Profile targeting.

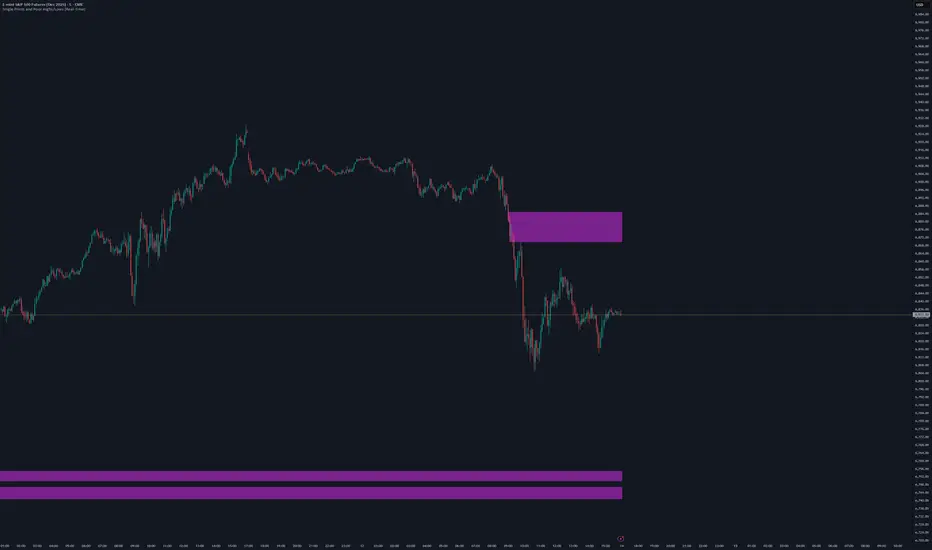
Single Prints and Poor Highs/Lows [Real-Time]This indicator is designed for traders utilizing Auction Market Theory (AMT) who need real-time visibility into market structure inefficiencies. Unlike standard TPO tools that often wait for closed bars or finished sessions, this script builds a developing TPO profile tick-by-tick to identify Single Prints and Poor Highs/Lows the moment they form.
Key Features:
Real-Time Single Prints: Automatically detects and highlights areas of single-print inefficiencies (buying/selling tails) as they happen. These "ghost" boxes persist on the chart until price repairs (fills) them, acting as immediate targets or support/resistance zones.
Poor High/Low Detection: Strictly implements AMT logic to identify "unfinished" auctions. If a session extreme is formed by two or more TPO blocks (indicating a flat top/bottom rather than a rejection tail), it marks the level with a dotted line.
Repair Logic: Both Single Prints and Poor High/Low lines are dynamic. If price revisits and repairs the structure, the markers automatically vanish to keep your chart clean.
Session Control: Fully customizable RTH (Regular Trading Hours) session input (default 08:30–15:15) to ensure profiles are built on relevant liquidity.
Quantization: Adjustable "Ticks per Block" allowing you to tune the sensitivity of the TPO profile to different assets (ES, NQ, CL, etc.).
How It Works:
TPO Construction: The script breaks the session into 30-minute periods (configurable) and tracks price overlap.
Single Prints: When the market expands rapidly, leaving gaps in the profile (single TPO blocks), a box is drawn. If price trades back through this box, it deletes itself.
Poor Extremes: It monitors the current session High and Low. If the extreme price level has a TPO count of ≥ 2, it is flagged as "Poor." If the extreme is a single print (count = 1), it is considered a valid tail and left unmarked.
Settings:
RTH Session: Define your specific trading session time.
TPO Period: Default is 30 minutes (standard AMT).
Ticks per Block: Controls the vertical resolution of the TPO. (Higher values = coarser profile, Lower values = more precision).
Colors: Fully customizable colors for Live Prints, Historical Prints, and Poor High/Low lines.
Usage:
Use this tool to spot immediate structural targets. A Poor High often acts as a magnet for price to revisit and "repair," while Single Prints often defend as support/resistance on the first retest.
Optimized BTC Mean Reversion (RSI 20/65)📈 Optimized BTC Mean Reversion (RSI 20/65)
Optimized BTC Mean Reversion (RSI 20/65) is a rule-based trading strategy designed to capture mean-reversion moves in strong market structures, primarily optimized for Bitcoin, but adaptable to other liquid cryptocurrencies.
The strategy combines RSI extremes, Stochastic momentum, and EMA trend filtering to identify high-probability reversal zones while maintaining strict risk management.
🔍 Strategy Logic
This system focuses on entering trades when price temporarily deviates from equilibrium, while still respecting the broader trend.
✅ Long Conditions
RSI below 20 (oversold)
Stochastic below 25
Price trading above the 200 EMA (or within a controlled deviation)
Designed to buy sharp pullbacks in bullish conditions
❌ Short Conditions
RSI above 65 (overbought)
Stochastic above 75
Price trading below the 200 EMA
Designed to sell relief rallies in bearish conditions
🛡 Risk Management
Fixed Stop Loss: 4%
Fixed Take Profit: 6%
Risk/Reward: 1 : 1.5
No pyramiding (single position at a time)
Full equity position sizing (adjustable)
All exits are predefined at entry, ensuring consistency and emotional discipline.
📊 Indicators Used
200 EMA – Trend direction filter
RSI (14) – Mean-reversion trigger (20 / 65 levels)
Stochastic Oscillator – Momentum confirmation
👁 Visual Features
EMA plotted directly on chart
Real-time Stop Loss, Take Profit, and Entry Price lines
Clear long/short entry markers
Works on all timeframes (optimized for intraday and swing trading)
🔔 Alerts
Long entry alerts
Short entry alerts
(Perfect for automation or discretionary execution)
⚠️ Disclaimer
This strategy is intended for educational and research purposes only. Past performance does not guarantee future results. Always test on a demo account and adjust risk parameters to your own trading plan.

SPX Master Levels & Correlations [Gemini] (v4.2)This will draw on your chart levels of SPX from other time frames low , high and ES

CRS (2 symbols: Ratio or Normalized) + InverseMade for Crosrate comparison By Leo Hanhart
This script is made to do a comparison between two assets under your current chart.
For example if you want to compare SPX over Growth ETF's Below a current asset to find momentum in your stock trading above it

Position Trdaing Lines (2 entries + live PnL)Position Trading Lines (2 entries + live PnL) is a utility script designed to visually manage a manual position on the chart, with clear TP/SL levels and real-time profit & loss.
The script does not place orders. It is meant to help you simulate / track an existing or planned position.
Features
• Up to 2 trades on the same symbol
• Each trade has:
• Direction: Long / Short
• Position size (lot)
• Entry price
• Take Profit (T.Profit) price
• Stop Loss (S.Loss) price
• Entry shift in bars from the last candle (to align with past or future entries)
• Visual lines on the price chart
• Horizontal line at the entry price
• Horizontal line at Take Profit
• Horizontal line at Stop Loss
• Informative labels
• Entry label showing: direction, size and @ entry price
• TP and SL labels showing:
• T.Profit / S.Loss
• position size
• @ price
• estimated PnL at that level
• If both trades share the same TP or SL price, a single combined label is shown with the total size and total PnL.
• Commissions
• Global commission input (percentage over notional).
• Commission is included in all PnL calculations.
• Live PnL label
• Real-time combined PnL of the active trades, updated on the last bar.
• Color changes with sign (green for profit, red for loss).
• Selective PnL for Trade 2
• Trade 2 has a switch: “Count PnL in total”.
• You can keep Trade 2 visible on the chart but exclude it from the combined PnL until it is actually active.
This tool is useful for discretionary traders who want a clean visual representation of their position, R:R, and projected outcomes directly on the chart, without relying on the broker’s position panel.

Ripster Clouds + Saty Pivot + RVOL + Trend1. Ripster EMA Clouds (local + higher timeframe)
Local timeframe (your chart TF):
Plots up to 5 EMA clouds (8/9, 5/12, 34/50, 72/89, 180/200 – configurable).
Each cloud is:
One short EMA and one long EMA.
A filled band between them.
Color logic:
Cloud is bullish when short EMA > long EMA (green/blue-ish tone).
Bearish when short EMA < long EMA (red/orange/pink tone).
You can choose:
EMA vs SMA,
Whether to show the lines,
Per-cloud toggles.
MTF Clouds:
Two higher-timeframe EMA clouds:
Cloud 1: 50/55
Cloud 2: 20/21
Computed on a higher TF (default D, but configurable).
Show as thin lines + transparent bands.
Used for:
Visual higher-TF trend,
Optional signal filter (MTF must agree for trades).
2. Saty Pivot Ribbon (time-warped EMAs)
This is basically your Saty Pivot Ribbon integrated:
Uses a “Time Warp” setting to overlay EMAs from another timeframe.
EMAs:
Fast, Pivot, Slow (defaults 8 / 21 / 34).
Clouds:
Fast cloud between fast & pivot EMAs.
Slow cloud between pivot & slow EMAs.
Bullish/bearish colors are distinct from Ripster colors.
Optional highlights:
Can highlight fast/pivot/slow lines separately.
Conviction EMAs:
13 and 48 EMAs (configurable).
When fast conviction EMA crosses over/under slow:
You get triangle arrows (bullish/bearish conviction).
Bias candles:
If enabled, candles are recolored based on:
Price vs Bias EMA,
Candle up/down/doji,
So you see bullish/bearish “bias” directly in candle colors.
3. DTR vs ATR panel (range vs average)
In a small table panel (bottom-center by default):
Computes higher-TF ATR (default 14, TF auto D/W/M, smoothing type selectable).
Measures current range (high–low) on that TF.
Displays:
DTR: X vs ATR: Y Z% (+/-Δ% vs prev)
Where:
Z% = current range / ATR * 100.
Δ% = change vs previous bar’s Z%.
Background color:
Greenish for low move (<≈70%),
Red for high move (≥≈90%),
Yellow in between,
Slightly dimmed when price is below bias EMA.
This tells you: “Is today an average, quiet, or explosive day compared to normal?”
4. SMA Divergence panel
Separate histogram & line panel:
Fast and slow SMAs (default 14 & 30).
Computes price divergence vs SMA in %:
% above/below slow SMA,
% above/below fast SMA.
Shows:
Slow SMA divergence as a semi-transparent column,
Fast SMA divergence as a solid column on top,
EMA of the slow divergence (trend line) colored:
Blue when rising,
Orange/red when falling.
Static upper/lower bands with fill, plus optional zero line.
This gives you a feel for how stretched price is vs its anchors.
5. RVOL table (relative volume)
Small 3×2 table (bottom-right by default):
Inputs:
Average length (default 50 bars),
Optionally show previous candle RVOL.
Calculates:
RVOL now = volume / avg(volume N bars) * 100,
RVOL prev,
RVOL momentum (now – prev) for data window only.
Table columns:
Candle Vol,
RVOL (Now),
RVOL (Prev).
Colors:
200% → “high RVOL” color,
100–200% → “medium RVOL” color,
<100% → “low RVOL” color,
Slightly dimmer if price is below bias EMA.
This is used both visually and optionally as a signal filter (e.g., only trade when RVOL ≥ threshold).
6. Trend Dashboard (Price + 34/50 + 5/12)
Top-right trend box with 3 rows:
Price Action row:
Uses either Bias EMA or custom EMA on close to say:
Bullish (close > trend EMA),
Bearish (close < trend EMA),
Flat.
Ripster 34/50 Cloud row:
Uses 34/50 EMAs: bullish if 34>50, bearish if 34<50.
Ripster 5/12 Cloud row:
Uses 5/12 EMAs: bullish if 5>12, bearish if 5<12.
Then it does a vote:
Counts bullish votes (Price, 34/50, 5/12),
Counts bearish votes,
Depending on mode:
Majority (2 of 3) or Strict (3 of 3).
Output:
Overall Bullish / Bearish / Sideways.
You also get an optional label on the chart like
Overall: Bullish trend with color, and an optional background tint (green/red for bull/bear).
7. VWAP + Buy/Sell Signals
VWAP is plotted as a white line.
Fast “trend” cloud mid: average of 5 & 12 EMAs.
Slow “trend” cloud mid: average of 34 & 50 EMAs.
Buy condition:
5/12 crosses above 34/50 (bullish cloud flip),
Price > VWAP,
Optional filter: MTF Cloud 1 bullish (50/55 on higher TF),
Optional filter: RVOL >= threshold.
Sell condition:
5/12 crosses below 34/50,
Price < VWAP,
Optional same filters but bearish.
When conditions are met:
Plots BUY triangle up below price (distinct teal/green tone).
Plots SELL triangle down above price (distinct magenta/orange tone).
Alert conditions are defined for:
BUY / SELL signals,
Overall Bullish / Bearish / Sideways change,
MTF Cloud 1 trend flips.
8. Data Window metrics
For easy backtesting / inspection via TradingView’s data window, it exposes:
DTR% (Current) and DTR% Momentum,
RVOL% (Now), RVOL% (Prev), RVOL% Momentum.
TL;DR – What does this script do for you?
It turns your chart into a multi-framework trend and momentum dashboard:
Ripster EMA clouds for short/medium trend & S/R.
Saty Ribbon for higher-TF pivot structure and conviction.
RVOL + DTR/ATR for context (is this a big and well-participated move?).
SMA divergence panel for overextension/stretch.
A compact trend table that tells you Price vs 34/50 vs 5/12 in one glance.
Buy/Sell markers + alerts when:
short-term Ripster trend (5/12) flips over/under medium (34/50),
price agrees with VWAP,
plus optional filters (MTF trend and / or RVOL).
Basically: it’s a trend + confirmation + context system wrapped into one indicator, with most knobs configurable in the settings.

Dual Pivot StructureDual Pivot Structure: Speed vs. Stability
Overview
This script is an experimental prototype designed to solve the most common frustration with Market Structure indicators: The Trade-off between Lag and Noise.
In traditional Price Action analysis, verifying a Pivot High or Low requires waiting for X number of candles to close.
High Lookback (e.g., 5 bars): Reliable structure, but the signal appears too late to trade.
Low Lookback (e.g., 1 bar): Fast signals, but prone to "fake-outs" and noise.
This indicator runs both logic systems simultaneously, allowing traders to see the "True" market structure while receiving "Early Warning" signals for potential entries.
How It Works
The script calculates two parallel layers of market data:
1. The "Structure" Layer (Slow & Reliable)
Uses a standard, higher lookback period (Default: 5 Left / 5 Right).
Purpose: Defines the macro trend. It labels confirmed Higher Highs (HH), Lower Lows (LL), etc.
Visual: Solid colored labels. These confirm the trend bias.
2. The "Signal" Layer (Fast & Actionable)
Uses a rapid, minimal lookback period (Default: 1 Left / 1 Right).
Purpose: Hunts for potential reversals within the macro trend.
Logic: If the Macro Trend is bullish, but price pulls back, this layer looks for a "Micro Pivot" that is higher than the previous Macro Low.
Visual: Orange "⚠ HL?" or "⚠ LH?" text.
How to Use This Script
This tool is best used to time entries within an established trend.
Identify the Trend: Look at the Solid Labels (Green/Red). Are we making HHs and HLs? The trend is Up.
Wait for the Pullback: Allow price to retrace.
Watch for the Early Warning: Look for the orange "⚠ HL?" text.
This appears bars before the structural pivot is confirmed.
The Signal: This is your aggressive entry trigger or alert to watch for a lower timeframe change of character.
Confirmation: If price continues in your direction, the script will eventually print a solid HL label, confirming your early entry was correct.
Settings
Structure Settings: Controls the sensitivity of the main trend (Default: 5/5). Increase this for higher timeframes to filter noise.
Signal Settings: Controls the sensitivity of the early warnings (Default: 1/1). Keep this low for maximum speed.
Visuals: Toggle the "Early Warning" labels on/off and customize colors to fit your chart theme.
Disclaimer
This script is a prototype for educational purposes. The "Early Warning" signals are, by definition, unconfirmed and carry higher risk. Always manage risk accordingly.

SMC IndicatorTitle: Smart Money Concepts Market Structure
Description: This is a technical analysis tool designed to map Market Structure using Smart Money Concepts (SMC) logic. Unlike standard ZigZag indicators that often clutter the chart with repainting lines, this script focuses on delivering a clean, objective view of Trend Structure (Highs/Lows) and Structural Breaks.
The Problem It Solves: Traders often struggle to identify the valid "Swing High" or "Swing Low" in real-time. This indicator automates that process using a non-repainting detection engine, helping traders objectively spot Trend Continuations (BoS) and Potential Reversals (CHoCH).
How It Works:
1. Pivot Detection (The ZigZag Engine): The script identifies Swing Points based on a user-defined Depth and Deviation %.
High (H): A peak is confirmed when price retraces by the deviation percentage.
Low (L): A trough is confirmed when price rallies by the deviation percentage.
Ghost Line: A dotted line connects the last confirmed pivot to the current live price, allowing you to visualize the developing structure before it locks in.
2. Structure Mapping: Once pivots are confirmed, the script analyzes price action relative to those points:
BoS (Break of Structure): Trend Continuation. Triggered when price breaks a confirmed pivot in the direction of the trend (e.g., breaking a Higher High in an uptrend).
CHoCH (Change of Character): Trend Reversal. Triggered when price breaks a major pivot in the opposite direction (e.g., breaking a Higher Low in an uptrend).
Visual Features:
Minimalist Design: Uses floating text labels (no background boxes) to keep price action visible.
Color Coded: Blue/Maroon for Continuation (BoS), Aqua/Orange for Reversal (CHoCH).
Settings Guide:
ZigZag Deviation %: Set this to 5.0 for Higher Timeframes (Daily/4H) or lower it to 0.2 - 0.5 for Intraday Scalping (1m/5m).
Ghost Line: Toggle on/off to see the real-time projection.
Alerts: Full alert support included for Bullish/Bearish BoS and CHoCH signals.
Credits: Logic based on standard Price Action and Market Structure theory.

9/39 EMA Crossover + ADX + RSI Filter (No builtin ADX)
9/39 EMA Crossover + ADX + RSI Filter
This indicator combines classic trend‑following EMAs with momentum and trend‑strength filters to generate high‑quality Buy/Sell signals. It is designed for traders who want cleaner entries, reduced noise, and confirmation‑based signals.
✅ How It Works
1. EMA Trend Logic
• Buy Signal:
9 EMA crosses above 39 EMA
• Sell Signal:
9 EMA crosses below 39 EMA
This captures short‑term momentum shifts within the broader trend.
✅ 2. ADX Trend Strength Filter
To avoid weak or sideways markets, signals only trigger when:
• ADX > 20
This ensures the market has enough directional strength before taking trades.
✅ 3. RSI Momentum Filter
Momentum must align with the direction of the crossover:
• Buy: RSI > 50
• Sell: RSI < 50
This prevents counter‑trend entries and improves signal reliability.
✅ Final Signal Conditions
✅ BUY
• 9 EMA crosses above 39 EMA
• ADX > 20
• RSI > 50
✅ SELL
• 9 EMA crosses below 39 EMA
• ADX > 20
• RSI < 50
✅ Features
• Clean BUY/SELL labels on chart
• ADX calculated manually (compatible with all Pine environments)
• Alerts included for automation
• Works on all timeframes and instruments
✅ Best Use‑Cases
• Trend‑following strategies
• Swing trading
• Intraday momentum confirmation
• Filtering out sideways/noisy markets

My WatchlistUse Case
Do you belong to a group of traders that post key levels based on their technical analysis to be utilized for trading opportunities? The goal of this indicator is to reduce your daily prep time by allowing you to paste in the actual level values instead of trying to manually create each of the horizontal lines.
How it works
Simply enter the values of the key levels for the tickers that you would like to plot horizontal lines for. If you don't want to plot a level just leave the value as zero and it will be ignored.
Settings
You can enable/disable any of the levels
You can change the colors of the levels
You can add Previous Day High and Previous Day Low levels to the chart

Daily Fib Levels Clean (Retrace + Extension)This indicator automatically detects the latest Daily Swing High and Swing Low and plots clean Fibonacci retracement levels based on those swings.
Even if you switch to 4H, 1H, 15m, or 5m, the levels remain locked to the Daily timeframe, giving you consistent higher-timeframe structure on any chart.
