High-Prob SMC: MSS + FVG RetestThe Institutional Footprint: High-Probability SMC Engine
Stop chasing the market and start trading where the orders are actually sitting. While most indicators tell you what happened, the High-Probability SMC Engine reveals where the market is imbalanced and where "Big Money" is forced to return.
This isn't just a signal generator—it’s a precision tool designed to filter out retail "breakout traps" and wait for the high-conviction Mitigation Phase.
Why This Engine is Your Unfair Advantage
* The "Smart Money" Filter: Most traders buy the initial breakout and get caught in a "fakeout." This engine identifies the Market Structure Shift (MSS) but stays patient, waiting for the price to return to "fair value" before signaling an entry.
* FVG Magnet Logic: It automatically maps Fair Value Gaps (FVG)—the literal footprints of institutional displacement. These are the zones where price is most likely to react with explosive force as orders are filled.
* Precision Retest Entry: It eliminates FOMO (Fear Of Missing Out) by triggering only when the price retests the FVG. This gives you a tighter stop-loss and a massive mathematical edge.
* Volatility-Adjusted Risk: The script uses dynamic ATR-based logic to calculate your Stop Loss and Take Profit in real-time. No more guessing where to exit; the math is handled for you based on current market behavior.
The "Golden Setup" Execution
* The Impulse: The script detects an aggressive break of a 20-period high or low—the Institutional Signature.
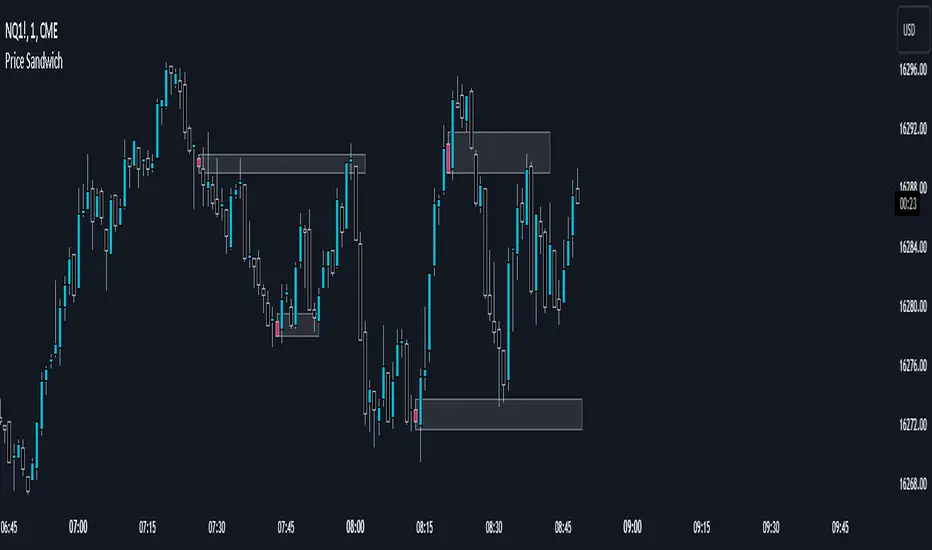
* The Void: A highlighted Green or Red zone appears, marking an unfilled order block that the market must address.
* The Sniper Entry: You wait for the price to "fill the gap." When the price touches that zone, the engine prints your ENTRY label with exact coordinates for your Stop and Target.
Master the Market Mathematics
This indicator is built on the principle of Mean Reversion within Trend. By combining structure shifts with price imbalances, you are essentially trading with the wind at your back. It forces you to be a disciplined sniper, taking only the trades that have the highest probability of an explosive continuation move.
> "Retail traders trade the break. Professionals trade the retest of the imbalance."
>
Ready to see the market through a professional lens? Attach the SMC Engine to your chart and stop guessing where the next move starts.
Chỉ báo Pine Script®