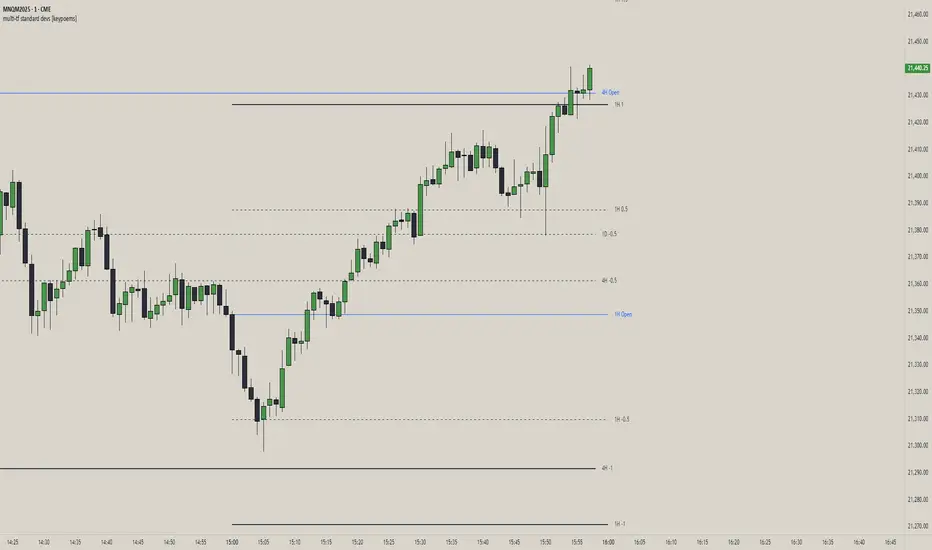
Dynamic Dots Dashboard (a Cloud/ZLEMA Composite)The purpose of this indicator is to provide an easy-to-read binary dashboard of where the current price is relative to key dynamic supports and resistances. The concept is simple, if a dynamic s/r is currently acting as a resistance, the indicator plots a dot above the histogram in the red box. If a dynamic s/r is acting as support, a dot is plotted in the green box below.
There are some additional features, but the dot graphs are king.
_______________________________________________________________________________________________________________
KEY:
_______________________________________________________________________________________________________________
Currently the dynamic s/r's being used in the dot plots are:
Ichimoku Cloud:
Tenkan (blue)
Kijun (pink)
Senkou A (red)
Senkou B (green)
ZLEMA (Zero Lag Exponential Moving Average)
99 ZLEMA (lavender)
200 ZLEMA (salmon)
You'll see a dashed line through the middle of the resistances section (red) and supports section (green). Cloud indicators are plotted above the dashed line, and ZLEMA's are below.
_______________________________________________________________________________________________________________
How it Works - Visual
_______________________________________________________________________________________________________________
As stated in the intro - if a dynamic s/r is currently above the current price and acting as a resistance, the indicator plots a dot above the histogram in the red box. If a dynamic s/r is acting as support, a dot is plotted in the green box below. Additionally, there is an optional histogram (default is on) that will further visualize this relationship. The histogram is a simple summation of the resistances above and the supports below.
Here's a visual to assist with what that means. This chart includes all of those dynamic s/r's in the dynamic dot dashboard (the on-chart parts are individually added, not part of this tool).
You can see that as a dynamic support is lost, the corresponding dot is moved from the supports section at the bottom (green), to the resistances section at the top (red). The opposite being true as resistances are being overtaken (broken resistances are moved to the support section (red)). You can see that the raw chart is just... a mess. Which kinda of accentuates one of the key goals of this indicator: to get all that dynamic support info without a mess of a chart like that.
_______________________________________________________________________________________________________________
How To Use It
_______________________________________________________________________________________________________________
There are a lot of ways to use this information, but the most notable of which is to detect shifts in the market cycle.
For this example, take a look at the dynamic s/r dots in the resistances category (red background). You can see clearly that there are distinctive blocks of high density dots that have clear beginnings and ends. When we transition from a high density of dots to none in resistances, that means we are flipping them as support and entering a bull cycle. On the other hand, when we go from low density of dots as resistances to high density, we're pivoting to a bear cycle. Easy as that, you can quickly detect when market cycles are beginning or ending.
Alternatively, you can add your preferred linear SR's, fibs, etc. to the chart and quickly glance at the dashboard to gauge how dynamic SR's may be contributing to the risk of your trade.
_______________________________________________________________________________________________________________
Who It's For
_______________________________________________________________________________________________________________
New traders: by looking at dot density alone, you can use Dot Dynamics to spot transitionary phases in market cycles.
Experienced traders: keep your charts clean and the information easy to digest.
Developers: I created this originally as a starting point for more complex algos I'm working on. One algo is reading this dot dashboard and taking a position size relative to the s/r's above and below. Another cloud algo is using the results as inputs to spot good setups.
Colored Bars
There is an option (off by default, shown in the headline image above) to fill the bar colors based on how many dynamic s/r's are above or below the current price. This can make things easier for some users, confusing for others. I defaulted them to off as I don't want colors to confuse the primary value proposition of the indicators, which is the dot heat map. You can turn on colored bars in the settings.
One thing to note with the colored bars: they plot the color purely by the dot densities. Random spikes in the gradient colors (i.e. red to lime or green) can be a useful thing to notice, as they commonly occur at places where the price is bouncing between dynamic s/r's and can indicate a paradigm shift in the market cycle.
_______________________________________________________________________________________________________________
Timeframes and Assets
_______________________________________________________________________________________________________________
This can be used effectively on all assets (stocks, crypto, forex, etc) and all time frames. As always with any indicator, the higher TF's are generally respected more than lower TF's.
Thanks for checking it out! I've been trading crypto for years and am just now beginning to publish my ideas, secret-sauce scripts and handy tools (like this one). If you enjoyed this indicator and would like to see more, a like and a follow is greatly appreciated 😁.
Tìm kiếm tập lệnh với "fib"
SHARP PIVOTS (INTRADAY LEVELS) Hi friends,,
This indicator is based on modified fib levels.
Buy above 23.7% from recent low and sell below 72.7% from recent high.
15 mins close above or below the entry levels Recommended.
use Heiken Ashi candles for trend confirmation.
USE RSI 60/40(UNCONVENTIONAL) For additional conformation
ORB 15 Min FIB retracement by fnohouseretracement logic applied to find out range breakout on 30 minute
Simple Fibonacci RetracementSimple Fibonacci Retracement is a free and easy to use script to plot Fibonacci levels, for any assets like Stocks, Forex, Commodities , Cryptocurrencies etc. on any time frame chart.
Fibonacci Levels can be plotted using Lookback or manual Price input from the settings.
1. Lookback type - Candles
Determines the High and Low price of the user input number of Candles back (100 default) and plots Fibonacci Levels based on the calculated High and Low for the number of candles in the past from the current candle. The levels stay intact on any time frame as long as no new Highs or Lows are formed.
2. Lookback type - Days
Determines the High and Low price of the user input number of Days back (100 default) and plots Fibonacci Levels based on the calculated High and Low for the number of days in the past from the day of the current bar. The levels stay intact on any time frame as long as no new Highs or Lows are formed.
3. Manual Price Input
Plots Fibonacci Levels based on the user specified High and Low Price in the settings input fields. The levels stay intact on any time frame irrespective of new Highs or Lows being formed. Manual Price Input will enable the trader to keep the Levels intact and visually see the higher Fibonacci Retracement levels, when the price crosses beyond 100% retracement. On the other two lookback types, the Fibonacci levels are displayed only upto 100% retracement.
The Fibonacci levels can also be reversed by enabling 'Reverse' option from the settings.
M4x FIB-o-matic V3.6M4x is a combination of RSI and Fibonacci components, set up with fixed values, so no worries about "original" settings...
Recommendet Bot settings:
- use one short and one long bot
- take profit 0.5%
- 6 simul trades
- 3 security orders, VolScale 1.5, StepScale 1.4
- Deviation 0.35%
- cooldown 780sec
Alerts:
- aproved Buy
- aproved Sell
- heartbeat (..check if Script is running. Gives you the possibility to get an alive Signal every minute)
(With a few "input" M4x can be changed into a highly configurable Signal Generator with menus.)
...tested successful with BTC-ETH, gl ;-)
Ultimate Pivot PointsLately, there are a plethora of Pivot scripts on TV, I'll be adding one more :3
This is a combination that I use for my personal use so I've coded accordingly. Its the best combination of the regular pivot, woodie pivot, fib, and cams, in my humble opinion. Also added previous day high and low as those are the key levels for intraday traders.
Also, this is a multi-timeframe version.
Enjoy~
Volatility based Standarde Deviation and Fib. Pivot PointsThis indicator plots Standard deviation levels and Fib. Pivot Points. I prefer to use only SD levels but Fib. levels also come handy in providing support and resistance.
How to use this indicator:
You have to manually enter instrument's Closing Price / Settlement Price and VIX closing price to draw each day's levels.
For NQ, I use VXN closign price and for ES or RTY, I use VIX closing price.
This indicator can be used on individual stocks and forex pairs.
Rain On Me IndicatorFinally, we made it :D
Rain On Me Indicator, As the name suggests this indicator will make money rain on you. More seriously, this indicator contains :
This indicator contains:
-Bullish and bearish RSI divergences showing on chart with alerts.
-Parabolic SAR with Labels on chart with buying or selling alerts.
-3 Moving Average (MA 1 : 7, MA 2 : 21 MA 3 HIDDEN : 50 (Cross alerts for Pullback)
-Customizable Bollinger band
-Fibonacci on 10 levels with the level 0 to the middle. This Fibonacci help a lot since it can let you find easily entry/exit point, trend and even where to place your Take Profit and Stop Loss. It have alerts for most important levels (0.382, 0.§, 0.618) for Crossunder and Crossover in Bullish or Bearish trend.
-Fully Customizable Ichimoku Cloud.
-Trend Buy/Sell Labels on chart with buying or selling signal alerts.
-Trend color visible on candles.
If an alert trigger of Buy/Sell Signal with the same alert based on PSAR, so you can be confident to enter in position. Alway checking fibs level that is the key thing with this indicator. the script has been set to have the best possible results on as many market as possible. But.best result for zfter backtesting is on
Forex : EUR/USD, USDJPY, USDCAD.
Indice : S&P500, NASDAQ, DOWJONES
Commodities : OIL, WTI
Everything work on following timeframe :
15MN, 1H, 4H, DAILY, WEEKLY.
So that you can avoid having to set it again, whether it be in minutes, hours, days, months.
So you can easily trade in the mode that suits you best. It works well on everything from indices to forex to commodities etc. I thank all those who allowed me to carry out this project. IF you feelt free to give your ideas, suggestions, for improve it by sending me messages.
This is really a first version sp it may contain bugs / errors that will be fixed over time.
A BIG THANK YOU TO QUANTNOMAD WHO GIVE ME HIS PERMISSION TO USE, MODIFY AND REPUBLISH HIS "Ultimate Pivot Points Alerts" Script Indicator :
Good trade to all !
Bollinger levelesSimilar to VRSI level script , only this time I use bolliger
plus add similar to a fib system to it
the cross up or down of high and low are optional if you want to see as L=low.h = high
so it a bollinger just it look different:)
Fibonacci EMA TrendlinesSimple EMAs based on the Fibs plus the 200 EMA - Default inputs are 8,13, 21, 55, 200. Inspired by Philakones EMAs.
Automatic Fibonacci Pivot Point S/R LevelsThis is a great tool to find confluences between Fibonacci Pivot point on various time frames.
Fib Pivots used
23.6%
38.2%
50%
61.8%
76.4%
100%
127.2%
141.4%
161.8%
200%
If price is between two levels on the update the lines shift
Yearly Pivots shown on 1m - Daily timeframes
PIvots recalculate on every day
Monthly pivots show on 1m - 60m timeframes
Pivots recalculate every hour
Weekly pivots show on 1m - 15m timeframes
Pivots recalculate every 30m
There is a lot of code but it got the job done.
It would easy to interchange if you prefer different types of pivots
It would be easy to add an on/off if you dont want so many levels on your smaller time frames
If anyone can streamline it please do
Freedom FibThis script will allow to automatically draw levels on the chart for a potential pullback play like shown in this snapshot here
It will draw risk/reward levels upon your favorite ema (default is 13ema) as the price goes and it will work for both long or short scenarios for a potential trend continuation play.
You got the option to align your level to match exactly your selected ema or to be placed in between the first two levels (default settings) if you prefer.
I personally use this one settings for shorter time frames (up to 3min) and the aligned one for higher time frames.
TA Basics: Creating a Fibonacci Weighted Moving AverageIn the previous 2 posts in this series, we played around with simple math concepts to create a zero-lag moving average that can deliver fast response and less lag - that we can use to enable better trend following, or as filter / signal.
here we take a step further - instead of using equal weight for the moving average (as in the Simple moving average) or linear weights (as in the weighted moving average), we get to pick THE MAGIC SEQUENCE, Fibonacci.
we will use the Fibonacci Sequence as weights to produce our moving average - so practically, we create a "Fibonacci Weighted Moving Average" (let's call it FiMA) - and compare the result with other commonly-used moving averages of the same length
in a Fibonacci moving average, the data will be weighted based on the Fibonacci Series starting from 1 (for the furthest data point)
so for example, if we use a length of 10, the weights will be 1, 1, 2, 3, 5, 8, 13, 21, 34, 55 with the 55 being the weight applied to the most recent / current bar's selected value (close, hl2, hc3..etc) and moving backward
before i posted this script, i searched around to see if someone else has already wrote this - i found a couple, but the approach we use here in this code is different - i can't claim it to be more efficient - i honestly don't know - but the resulting code here, IMHO, is more compact and easier to integrate in other studies that you may like to put together to leverage this idea, to create your own indicators and strategies.
the reason the code here is more compact, is that it utilizes a shorter formula to calculate the FIb(n) - i included the source where i found that formula, and i tested it before using it in the code.
i also added an optional "extra smoothing" for the resulting MA, by simply calling the fima() function a second time (so like doing a 2-pass filter), with a smaller length on the result of the 1st pass. keep this smoothing small not to produce too much lag.
i like the outcome when compared to other moving averages - it has a fast response to data/trend change and less overshoot - but honesty i didn't see any real "Fibonacci Magic" :) .. but i'll leave the final judgement to those who use it - this is more of an experimental code in all cases - please feel free to use, change and share feedback.
Bollinger Bands Fibonacci Ratios (Automatic Timeframe)A Fibonacci Bollinger Bands indicator with automatic timeframe detection.
The timeframe reverts to the value specified in settings when viewing Daily, Monthly or seconds-based charts.
Based on: Bollinger Bands Fibonacci ratios by Shizaru (/script/bCy9urOG-Bollinger-Bands-Fibonacci-ratios/)
EMA / Fibonacci / Bollinger Indicator for Market Sniper SuiteHello all,
this script was created to be used in conjunction with Market Sniper - Trading/Scalping Suite . It was put together to make instrument analysis faster and less convoluted.
It includes
9 Fibonacci Exponential moving averages + 2 Simple moving averages
Auto Fibonacci levels - Tradingviews Auto Fib Retracement - with some modifications
Bollinger Bands - To faster spot squeeze momentum
Stochastic FibonacciThis is your run-of-the-mill stochastic indicator, with one slight difference. I added Fibonacci ratios and colored them across the rainbow for aesthetics.
I noticed that the stochastic moving averages, K & D, would reverse in between 0 & 100. Just like price, they were likely Fibonacci ratios.
My original plan was to create a strategy script, and trade whenever K & D crosses the Fib levels. However, they do not cross them perfectly, rather they merely float near them and reverse. Therefore, the strategy would have never made the trades.
As you will notice in the script, there is Bitcoin Hash Rate data imported. I did so because I would like to create a stochastic hash rate indicator at some point. For those of you with this same passion, there is the hash data to mess around with; consider it an Easter Egg...
Bitcoin Logarithmic Growth Curves & ZonesI found this awesome script from @quantadelic and edited it to be a bit more legible for regular use, including coloured zones and removing the intercept / slope values as variables, to leave space for the fib levels in the indicator display. I hope you all like it.
DPO RMA STRATEGYThis strategy uses tradingview's built-in "Detrended Price Osciilator" ( DPO )indicator script.
It takes the average of 6 different fib lookback periods. (55,89,144,233,377,610)
This is plotted in the purple line.
It then takes the RMA of the DPO and uses the RMA's to determine entry points with crossovers and crossunders.
It's an extremely easy indicator to use. You mostly only need to adjust the last 2 inputs (These are the RMA Smoother inputs)
Works well with most any market and with any timeframe.
Works great on Heiken Ashi if you keep orders under 150. But I can't post in heiken ashi format thanks to automated traders complaining to tradingivew that they can't make any money with heiken ashi candles
And then pine coders like this that are embraced with high regard because they realized that they can spam a heiken ashi chart with over 400 trades and magically it has excessive slippage.
Number StrategyA simple strategy based on fib ratios and numbers
Best time frames for highest accuracy ( Requires Tradingview Pro )
34 mins for quick scalps
89 mins for weekly Swings
254 mins for monthly swings
-Ability to set alerts for btc and $ singals
-Modify Ema values, Set colour
-Trend following strategy, Needs an active trend for best results
-sideways/choppy action results in bad signals
How to trade:
-----------------
Long if Btc signal appears , preferred if price is trading above the 233 EMA .
You can use the 233 EMA for activating trades during price retest
Short if $ signal appears , preferred if price is trading Below the 233 EMA .
You can use the 233 EMA for activating trades during price retest
Bitcoin Logarithmic Growth CurvesThis is a version of the Log Growth Curves previously published by Quantadelic. The update includes customizable fib levels and filled upper and lower bands. This script is only intended for the Bitcoin log chart to reflect the channel that can be found on a log/log Bitcoin chart. The projections out from current levels are theoretical path of BTC based on the current trajectory.
In theory, reaching into the bottom zone of this chart is a good zone for accumulation while the top zone is a good are for distribution.
DonDonAim of this indicator is to detect trend and support more easy
first I use the fib donchian script that i publish sometime ago
next is speacial trend line based on modiffied bollinger and donchian channel
last add info panel so when close cross the basis line up the trend wil be green in the info panel , if cross down the trend will be in red
to this template we can add more indicator but i just keep this simple
(JS) Ultimate RSISo my goal here was to combine all of my RSI ideas into a single indicator in order to make kind of a "Swiss Army Knife" version of the Relative Strength Index ...
------------------------------------------------------------------------------------------------------------------------------------------------------------------------------------------------------------------------------------------------------------------
So, let's begin with the first RSI indicator I made, which is the RSIDVW (Divergence/Volume Weighted);
To rephrase my original post, the "divergence/volume weighted" portion is meant to expand upon the current RSI format by adding more variables into the equation.
The standard RSI is based off one value that you select (open, close, OHLC4, HLC3, etc.) while this version takes three variables into account.
The default setting is to have RSI normal without anything added to it (Divergence Weight = 0)
1st - it takes the standard variable that RSI normally uses.
2nd - it factors RSI divergence by taking the RSI change % and price change % to form a ratio. Using this ratio, I duplicated the RSI formula and created a divergence RS to be factored in with the standard price RS .
3rd - it takes Relative Volume and amplifies/weakens the move based upon volume confirmation. (So if Relative Volume for a price bar is 1.0, the RSI plot would be the same as it normally would)
So to explain the parameters
- Relative Volume Length: This uses the RV length you specify to determine spikes in volume (or lack of volume ), which then is added into the formula to influence the strength of the RSI move
- RV x Divergence: This is how I calculated the original formula, but you can leave this unchecked to turn Relative Volume off, or apply elsewhere.
- RV x RS: There's two sides, Divergence RS and Standard RS - these check marks allow you to select which part you prefer to be multiplied by Relative Volume .
Checking neither turns off Relative Volume , while checking both amplifies its effects by placing it on both sides of the equation.
-Divergence Weight: This controls how much the DVW portion of the formula influences the RSI plot. As I referred to earlier, default is 0 making RSI normal. The Scale is 0-2, so 1.0 would be the same as 50%.
When I do have DVW on, I generally set it to 0.5
-SMA Divergence: To smooth, or not to smooth, that is the question. UJsing an SMA here is much smoother in my opinon, but leaving it unchecked runs it through an RMA the same way standard RSI is calculated.
-Show Fractal Channel: This allows you to see the whole fractal channel around the RSI (This portion of the code, compliments of the original Ricardo Santos fractal script)
------------------------------------------------------------------------------------------------------------------------------------------------------------------------------------------------------------------------------------------------------------------
The next portion of the script is adding a "Slow RSI"...
This is rather simple really, it allows you to add a second RSI plot so that you can watch for crossovers between fast and slow lines.
-Slow RSI: This turns on the second RSI Plot.
-Slow RSI Length: This determines the length of the second RSI Plot.
------------------------------------------------------------------------------------------------------------------------------------------------------------------------------------------------------------------------------------------------------------------
Pivot Point RSI was something a friend of mine requested I make which turned out pretty cool, I thought... It is also available in this indicator.
-Pivot Points: Selecting this enables the rest of the pivot point related parts of the script
If Pivot Points isn't selected, none of the following things will work
-Plot Pivot: Plots the pivot point .
-Plot S1/R1: Plots S1/R1.
-Plot S2/R2: Plots S2/R2.
-Plot S3/R3: Plots S3/R3.
-Plot S4/R4: Plots S4/R4.
-Plot S5/R5: Plots S5/R5.
-Plot Halfway Points: Plots a line between each pivot .
-Show Pivot Labels: Shows the proper label for each pivot .
When using intraday charts, from a 15 minute interval or less the pivots are calculated based on a single days worth of price action, above that the distance expands.
Here are the current resolutions Pivot Points will work with:
Minutes - 1 , 2, 3, 5, 10, 13, 15, 20, 30, 39, 78, 130, 195
Hours - 1, 2, 3, 4, 5, 6
Daily
Weekly
Currently not available on seconds or monthly
------------------------------------------------------------------------------------------------------------------------------------------------------------------------------------------------------------------------------------------------------------------
Background Colors
Background Colors: I have six color schemes I created for this which can be toggled here (they can be edited).
Gray Background for Dark Mode: Having this on looks much better when using dark mode on your charts.
------------------------------------------------------------------------------------------------------------------------------------------------------------------------------------------------------------------------------------------------------------------
Now finally the last portion, Fibonacci Levels
-Fibonacci Levels: This is off, by default, which then uses the standard levels on RSI (30-50-70). When turned on, it removes these and marks fib levels from 0.146 through 0.886.
------------------------------------------------------------------------------------------------------------------------------------------------------------------------------------------------------------------------------------------------------------------
So the quick rundown:
Ultimate RSI contains "divergence/volume weighted" modifications, a slow RSI plot, pivot points , and Fibonacci levels all while auto-plotting divergence and having the trend illustrated in the background colors.
RSI has always been my "go to" indicator, so I hope you all enjoy this as much as I do!