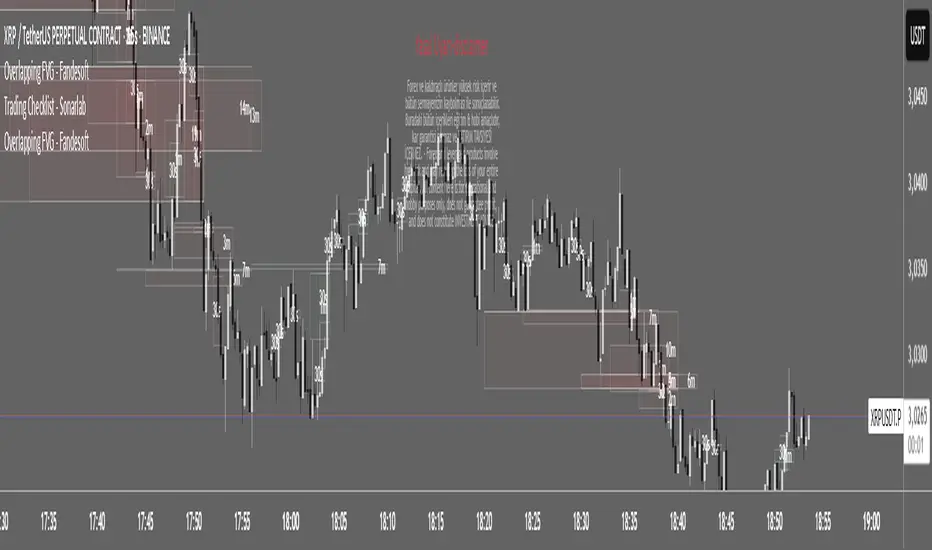
Overlapping FVG - [FNDSFT]🧠 Overview
This script plots Higher Timeframe Fair Value Gaps (FVGs) with full visibility and precise placement on lower timeframe charts. Each timeframe (30s–15m) has its own independent toggle, custom label, and box styling, allowing traders to analyze market structures in detail.
🎯 Features
✅ Identifies Fair Value Gaps using a 3-candle logic (candle 1 high vs candle 3 low, and vice versa).
✅ Plots HTF FVG boxes aligned to lower timeframes for intraday analysis.
✅ Supports custom timeframes: 30s to 15m, with individual toggles.
✅ Full visual customization: border color, bullish/bearish box opacity, label font size and color.
✅ Modular inputs to enable or disable specific timeframes for performance.
✅ Uses barstate.isconfirmed logic for stable, non-repainting plots.
⚙️ How It Works
The script requests higher timeframe data via request.security. For each confirmed bar, it checks for FVGs based on:
Bullish FVG: low >= high
Bearish FVG: low >= high
If a gap is detected, a box is plotted between candle 1 and candle 3 using box.new().
Timeframe toggles ensure calculations remain within the limit of 40 request.security calls.
📈 Use Cases
Scalpers and intraday traders analyzing microstructure.
ICT methodology practitioners visualizing displacement and inefficiencies.
Traders layering multiple FVG timeframes for confluence.
Tìm kiếm tập lệnh với "fvg"
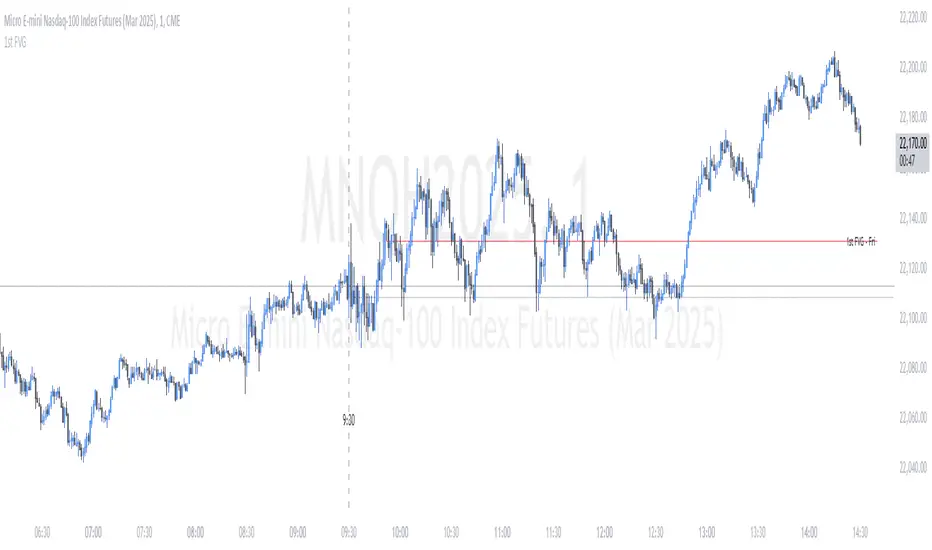
US Index First Candle Breakout with FVGStrategy Description: US Index First Candle Breakout with FVG
Works on NG1! and YM1! for maximised profit.
Overview:
The "US Index First Candle Breakout with FVG" strategy is designed to capitalize on the volatility present during the first minutes of the U.S. stock market opening. By focusing on the initial 5-minute candle, this strategy identifies key price levels that can serve as breakout points for potential trading opportunities.
Key Features:
1. Breakout Strategy:
The strategy tracks the high and low of the first 5-minute candle after the market opens at 9:30 AM (New York time). These levels are critical indicators for potential price movements.
A long position is triggered when the price breaks above the high of the first candle, while a short position is initiated when the price drops below the low.
2. Manual Trade Direction Filter: (developing)
Users can select their preferred trading direction through a customizable input:
Buy only: Execute long trades only.
Sell only: Execute short trades only.
Both: Allow trades in both directions.
This feature enables traders to align the strategy with their market outlook and risk tolerance.
3. Fair Value Gap (FVG) Analysis:
The strategy incorporates an FVG filter to enhance trade precision. It assesses market gaps to identify whether a breakout is supported by underlying market dynamics.
The algorithm checks for conditions that indicate a valid breakout based on previous price action, ensuring that trades are made on strong signals.
4. Risk Management:
A customizable risk per trade setting allows users to define their risk tolerance in ticks.
The strategy includes a reward-to-risk ratio input, enabling traders to set their take-profit levels based on their risk preferences.
Stop-loss levels are automatically calculated based on the breakout direction, helping to safeguard against unexpected price movements.
5. Automatic Trade Execution:
Trades are executed automatically based on the defined conditions, reducing the need for manual intervention and allowing traders to capitalize on market movements in real-time.
Session End Closure:
The strategy automatically closes all open positions at 4:00 PM (New York time), ensuring that trades do not carry overnight risk.
How to Use the Strategy:
Simply add the script to your TradingView chart, set your desired parameters, and select your preferred trade direction.
Monitor for breakout signals during the first trading session, and let the automated system handle trade entries and exits based on your specifications.
Conclusion:
The "US Index First Candle Breakout with FVG" strategy is ideal for traders seeking to leverage early market volatility with a structured approach. By combining breakout techniques with FVG analysis and customizable trade direction, this strategy offers a robust framework for navigating the complexities of the U.S. stock market's opening dynamics.

Fair Value Gap & Gap Profile [BigBeluga]This indicator is designed to help traders identify and utilize fair value gaps on price charts and analyze volume at these points. These gaps, formed by significant price movements, can act as key support and resistance levels. The indicator enhances trading strategies by visually representing these gaps, making it easier for traders to spot potential entry and exit points.
⦿ What Is A Fair Value Gap?
Before diving into the practical use of the Fair Value Gap in trading, it's crucial to have a clear understanding of what it is and how to identify it on your charts. The Fair Value Gap, or FVG , is a widely utilized tool among price action traders to detect market inefficiencies or imbalances. Sometimes you will even see them labeled as inefficiencies by other traders. These imbalances arise when buying or selling pressure is significant, resulting in a large upward or downward move, leaving behind an imbalance in the market.
The idea behind FVGs is that the market will eventually come back to these inefficiencies in the market before continuing in the same direction as the initial impulsive move. FVGs are important since traders can achieve an edge in the market. Price action traders can also use these imbalances as entry or exit points in the market.
By visually representing gaps and their profile, the Fair Value Gap (FVG) & Gap Profile indicator provides a historical overview of gaps within a specified lookback period, showing the distribution and density of gaps across different price levels. This insight helps traders identify zones where the price tends to move more fluidly, often encountering less resistance. High points on the Gap Profile indicate areas where gaps have occurred frequently in the past, which could serve as potential breakout or breakdown zones.
⦿ Key Features:
● Gap Detection and Visualization:
- Identifies Bullish and Bearish Gaps: Highlights gaps where the price moved significantly up or down along with a volume. Intensivity of color show strength of FVG by volume
- Filter for Significant Gaps: Allows users to filter out insignificant gaps, ensuring only relevant gaps are displayed.
● Customizable Display Options:
- Shows Filled Gaps: Option to display gaps that have been filled, aiding in the analysis of historical price movements.
- Displays Filled Gap Levels: Highlights the levels of filled gaps.
● Gap Profile:
Gap Profile Insight: The Gap Profile feature shows the distribution of gaps over a specified lookback period. High points on the FVG Profile indicate areas with a significant number of gaps in the past. These high points are signs of low resistance for price movement. Consequently, at these points, the price tends to move more easily without encountering strong resistance. Traders can use this information to identify potential breakout or breakdown zones where price action is likely to be more fluid.
● Grab Liquidity Detection:
- Collect liquidity Signals: Plots markers on the chart where price interacts with gap levels, providing potential trade signals based on liquidity.
⦿ How Traders Can Use This Indicator:
- Plan Trades: Use gaps as potential entry and exit points, based on whether the price is approaching, filling, or moving away from a gap.
- Analyze Market Trends: Understand historical price movements by analyzing filled gaps and their impact on current price action.
- Analyze Gap Profile: Identify zones where the price tends to move more fluidly, often encountering less resistance. High points on the Gap Profile indicate areas where gaps have occurred frequently in the past, which could serve as potential breakout or breakdown zones.
- Price imbalance: market will eventually come back to these inefficiencies and fill them. inefficiencies or imbalances in the market usually act as a magnet for price.
By incorporating the Fair Value Gap & Gap Profile indicator into their trading strategy, traders can gain a clearer understanding of market dynamics and make more informed trading decisions.

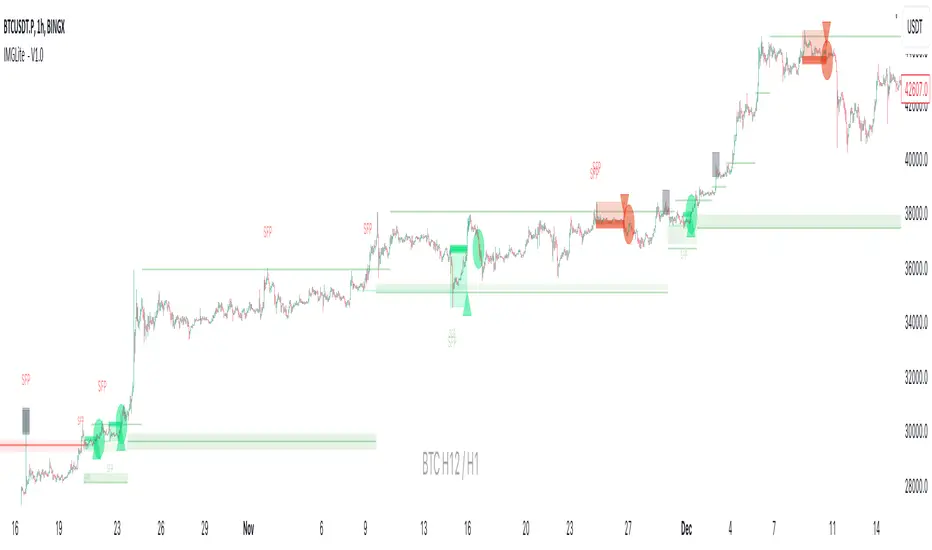
IMGLite - V1.0IMG indicators use five sequential stages to analyse price and alert users to potential Trade Setups using various Price Action Concepts as detailed below:
a. Identify Higher Timeframe Market Structure and Points of Interest (HTF-POIs)
b. Calculate position size based on your risk appetite, fees and account leverage
c. Alert you to risk managed trade setups at enabled HTF-POIs
d. Alert you to trade exits based on your set criteria
e. Provide Additional Alerts such as Higher Timeframe SFPs and Market Structure Breaks that act as potential early warnings that a trade setup may be forming
a. HTF POIs Available with IMG LITE:
1. HTF Market Structure Range Highs and Lows
2. HTF Order Blocks
3. HTF Breakers
4. HTF FVGs
1. Higher Timeframe Market Structure Range High and Low through Multiple Timeframe Analysis:
Market Structure can be defined using several techniques. The IMG indicators employ the Close through High/Low technique, which necessitates a candle to close through a structural level to validate a structural break and designate a new range.
Example: H12 Market Structure visualisation on a H12 Chart with annotations:
By selecting a particular Market Structure timeframe in the settings, the indicator immediately illustrates both current and historical market structures for the chosen timeframe across all subordinate timeframes, subject to the limitations of your Tradingview subscription.
Example: H12 Market Structure visualisation on a H1 Chart with annotations:
2. Higher Timeframe Order Blocks
An Order Block represents the last candle of the opposite direction preceding a Market Structure Break. For instance, a bullish Order Block is identified as the final bearish candle leading to a bullish market structure break, and vice versa for bearish Order Blocks.
Example: H12 OB visualisation on a H12 Chart with annotations:
When activated, the indicator will highlight the Higher Timeframe Order Blocks responsible for a Market Structure Break on all subordinate timeframes relative to the chosen Market Structure Timeframe.
Note: if multiple OBs exist, the indicator will display the OB closest to the new range extreme
Example: H12 OB visualisation on a H1 Chart with annotations:
Higher Timeframe Breakers
A Breaker Block is identified as the most recent Order Block that has been breached by price, leading to an opposite Market Structure Break. For example, a bullish Breaker Block is the last bearish Order Block that price has passed through, confirming a bullish structural break, and the inverse is true for bearish Breakers.
Example: H12 Breaker visualisation on a H12 Chart with annotations:
Once enabled, the system will display Higher Timeframe Breaker Blocks after an opposite Market Structure Break is confirmed on all subordinate timeframes.
Example: H12 Breaker visualisation on a H1 Chart with annotations:
Higher Timeframe Fair Value Gaps (FVGs)
A Fair Value Gap is a concept used by price action traders to identify market inefficiencies, where buying and selling are not balanced. It appears on a chart as a triple-candle pattern, with a large candle flanked by two others whose highs and lows do not overlap with the large candle, creating a gap. This gap often attracts the price towards it before the market resumes its previous direction.
Example of the indicator displaying a Higher Timeframe’s FVGs on a Lower Timeframe (LTF) chart:
-The upper chart labelled H12/H12 is the indicator displaying H12 Structure and FVGs on a H12 chart.
-The lower chart labelled H12/H1 is the indicator displaying H12 FVGs on a H1 chart
b. Risk Management and Position Sizing:
The System will automatically calculate position size based on the account size, max leverage and risk appetite details input in settings. Calculated trade details are included in the Tradingview Alerts as well as interactive labels on the charts.
Details include but are not limited to:
Trade Timeframe
Side: Long/Short
Type: Limit/Market
Position Size in $ and Units
Lot sizes if applicable
Trade Risk %
Take Profit Level
Entry Price
Stoploss Price
c. Trade Setup Types Available with IMG LITE:
The system will alert you to potential trade setups at these HTF POIs: .
1. Higher Timeframe (HTF) Swing Failure followed by a Lower Timeframe (LTF) MSB at Range Extremes
2. Lower Timeframe (LTF) Swing Failure followed by a Lower Timeframe (LTF) MSB at enabled HTF POIs
1. HTF Swing Failure followed by a Lower Timeframe (LTF) MSB at Range Extremes
A Swing Failure Pattern (SFP) is a technical analysis concept used in trading to identify potential reversals in price trends. It occurs when the price attempts to surpass a previous high or low but fails to sustain that level, indicating a possible change in market direction. There are multiple methods to define a SFP but this indicator uses the failure to close through a Key Level. When confirmed, HTF SFPs will be displayed on-screen and an alert will fire if enabled.
Example: H12 SFPs at Range Extremes on a H1 Chart:
Alerts to Enter at Lower Timeframe MSBs
When enabled, a potential trade setup label and alert will generate when a HTF SFP is confirmed at a Range Extreme followed by a Chart Timeframe (Lower Timeframe) Market Structure Break (MSB). These signals are agnostic to current Market Structure bias and will generate at both extremes.
Signals will alert you to enter a Limit Entry at the Lower Timeframe MSB Level
2. LTF Swing Failure followed by a LTF MSB at Range Extremes at enabled HTF POIs
The system will alert you to a lower timeframe setup if these conditions are met inside enabled HTF POIs (OBs / Breakers / FVGs):
- LTF SFP
- LTF MSB
Signals will alert you to enter a Limit Entry at the Lower Timeframe MSB Level
Example:
d. Trade Exit Types Available with IMG Lite:
Exit alerts will trigger at user defined R:R
Example: H12 SFPs and Potential Trade Setups with Exits at fixed 2R on a H1 Chart:
e. IMG LITE Alerts Overview
Higher Timeframe Market Structure Breaks (HTF MSBs)
The system provides notifications of confirmed Market Structure Breaks based on the selected Higher Timeframe Market Structure Timeframe. For instance, selecting a weekly structure will trigger an alert when weekly price closes through a weekly structural level, and the same logic applies to other timeframes like D, H12, H4, H1 etc.
The system provides notifications of:
1. Confirmed HTF Market Structure Breaks
2. Confirmed HTF SFPs at Range Extremes
3. Potential Trade Setups (defined above)
4. Fixed R Trade Exits
To enable alerts, right-click on the indicator and select “Add Alert on IMG ...”. You may customise the alert name as desired and then click 'Create' to finalise the alert setup.
General Note:
There is no system, indicator, algorithm, or strategy that can provide absolute certainty in predicting market movements. Use trading indicators as a tool to assist with trading decisions; manage your risk wisely.
Stay safe and Happy Trading!
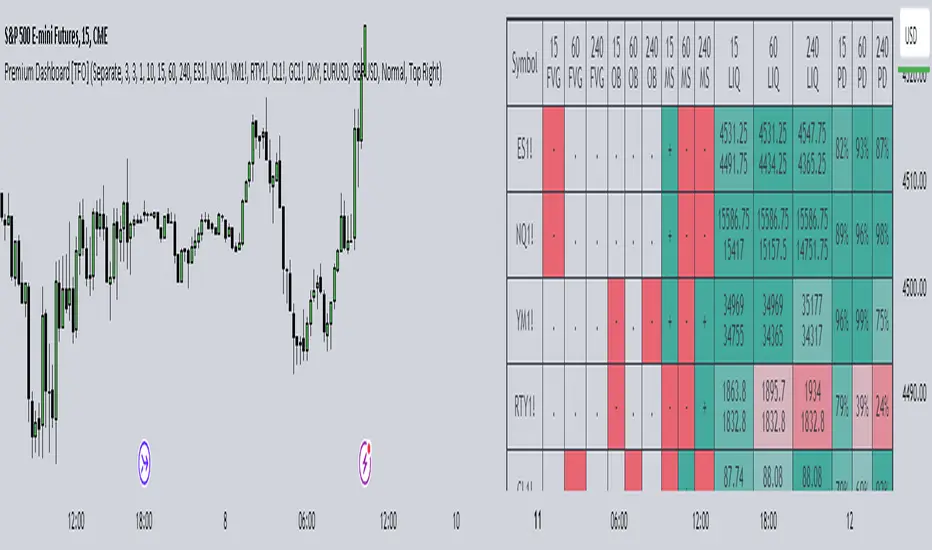
Premium Dashboard [TFO]The purpose of this indicator is to serve as a scanner/dashboard for several symbols across multiple timeframes. At the time of release, the scanner looks for the following criteria on all selected timeframes:
- Whether price is in a Fair Value Gap (FVG)
- Whether price is in an Order Block (OB)
- Current Market Structure
- Nearest Liquidity Pivots
- Proximity to said Liquidity Pivots
For FVGs, the user selects a Displacement Strength to validate FVGs from the selected timeframes; larger values require greater displacement. The table will indicate whether price is presently trading in a valid bullish FVG, bearish FVG, or none.
With OBs, the user selects a similar Displacement Strength to validate OBs from the selected timeframes. Again, larger values require greater displacement to validate an OB. The table will indicate whether price is presently trading in a bullish OB, bearish OB, or none.
For Market Structure, the table will indicate whether the current structure is bullish or bearish on each respective timeframe. A pivot strength parameter is used to determine which swing highs and swing lows warrant valid Market Structure Shifts (reversals) or Breaks of Structure (continuations).
The Liquidity section of the dashboard displays the nearest Buyside and Sellside Liquidity (major highs and lows) from each respective timeframe. A similar pivot strength parameter is used to determine how "strong" the highs and lows must be in order to be considered valid.
The Premium / Discount section offers an alternative view of the nearest Liquidity Pivots, where it will instead display a percent value to describe how close price is to Buyside or Sellside Liquidity. Values approaching 100% imply price is trading close to the nearest Buyside Liquidity, while values approaching 0% imply price is trading close to Sellside Liquidity.
Users can also choose to show any of the above features on their current chart: FVGs, OBs, cumulative Market Structure, and Liquidity, all from the various selected timeframes.
ADAPTIVE ICT MULTI-ZONEAdaptive ICT Multi-Zone
Why Another ICT Script?
Most public ICT zone scripts flood your chart with dozens of noisy, overlapping boxes that never get cleaned up, use fixed lookbacks that work on one asset and fail on another, and mark every tiny gap as “FVG” — turning the chart into a rainbow mess that’s impossible to trade.
ADAPTIVE ICT MULTI-ZONE is built differently:
Only the strongest, most recent zones pass the adaptive filter (default 3 bullish OB + 3 bearish OB + 3 FVG). No more chart clutter.
Fair Value Gaps are filtered by ATR (default ≥ 0.7 × ATR) and optional high-volume confirmation so you only see gaps that actually matter.
Order Blocks are true swing-based (pivot high/low).
Every zone automatically extends far to the right until price closes through it — you never miss a mitigation.
Zero repainting. Zero lag. Zero memory leaks. Runs perfectly on every time frame.
In short: while many ICT scripts are noisy toys, this one is a surgical tool that shows exactly what institutional desks are up to.
How to Trade It Best (Simple & Effective)
Wait for price to return to a freshly drawn zone (watch the newest ones — they have the highest probability).
Look for confluence:
Price inside a Bullish Order Block + bullish engulfing or strong volume → aggressive long.
Price inside a Bearish Order Block + bearish engulfing or strong volume → aggressive short.
Price sweeping into an FVG and instantly rejecting → high-probability reversal (especially if the FVG had high volume when created).
Use higher-timeframe bias: if the daily/4H zone aligns with your 15-min or 5-min zone → stack size.
Take partials at the opposite-side order block or next FVG. Let runners go to next liquidity zone.
That’s it.
This script doesn’t try to do everything. It does one thing — show you the exact institutional zones that actually get respected — and it does it cleaner and smarter.
Add it, delete every other OB/FVG script you own, and catch more accurate reversals.

Multi-Symbol FVG Scanner - Fixed This is a Multi-Symbol Fair Value Gap (FVG) Scanner for TradingView that monitors multiple currency pairs simultaneously for FVG patterns.
Key Features
What it does:
Scans 5 currency pairs simultaneously for Fair Value Gaps (FVGs)
Detects both bullish and bearish FVG patterns
Tracks when FVGs get "mitigated" (price reverses back through them)
Displays results in a real-time table
Generates alerts when patterns are detected
Shows visual histogram of active signals

[MTX] Weekly Support & Resistance Weekly Support & Resistance
Overview
Discover key market structure with this all-in-one indicator:
Weekly Support & Resistance (SR) levels , Fair Value Gap (FVG) detection , and Automatic Fibonacci retracements .
Designed for MTX traders, it plots non-repainting weekly highs/lows/opens/closes, highlights unmitigated FVGs for potential imbalances, and auto-draws Fib levels, Perfect for swing/day traders on XAUUSD.
🚀 Key Features
- Weekly SR Levels : Plots previous week's High (resistance), Low (support), Open, and Close. Optional historical levels (Week -2/-3).
- SR Zones : Customizable % zones around levels for dynamic support/resistance bands. Fill colors for easy visualization.
- FVG Detection : Identifies bullish (green) and bearish (red) Fair Value Gaps on your chart timeframe.
- buy/sell Signals :
- Trend Filter : Optional EMA/SMA to filter signals
- Auto Fibonacci : auto-retracement with 20+ levels (0%, 23.6%, 38.2%, 50%, 61.8%, 100%, extensions to 423.6%, negatives). Custom colors, labels, and background fills.
- Alerts: Built-in for FVG creation/mitigation + all buy/sell signals. Set up once for real-time notifications.
⚠️ Important Disclaimer
This indicator is for educational and analysis purposes only. It provides visual tools and signals based on historical price action— not financial advice. Past performance ≠ future results. Trading involves risk; use proper risk management. Backtest thoroughly. No guarantees of profitability. Consult a financial advisor.
#tradingview #smc #MTX #fvg #fibonacci #supportresistance

Effort HeatmapThe Effort Heatmap visualizes where meaningful, same-direction volume occurred inside an imbalance during strong directional movement.
Instead of analyzing total bar volume or traditional volume-at-price distributions, this tool reconstructs a simplified internal volume profile using lower-timeframe data.
When a Fair Value Gap forms during a high-volume displacement, the script highlights the portions of the imbalance candle where directional effort was concentrated and projects those regions forward as a heatmap.
The purpose of this indicator is not to predict price or represent institutional activity, but to offer a visual way to study how the market delivered volume inside a move that created an imbalance.
How It Works
1. Lower-Timeframe Volume Extraction
The indicator retrieves open, close, and volume data from a selected lower timeframe.
Only sub-candles that move in the same direction as the previous bar are considered, ensuring the heatmap reflects directional effort—not mixed volume.
2. Candle Body Binning
The FVG candle is divided into multiple horizontal bins.
Each lower-timeframe sub-candle contributes volume proportionally to the bins it overlaps, creating a vertical volume distribution for that bar.
3. Imbalance (FVG) Detection
A simple 3-bar displacement logic detects bullish or bearish imbalances.
An optional Z-Score filter ensures the heatmap only forms when volume is relatively elevated compared to recent history.
4. Heatmap Projection
When a qualifying imbalance occurs:
• The FVG bar’s volume distribution is normalized
• Only areas with relatively elevated volume are displayed
• Colored heatmap boxes are created and extend forward
• These boxes remain until price trades into or through them
This allows traders to observe how price interacts with past zones of concentrated directional effort.
What Makes It Different
Most volume tools focus on fixed session profiles, market-wide volume-at-price calculations, or bar-level volume totals.
The Effort Heatmap instead reconstructs a per-bar vertical volume distribution using lower-timeframe price action and displays it only when displacement occurs.
Rather than treating the candle as a single block of volume, the indicator highlights where inside the candle body volume was delivered while moving in the displacement direction.
This creates a unique visualization of directional effort that conventional profiles, OB/FVG indicators, and classic oscillators do not show.
How to Use It
1. Apply to any timeframe: The indicator works on all chart timeframes, but gains more detail when higher timeframes are used in combination with lower-timeframe volume data.
2. Identify displacement moments: When a bullish or bearish FVG forms with a high volume Z-Score, the heatmap will appear.
3. Observe the heatmap structure:
Each horizontal band represents the relative concentration of same-direction volume inside the previous candle.
4. Watch how price interacts with these zones:
Heatmap areas extend until price touches or trades through them, at which point they stop extending and are finalized.
5. Combine with your own analysis:
These areas can be used to study...
...how past directional volume clusters influence current movement
...structural reactions to zones of prior effort
...which parts of a displacement candle were most active
The indicator is a visual study tool, not a signal generator.
Settings
• Volume Source Timeframe
Chooses the lower timeframe used to reconstruct internal volume. Smaller timeframes give more detail; larger timeframes give smoother profiles.
• Z-Score Lookback
Controls how many bars are used to measure relative volume. Larger values make the volume filter stricter.
• Z-Score Threshold
Minimum relative-volume strength required to draw a heatmap. Higher values show only high-effort moves.
• Volume Filter (%)
Removes weaker bins based on how much volume they contain compared to the strongest one. Higher percentages = fewer but more meaningful zones.
• Bullish / Bearish Colors
Sets the base color for heatmap boxes depending on direction.

Bull/Bear FVG Density RatioThis indicator tracks the directional frequency of Fair Value Gaps (FVGs) over a configurable lookback window, offering a clean, responsive measure of market imbalance.
🔍 What It Does:
Detects bullish and bearish FVGs using a 3-bar displacement logic
Calculates the ratio of FVGs to candles over the last N bars
Plots separate density curves for bullish and bearish FVGs
Includes a threshold line to help identify regime shifts (e.g., drought vs spate)
📈 How to Use:
Use rising density to confirm trend strength or breakout momentum
Watch for crossovers above the threshold to signal active imbalance regimes
Combine with price action or volume overlays for high-confluence setups
⚙️ Inputs:
Lookback Window: Number of candles used to calculate FVG density
Threshold: Visual guide for regime classification (default: 0.2)
This tool is ideal for traders who want to move beyond symptomatic signals and model structural causality. It pairs well with lifecycle scoring, retest velocity, and HTF overlays.

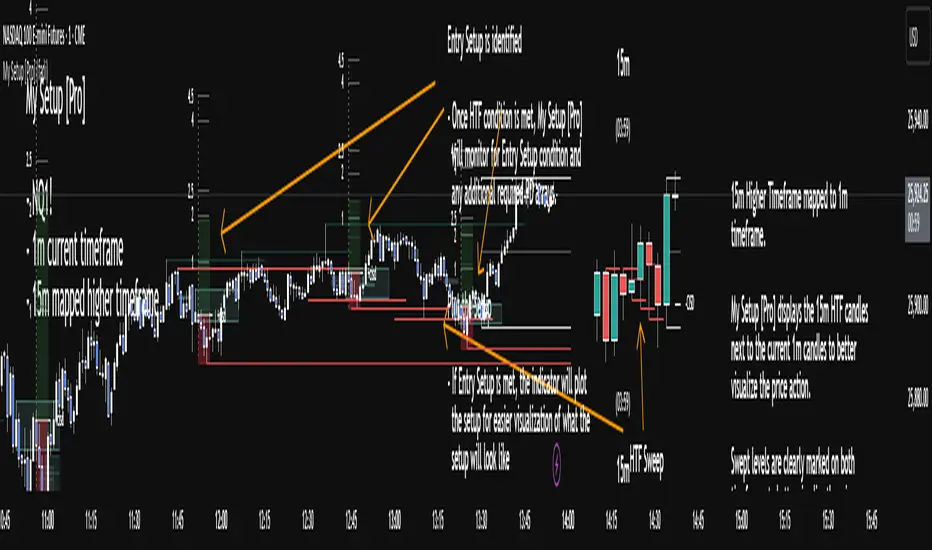
My setup [Pro] (fadi)My Setup is a powerful TradingView indicator that visualizes your trading strategy, helping you find high-probability setups with precision and discipline. It combines Higher Timeframe (HTF) context with Lower Timeframe (LTF) entries on a single chart, streamlining your trading process.
What It Does
Tracks your chosen timeframe and its paired higher timeframe for custom trade setups, so you don’t have to stay glued to the screen.
Plots clear Entry, Stop Loss, and Take Profit levels when your conditions align.
Customizes to your strategy with HTF triggers (e.g., sweeps, liquidity grabs) and LTF entries (e.g., Order Blocks, FVGs, Breakers).
Ensures discipline by only showing setups that meet all your rules, eliminating emotional trading and FOMO.
Backtest your edge by visualizing past setups to refine entries, stops, and confluences.
How It Works
Set Your HTF Trigger: Choose a market event like a sweep of a high/low, pivot point, or liquidity grab on the paired higher timeframe (e.g., 1H for a 5m chart).
Define Your LTF Entry: Select your entry model from a range of institutional concepts, such as Order Block, Fair Value Gap (FVG), Inverted FVG (iFVG), Breaker Block, Unicorn Model, and more, on the chart’s timeframe.
Add Confluence Filters: Stack conditions like requiring an FVG + Breaker for higher-probability setups.
See It on Your Chart: When a setup forms, it’s instantly plotted with Entry, Stop Loss, and Take Profit levels based on your Risk-to-Reward ratio.
Key Features
Multi-Timeframe Sync: Pair your chart’s timeframe (e.g., 5m) with a higher timeframe (e.g., 1H) for seamless analysis.
Institutional Tools: Supports a comprehensive suite of ICT concepts, including Order Blocks, FVGs, iFVGs, Breakers, Unicorn Model, and additional entry models.
Custom Risk Management: Set your Stop Loss and Take Profit levels with fixed R:R or measured moves using large range of entry and stop levels.
Session Filtering: Limit setups to specific trading sessions (e.g., London, New York) with timezone support.
Visual Clarity: Displays HTF candles and key levels on your chart for context, with customizable colors and styles.
Alerts: Get notified the moment a valid setup appears, even on live candles.
Who It’s For
Traders who want to systematize their ICT-based strategy on a single chart.
Those seeking to trade with discipline and avoid impulsive decisions.
Anyone looking to backtest and optimize their setups with clear, visual feedback.
Busy traders who need a tool to track their chart while they focus on life.
Why Choose My Setup ?
Save Time: Let the indicator track your chart and its paired timeframe.
Trade Confidently: Only take A+ setups that match your exact rules.
Learn and Improve: Analyze historical setups to refine your strategy.
Disclaimer of Warranties and Limitation of Liability for [My Setup ]
Please read this disclaimer carefully before using the [My Setup ] indicator (hereafter referred to as "the Software").
1. No Financial Advice
The Software is provided for educational and informational purposes only. The data, calculations, and signals generated by the Software are not, and should not be interpreted as, financial advice, investment advice, trading advice, or a recommendation or solicitation to buy, sell, or hold any security or financial instrument.
2. Assumption of Risk You acknowledge that trading and investing are inherently risky activities that carry a high potential for significant financial loss. All actions you take in the market, including but not limited to trade execution and risk management, are your sole responsibility. You agree to use the Software at your own sole risk. The creator shall not be held responsible or liable for any financial losses or damages you may incur as a result of using the Software.
3. No Warranty; "AS IS" Provision
The Software is provided "AS IS" and "AS AVAILABLE", without any warranties of any kind, either express or implied. The creator disclaims all warranties, including, but not limited to, implied warranties of merchantability, fitness for a particular purpose, accuracy, timeliness, completeness, and non-infringement.
The creator does not warrant that the Software will be error-free, uninterrupted, secure, or free of bugs, viruses, or other harmful components. You acknowledge that software is never wholly free from defects, and you are responsible for implementing your own procedures for data accuracy and security.
4. Limitation of Liability
TO THE MAXIMUM EXTENT PERMITTED BY APPLICABLE LAW, IN NO EVENT SHALL THE CREATOR, FADI ZEIDAN, BE LIABLE FOR ANY CLAIM, DAMAGES, OR OTHER LIABILITY, WHETHER IN AN ACTION OF CONTRACT, TORT, OR OTHERWISE, ARISING FROM, OUT OF, OR IN CONNECTION WITH THE SOFTWARE OR THE USE OR OTHER DEALINGS IN THE SOFTWARE.
This limitation of liability applies to any and all damages, including but not limited to:
Direct, indirect, incidental, special, consequential, or exemplary damages.
Loss of profits, revenue, data, or use.
Financial losses resulting from trading decisions made based on the Software.
Damages arising from software defects, interruptions, or inaccuracies.
5. Indemnification
You agree to indemnify, defend, and hold harmless the creator, Fadi Zeidan, from and against any and all claims, liabilities, damages, losses, or expenses, including reasonable attorneys' fees and costs, arising out of or in any way connected with your access to or use of the Software.
6. Acknowledgment and Agreement
By accessing, installing, or using the [My Setup ] indicator, you acknowledge that you have read, understood, and agree to be bound by the terms of this disclaimer. If you do not agree with these terms, you must not use the Software.
STOCK SCHOOL | FVGThe Stock School FVG Indicator is designed to help traders identify and trade Fair Value Gaps (FVGs) and Inverse FVGs (IFVGs) with precision.
Built for both intraday and swing traders, this tool highlights high-probability trading zones where institutions leave imbalances in the market.
✨ Key Features:
Auto-detects FVGs & IFVGs in real-time
Works on all timeframes and instruments (Nifty, BankNifty, Stocks, Forex, Crypto)
Non-repainting logic for reliable signals
Clean and easy-to-use interface with Stock School styling
Perfect for Smart Money Concept (SMC) traders
🚀 With this indicator, you can:
Spot institutional footprints quickly
Combine with BOS, CHoCH, Order Blocks for high accuracy
Trade liquidity sweeps + FVG collisions with confidence
💡 Disclaimer:
This indicator is for educational purposes only. Trading involves risk. Always use proper risk management.

XAUUSD 1H – FVG Buy/Sell Signals XAUUSD 1H – Fair Value Gap (FVG) Buy/Sell Signals (No Boxes)
What it is:
A clean, signal-only indicator for Gold on the 1-hour chart. It detects 3-bar Fair Value Gaps, waits for a deep retest, then confirms with strong candle structure + trend + ADX before printing a BUY/SELL arrow. No rectangles or clutter—just selective, high-quality signals.
Why it works:
Instead of chasing breakouts, the script hunts for imbalances (FVGs) where price often returns to “fair value.” It only fires when:
price revisits the gap by a configurable depth,
the candle closes beyond the far edge with a small buffer,
the candle body is ≥ ATR × K (confirms intent),
the broader trend (EMA-50/EMA-200) agrees, and
ADX (Wilder, manual) shows sufficient strength.
Key features
✅ Signal-only: arrows/labels—no boxes on chart.
✅ Deep retest logic (percentage of zone), not just a touch.
✅ Strong close filter (edge + buffer) + ATR body filter.
✅ Trend filter (EMA-50 vs EMA-200) to keep trades with the regime.
✅ ADX strength to avoid chop.
✅ One signal per zone (optional “delete on use”).
✅ Alerts for both BUY and SELL.
✅ Built for Pine v6, non-repainting logic on bar close.
Inputs you can tune
Min FVG size (pts) – ignore tiny gaps.
Retest depth (%) – how deep price must come back into the gap.
Close buffer (pts) – extra confirmation beyond zone edge.
Min body ≥ ATR× – candle strength requirement.
Min ADX – trend strength threshold.
Expire after X bars – keep zones fresh.
Delete zone after signal – true = one-shot signals.
How I use it
Apply to XAUUSD 1H.
Keep default filters for selective signals.
For more setups, lower Min FVG size or ADX and reduce retest depth; for stricter signals, do the opposite.
Combine with S/R or session timing (London/NY) for added confluence.
Notes
Signals are generated on bar close.
Designed for clarity and discipline—fewer, cleaner arrows over constant noise.
Works on other symbols/timeframes, but tuned for Gold 1H.
Tags: #XAUUSD #Gold #FVG #SmartMoney #1H #TrendFollowing #ADX #ATR #PineV6 #TradingView

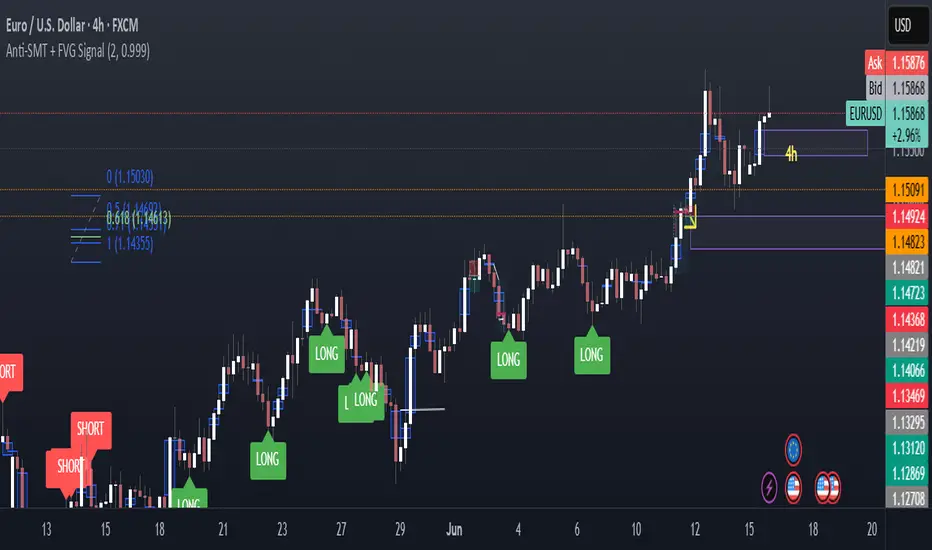
Anti-SMT + FVG SignalMade by Laila
Anti-SMT + FVG Strategy
A contrarian price-action strategy that combines SMT illusion with Fair Value Gap (FVG) confirmation and multiple filters.
Strategy Concept
This strategy challenges traditional SMT divergence logic. Instead of entering trades based on expected SMT divergence between correlated pairs (e.g., EURUSD and DXY), it assumes the divergence is false and will reverse. The concept is to take advantage of these false signals, also known as "SMT illusions."
To confirm the setup, the strategy integrates Fair Value Gaps (FVGs), which are price imbalances left unfilled between candle 1 and 3.
Anti-SMT Logic
Short Entry:
EURUSD makes a new high (Candle 1)
DXY does not make a new low
Long Entry:
EURUSD makes a new low (Candle 1)
DXY does not make a new high
This divergence is considered false, and the strategy expects a reversal.
Fair Value Gap (FVG) Confirmation
A trade is only triggered if the price touches a Fair Value Gap during:
Candle 1 (the candle that forms the SMT illusion), or
Candle 2 (entry confirmation)
This helps avoid low-quality setups and increases entry precision.
Additional Filters
To improve robustness and prevent overfitting, the strategy includes:
EMA Trend Filter:
Long entries are allowed only if price is above the 50 EMA
Short entries are allowed only if price is below the 50 EMA
Time Filter:
Trades are only permitted between 08:00 and 18:00 UTC
Cooldown Filter:
A minimum of 10 candles between trades is required to prevent overtrading
Strategy Parameters and Defaults
Optimized for EURUSD on the 4-hour (4H) timeframe
Includes realistic commission and slippage
Uses conservative position sizing (e.g., 1% per trade)
Backtesting over hundreds of trades shows approximately 57% win rate under default conditions
These results are historical and do not guarantee future performance
Purpose and Value
This strategy offers a structured and logical approach to contrarian trading by:
Introducing the concept of false SMT divergence
Using price inefficiencies (FVGs) as confirmation
Filtering trades with realistic and widely accepted conditions
Encouraging quality over quantity through strict entry rules
It is not a simple mashup but a well-defined trading system that blends institutional concepts in a usable framework.
Liquidity Fvg IdentifierDear Traders,
This indicator is very effective and supports Price action Traders.
Swing Identification
This automatically Detect swings level and mark as per the chart Time frame. these lines can be used for support and resistance.This is represented by Yellow and Blue lines
There is an option to put Higher time frame swing levels and these are represented by Green and Red Lines. Eg: if you are trading in 5 mins and you also want 1 hour swing levels , then you can get this by selecting higher time frame 1 hour and select both Chart and Htf in the option provided.
Trade: If price is approaching where both Times frames swing lines are coinciding these levels act as strong Support and Resistance . You need to wait for proper price action to form and take Trades.
FVG
This also automatically detect Fare Value Gaps and mark as per the chart Time Frame. These can be used for reversal trades . This is represented buy purple blocks
There is an option to put higher time frame FVG and these are represented by Red Blocks. Eg : if you are trading in 15 mins and you also want 4 hours FVG, then you can get this by selecting Higher time frame 4 hours and select both chart and HTF in the option provided.
Trade: If price is approaching where both time frames FVG are coinciding , these box will act as strong support and reversal. wait for proper price action and trade can be taken.
Volume Breakout.
This will automatically detect and volume breakout of last 60 candles and plots below the candle. These can be adjusted in setting as per requirement. suppose you want for last 30 candles , you can select 30 and it will plot below candle when ever there is breakout.
Trade: When ever volume breakout is coming near swing or fvg support or resistance , this can be considered to support reversal.
Pls take your financial advisor suggesting before using taking trades .
any suggestion reach to us thru message
Thanks

Pipsttocra Technical Patterns: EV HV FVG & OBPipstocrat Technical Patterns , identifies and visualizes key technical analysis patterns and structures on a TradingView chart. Here's a simple breakdown of what it does:
Fair Value Gaps (FVG):
Detects and highlights bullish and bearish Fair Value Gaps as colored boxes.
Adds centerline markers to indicate potential price levels.
Order Blocks (OB):
Identifies bullish and bearish order blocks (areas of significant buying or selling).
Displays them as colored rectangles extending to the right of the chart.
Candlestick Patterns:
Detects Engulfing Patterns (bullish and bearish) with volume confirmation.
Highlights Hammer and Inverted Hammer patterns with customizable shapes and colors.
Customization Options:
Allows users to adjust colors, sizes, and styles for all patterns and structures.
Provides options to show/hide specific patterns like FVGs, engulfing candles, hammers, etc.
Alerts:
Generates alerts for detected patterns, such as FVGs, order blocks, engulfing candles, and confluence zones (combination of FVGs and order blocks).
Management Features:
Automatically removes older or "filled" patterns (optional).
Tracks and updates patterns dynamically as new bars form.
Purpose:
This tool helps traders spot high-probability trading opportunities by identifying key market structures (like FVGs and order blocks) and candlestick patterns. It combines multiple technical analysis concepts into one comprehensive indicator for better decision-making.

Fair Value Gap FinderFunctionality
Detection of Fair Value Gaps:
A bullish Fair Value Gap (FVG Up) is identified when the low of two candles before the current bar (low ) is greater than the high of the current bar (high ).
A bearish Fair Value Gap (FVG Down) is identified when the high of two candles before the current bar (high ) is lower than the low of the current bar (low ).
Color Coding:
Bullish Fair Value Gaps are highlighted in green to indicate potential areas of support.
Bearish Fair Value Gaps are highlighted in red to indicate potential areas of resistance.
Visualization Using Rectangles:
If an FVG is detected, the script creates a rectangle spanning a fixed number of bars (right=bar_index+5) to visualize the price inefficiency.
The rectangle extends from the upper to the lower boundary of the gap and has a semi-transparent fill (bgcolor=color.new(color, 90)) for better readability.
Implementation Details
Variable Initialization: The script defines floating-point variables (fvgUpTop, fvgUpBottom, fvgDownTop, fvgDownBottom) to store the price levels of identified gaps.
Conditional Assignments: When an FVG is detected, the corresponding top and bottom boundaries are assigned to the respective variables.
Box Creation: The box.new function is used to draw a rectangle on the chart, marking the FVG zones for better visualization.

ICT First Presented FVG - NY Open [LuckyAlgo]
This indicator identifies the first Fair Value Gap (FVG) that occurs during the New York trading session, combined with NY session opening price levels. It's an essential tool for traders who follow ICT concepts and focus on the NY trading session.
ICT refers to this as the First Presented FVG, while other traders may call it the 9:30 FVG.
This indicator is best for the 1 minute timeframe, while 5 minute also works.
Detects and marks the first FVG of the NY session
Displays both bullish (green) and bearish (red) FVGs with customizable transparency
Shows the NY session opening price with clear labels
Includes optional vertical line at 9:30 AM NY open
Maintains clean chart visibility with adjustable maximum display days
Includes session date and time labels for easy reference
The indicator helps traders identify potential reversal zones and continuation opportunities by combining two powerful concepts: Fair Value Gaps and NY session opening price. This makes it particularly valuable for day traders and swing traders who want to capitalize on institutional order flow patterns during the most liquid trading session.
You can customize the indicator's appearance, including FVG box colors, time range display, and whether to show the NY open markers. This flexibility allows you to integrate it seamlessly with your existing trading setup.
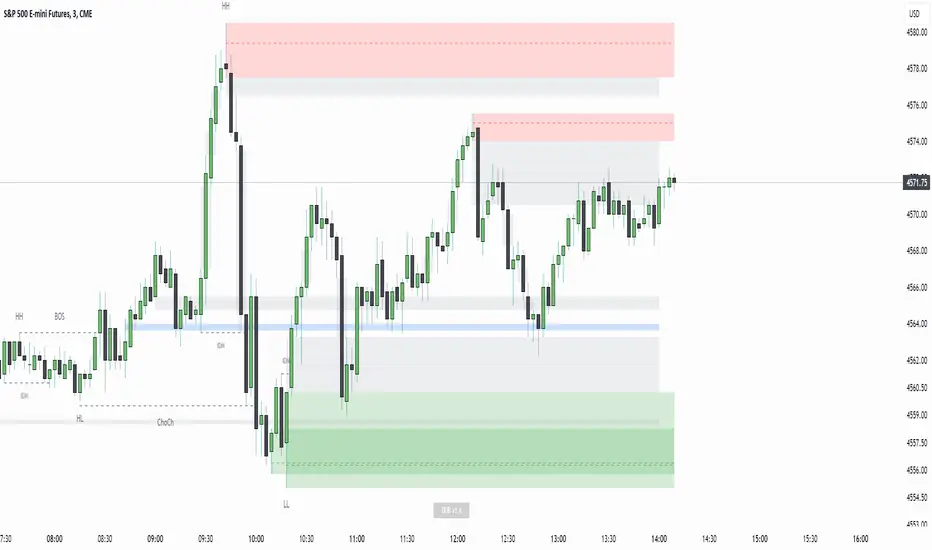
Displacement Order Blocks ~ DOB [Liquidity_Pro]Displacement Order Blocks (DOB)
This indicator shows order blocks with displacement (FVG required) and leans heavily on ICT’s generous and insightful teachings to define midlines for FVG, IFVG, and order blocks. The market structure definitions follow TradingHub’s (TH) rules filtering out inside bars.
It offers alerts for price in order block, liquidity sweep, break of structure (BOS), change of character (CHoCH), and inducement (IDM).
The TH model was chosen because it's programmatic allowing clear structure definitions that allow us to mark inducements (S/O to @albatherium for publishing the first TH market structure indicator).
TH’s Single Candle Order Block (SCOB) rules have also been helpful in refining order block definition, for example in the Transfer case. ICT fans will see when back testing this, that it moves the focus closer to the FVG.
In developing this indicator, we've tried to offer great aesthetic flexibility, to keep the chart uncluttered and to avoid exceeding Trading View’s limitations on boxes and lines. It's also configured to work reasonably well on both light and dark background charts:
We hope this indicator can serve as a teaching tool for ICT’s price action insights and SMC market structure concepts. For this, we've included optional labels for various order block types:
I = inside bar. The bars that follow the order block have been ignored – you will see the number of ignored bars shown after a hyphen. The idea is that inside bars fall in the shadow of a more important candle and can’t be relied on for defining a trade.
S = standard case. The order block candle takes liquidity from the previous candle and is followed immediately after by an FVG on the next candle. This differs technically from the ICT “last down-close/last up-close” order block concept. In practice, this choice has very little impact on ICT trading, because the ICT trader is entering on the FVG anyway.
T = transfer case. This is an order block that has been transferred from the candle that takes liquidity to the candle just prior to the FVG. When you back test this, you will see it is a high probability choice.
TZ = tweezer. This is an option you can turn off that fills a hole in TH teachings. It bypasses the requirement for an order block to take liquidity from the previous candle in the case of equal h/ls. The result is that you will find 2 candle order blocks with equal highs and lows (also known as tweezer tops/bottoms) show on your chart. You will note that every tweezer is a wick on a higher timeframe.
W = wick. this is a big wick candle that we call an order block without requiring an FVG. The presumption is that the displacement is contained within the wick itself on a lower timeframe.
* Asterisk denotes an extreme order block.
Finally, we trade with this indicator (using it together with our Daye Quarterly Theory ~ DQT free indicator, taking trades when price reaches an extreme FVG or order block during a Q2 manipulation).
We will continue developing it along with other indicators we have not yet published. So please boost if you like this and follow us for updates. Also please let us know what new features you would like to see.
Fair Value Gap ChartThe Fair Value Gap chart is a new charting method that displays fair value gap imbalances as Japanese candlesticks, allowing traders to quickly see the evolution of historical market imbalances.
The script is additionally able to compute an exponential moving average using the imbalances as input.
🔶 USAGE
The Fair Value Gap chart allows us to quickly display historical fair value gap imbalances. This also allows for filtering out potential noisy variations, showing more compact trends.
Most like other charting methods, we can draw trendlines/patterns from the displayed results, this can be helpful to potentially predict future imbalances locations.
Users can display an exponential moving average computed from the detected fvg's imbalances. Imbalances above the ema can be indicative of an uptrend, while imbalances under the ema are indicative of a downtrend.
Note that due to pinescript limitations a maximum of 500 lines can be displayed, as such displaying the EMA prevent candle wicks from being displayed.
🔶 DETAILS
🔹 Candle Structure
The Fair Value Gap Chart is constructed by keeping a record of all detected fair value gaps on the chart. Each fvg is displayed as a candlestick, with the imbalance range representing the body of the candle, and the range of the imbalance interval being used for the wicks.
🔹 EMA Source Input
The exponential moving average uses the imbalance range to get its input source, the extremity of the range used depends on whether the fvg is bullish or bearish.
When the fvg is bullish, the maximum of the imbalance range is used as ema input, else the minimum of the fvg imbalance is used.

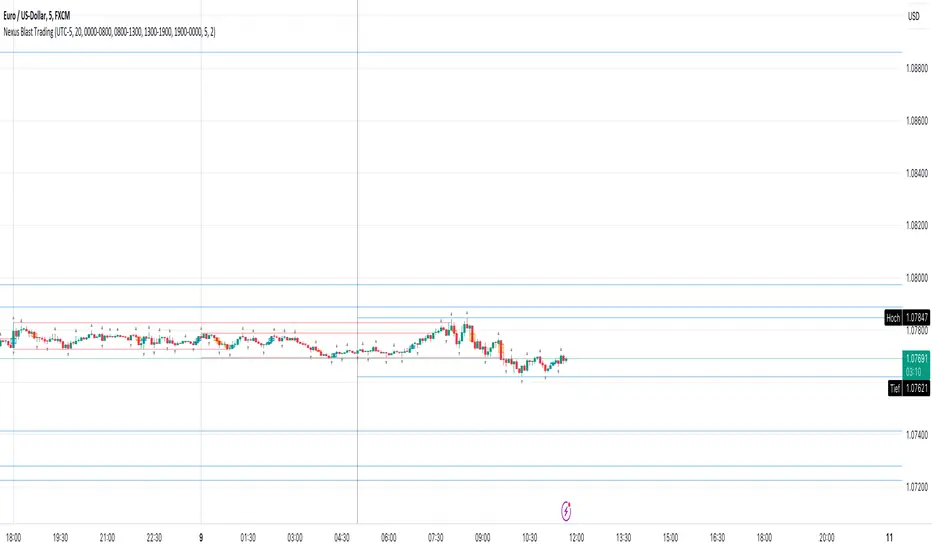
Nexus Blast Trading Strategy [Kaspricci]Nexus Blast Trading Strategy - Kaspricci
This indicator shows the different sessions during the day (London session, New York AM session, New York PM session and Asian session) by adding vertical lines and draws horizontal lines for the high and low during each session. Furthermore those lines turn red once the price has taken this high or low. Blue lines indicate liquidity not yet taken.
On top the indicator draws boxes of different color to indicate bullish and bearish Fair Value Gaps (FVG).
Happy to receive your feedback. Please leave a comment for bugs as well as ideas for improvement.
General Settings
Time Zone - used for marking sessions and end of day.
Sessions
Sessions - start and end time for each session based on set time zone
Number of Days back - for how many days in the past the startegy will draw strategy highs and lows. Theres is a maximum of 50 days defined.
FVG Settings
Threshold in Ticks - you can hide very small FVGs by increasing this threshold
FVG Colors - colors used for the bearish and bullish FVG box
This script is for educational purposes only! It is not meant to be a financial advice.
PS: The former strategy script was removed by TV, as it would violate several rules according to them.
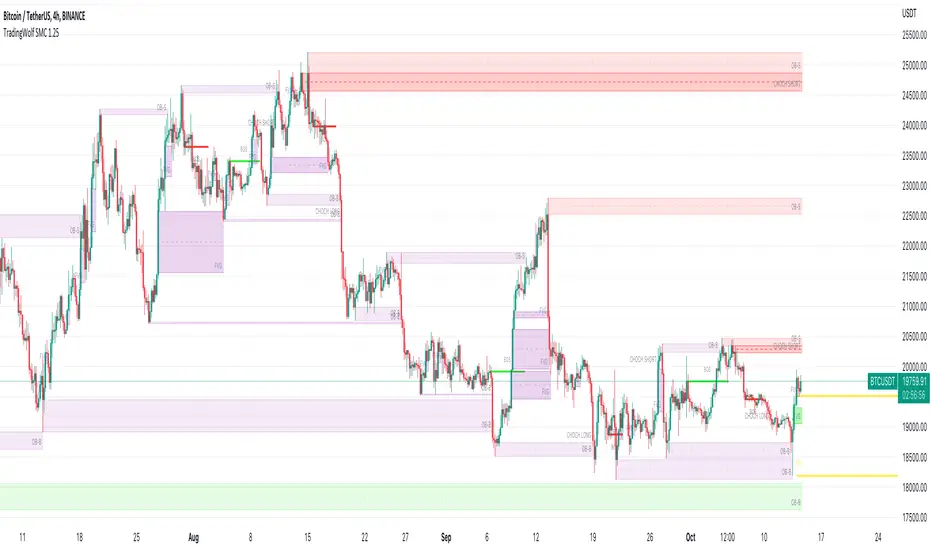
TradingWolf Smart Money
The TradingWolf Premium Smart Money Concept is a unique and enhanced selection of ideas designed to help give you an edge on the markets.
Within this one indicator you will have access to Fair Value Gap, Order Blocks, Break of Structure, Forecasting, Supply & Demand.
Below find each explanations on how to use each indicator
This script comes with the 'TradingWolf Premium' to get access, read the Author’s Instructions below.
There are extensive explanations on how to use this in our documentation on the website but we will give a simple overview here.
Order Blocks
There are several different ways people like to calculate order blocks, one of the ways we like is by using pivot points to identify levels of importance, from there we either highlight the highest/lowest closed candle or the wick. The user has the option to choose this in the settings.
As seen in the image above, you can see these levels are well respected and give people an opportunity to help where the market marker is placing their orders.
Fair Value Gaps
Fair value gaps can be a very useful concept in price action trading. They detect instances in which there are inefficiencies, or imbalances, in the market. In this case, we define imbalance as an instance in which buying and selling is not equal. This is often visualised as a large candle whose neighbouring candles’ wicks do not fully overlap the large candle. Below are a few examples of Fair Value Gap.
If price is in a downtrend and there is a fair value gap above, a trader might look to go short when that FVG fills. Inversely, if price is in an uptrend and there is a FVG below, a trader might look to go long when the FVG fills.
In this script we decided to highlight both types, one is simply marking up all technical FVGs which is the gap produced by the large candle, the other more commonly traded ones are market structure breaking ones.
These ones tend to be more respected so note they are highlighted in a separate colour to make them more visible.
If a FVG has been filled that box will dim away so it's not in your way.
ChoCh
‘Change of Character’ Hugely used by professional traders although they may not have heard of it called by this term. This is where price/market structure is trending in a certain direction but price starts to reverse.
This first happens when there is a break of structure, instead of another Lower High formed, price makes a Higher High like in the image above. This is where we highlight a break of structure or some people will just refer to this as the Choch line, once we have this we can look for an Order block / supply zone below to find an entry.
This is a hugely powerful tool dating back to one of the simplest and first concepts of trading where Market structure is King.
Peaks & Troughs
This tool helps you find potential reversal points in your support/resistance area, Simple candlestick patterns but incredibly powerful when used in confluence with our other tools.
ICT FVG indicator [Focused Trader]This is simple fair value gap indicator. It draws FVG (fair value gaps) as boxes. If FVG is partially filled, it is also displayed and smaller size FVG is drawn. If FVG is filled totally, it is deleted from chart. There is limitation of 500 drawing objects for indicators on Tradingview, so keep in mind that this indicator will display only last 500 FVGs.
For simplicity, there is only one setting, which is coloring of FVGs. It is perhaps a good idea to lower your opacity (to about 10%) and choose color of FVG according to your preferences and current theme (dark or white).
