Change in State of Delivery (CISD) [SB Instant]🧠 Modified by SB | Core Logic by LuxAlgo
🔗 Licensed under CC BY-NC-SA 4.0
Change in State of Delivery (CISD) is a concept rooted in observing shifts in order flow behavior, designed to detect the first signs of trend exhaustion and potential reversal. This model tracks when the current delivery (trend) structure — bullish or bearish — is violated by an opposing force, signaling a potential change in market intent.
In simple terms:
A Bullish CISD is triggered when sellers fail to maintain control, and buyers break above a delivery line.
A Bearish CISD is triggered when buyers fail, and sellers break below a delivery line.
This version uses real-time logic, triggering alerts immediately on break, rather than waiting for candle-close confirmation — giving faster, actionable signals to precision-driven traders.
⚙️ Core Features
Detection Modes
Classic: Traditional swing-based structural break detection
Liquidity Sweep: Logic incorporating wick sweeps (liquidity grabs)
Custom Parameters
Swing Length: Number of candles used to identify swing points
Minimum CISD Duration: Minimum length required for valid delivery phase
Maximum Swing Validity: How long the structure remains valid for potential breaks
Visual Options
Label and line styling options
Solid line = Initial break of delivery structure
Dashed line = Continuation break in the same trend direction
This allows you to visually differentiate a new reversal vs. a continuation of the existing trend.
🚨 Built-in Alerts
Bullish CISD Detected (Instant)
Bearish CISD Detected (Instant)
These alerts fire immediately when structure is broken, offering early confirmation for aggressive or reactive trade setups.
🔔 IMPORTANT:
If an alert triggers but the delivery line is not present, wait for the price to form the CISD label again and manually mark the price level using a horizontal ray. This ensures you are trading from a clearly defined structure.
🕒 Recommended Timeframes
✅ Use 30-Minute or 4-Hour charts to identify high-confidence CISD zones
🎯 Then drop to the 1-Minute or 5-Minute chart for precise entry execution
This top-down approach aligns higher timeframe narrative with lower timeframe entry triggers, increasing your edge in both timing and context.
🧠 How to Use CISD Effectively
Bullish Scenario:
Watch for breaks above bearish delivery structures, especially if confirmed with:
Fair Value Gaps (FVG)
The Strat 2-2 reversal
MSS (Market Structure Shift)
Bearish Scenario:
Look for breaks below bullish delivery setups in alignment with:
BOS (Break of Structure)
The Strat 3-1-2
Bearish liquidity sweeps
Key Tip:
Solid line = Initial CISD (new shift)
Dashed line = Continuation of current trend
This visual distinction helps you determine when a market is shifting vs. extending.
📎 Disclaimer
This tool is provided for educational purposes only and is not intended as financial advice. Always backtest, paper trade, and manage risk responsibly.
📚 Credits
Original CISD framework developed by LuxAlgo
Real-time execution logic, alert enhancements, and intraday utility designed by SB (SamB)
Tìm kiếm tập lệnh với "gaps"

Whale Psychology Insights
### 🧠 Whale Psychology Insights – Unmasking Smart Money Moves
**Understand the mind games behind every candle.**
This advanced indicator is designed to reveal the psychological warfare played by whales and market manipulators in the crypto space. Stop trading blind—start trading with the insights of the smart money.
#### 🔍 What It Does:
- **Liquidity Zone Detection** – Automatically identifies key **swing highs/lows** where stop hunts are likely.
- **Volume Spike Alerts** – Spot **suspicious activity** where big players enter or exit.
- **Order Block Zones** – Highlights **bullish/bearish engulfing patterns** used by institutions.
- **Fair Value Gaps (FVG)** – Marks price inefficiencies where price may return.
- **Fakeout Detection** – Finds **manipulative wicks** designed to trap retail traders.
#### 💡 Use Cases:
- Avoid getting stopped out by **liquidity grabs**
- Enter after the **whales have made their move**
- Identify **high-probability reversal zones**
- Trade **with smart money**, not against it
Perfect for scalpers, intraday traders, and swing traders looking to understand *why* price moves—not just *where*.
> 🧠 **Trade the psychology, not just the chart.**

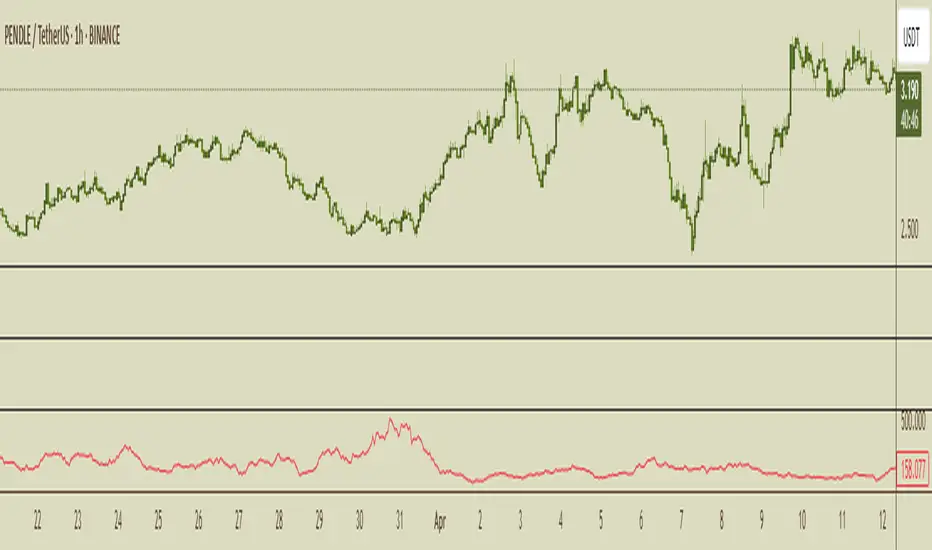
Amihud Liquidity RatioCalculates liquidity as a sort of moving average over time
The Amihud Illiquidity Ratio (ILLIQ) measures the price impact of trading volume. It's calculated as the absolute daily return divided by the daily dollar volume:
𝐼𝐿𝐿𝐼𝑄ₜ = |𝑅ₜ| / 𝑉𝑂𝐿𝐷ₜ
Where:
|𝑅ₜ| is the absolute value on return day t
𝑉𝑂𝐿𝐷ₜ is the dollar trading volume on day t
Here's how you can incorporate this indicator into your analysis:
1. Identifying Liquidity Regimes:
High Liquidity (Low Indicator Values): When the indicator is consistently low, it suggests a market or asset where it's generally easier to enter and exit positions without significant slippage. This might be a more favorable environment for strategies that rely on tight spreads and efficient order execution.
Low Liquidity (High Indicator Values): When the indicator is consistently high or spiking, it signals periods of lower liquidity. This can lead to:
Increased Volatility: Fewer participants and larger bid-ask spreads can amplify price movements.
Higher Slippage: Executing large orders might result in getting a worse price than expected.
Gap Risk: Significant price gaps can occur between trading sessions due to a lack of continuous trading interest.
---------------------------------------------------------------------------------------------------------------------
2. Confirming Trends and Breakouts:
Trend Confirmation:
Uptrend with Increasing Liquidity (Falling Amihud): A healthy uptrend often sees increasing participation and ease of trading. A falling Amihud during an uptrend can provide confidence in the trend's sustainability.
Uptrend with Decreasing Liquidity (Rising Amihud): An uptrend accompanied by rising Amihud might be less stable. It could suggest that the price increase is driven by fewer participants and might be more prone to reversals.
The same logic applies to downtrends, but in reverse.
---------------------------------------------------------------------------------------------------------------------
Breakout Confirmation:
Breakout with Increasing Liquidity (Falling Amihud): A breakout accompanied by increasing liquidity (falling Amihud) can suggest strong conviction and a higher probability of the breakout being sustained.
Breakout with Decreasing Liquidity (Rising Amihud): A breakout on low liquidity might be more suspect and could be a "fakeout" if there isn't enough sustained buying or selling pressure.
---------------------------------------------------------------------------------------------------------------------
3. Identifying Potential Reversal Points:
Liquidity Exhaustion: Sometimes, a prolonged period of low liquidity (high Amihud) might precede a reversal. The lack of active trading interest at those levels could make the price more susceptible to a shift in sentiment.
Liquidity Surges: A sudden spike in liquidity (a sharp drop in Amihud) after a period of low liquidity could indicate renewed interest and potentially the start of a new trend or a reversal of the previous one.
-----------------------------------------------THANK YOU----------------------------------------------------------------------------------------------------------------------------------------------------------------------------------------------------------------------------------<3-----------------------------------------------
US30 Smart Money 5M/4H Strategy🧠 How It Works
✅ 1. 4H Trend Bias Detection
Uses the 4-hour chart (internally) to determine if the market is in an uptrend or downtrend.
Background turns green for bullish trend, red for bearish trend.
This helps filter trades — only take longs during uptrend, shorts during downtrend.
✅ 2. Liquidity Sweeps (Stop Hunts) on 5M
Highlights candles that break previous highs/lows and then reverse (typical of institutional stop raids).
Draws a shaded red box above sweep-high candles and green box under sweep-lows.
These indicate key reversal zones.
✅ 3. Order Block Zones
Detects bullish/bearish engulfing patterns after liquidity sweeps.
Draws a supply or demand zone box extending forward.
These zones show where institutions likely placed large orders.
✅ 4. FVG Midpoint from 30-Min Chart
Detects Fair Value Gaps (imbalances) on the 30-minute chart.
Plots a line at the midpoint of the gap (EQ level), which is often revisited for entries or rejections.
✅ 5. Buy/Sell Signals (Non-Repainting)
Buy = 4H uptrend + 5M liquidity sweep low + bullish engulfing candle.
Sell = 4H downtrend + 5M liquidity sweep high + bearish engulfing.
Prints green “BUY” or red “SELL” label on the chart — these do not repaint.
📈 How to Use It
Wait for trend bias — only take trades in the direction of the 4H trend.
Watch for liquidity sweep boxes — these hint a stop hunt just occurred.
Look for a signal label (BUY/SELL) — confirms entry criteria.
Use FVG EQ lines & Order Block zones as confluence or targets.
Take trades after NY open (9:30 AM EST) for best momentum.

Gap Day Stats TableDescription:
This Pine Script helps you analyze gap up and gap down days using a user-defined gap percentage threshold. It generates a real-time statistics table that tracks:
📈 Number of Gap Up Days
🔻 How many of those days closed lower (Open > Close)
🧮 Total points lost on such gap up days (Open - Close)
📉 Number of Gap Down Days
🔺 How many of those days closed higher (Close > Open)
🧮 Total points gained on such gap down days (Close - Open)
🔧 Customization:
Gap threshold is adjustable via input
Automatically updates stats daily
Ideal for spotting behavioral edge in gaps
This tool is useful for traders building gap trading systems, mean reversion models, or studying post-gap behavior in equities and indices.

Gap Days Identifier📌 Gap Days Identifier – Pine Script
This script identifies Gap Up and Gap Down days based on user-defined percentage thresholds. It is designed for daily charts and helps traders spot significant opening gaps relative to the previous day’s close.
🔍 Key Features:
Customizable Thresholds: Input your desired % gap for both Gap Up and Gap Down detection.
Visual Markers: Displays label arrows with actual % gap on the chart (green for Gap Up, red for Gap Down).
Live Statistics Table: Shows total count of Gap Up and Gap Down days based on your filters.
Clean Overlay: Designed to be non-intrusive and easy to interpret for any instrument.
✅ Use Case:
Perfect for traders who track gap-based breakout strategies, news/event impact, or want to filter days with strong overnight sentiment shifts.

Math by Thomas FVG📌 Math by Thomas FVG – Fair Value Gap Detector
Overview:
The Math by Thomas FVG indicator automatically detects Fair Value Gaps (FVGs) using a three-candle logic. FVGs represent price inefficiencies where the first candle’s high/low does not overlap with the third candle’s low/high, creating a gap. This tool helps traders identify potential reversal or continuation zones, providing valuable insights into market structure and price action.
🔹 How It Works:
Bullish FVG:
Occurs when the current candle’s low is above the high of the candle two bars ago.
A green-shaded box marks the bullish FVG, highlighting a potential support zone.
Bearish FVG:
Occurs when the current candle’s high is below the low of the candle two bars ago.
A red-shaded box marks the bearish FVG, indicating a potential resistance zone.
Gap Filling Logic:
The indicator automatically removes FVGs once they are filled by price action, keeping the chart clean and relevant.
Bullish FVGs are removed when close ≤ the box's top.
Bearish FVGs are removed when close ≥ the box's bottom.
⚙️ Customization Options:
Bullish FVG Color: Choose the color for bullish FVGs.
Bearish FVG Color: Choose the color for bearish FVGs.
Max Box Count: The indicator dynamically manages up to 50 FVG boxes, ensuring optimal chart performance.
✅ Use Cases:
Identify price inefficiencies for potential entries and exits.
Combine with Order Blocks, support/resistance, or volume analysis for confirmation.
Useful for Smart Money Concept (SMC) and price action traders.
🔥 Enhance your trading accuracy with the Math by Thomas FVG indicator and gain insights into price inefficiencies! 🚀

Math by Thomas Order Blocks🔥 Description:
🚀 Math by Thomas Order Blocks is a precision tool for Smart Money Concept (SMC) and price action traders, designed to automatically detect Bullish and Bearish Order Blocks (OBs). It highlights key institutional trading zones where large orders are placed, helping you identify potential reversal and continuation areas.
⚙️ Key Features:
✅ Automatic Order Block Detection:
Detects Bearish OBs when price sharply reverses after a significant bullish move.
Identifies Bullish OBs following a sharp reversal from a bearish push.
✅ Dynamic Sensitivity & Volume Filter:
Sensitivity Control: Customize OB detection precision.
Minimum Volume Filter: Ensures OBs form only on significant volume spikes.
✅ Flexible OB Mitigation:
Choose between "Close" or "Wick" mitigation for OB invalidation.
Mitigated OBs are automatically removed from the chart.
✅ Adaptive Swing & Price Change Detection:
Adjusts OB detection logic based on timeframe for flexibility.
Uses adaptive rate of change (ROC) calculations to spot momentum shifts.
✅ Visual Customization:
OBs are displayed as shaded boxes with configurable background and border colors.
Bullish OBs = Green (support zones).
Bearish OBs = Red (resistance zones).
✅ Alerts for OB Touch:
Get real-time alerts when price touches a Bullish or Bearish OB.
Helps you catch potential reversal points without constant chart monitoring.
📊 How It Works:
Bullish OB Logic:
Detected when price crosses over a positive momentum threshold (ROC) with high volume.
Plots a green OB box from the low of the swing candle.
Bearish OB Logic:
Identified when price crosses under a negative momentum threshold with high volume.
Plots a red OB box from the high of the swing candle.
Mitigation Rules:
OBs are removed once invalidated by price action based on your chosen mitigation type (Close or Wick).
📈 Usage Tips:
Use Bullish OBs as potential support areas for buy entries.
Treat Bearish OBs as resistance zones for sell setups.
Combine with Fair Value Gaps, volume profile, and RSI for confluence.
Adjust sensitivity and volume filters to fine-tune OB detection.
✅ Chart Example:
The script displays:
Bullish OBs in green, marking potential support zones.
Bearish OBs in red, indicating resistance zones.
Real-time alerts when price touches OBs.
🔥 Why Use This Indicator?
Designed for intraday and swing traders aiming to identify institutional trading zones.
Helps you spot reversal and continuation setups with precision.
Ideal for Smart Money Concept (SMC), price action, and order flow traders.

Volatility Layered Supertrend [NLR]We’ve all used Supertrend, but do you know where to actually enter a trade? Volatility Layered Supertrend (VLS) is here to solve that! This advanced trend-following indicator builds on the classic Supertrend by not only identifying trends and their strength but also guiding you to the best trade entry points. VLS divides the main long-term trend into “Strong” and “Weak” Zones, with a clear “Trade Entry Zone” to help you time your trades with precision. With layered trends, dynamic profit targets, and volatility-adaptive bands, VLS delivers actionable signals for any market.
Why I Created VLS Over a Plain Supertrend
I built VLS to address the gaps in traditional Supertrend usage and make trade entries clearer:
Single-Line Supertrend Issues: The default Supertrend sets stop-loss levels that are too wide, making it impractical for most traders to use effectively.
Unclear Entry Points: Standard Supertrend doesn’t tell you where to enter a trade, often leaving you guessing or entering too early or late.
Multi-Line Supertrend Enhancement: Many traders use short, medium, and long Supertrends, which is helpful but can lack focus. In VLS, I include Short, Medium, and Long trends (using multipliers 1 to 3), and add multipliers 4 and 5 to track extra long-term trends—helping to avoid fakeouts that sometimes occur with multiplier 3.
My Solution: I focused on the main long-term Supertrend and split it into “Weak Zone” and “Strength Zone” to show the trend’s reliability. I also defined a “Trade Entry Zone” (starting from the Mid Point, with the first layer’s background hidden for clarity) to guide you on where to enter trades. The zones include Short, Medium, and Long Trend layers for precise entries, exits, and stop-losses.
Practical Trading: This approach provides realistic stop-loss levels, clear entry points, and a “Profit Target” line that aligns with your risk tolerance, while filtering out false signals with longer-term trends.
Key Features
Layered Trend Zones: Short, Medium, Long, and Extra Long Trend layers (up to multipliers 4 and 5) for timing entries and exits.
Strong & Weak Zones: See when the trend is reliable (Strength Zone) or needs caution (Weak Zone).
Trade Entry Zone: A dedicated zone starting from the Mid Point (first layer’s background hidden) to show the best entry points.
Dynamic Profit Targets: A “Profit Target” line that adjusts with the trend for clear goals.
Volatility-Adaptive: Uses ATR to adapt to market conditions, ensuring reliable signals.
Color-Coded: Green for uptrends, red for downtrends—simple and clear.
How It Works
VLS enhances the main long-term Supertrend by dividing it into two zones:
Weak Zone: Indicates a less reliable trend—use tighter stop-losses or wait for the price to reach the Trade Entry Zone.
Strength Zone: Signals a strong trend—ideal for entries with wider stop-losses for bigger moves.
The “Trade Entry Zone” starts at the Mid Point (last layer’s background hidden for clarity), showing you the best area to enter trades. Each zone includes Short, Medium, Long, and Extra Long Trend sublevels (up to multipliers 4 and 5) for precise trade timing and to filter out fakeouts. The “Profit Target” updates dynamically based on trend direction and volatility, giving you a clear goal.
How to Use
Spot the Trend: Green bands = buy, red bands = sell.
Check Strength: Price in Strength Zone? Trend’s reliable—trade confidently. In Weak Zone? Use tighter stops or wait.
Enter Trades: Use the “Trade Entry Zone” (from the Mid Point upward) for the best entry points.
Use Sublevels: Short, Medium, Long, and Extra Long layers in each zone help fine-tune entries and exits.
Set Targets: Follow the Profit Target line for goals—it updates automatically.
Combine Tools: Pair with RSI, MACD, or support/resistance for added confirmation.
Settings
ATR Length: Adjust the ATR period (default 10) to change sensitivity.
Up/Down Colors: Customize colors—green for up, red for down, by default.

ICT Order Blocks v2 (Debug)Josh has a very large PP xD
Understanding Order Blocks (OBs) - The ICT Perspective
This document delves into the concept of Order Blocks (OBs) from the perspective of the ICT methodology. It outlines what OBs are, their significance in trading, and how the "ICT Order Blocks v2 (Refined)" indicator functions to identify and visualize these critical price levels. By understanding OBs, traders can better navigate market movements and make informed decisions based on institutional trading behavior.
What is an Order Block (OB)?
Within ICT methodology, an Order Block represents a specific price candle where significant buying or selling interest from institutions (Smart Money) is believed to have occurred. They are potential areas where price might return and react.
Bullish Order Block: Typically the last down-closing candle before a strong, impulsive upward move (displacement). It suggests institutions may have absorbed selling pressure and initiated long positions here.
Bearish Order Block: Typically the last up-closing candle before a strong, impulsive downward move (displacement). It suggests institutions may have distributed long positions or initiated short positions here.
Why are OBs Significant (ICT View)?
Institutional Footprint: They mark potential zones of large order execution.
Support/Resistance: Unmitigated OBs can act as sensitive price levels where reactions are expected. Bullish OBs may provide support; Bearish OBs may provide resistance.
Origin of Moves: They often mark the origin point of significant price swings.
Liquidity Engineering: Institutions might drive price back to OBs to mitigate earlier positions or to engineer liquidity before continuing a move.
Common Refinements
ICT often emphasizes higher probability OBs that are associated with:
Displacement: The move away from the OB is sharp and decisive.
Fair Value Gaps (FVGs): An FVG forming immediately after the OB strengthens its validity.
OB Mitigation: This refers to price returning to the level of the Order Block after its formation. Price might react at the edge (proximal line) or the 50% level (mean threshold) of the OB. An OB is often considered fully mitigated or invalidated if price trades decisively through its entire range, especially with a candle body closing beyond it.
How the "ICT Order Blocks v2 (Refined)" Indicator Works
This indicator automates the detection and visualization of the most recent unmitigated Order Block of each type (Bullish/Bearish), incorporating optional filters.
Detection:
It looks at the relationship between the candle two bars ago ( ), the previous candle ( ), and potentially the current candle ( ).
Bullish OB: Identifies if candle was a down-close (close < open ) AND candle broke above the high of candle (high > high ).
Bearish OB: Identifies if candle was an up-close (close > open ) AND candle broke below the low of candle (low < low ).
Accuracy Filters (Optional Inputs):
These filters help identify potentially higher-probability OBs:
Require Fair Value Gap (FVG)?: If enabled, the indicator checks if an FVG formed immediately after the OB candle ( ). Specifically, it looks for a gap between candle and candle (low > high for Bullish OB confirmation, high < low for Bearish).
Require Strong Close Breakout?: If enabled, it requires the breakout candle ( ) to close beyond the range of the OB candle ( ). (close > high for Bullish, close < low for Bearish). This suggests stronger confirmation.
Storing the Most Recent OB:
When an OB is detected and passes any enabled filters, its details (high, low, formation bar index) are stored. Crucially, this indicator only tracks the single most recent valid unmitigated OB of each type (one Bullish, one Bearish) using var variables. If a newer valid OB forms, it replaces the previously stored one.
Drawing Boxes:
If a valid Bullish OB is being tracked (and Show Bullish OBs is enabled), it draws a box (box.new) using the high and low of the identified OB candle ( ). The same process applies to Bearish OBs (Show Bearish OBs enabled). The boxes automatically extend to the right (extend.right) and their right edge is updated on each new bar (box.set_right) until they are mitigated. Labels ("Bull OB" / "Bear OB") are displayed inside the boxes.
Mitigation & Box Deletion:
The indicator checks if the current closing price (close ) has moved entirely beyond the range of the tracked OB.
Mitigation Rule Used: A Bullish OB is considered mitigated if close < bull_ob_low. A Bearish OB is considered mitigated if close > bear_ob_high. Once an OB is marked as mitigated, the indicator stops tracking it and its corresponding box is automatically deleted (box.delete) from the chart.
This indicator provides a dynamic visualization of the most recent, potentially significant Order Blocks that meet the specified criteria, helping traders identify key areas of interest based on ICT principles.

ICT FVG & Swing Detector Basic by Trader RiazICT FVG & Swing Detector Basic by Trader Riaz
Unlock Precision Trading with the Ultimate Fair Value Gap (FVG) and Swing Detection Tool!
Developed by Trader Riaz , the ICT FVG and Swing Detector Basic is a powerful Pine Script indicator designed to help traders identify key market structures with ease. Whether you're a day trader, swing trader, or scalper, this indicator provides actionable insights by detecting Bullish and Bearish Fair Value Gaps (FVGs) and Swing Highs/Lows on any timeframe. Perfect for trading forex, stocks, crypto, and more on TradingView!
Key Features:
1: Bullish and Bearish FVG Detection
- Automatically identifies Bullish FVGs (highlighted in green) and Bearish FVGs (highlighted in red) to spot potential reversal or continuation zones.
- Displays FVGs as shaded boxes with a dashed midline at 70% opacity, making it easy to see the midpoint of the gap for precise entries and exits.
- Labels are placed inside the FVG boxes at the extreme right for clear visibility.
2: Customizable FVG Display
- Control the number of Bullish and Bearish FVGs displayed on the chart with user-defined inputs (fvg_bull_count and fvg_bear_count).
- Toggle the visibility of Bullish and Bearish FVGs with simple checkboxes (show_bull_fvg and show_bear_fvg) to declutter your chart.
3: Swing High and Swing Low Detection
- Detects Swing Highs (blue lines) and Swing Lows (red lines) to identify key market turning points.
- Labels are positioned at the extreme right edge of the lines for better readability and alignment.
- Customize the number of Swing Highs and Lows displayed (swing_high_count and swing_low_count) to focus on the most recent market structures.
4: Fully Customizable Display
- Toggle visibility for Swing Highs and Lows (show_swing_high and show_swing_low) to suit your trading style.
- Adjust the colors of Swing High and Low lines (swing_high_color and swing_low_color) to match your chart preferences.
5: Clean and Efficient Design
- Built with Pine Script v6 for optimal performance on TradingView.
- Automatically removes older FVGs and Swing points when the user-defined count is exceeded, keeping your chart clean and focused.
- Labels are strategically placed to avoid clutter while providing clear information.
Why Use This Indicator?
Precision Trading: Identify high-probability setups with FVGs and Swing points, commonly used in Smart Money Concepts (SMC) and Institutional Trading strategies.
User-Friendly: Easy-to-use inputs allow traders of all levels to customize the indicator to their needs.
Versatile: Works on any market (Forex, Stocks, Crypto, Commodities) and timeframe (1M, 5M, 1H, 4H, Daily, etc.).
Developed by Trader Riaz: Backed by the expertise of Trader Riaz, a seasoned trader dedicated to creating tools that empower the TradingView community.
How to Use:
- Add the Custom FVG and Swing Detector to your chart on TradingView.
- Adjust the input settings to control the number of FVGs and Swing points displayed.
- Toggle visibility for Bullish/Bearish FVGs and Swing Highs/Lows as needed.
- Use the identified FVGs and Swing points to plan your trades, set stop-losses, and target key levels.
Ideal For:
- Traders using Smart Money Concepts (SMC), Price Action, or Market Structure strategies.
- Those looking to identify liquidity grabs, imbalances, and trend reversals.
- Beginners and advanced traders seeking a reliable tool to enhance their technical analysis.
Happy trading!

Wyckoff Range Detector [Beta] + Smart Money ElementsThis indicator detects the key phases of the Wyckoff market structure and integrates smart money elements, such as Order Blocks (OB), Fair Value Gaps (FVG), and Breaker Blocks. It also helps identify potential reversal zones (LPS, UTAD, Spring), breakout opportunities, and provides automatic Risk-Reward (R:R) calculations.
Key Features:
Wyckoff Phases Detection:
Automatically detects key phases of Wyckoff's market structure:
B (Range) – The initial range of accumulation.
C (Spring Phase) – Accumulation phase with a potential breakout.
C (UTAD Phase) – Upthrust After Distribution, indicating a potential reversal.
D (LPS Phase) – Last Point of Support, signaling accumulation before a breakout.
E (Breakout) – Phase marking breakout from range.
Re-Accumulation – Possible continuation in the range after a breakout.
Re-Distribution – Possible breakdown of a distribution phase.
Smart Money Elements:
Order Blocks (OB): Identifies Bullish and Bearish OBs to anticipate market entries.
Fair Value Gap (FVG): Highlights imbalance areas where price is likely to return.
Breaker Blocks: Marks areas where the price has previously broken a structure, indicating strong supply/demand zones.
Automatic Risk-Reward Calculation:
Smart RR: Automatically calculates Risk-Reward (R:R) ratios from LPS phases and Order Blocks. It draws lines to indicate target and stop levels with green for the target and red for the stop.
Visual representation of the entry signal with target and stop levels displayed.
Alerts:
Set alerts for phase changes, breakout, re-accumulation, or re-distribution to stay updated on the market’s movements.
Visual Tools:
Labels are used to indicate key zones such as AR, SC, LPS, and Spring Zones.
Draw boxes for the Spring and LPS phases to highlight areas where price action is likely to reverse.
Lines to represent potential breakouts, with customizable risk-reward indicators.
How to Use:
Apply the Indicator on any chart.
Identify Wyckoff phases to understand market trends.
Monitor Smart Money Elements (OB, FVG, Breaker) for entry and exit points.
Use automatic Risk-Reward levels for managing trades.
Set alerts for various Wyckoff phases and smart money signals to stay updated.

Quantum Motion Oscillator-QMO (TechnoBlooms)Quantum Motion Oscillator (QMO) is a momentum indicator designed for traders who demand precision. Combining multi-timeframe weighted linear regression with EMA crossovers, QMO offers a dynamic view of market momentum, helping traders anticipate trend shifts with greater accuracy.
This oscillator is inspired by quantum mechanics and wave theory, where market movement is seen as a series of probabilistic waves rather than rigid structures.
The histogram is plotted in proportion to the price movement of the candlesticks.
KEY FEATURES
1. Multi-Timeframe Histogram - Integrates 1 to 5 weighted linear regression averages, reducing lag while maintaining accuracy.
2. EMA Crossover Signal - Uses a Short and Long EMA to confirm trend shifts with minimal noise.
3. Adaptive Trend Analysis - Self-adjusting mechanics make QMO effective in both ranging and trending markets.
4. Scalable for Different Trading Styles - Works seamlessly for scalping, intraday, swing and position trading.
ADVANCED PROFESSIONAL INSIGHTS
1. Wave Dynamics and Market Flow - Inspired by wave mechanics, QMO reflects the energy accumulation and dissipation in price movements.
Expanding histogram waves = Strong momentum surge
Contracting waves = Momentum weakening, potential reversal zone.
2. Liquidity and Order Flow Applications - QMO works well alongside liquidity concepts and smart money techniques:
Combine with Fair Value Gaps & Order Blocks -> Enter when QMO signals align with liquidity zones.
Avoid False Moves - If price sweeps liquidity, but QMO momentum diverges, it is a sign of potential smart money manipulation.

Nef33 Forex & Crypto Trading Signals PRO
1. Understanding the Indicator's Context
The indicator generates signals based on confluence (trend, volume, key zones, etc.), but it does not include predefined SL or TP levels. To establish them, we must:
Use dynamic or static support/resistance levels already present in the script.
Incorporate volatility (such as ATR) to adjust the levels based on market conditions.
Define a risk/reward ratio (e.g., 1:2).
2. Options for Determining SL and TP
Below, I provide several ideas based on the tools available in the script:
Stop Loss (SL)
The SL should protect you from adverse movements. You can base it on:
ATR (Volatility): Use the smoothed ATR (atr_smooth) multiplied by a factor (e.g., 1.5 or 2) to set a dynamic SL.
Buy: SL = Entry Price - (atr_smooth * atr_mult).
Sell: SL = Entry Price + (atr_smooth * atr_mult).
Key Zones: Place the SL below a support (for buys) or above a resistance (for sells), using Order Blocks, Fair Value Gaps, or Liquidity Zones.
Buy: SL below the nearest ob_lows or fvg_lows.
Sell: SL above the nearest ob_highs or fvg_highs.
VWAP: Use the daily VWAP (vwap_day) as a critical level.
Buy: SL below vwap_day.
Sell: SL above vwap_day.
Take Profit (TP)
The TP should maximize profits. You can base it on:
Risk/Reward Ratio: Multiply the SL distance by a factor (e.g., 2 or 3).
Buy: TP = Entry Price + (SL Distance * 2).
Sell: TP = Entry Price - (SL Distance * 2).
Key Zones: Target the next resistance (for buys) or support (for sells).
Buy: TP at the next ob_highs, fvg_highs, or liq_zone_high.
Sell: TP at the next ob_lows, fvg_lows, or liq_zone_low.
Ichimoku: Use the cloud levels (Senkou Span A/B) as targets.
Buy: TP at senkou_span_a or senkou_span_b (whichever is higher).
Sell: TP at senkou_span_a or senkou_span_b (whichever is lower).
3. Practical Implementation
Since the script does not automatically draw SL/TP, you can:
Calculate them manually: Observe the chart and use the levels mentioned.
Modify the code: Add SL/TP as labels (label.new) at the moment of the signal.
Here’s an example of how to modify the code to display SL and TP based on ATR with a 1:2 risk/reward ratio:
Modified Code (Signals Section)
Find the lines where the signals (trade_buy and trade_sell) are generated and add the following:
pinescript
// Calculate SL and TP based on ATR
atr_sl_mult = 1.5 // Multiplier for SL
atr_tp_mult = 3.0 // Multiplier for TP (1:2 ratio)
sl_distance = atr_smooth * atr_sl_mult
tp_distance = atr_smooth * atr_tp_mult
if trade_buy
entry_price = close
sl_price = entry_price - sl_distance
tp_price = entry_price + tp_distance
label.new(bar_index, low, "Buy: " + str.tostring(math.round(bull_conditions, 1)), color=color.green, textcolor=color.white, style=label.style_label_up, size=size.tiny)
label.new(bar_index, sl_price, "SL: " + str.tostring(math.round(sl_price, 2)), color=color.red, textcolor=color.white, style=label.style_label_down, size=size.tiny)
label.new(bar_index, tp_price, "TP: " + str.tostring(math.round(tp_price, 2)), color=color.blue, textcolor=color.white, style=label.style_label_up, size=size.tiny)
if trade_sell
entry_price = close
sl_price = entry_price + sl_distance
tp_price = entry_price - tp_distance
label.new(bar_index, high, "Sell: " + str.tostring(math.round(bear_conditions, 1)), color=color.red, textcolor=color.white, style=label.style_label_down, size=size.tiny)
label.new(bar_index, sl_price, "SL: " + str.tostring(math.round(sl_price, 2)), color=color.red, textcolor=color.white, style=label.style_label_up, size=size.tiny)
label.new(bar_index, tp_price, "TP: " + str.tostring(math.round(tp_price, 2)), color=color.blue, textcolor=color.white, style=label.style_label_down, size=size.tiny)
Code Explanation
SL: Calculated by subtracting/adding sl_distance to the entry price (close) depending on whether it’s a buy or sell.
TP: Calculated with a double distance (tp_distance) for a 1:2 risk/reward ratio.
Visualization: Labels are added to the chart to display SL (red) and TP (blue).
4. Practical Strategy Without Modifying the Code
If you don’t want to modify the script, follow these steps manually:
Entry: Take the trade_buy or trade_sell signal.
SL: Check the smoothed ATR (atr_smooth) on the chart or calculate a fixed level (e.g., 1.5 times the ATR). Also, review nearby key zones (OB, FVG, VWAP).
TP: Define a target based on the next key zone or multiply the SL distance by 2 or 3.
Example:
Buy at 100, ATR = 2.
SL = 100 - (2 * 1.5) = 97.
TP = 100 + (2 * 3) = 106.
5. Recommendations
Test in Demo: Apply this logic in a demo account to adjust the multipliers (atr_sl_mult, atr_tp_mult) based on the market (forex or crypto).
Combine with Zones: If the ATR-based SL is too wide, use the nearest OB or FVG as a reference.
Risk/Reward Ratio: Adjust the TP based on your tolerance (1:1, 1:2, 1:3)

Air Gap MTF with alert settingsWhat it shows:
This indicator will show a horizontal line at a price where each EMAs are on on different time frames, which will remove the effort of having to flick through different time frames or look at different chart.
The lines itself will move in real time as price moves and therefore as the EMA values changes so no need to manually adjustment the lines.
How to use it:
The price gap between each of the lines are known as "air gaps", which are essentially zones price can move with less resistance. Therefore bigger the airgap there is more likely more movement in price.
In other words, where lines are can be a resistance (or support) and can expect price stagnation or rejection.
On the chart it is clear to see lines are acting as resistances/supports.
Key settings:
The time frame are fixed to: 30min, 1hr and 4hr. This cannot be changed as of now.
EMA values for each time frame are user changeable in the settings, and up to 4 different values can be chosen for each time frame. Default is 5,12,34 and 50 for each timeframe.
Line colour, thickness and style can be user adjusted. Start point for where line will be drawn can be changed in the settings, either: start of day, user defined start or across the chart. In case of user defined scenario user can input a number that specifies a offset from current candle.
Label colour, font, alignment, text size and text itself can be user adjusted in the settings. Price can be also displayed if user chooses to do so. Position of label (offset from current candle) is user specified and can be adjusted by the user.
Both the lines and labels can be turned off (both and individually), for each lines.
Alert Settings:
Manually, user can set alerts for when price crosses a specific line.
This can be done by:
right click on any of line
choose first option (add alert on...)
On the second option under condition, use the dropdown menu to choose the desired EMA/timeframe to set alert for.
Hit "create" at bottom right of option
----------------------------------------------------------------------
If anything is not clear please let me know!

ICT Gold Trading ToolFirst, I recall the original code had elements like Break of Structure, Fair Value Gaps, Premium/Discount Zones, Liquidity Pools, and Buy/Sell signals. The user had previous feedback pointing out issues in the code, like incorrect timeframe usage for BOS and FVG inaccuracies. They also suggested improvements, which were incorporated into a revised version.
So, the brief note should highlight the main components of the tool without getting too technical. The user probably wants this for a quick overview, maybe to share with others or for their own reference. They might be a trader familiar with ICT concepts, so using terms like BOS or FVG is okay without explaining each one.
I need to mention that the tool combines multiple ICT strategies into one indicator. It uses higher timeframes for BOS, which is important for structure. FVG detection was corrected in the revised code, so I should note that it identifies 3-candle patterns. The zones and liquidity pools help in identifying market extremes and areas where price might reverse. The buy/sell signals are based on a combination of BOS and zones, which adds confluence.
Also, the user might appreciate knowing that the tool is customizable with inputs for periods, making it adaptable to different trading styles. Emphasizing that it's for visual assistance and not standalone signals is crucial to remind users to use additional analysis.

Range%This indicator displays the range of each candle i.e. High minus Low as a percentage of the previous closing price. It does not account for gaps, making it particularly useful for intraday trading. By tracking the volatility cycle of candles, this indicator helps identify periods of increased or decreased market volatility, allowing traders to pinpoint the best days to execute trades.
If the Range% is below low line candles will turn White and If Range% is above the High Line Candles will turn Red.

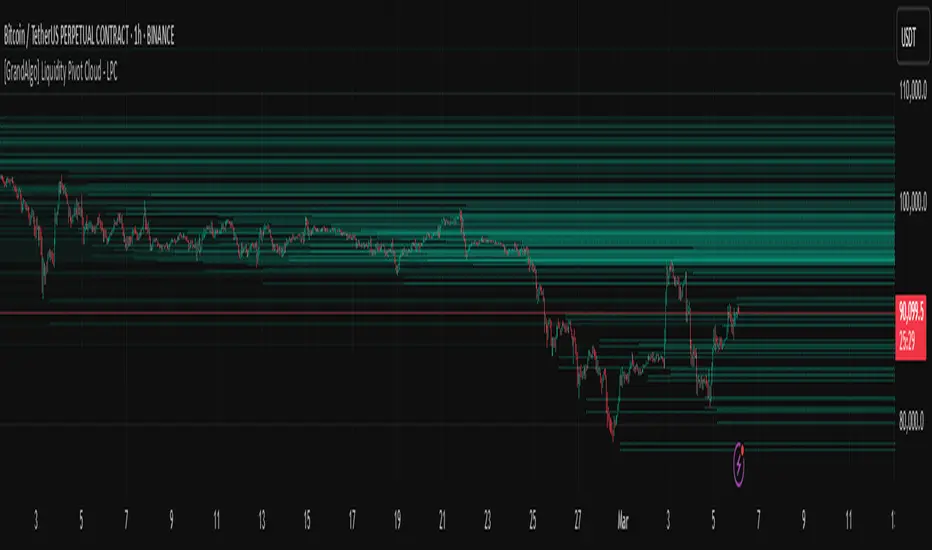
[GrandAlgo] Liquidity Pivot Cloud - LPCLiquidity Pivot Cloud (LPC) is a visualization tool that extends all pivot levels to the right, creating a structured liquidity map across the chart. Instead of treating pivot points as static levels, LPC transforms them into a dynamic cloud, highlighting key areas where price has historically reacted.
Key Features:
Extended Pivot Levels – Automatically stretches all pivot highs and lows, forming a continuous liquidity zone.
Clear Structure – Provides an organized view of price action, making it easy to identify reaction zones.
Dynamic Liquidity Map – Helps traders spot potential liquidity sweeps and areas of price absorption.
How to Use:
Identify Liquidity Zones – Areas with multiple overlapping pivots signal strong liquidity pools.
Look for Reactions – Price often consolidates, wicks, or reverses around extended pivot clouds.
Combine with Confluence – Use alongside Fair Value Gaps, Institutional Price Blocks, or Market Structure shifts for higher probability setups.
LPC aligns with smart money concepts by revealing key liquidity areas where stop hunts, liquidity grabs, and institutional activity are likely to occur. It helps traders see where price is likely to be drawn before a major move, making it a valuable tool for those trading liquidity-based strategies.
FVG Reversal Sentinel🔵 FVG Reversal Sentinel – Multi-Timeframe Fair Value Gap Indicator
The FVG Reversal Sentinel is a powerful TradingView indicator designed to help traders identify and track Fair Value Gaps (FVGs) across multiple timeframes, all within a single chart.
This tool allows you to select up to five separate timeframes, ensuring you never miss key market shifts, whether you are scalping, day trading, or swing trading. You can use this indicator in any asset (Cryptos, Futures, Indices, Forex Pairs, etc.).
🔵 - Key Features -
Multi-Timeframe FVG Tracking – Select and display up to five different timeframes on one chart, providing a comprehensive view of market structure.
Customizable Colors – Adjust bullish and bearish FVG colors to match your chart theme for a seamless trading experience.
Enhanced Market Context – Quickly identify key liquidity zones and refine your entries and exits with precision.
Hide the lower timeframes FVGs to get a clear view in a custom timeframe.
Show or hide mitigated FVGs to declutter the chart.
FVGs boxes are going to be displayed only when the candle bar closes
FVGs are going to be mitigated only when the body of the candle closes above or below the FVG area.
No repainting
Whether you're looking to fine-tune your entries or gain a broader market perspective, the FVG Reversal Sentinel indicator ensures you have the tools to stay ahead of price action and capitalize on market inefficiencies.
🔵 - Customization-
You can change the indicator settings as you see fit to achieve the best results for your use case.
TIMEFRAMES
This indicator provides the ability to select up to 5 timeframes. These timeframes are based on the trader's timeframes including any custom timeframes.
Select the desired timeframe from the options list.
Add the label text you would like to show for the selected timeframe.
Check or uncheck the box to display or hide the timeframe from your chart.
FVG SETTINGS
Length of boxes: allows you to select the length of the box that is going to be displayed for the FVGs.
Delete boxes after fill?: allows you to show or hide mitigated FVGs on your chart.
Hide FVGs lower than enabled timeframes?: allows you to show or hide lower timeframe FVGs on your chart. Example - You are in a 15 minutes timeframe chart, if you choose to hide lower timeframe FVGs you will not be able to see 5 minutes FVG defined in your Timeframes Settings, only 15 minutes or higher timeframe FVGs will be displayed on your chart.
BOX VISUALS
Bullish FVG box color: the color and opacity of the box for the bullish FVGs.
Bearish FVG box color: the color and opacity of the box for the bearish FVGs.
LABELS VISUALS
Bullish FVG labels color: the color for bullish labels.
Bearish FVG labels color: the color for bearish labels.
Labels size: the size of the text displayed in the labels.
Labels position: the position of the label inside the FVGs boxes (right, left or center).
BORDER VISUALS
Border width: the width of the border (the thickness).
Bullish FVG border color: the color and the opacity of the bullish box border.
Bearish FVG border color: the color and the opacity of the bearish box border.
🔵 - How to use the indicator -
Just add the indicator in your chart and click in the settings option to customize it.
Make sure you select the desired timeframes and set the colors and opacity for the FVGs boxes.
This indicator can be used in many trading strategies, such as:
SILVER BULLET
iFVG
iFVG RETEST
These strategies are based on the use of FVGs, this tool can help you analyze the market and make the right decision.
🔵 - How was the indicator designed? -
I have spent a lot of time testing other open source indicators from the community. All of these indicators do a great job, but they have a problem, they not only mitigate FVGs when a candle closes above or below the FVG, they also mitigate FVGs when the candle closes exactly to the tick (not above or below the FVG). This is a problem for many strategies that rely on FVGs mitigation.
What makes this indicator different is that it focuses on just mitigating imbalances at the right time for these strategies.
I have taken ideas and some pieces of code from many community indicator developers, such as:
@twingall
@tflab
@marktools
@nacho-fx
@pmk07
... and many other people, to whom I thank for their valuable work and have allowed me to create this tool by making modifications to their source code.
🔵 - Disclaimer -
This tool is intended solely for informational and educational purposes and should not be regarded as financial, investment, or trading advice. It's not designed to predict market movements or offer specific recommendations. Users should be aware that past performance is not indicative of future results and should not rely on any indicator for financial decisions.

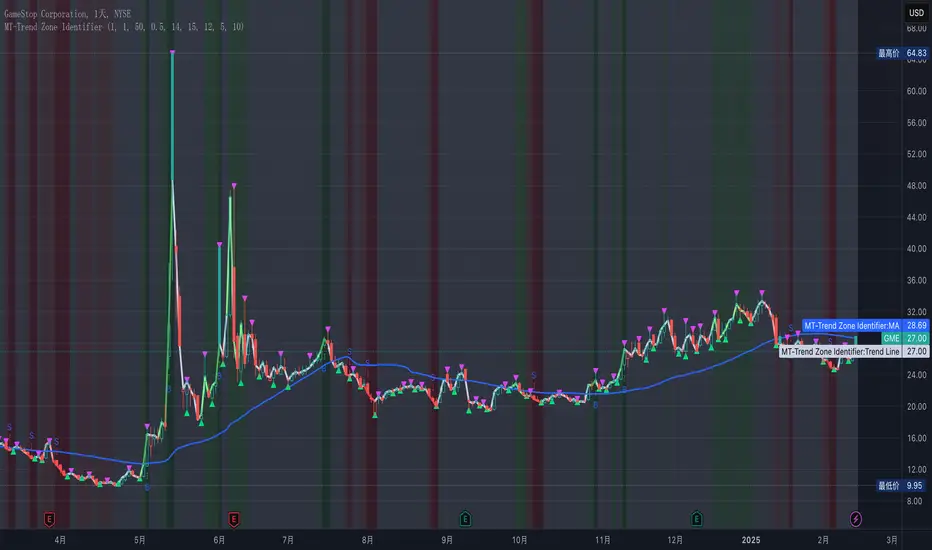
MT-Trend Zone IdentifierTrend Zone Identifier – A Dynamic Market Trend Mapping Tool
Overview
The Trend Zone Identifier is an advanced TradingView indicator that helps traders visualize different market trend phases. By leveraging Pivot Points, Moving Averages (MA), ADX (Average Directional Index), and Retest Confirmation, this tool identifies uptrend, downtrend, and ranging (sideways) conditions dynamically.
This indicator is designed to segment the market into clear trend zones, allowing traders to distinguish between confirmed trends, trend transitions (pending zones), and ranging markets. It provides an intuitive visual overlay to enhance market structure analysis and assist in decision-making.
Key Features
✔ Trend Zone Identification – Classifies price action into Uptrend (Green), Downtrend (Red), Pending Confirmation (Light Colors), and Sideways Market (Gray/Neutral)
✔ Pivot-Based Breakout & Breakdown Detection – Uses pivot highs/lows to determine trend shifts
✔ Moving Average & ADX Validation – Ensures the trend is backed by MA structure and ADX trend strength
✔ Pullback Confirmation – Allows trend confirmation based on price retesting key levels
✔ Extreme Volatility & Gaps Filtering – Optional ATR-based extreme movement filtering to avoid false signals
✔ Multi-Timeframe Support – Option to integrate higher timeframe trend validation
✔ Customizable Sensitivity – Fine-tune MA smoothing, ADX thresholds, pivot detection, and pullback range
How It Works
1. Trend Classification
• Uptrend (Green): Price is above a key MA, ADX confirms strength, and a pivot breakout occurs
• Downtrend (Red): Price is below a key MA, ADX confirms strength, and a pivot breakdown occurs
• Pending Trend (Light Colors): Initial trend breakout or breakdown is detected but requires further confirmation
• Sideways/Ranging (Gray): ADX signals a weak trend, and price remains within a neutral zone
2. Retest & Confirmation Logic
• A trend is only confirmed after a breakout or breakdown followed by a successful retest
• If the market fails the retest, the indicator resets to a neutral state
3. Custom Filters for Optimization
• Enable or disable volume filtering for confirmation
• Adjust pivot sensitivity to detect major or minor swing points
• Choose to require consecutive bars confirming the breakout/breakdown
Ideal Use Cases
🔹 Swing traders who want to capture trend transitions early
🔹 Trend-following traders who rely on confirmed market cycles
🔹 Range traders looking to identify sideways market zones
🔹 Algorithmic traders who need clean trend segmentation for automated strategies
Final Thoughts
The Trend Zone Identifier is a versatile market structure indicator that helps traders define trend cycles visually and avoid trading against weak trends. By providing clear breakout, breakdown, and retest conditions, it enhances market clarity and reduces decision-making errors.
➡ Add this to your TradingView workspace and start analyzing market trends like a pro! 🚀
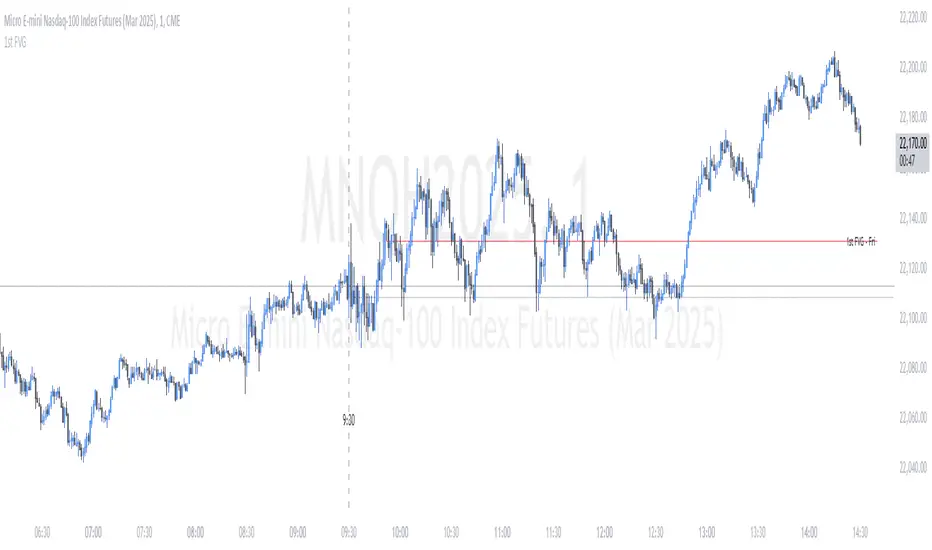
ICT First Presented FVG - NY Open [LuckyAlgo]
This indicator identifies the first Fair Value Gap (FVG) that occurs during the New York trading session, combined with NY session opening price levels. It's an essential tool for traders who follow ICT concepts and focus on the NY trading session.
ICT refers to this as the First Presented FVG, while other traders may call it the 9:30 FVG.
This indicator is best for the 1 minute timeframe, while 5 minute also works.
Detects and marks the first FVG of the NY session
Displays both bullish (green) and bearish (red) FVGs with customizable transparency
Shows the NY session opening price with clear labels
Includes optional vertical line at 9:30 AM NY open
Maintains clean chart visibility with adjustable maximum display days
Includes session date and time labels for easy reference
The indicator helps traders identify potential reversal zones and continuation opportunities by combining two powerful concepts: Fair Value Gaps and NY session opening price. This makes it particularly valuable for day traders and swing traders who want to capitalize on institutional order flow patterns during the most liquid trading session.
You can customize the indicator's appearance, including FVG box colors, time range display, and whether to show the NY open markers. This flexibility allows you to integrate it seamlessly with your existing trading setup.
Son Model ICT [TradingFinder] HTF DOL H1 + Sweep M15 + FVG M1🔵 Introduction
The ICT Son Model setup is a precise trading strategy based on market structure and liquidity, implemented across multiple timeframes. This setup first identifies a liquidity level in the 1-hour (1H) timeframe and then confirms a Market Structure Shift (MSS) in the 5-minute (5M) timeframe to validate the trend. After confirmation, the price forms a new swing in the 5-minute timeframe, absorbing liquidity.
Once this level is broken, traders typically drop to the 30-second (30s) timeframe and enter trades based on a Fair Value Gap (FVG). However, since access to the 30-second timeframe is not available to most traders, we take the entry signal directly from the 5-minute timeframe, using the same liquidity zones and confirmed breakouts to execute trades. This approach simplifies execution and makes the strategy accessible to all traders.
This model operates in two setups :
Bullish ICT Son Model and Bearish ICT Son Model. In the bullish setup, liquidity is first accumulated at the lows of the 1-hour timeframe, and after confirming a market structure shift, a long position is initiated. Conversely, in the bearish setup, liquidity is first drawn from higher levels, and upon confirmation of a bearish trend, a short position is executed.
Bullish Setup :
Bearish Setup :
🔵 How to Use
The ICT Son Model setup is designed around liquidity analysis and market structure shifts and can be applied in both bullish and bearish market conditions. The strategy first identifies a liquidity level in the 1-hour (1H) timeframe and then confirms a Market Structure Shift (MSS) in the 5-minute (5M) timeframe.
After this shift, the price forms a new swing, absorbing liquidity. When this level is broken in the 5-minute timeframe, the trader enters based on a Fair Value Gap (FVG). While the ideal entry is in the 30-second (30s) timeframe, due to accessibility constraints, we take entry signals directly from the 5-minute timeframe.
🟣 Bullish Setup
In the Bullish ICT Son Model, the 1-hour timeframe first identifies liquidity at the market lows, where price sweeps this level to absorb liquidity. Then, in the 5-minute timeframe, an MSS confirms the bullish shift.
After confirmation, the price forms a new swing, absorbing liquidity at a higher level. The price then retraces into a Fair Value Gap (FVG) created in the 5-minute timeframe, where the trader enters a long position, placing the stop-loss below the FVG.
🟣 Bearish Setup
In the Bearish ICT Son Model, liquidity at higher market levels is identified in the 1-hour timeframe, where price sweeps these levels to absorb liquidity. Then, in the 5-minute timeframe, an MSS confirms the bearish trend.
After confirmation, the price forms a new swing, absorbing liquidity at a lower level. The price then retraces into a Fair Value Gap (FVG) created in the 5-minute timeframe, where the trader enters a short position, placing the stop-loss above the FVG.
🔵 Settings
Swing period : You can set the swing detection period.
Max Swing Back Method : It is in two modes "All" and "Custom". If it is in "All" mode, it will check all swings, and if it is in "Custom" mode, it will check the swings to the extent you determine.
Max Swing Back : You can set the number of swings that will go back for checking.
FVG Length : Default is 120 Bar.
MSS Length : Default is 80 Bar.
FVG Filter : This refines the number of identified FVG areas based on a specified algorithm to focus on higher quality signals and reduce noise.
Types of FVG filters :
Very Aggressive Filter: Adds a condition where, for an upward FVG, the last candle's highest price must exceed the middle candle's highest price, and for a downward FVG, the last candle's lowest price must be lower than the middle candle's lowest price. This minimally filters out FVGs.
Aggressive Filter: Builds on the Very Aggressive mode by ensuring the middle candle is not too small, filtering out more FVGs.
Defensive Filter: Adds criteria regarding the size and structure of the middle candle, requiring it to have a substantial body and specific polarity conditions, filtering out a significant number of FVGs.
Very Defensive Filter: Further refines filtering by ensuring the first and third candles are not small-bodied doji candles, retaining only the highest quality signals.
🔵 Conclusion
The ICT Son Model setup is a structured and precise method for trade execution based on liquidity analysis and market structure shifts. This strategy first identifies a liquidity level in the 1-hour timeframe and then confirms a trend shift using the 5-minute timeframe.
Trade entries are executed based on Fair Value Gaps (FVGs), which highlight optimal entry points. By applying this model, traders can leverage existing market liquidity to enter high-probability trades. The bullish setup activates when liquidity is swept from market lows and a market structure shift confirms an upward trend, whereas the bearish setup is used when liquidity is drawn from market highs, confirming a downtrend.
This approach enables traders to identify high-probability trade setups with greater precision compared to many other strategies. Additionally, since access to the 30-second timeframe is limited, the strategy remains fully functional in the 5-minute timeframe, making it more practical and accessible for a wider range of traders.

Volume Delta with PVSRAVolume Delta with PVSRA
Volume Delta with PVSRA is an advanced volume indicator that dissects each bar’s volume into its directional components using higher resolution data. It visually distinguishes between buying and selling volume, so that for a bullish candle the bottom portion represents buying volume and for a bearish candle it represents selling volume. A dot is plotted at the 50% mark of the candle’s total volume, serving as a clear reference point.
Key Features:
Directional Volume Breakdown:
The indicator calculates the delta volume by analyzing lower timeframe data. The bottom portion of a bullish candle (displayed in green) represents buying volume, while that of a bearish candle (displayed in red) represents selling volume.
PVSRA Analysis:
Using Price-Volume Spread Range Analysis, the indicator compares the current volume to the 10-bar average. When volume is significantly higher (using thresholds of 150% and 200%), the candle borders are highlighted in custom colors, indicating medium or strong volume conditions.
Volume Moving Averages:
Three moving averages are plotted:
Total Volume MA (yellow): Tracks overall volume.
Buying Volume MA (green) and Selling Volume MA (red): These are re-centered around the total volume MA. A crossover of the green over the red typically signals rising buying pressure, while the opposite indicates increasing selling pressure.
Scalable Volume Bars:
The indicator scales the volume bars to provide optimal visualization on your chart.
Setup Instructions:
For best results, open your chart settings, navigate to the Canvas tab, and set the bottom margin to 0%. This ensures the indicator displays like a standard volume indicator without any unwanted gaps at the bottom.
Customize the various settings—including colors, border opacity, and moving average parameters—to suit your trading style.
