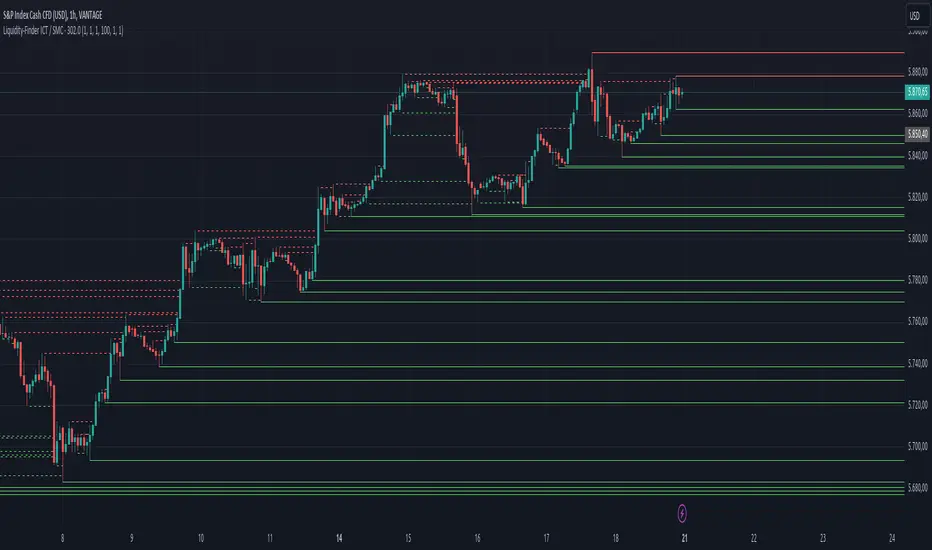
Hourly Opening PriceThe Inner Circle Trader has noted that the Opening Price of every Hourly candle can be used in a Power Of 3 (PO3) context.
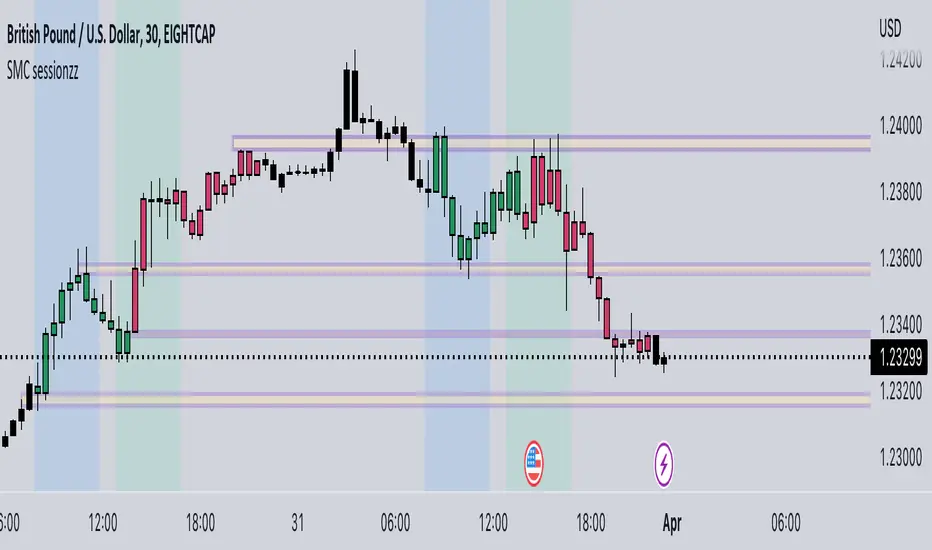
If Bullish, buy BELOW the hourly open.
If Bearish, sell ABOVE the hourly open.
The Power of 3 ICT model also know as "AMD" is a transformative trading strategy, ingeniously designed to streamline your time analyzing charts by focusing on three pivotal phases in market behavior: accumulation, manipulation, and distribution.
The ICT Power of Three Model dissects the market maker’s algorithm for price delivery into three pivotal actions: Accumulation, Manipulation, and Distribution. Accumulation involves smart money gathering positions before a price surge, while manipulation sees the market creating deceptive movements to trigger stops. Finally, distribution occurs as smart money offloads positions, often catching less informed traders off-guard. This strategy is a critical tool for traders to understand market makers’ maneuvers and to strategically position themselves in the market.
This indicator plots a line at the opening price of each hour and extends it on the chart for the duration of the hour. Each hour starts a new line.
You also have the option of extending the midnight opening price line across the entire trading day.
Chỉ báo Pine Script®