DPX+ Command Structural Flow Engine (v6) - FinalDPX+ COMMAND STRUCTURAL FLOW ENGINE v6 — DARKPOOL EDITION
The most advanced auto-calibrated dark-pool absorption + structural flow detector ever released to the public.
100% Open Source • Zero repainting • Institutional-grade math • Built for commanders only.
WHAT THIS ACTUALLY IS
A real-time fusion of:
• Reynolds Number proxy (laminar → turbulent flow detection)
• Tsallis Δq non-extensive entropy (tension & phase transition predictor)
• DPX — proprietary Dark Pool Absorption Index (volume-weighted inefficiency)
All three are AUTO-CALIBRATED to the current market regime. No manual thresholds. Works on BTC, SPX, TSLA, 1m or monthly — same settings.
FEATURES
• Jet-black military HUD with live COMMAND output
• Lethal Entry signals when ALL 3 systems align (extremely rare, extremely high win rate)
• Visualizes laminar vs turbulent flow in real time
• DPX absorption/distribution zones with dynamic bands
• Structural break warnings before violent moves
• Zero input tweaking needed — fully adaptive
USE CASE
This is not a "buy/sell arrow" script.
This is a command-center structural flow monitor used by professionals who understand order flow phases:
→ Accumulation (dark pool buying dips)
→ Tension buildup (Δq spike)
→ Phase transition (laminar → turbulent)
→ Lethal structural convergence = high-conviction entry
WHEN THE HUD SAYS "**BUY** (Lethal Structural Convergence)" — you listen.
Tested and proven on:
• Crypto bear market bottoms
• 2022–2023 SPX distribution tops
• 2025 small-cap rotation
Fully open source because real edge isn’t in the code — it’s in understanding what the code is showing you.
If you know, you know.
#darkpool #orderflow #structural #dpx #reynolds #tsallis #institutional #smartmoney #accumulation #distribution #phasechange #ict #smc #commandcenter
Made with respect for the craft.
Drop a ♥ if this speaks to you.
Tìm kiếm tập lệnh với "ict"

Momentum Market Structure ProThis first indicator in the Beyond Market Structure Suite gives you clear market structure at a glance, with adaptive support & resistance zones. It's the only SMC-style indicator built from momentum highs & lows, as far as I know. It creates dynamic support & resistance zones that change strength and resize intelligently, and gives you timely alerts when price bounces from support/rejects from resistance.
You’re free to use the provided entry and exit signals as a ready-to-use, self-contained strategy, or plug its structure into your existing system to sharpen your edge :
• Market structure bias may help improve a compatible system's win rate by taking longs only in bullish bias and shorts in bearish structure.
• Support/resistance can help trend traders identify inflection points, and help range traders define ranges.
🟩 HIGHLIGHTS
⭐ Unique market structure with different characteristics than purely price-based models.
⭐ Support and resistance created from only the extreme levels.
⭐ Support & resistance zones adapt to remain relevant. Zones are deactivated when they become too weak.
⭐ Long and short signals for a bounce from support/rejection from resistance.
🟩 WHY "MARKET STRUCTURE FIRST, ALWAYS"?
"There is only one side to the stock market; and it is not the bull side or the bear side, but the right side." — Jesse Livermore, Reminiscences of a Stock Operator (1923)
If the market is structurally against your trade, you're gonna have a bad time. So you must know what the market structure is before you plan your trade. The more precise and relevant your definition of market structure, the better.
🟩 HOW TO TRADE USING THIS INDICATOR (SIMPLE)
• Directional filter : The prevailing bias background can be used for any kind of trades you want to take. For example, you can long a bounce from support in a bullish market structure bias, or short a rejection from resistance in bearish bias.
• Entries : For more conservative entries, you could wait for a Candle Trend flip after a reaction from your chosen zone (see below for more about Candle Trend).
• Stops : The included running stop-loss level based on Average True Range (ATR) can be used for a stop-loss — set the desired multiplier, and use the level from the bar where you enter your trade.
• Take-profit : Similarly, you can set a Risk:Return-based take-profit target. Support and resistance zones can also be used as full or partial take-profit targets.
See the Advanced section below for more ideas.
🟩 SIGNALS
⭐ ENTRIES
You can enable signals and alerts for bounces from support and rejections from resistance (you'll get more signals using Adaptive mode). You can filter these by requiring corresponding market structure bias (it uses the bias you've already set for the background), and by requiring that Candle Trend confirm the move.
I've slipped in my all-time favourite creation to this indicator: Candle Trend. When price makes a Simple Low pivot, the trend flips bullish. When price then makes a Simple High pivot, the trend flips bearish (see my Market Structure library for a full explanation). This tool is so simple, yet I haven't noticed it anywhere else. It shows short-term trends beautifully. I use it mainly as confirmation of a move. You can use it to confirm ANY kind of move, but here we use it for bounces from support/rejections from resistance.
Note that the pivots and Zigzags are structure, not signals.
⭐ STOPS
You can use the supplied running ATR-based stop level to find a stop-loss level that suits your trading style. Set the desired multiplier, and use the level from the bar where you enter your trade.
⭐ TAKE-PROFIT
Similarly, you can set a take-profit target based on Risk:Return (R:R). If this setting is enabled, the indicator calculates the distance between the closing price and your configured stop, then multiplies that by the configured R:R factor to calculate an appropriate take-profit level. Note that while the stop line is reasonably smooth, the take-profit line varies much more, reflecting the fact that if price has moved away from your stop, the trade requires a greater move in order to hit a given R:R ratio.
Since the indicator doesn't know where you were actually able to enter a position, add a ray using the drawing tool and set an alert if you want to be notified when price reaches your stop or target.
🟩 WHAT'S UNIQUE ABOUT THIS INDICATOR
⭐ MOMENTUM PIVOTS
Almost all market structure indicators use simple Williams fractals. A very small number incorporate momentum, either as a filter or to actually derive the highs and lows. However, of those that derive pivots from momentum, I'm not aware of any that then create full market structure from it.
⭐ SUPPORT & RESISTANCE
Some other indicators also adjust S/R zones after creation, some use volume in zone creation, some increase strength for overlap, a few merge zones together, and many use price interactions to classify zones. But my implementation differs from others, as far as I can tell after looking at many many indicators, in seven specific ways:
+ Zones are *created* from purely high-momentum pivots, not derived or filtered from simple Williams pivots (e.g. `ta.pivothigh()`).
+ Zones are *weakened* dynamically as well as strengthened. Many people know that S/R gets stronger if price rejects from it, but this is only half the story. Different price patterns strengthen *or weaken* zones.
+ We use *conviction-weighted candle patterns* to adjust strength. Not simply +1 for price touching the zone, but a set of single-bar and multi-bar patterns which all have different effects.
+ The rolling strength adjustments are all *moderated by volume*. The *relative volume* forms a part of each adjustment pattern. Some of our patterns reward strong volume, some punish it.
+ We do our own candle modelling, and the adjustment patterns take this into account.
+ We *resize* zones as a result of certain candle patterns ("indecision erodes, conviction defends").
+ We shrink overlapping zones to their sum *and* add their strengths.
🟩 HOW TO TRADE USING THIS INDICATOR (ADVANCED)
In addition to the ideas in the How to Trade Using This indicator (Simple) section above, here are some more ideas.
You can use the market structure:
• As a bias for entries given by more reactive momentum resets, or indeed other indicators and systems.
• You could use a change in market structure to close a long-running trend-following position.
You can use the distance from a potential entry to the CHoCH line as a filter to choose higher-potential trades in ranging assets.
Confluence between market structure and your favourite trend indicator can be powerful.
Multi timeframe analysis
This is a bit of a rabbit hole, but you could use a split screen with this indicator on a higher timeframe (HTF) view of the same asset:
• If the 1D structure turns bullish, the next time that the 1H structure also flips bullish might be a good entry.
• Rejection from a HTF zone, confirmed by lower timeframe (LTF) structure, could be a good entry.
None of this is advice. You need to master your own system, and especially know your own strengths and weaknesses, in order to be a successful trader. An indicator, no matter how cool, is not going to one-shot that process for you.
In Adaptive mode, a skillful trader will be able to spot more opportunities to classify and use support and resistance than any algorithm, including mine, now that they've been automatically drawn for you.
If you are doing historical analysis, note that the "Calculated bars" setting is set to a reasonably small number by default, which helps performance. Either increase this number (setting to zero means "use all the bars"), or use Bar Replay to examine further back in the chart's history. If you encounter errors or slow loading, reduce this number.
🟩 SUPPORT & RESISTANCE
A support zone is an area where price is more likely to bounce, and a resistance zone is an area where price is more likely to reject. Marking these zones up on the chart is extremely helpful, but time-consuming. We create them automatically from only high-momentum areas, to cut noise and highlight the zones we consider most important.
In Simple mode, we simply mark S/R zones from momentum and Implied pivots. We don't update them, just deactivate them if price closes beyond them. Use this mode if you're interested in only recent levels.
In Adaptive mode, zones persist after they're traversed. Once the zones are created, we adjust them based on how price and volume interact with them. We display stronger zones with more opaque fills, and weaker zones with more transparent fills. To calculate strength, we first preprocess candles to take into account gaps between candles, because price movement after market is just as important in its own way. The preprocessing also redefines what constitutes upper and lower wicks, so as to better account for order flow and commitment. We use these modelled candle values, as well as their relative amplitude historically, rather than the raw OHLC for all calculations for interactions of price and zones. It's important to understand, when trying to figure out why the indicator strengthened or weakened a zone, that it sees fundamental price action in a different way to what is shown on standard chart candles (and in a way that can't easily be represented accurately on chart candles).
Then, we strengthen or weaken , and resize support and resistance zones dynamically using different formulas for different events, based on principles including these:
• The close is the market's "vote", the momentum shift anchor.
• Defended penetrations reveal validated liquidity clusters.
• Markets contract to defended levels.
• "The wick is the fakeout, but the close tells you if institutions held the level." — ICT (Inner Circle Trader)
Adaptive mode is more powerful, but you might need to tweak some of the Advanced Support & Resistance settings to get a comfortable number of zones on the chart.
🟩 MOMENTUM PIVOTS
The building blocks of market structure are Highs and Lows — places where price hits a temporary extreme and reverses. All the indicators I could find that create full market structure do so from basic price pivots — Williams fractals, being the highest/lowest candle wick for N candles backwards and forwards (there are some notable first attempts on TradingView to use momentum to define pivots, but no full structure). "Highest/lowest out of N bars" is the almost universal method, but it also picks up somewhat arbitrary price movements. Recognising this, programmers and traders often use longer lookbacks to focus on the more significant Highs and Lows. This removes some noise, but can also remove detail.
My indicator uses a completely different way of thinking about High and Low pivots. A High is where *momentum* peaks and falls back, and a low is where it dips and then recovers. While this is happening, we record the extremes in price, and use those prices as the High or Low pivot zones.
This deliberately picks out different, more meaningful pivots than any purely price-based approach, helping you focus on the swings that matter. By design, it also ignores some stray wicks and other price action that doesn't reflect significant momentum. Price action "purists" might not like this at first, but remember, ultimately we want to trade this. Check and see which levels the market later respects. It's very often not simply the numerically higher/lower local maxima and minima, but the levels that held meaning, interpreted here through momentum.
The first-release version uses the humble Stochastic as the structural momentum metric. Yes, I know — it's overlooked by most people, but that's because they're using it wrong. Stochastic is a full-range oscillator with medium excursions, unlike RSI, say, which is a creeping oscillator with reluctant resets. This makes Stoch (at the default period of 14) not quite reactive enough for on-the-ball momentum reset entry signals, but close to perfect (no metric is 100%) for structural pivots.
Stochastic is also a solid choice for structure because divergences are rare and not usually very far away in terms of price. More reactive momentum metrics such as Stochastic RSI produce very noisy structure that would take a whole extra layer of interpreting (see Further Research, below).
For these reasons, I may or may not add other options for momentum. In the initial release, I've added smoothed RSI as an alternative just to show it's possible, which takes even longer than Stochastic to migrate from one extreme to another, creating an interesting, longer-term structure.
🟩 IMPLIED PIVOTS
We want pivots to mark important price levels so that we can compute market direction and support & resistance zones from them.
In this context, we see that some momentum metrics, and Stochastic in particular, tend to give multiple consecutive resets in the same direction. In other words, we get High followed by High, or Low followed by Low, which does not give us the chance to create properly detailed structure. To remedy this, we simply take the most extreme price action between two same-direction pivots, and create an Implied pivot out of it, after the second same-direction pivot is created.
Obviously these pivots are created very late. Recalling why we wanted them, we realise that this is fine. By definition , price has not exceeded the Implied Pivot level when they're created. So they show us an interesting level that is yet untested.
Implied Pivots are thus created indirectly by momentum but defined directly by price. They are for structure only. We choose not to give them a Dow type (HH, HL, LH, LL) and not to include them in the Main Zigzag to emphasise their secondary nature. However, Implied Pivots are not "internal" or "minor" pivots. There is no such concept in the current Momentum Market Structure model.
If you want less responsive, more long-term structure, you can turn Implied Pivots off.
🟩 DOW STRUCTURE
Dow structure is the simplest form of market structure — Higher Highs (HHs) and Higher Lows (HLs) is an uptrend (showing buyer dominance), and vice-versa for a downtrend.
We label all Momentum (not Implied) Pivots with their Dow qualifier. You can also choose to display the background bias according to the Dow trend.
There is an input option to enable a "Ranging" Dow state, which happens when you get Lower Highs in an uptrend or Higher Lows in a downtrend.
🟩 SMC-STYLE STRUCTURE (BOS, CHOCH)
The ideas of trend continuation after taking out prior highs/lows and looking for early signs of possible reversal go back to Dow and Wyckoff, but have been popularised by SMC as Break Of Structure (BOS) and Change of Character (CHoCH).
BOS can be used as a trigger: for example:
• Wait for a bullish break of structure
• Then attempt to buy the pullback
• Cancel if structure breaks bearish (meaning, we get a bearish CHoCH break)
How to buy the pullback? This is the trillion-dollar question. First, you need solid structure. Without structure, you got nothin'. Then, you want some identified levels where price might bounce from.
If only we incorporated intelligent support and resistance into this very indicator 😍
Creating and maintaining correct BOS and CHoCH continuously , without resetting arbitrarily when conditions get difficult, is technically challenging. I believe I've created an implementation of this structure that is at least as solid as any other available.
In general, BOS is fully momentum‑pivot‑driven; CHoCH is anchored to momentum pivots but maintained mainly by raw price extremes relative to those anchors (breaks are obviously pure price). This means that the exact levels will sometimes differ from your previous favourite market structure indicator.
We have made some assumptions here which may or may not match any one person's understanding of the "correct" way to do things, including: BOS is not reset on wicks because, for us, if price cannot close beyond the BOS there is no BOS break, therefore the previous wick level is still important. The candidate for CHoCH on opposing CHoCH break *is* reset on a wick, because we want to be sure to overcome the leftover liquidity at that new extreme before calling a Change of Character. The CHoCH is moved on a BOS break. For a bullish BOS break, the new CHoCH is the lowest price *since the last momentum pivot was confirmed, creating the BOS that just broke*, and vice-versa for bearish. If there's a stray wick before that, which doesn't shift momentum, we don't care about it.
🟩 ZIGZAG
The Major Swing Zigzag dynamically connects momentum highs and lows (e.g., from a Higher Low to the latest Higher High), adjusting as new extremes form to reveal the overall trend leg.
The Implied Structure Zigzag joins momentum pivots and Implied pivots, if enabled.
🟩 REPAINTING
It's really important to understand two things before asking "Does it repaint?":
1. ALL structure indicators repaint, in the sense of drawing things into the past or notifying you of things that happened in past bars, because by definition, structure needs some kind of confirmation, which takes at least one bar, usually several. This is normal.
2. Almost all indicators of ANY kind repaint in that they display unconfirmed values until the current bar closes. This is also normal.
Most features of this indicator repaint in the ordinary, intended ways described above: the pivots (Implied doubly so), BOS and CHoCH lines, and formation of S/R zones.
The Zigzags, by design, adjust themselves to new pivots. The active lines often change and attach themselves to new anchors. This is a form of repainting. It's important to note that the Zigzags are not signals. They're there to help visualise market structure, and structure does change. Therefore, I prioritised clearly explaining what price did rather than preserving its history.
One of the "bad" kinds of repainting is if a signal is printed when the bar closes, but then on a later bar that "confirmed" signal changes. This is a fundamental issue with some high timeframe implementations. It's bad because you might already have entered a trade and now the indicator is pretending that it never signalled it for you. My indicators do not do this (in fact I wrote an entire library to help other authors avoid this).
If you are ever in any doubt, play with an indicator in Bar Replay mode to see exactly what it does.
To understand repainting, see the official docs: www.tradingview.com
🟩 FURTHER RESEARCH
I've attempted to answer two of the tricky problems in technical analysis in Pine: how to do robust and responsive market structure, and how to maintain support and resistance zones once created. However, this just opens up more possibilities. Which momentum metrics are suitable for structure? Can more reactive metrics be used, and how do we account for divergences in a structural model based on key horizontal levels? Which sets of rules give the best results for maintaining support and resistance? Does the market have a long or a short memory? Is bar decay a natural law or a coping mechanism?
🟩 CREDITS
❤️ I'd like to thank my humble trading mentor, whose brilliant ideas inspire me to garble out code. Thanks are also due to @Timeframe_Titans for guidance on the finer points of market structure (all mistakes and distortions are my own), and to @NJPorthos for feedback and encouragement during the months in the wilderness.
Tập lệnh trả phí

4H EMA 21/30 Cloud on 15mThis indicator displays the 4-hour EMA 21 and EMA 30 as a dynamic cloud directly on the 15-minute chart, providing a clean and reliable higher-timeframe trend filter for intraday and scalping setups.
The cloud turns:
Green when EMA21 > EMA30 → bullish HTF trend
Red when EMA21 < EMA30 → bearish HTF trend
Because the 4H EMA 21/30 combination tracks mid-term momentum and trend structure extremely well, this indicator helps traders avoid counter-trend trades, time pullbacks more effectively, and align entries with dominant higher-timeframe flow.
Perfect for traders using:
Price Action
FVG / Imbalance concepts
CHOCH/BOS structure
Liquidity-based models
ICT-style intraday execution
Use the 4H cloud as your HTF bias anchor, and execute trades using your own entry model on the 15m timeframe.

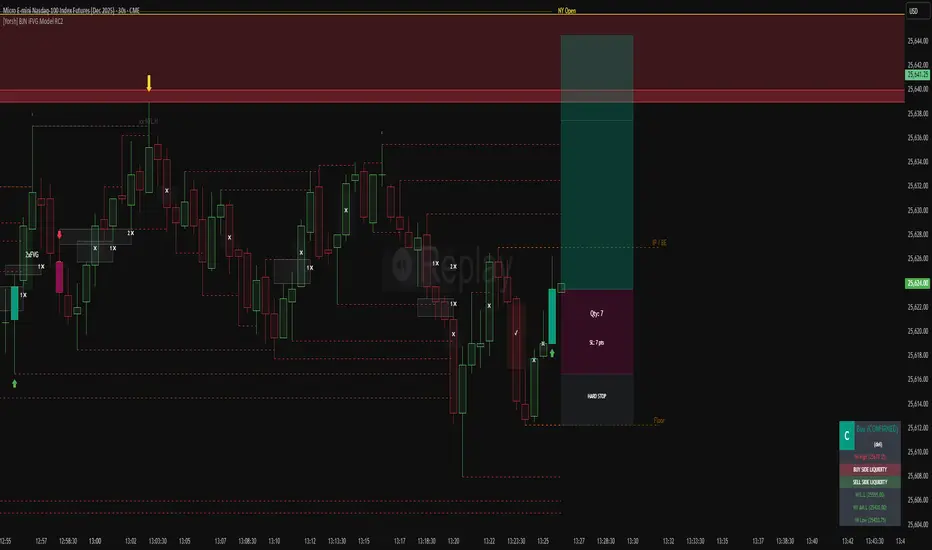
[Yorsh] BJN iFVG Model RC1 BJN iFVG Model - Mechanical Trading System
Description:
The BJN iFVG Model is not just an indicator; it is a full-scale, semi-automated trading architecture designed to mechanically execute the specific "BJN" Inverted FVG strategy.
Designed for precision traders operating on Lower Timeframes (1m to 5m), this script eliminates the cognitive load of manual analysis. It automates every single step of the mechanical model—from Higher Timeframe narrative building to tick-perfect structural validation and risk calculation.
This tool transforms your chart into a professional trading cockpit, split into three intelligent engines:
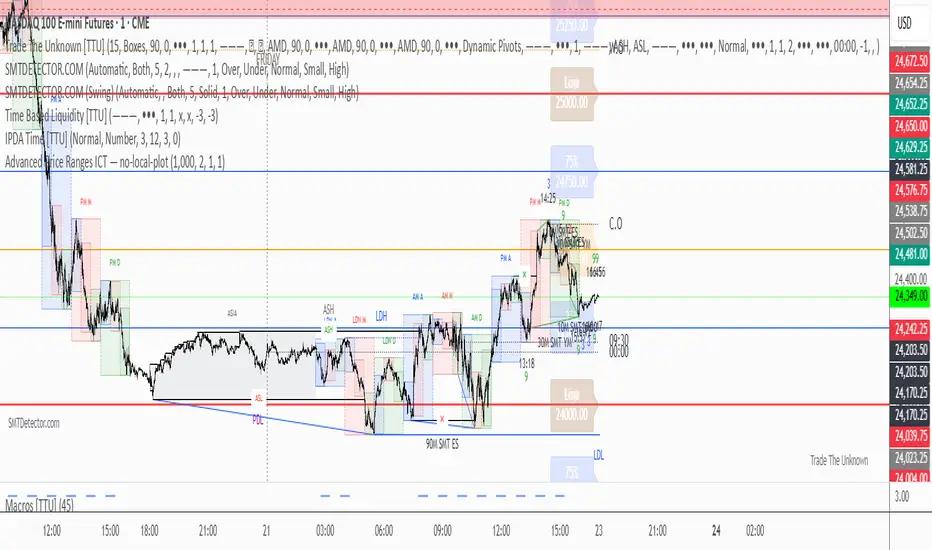
1. The Matrix (Context Engine)
Before looking for an entry, you must understand the narrative. The Matrix handles the heavy lifting of multi-timeframe analysis without cluttering your chart:
Real-Time Delivery State: Automatically detects if price is reacting from valid HTF PD Arrays (1H, 4H, Daily) to confirm a "Delivery" state.
Liquidity Sweeps: Tracks Fractals across three dimensions (1H, 15m, and Micro-Structure) to identify liquidity raids instantly.
Advanced SMT Divergence: A built-in, multi-mode SMT engine scans for correlation breaks (Pivot SMT, Adjacent Wick SMT, and FVG SMT) between NQ/ES (or custom tickers) in real-time.
Time & Macro Tracking: Automatically visualizes Killzones and highlights high-probability Macro windows.
2. The Executioner (Entry Engine)
Once the context is set, the Executioner handles the specific Inverted FVG (iFVG) entry model with strict mechanical rules:
Structural Integrity: Automatically identifies the Invalidation Point (IP), Floor/Ceiling, and Break-Even levels for every setup.
Hazard Detection: The script proactively scans the "Trading Leg" for opposing unmitigated FVGs (Hazards). If the path isn't clean, the trade is flagged or invalidated.
Composite Logic: Intelligently merges "noisy" price action into Composite FVGs to reduce false signals.
Integrated Position Sizer: When a trade is confirmed, a visual box appears showing your precise Entry, Stop Loss, Hard Stop, and Take Profit levels, along with a calculated Contract Quantity based on your risk tolerance.
3. The Ranking System (Quality Control)
Not all trades are created equal. This system grades every single confirmed setup in real-time based on confluence factors:
Grades: Ranges from A++ (Perfect Confluence) to C (Low Probability).
Confluence Check: Checks for Delivery, Sweeps (HTF/LTF), SMT, and Macro alignment at the exact moment of the trigger.
Live Status Panel: A dashboard on your chart displays the current live trade status (Armed, Triggered, Confirmed) and its Rank, so you never miss a beat.
Optimization & Performance
Trading on the 1-minute timeframe requires speed. This script has been rigorously optimized for high-frequency environments:
Smart Garbage Collection: The script manages its own memory, cleaning up old data arrays to prevent lag, ensuring the chart remains fluid even after days of data accumulation.
Tunnel Vision: Calculations are strictly focused on the relevant trading leg, ignoring historical noise to maximize execution speed.
Zero-Repaint: All historical analysis is strictly non-repainting to ensure backtesting reliability.
How to Use
Timeframes: Optimized for 1m, 2m, 3m, 4m, 5m execution.
Alerts: Configure the robust alert system to notify you only when setups meet your standards (e.g., "Alert only on Rank B+ or higher").
Strategy: Wait for the Status Panel to show a "CONFIRMED" signal. Use the on-screen Position Sizer to execute the trade with the displayed risk parameters.
Stop analyzing; start executing. Welcome to mechanical trading.
----------------------------------------------------------------------------------------------------------------
RISK DISCLAIMER:
The content, tools, and signals generated by this script are strictly for educational and informational purposes only. This script does not constitute financial advice, investment recommendations, or a solicitation to buy or sell any securities, futures, or other financial instruments.
Trading financial markets involves a high degree of risk and is not suitable for all investors. The "Position Sizer" and "Trade Setups" displayed are hypothetical simulations designed to demonstrate the mechanics of the BJN methodology; they do not guarantee future performance.
Use this tool at your own risk. The author assumes no responsibility or liability for any trading losses or damages incurred in connection with the use of this script. Always consult with a qualified financial advisor and practice proper risk management.
🔹 Williams %R x2🔹 Williams %R x2 — Dual Williams %R Oscillator (MTF)
Williams %R x2 is an enhanced version of the classic Williams Percent Range indicator, allowing you to display two independent %R lines with separate parameters and multi-timeframe (MTF) support.
This tool is ideal for precise entry timing, spotting reversals, identifying extreme zones, and confirming momentum shifts.
✨ Indicator Features
1. Two Independent Williams %R Inputs
Separate period settings
Individual price sources
Custom line colors
Configurable overbought/oversold levels
Ability to enable or disable each oscillator independently
2. Multi-Timeframe (MTF) Mode
Each %R can be calculated on:
the current chart timeframe
or any higher/lower timeframe selected by the user (from M1 to MN)
This allows flexible combinations such as:
local %R for entries
higher-timeframe %R for trend filtering
3. Built-in Levels
OB/OS levels for each oscillator
Central midpoint level at −50
Fully customizable level colors
🎯 Use Cases
Detecting short-term reversals
Assessing momentum and timing entries
Applying SMC/ICT confirmation models
Filtering signals with higher-timeframe structure
Identifying extreme price conditions
🛠️ Technical Details
Fully compatible with Pine Script® v6
No repainting
Clean and minimal oscillator without unnecessary elements

RUSSFEST SMC Strategy V1.4RUSSFEST SMC Strategy V1.4 is a multi-timeframe Smart Money Concepts framework that builds a clean, rule-based view of market structure and then trades directly off that structure. It’s designed for traders who want to systematize SMC logic, keep their charts readable, and automate their trading.
Instead of relying on lagging oscillators, the strategy continuously tracks the active price leg, labels strong/weak highs and lows, and reacts to structural shifts in real time. The current timeframe leg is always drawn on your chart with a clear high, low, and midpoint, so you can instantly see whether price is trading in a discount or premium relative to the leg. Trade entries are driven by confirmed events aligned with directional bias, not by single-candle patterns.
A higher-timeframe (HTF) structure engine runs in the background and can be overlaid on your execution timeframe (e.g., 4H structure on a 15m chart). This HTF leg provides the primary bias and defines HTF discount/premium zones so that longs can be constrained to discounted areas of a bullish leg and shorts to premium areas of a bearish leg. An optional additional HTF bias can be turned on for traders who want an extra top-down filter before any position is allowed.
Risk management is fully structure-based. Stops are always placed beyond the current structure high/low with an optional buffer, so every trade is anchored to a meaningful swing point instead of arbitrary points. Take-profit logic is configurable:
Fixed RR – simple R-multiple targeting off the structure-based stop.
HTF Weak High/Low – targets the opposing side of the active HTF leg.
Opposite CHoCH – dynamically exits when structure flips against the position, effectively using the next structural shift as an exit rule.
Key Features:
Full SMC-style price leg tracking with strong/weak highs & lows and midpoint.
Multi-timeframe structure: overlay HTF leg on your LTF execution chart.
Primary and optional secondary HTF bias filters.
Discount/premium gating relative to the HTF leg (no “chasing” in the wrong zone).
Structure-anchored stop loss with three exit modes (Fixed RR, HTF target, Opposite CHoCH).
Day-of-week filters for filtering out any days that don't prove to be profitable.
This script is a structured SMC framework, not financial advice. Markets are risky; always forward-test, adjust parameters for your instrument and timeframe, and use position sizing that fits your own risk tolerance.

ahax – CRT V0 ahax – CRT V0 is an enhanced CRT indicator that works on candlestick formations and generates BUY/SELL signals when certain conditions are met.
In this version, the classic CRT logic has been supplemented with additional controls for more stable operation, with a particular focus on reducing unnecessary signals. Each signal is generated based on the middle candlestick, and confirmation signals (+/-) can be displayed, if desired, based on the close of the next candle.
The indicator works based on the relationship between the left candlestick, the middle candlestick, and the right candlestick. It provides quick visual feedback on points such as trend reversals, potential manipulation, or reaction zones.
It is designed to be simple, clear, and clean, allowing you to adapt it to your own strategy.
It does not include any risk management or trading recommendations.

Daily Protocol [#] by @shulktrades@shulktrades aka Shulkins aka shulk
Open Source Script created from the code “ICT Everything” by @coldbrewrosh
*Adjusted Key Times and Standard Deviations to better fit my model*
Daily Protocol Indicator - Description
Overview
The Daily Protocol indicator is a comprehensive trading tool designed to help traders identify and visualize key intraday time-based levels and sessions for forex and other markets. This indicator automatically marks important market opening times, session ranges, and standard deviation projections to assist in technical analysis and trade planning.
Key Features
Time-Based Vertical Lines
Midnight Open (00:00): Marks the start of each trading day
News Open (08:30): Highlights the typical economic news release time
NY AM Open (09:30): Identifies the US equity market opening
Opening Price Lines
Midnight Opening Price: Tracks the price at market day start
News Opening Price (08:30): Shows the price level at news time
NY AM Opening Price (09:30): Displays equity market open price
Afternoon Opening Price (13:30): Optional afternoon session marker
Weekly & Monthly Opening Prices: Higher timeframe reference levels
Session Range Boxes
London Session (LNDN): 02:00-05:00 range with optional standard deviation projections
Asian Session (ASIA): 20:00-00:00 range with optional standard deviation projections
NY AM Session (NYAM): 09:30-10:00 range with optional standard deviation projections
Standard Deviation Projections
Automatically calculates and displays 1-4 standard deviation levels based on session ranges
Configurable directional display (both sides, upside only, or downside only)
Helps identify potential target zones and reversal areas
Additional Features
Day of Week Labels: Clearly marks each trading day
Customizable Timezone: Supports multiple global timezones
Historical Lines Toggle: Option to show/hide past levels for cleaner charts
Terminus Settings: Control how far price lines extend into the future
Color Customization: Full control over all colors, line styles, and widths
Range Statistics Table: Displays current session ranges and pip counts (forex only)
Best Use Cases
Identifying overnight key times and structure before market opens for NY
Planning entries around major session times
Setting targets using standard deviation projections
Understanding market structure through time-based analysis
Backtesting strategies based on session behavior
Timeframe Recommendation
Works best on intraday timeframes (1-60 minutes). The indicator automatically hides on timeframes above 61 minutes to prevent chart clutter.
Customization
Extensive settings allow traders to:
Enable/disable any individual component
Adjust all colors, line styles, and widths
Control label display and formatting
Set timezone preferences
Configure standard deviation calculations
Choose which sessions and times to display
This indicator is ideal for traders who follow time-based trading methodologies and want to incorporate structured intraday analysis into their workflow.

BPR (Ballanced price range) DetectorHow This BPR Detector Works
This indicator is designed to detect and visualize balanced price ranges (BPRs) on price charts. The indicator has two main components:
Regular FVG Detection - The indicator first detects regular Fair Value Gaps in price action, which are spaces where price has moved quickly leaving a gap. This is necessary because BPRs are derived from regular FVGs.
BPR Detection - When the price action inverts and moves through a regular FVG in the opposite direction, the indicator identifies this as a BPR. This concept is important in Inner Circle Trader (ICT) methodology as it can signal potential changes in trend direction. Additionally the detection logic is refined by incorporating displacement.
The main functionality preserved includes:
Detection of regular FVGs (required to find BPRs)
Conversion of regular FVGs to BPRs when price moves through them creating a FVG in the opposite direction
Visual display of both FVG and BPR zones
Mitigation tracking for both types of imbalances
Displacement visualization that helps identify energetic price moves
Key Settings
FVG Settings - Control the appearance and behaviour of regular Fair Value Gaps
BPR Settings - Control the appearance of Breaker Price Ranges (which have different colours by default)
Mitigation Settings - Define how the indicator determines when an imbalance has been filled
Displacement Settings - Optional highlighting of energetic price moves that may lead to imbalances

BOS and CHoCHThe market never moves in a straight line. It moves in waves.
It makes a High, comes down a bit (Low), then breaks the previous High to make a new High.
Similarly, It makes a Low, goes up a bit (High), then breaks the previous Low to make a new Low.
BOS (Break Of Structure) - Trend Continuation
BOS means the market is continuing its current trend. If the market is in an Uptrend and breaks the old "High" -> Bullish BOS. If the market is in a Downtrend and breaks the old "Low" -> Bearish BOS.
3. CHOCH (Change Of Character) - Trend Reversal
CHOCH means the mood of the market has changed. For the first time, the trend has shifted its nature.
Bullish to Bearish CHOCH: The market was making Higher Highs, but suddenly it broke its previous "Low". Now the market can fall.
Bearish to Bullish CHOCH: The market was falling (Lower Lows), but suddenly it broke its previous "High". Now the market can rise.
BOS: Confirms the trend (Breaking the ceiling to go higher).
CHOCH: Signals a trend change (Slipping and falling below the previous floor).

Fair Value Gaps (FVG)This indicator automatically detects Fair Value Gaps (FVGs) using the classic 3-candle structure (ICT-style).
It is designed for traders who want clean charts and relevant FVGs only, without the usual clutter from past sessions or tiny, meaningless gaps.
Key Features
• Bullish & Bearish FVG detection
Identifies imbalances where price fails to trade efficiently between candles.
• Automatic FVG removal when filled
As soon as price trades back into the gap, the box is deleted in real time – no more outdated zones on the chart.
• Only shows FVGs from the current session
At the start of each new session, all previous FVGs are cleared.
Perfect for intraday traders who only care about today’s liquidity map.
• Flexible minimum gap size filter
Avoid noise by filtering FVGs using one of three modes:
Ticks (based on market tick size)
Percent (relative to current price)
Points (absolute price distance)
• Right-extension option
Keep gaps extended forward in time or limit them to the candles that created them.
Why This Indicator?
Many FVG indicators overwhelm the chart with zones from previous days or tiny imbalances that don’t matter.
This version keeps things clean, meaningful, and real-time accurate, ideal for day traders who rely on market structure and liquidity.

QuantMotions - FVG with Volume TrackingFair Value Gap Detector with Dynamic Shrinking & Volume Analysis
Overview
Advanced Fair Value Gap (FVG) detection indicator with real-time box shrinking and volume delta analysis. Automatically identifies price inefficiencies and tracks institutional volume flow within each gap.
What are Fair Value Gaps?
Fair Value Gaps occur when price moves so rapidly that a "gap" is left between three consecutive candles, creating an inefficiency where no trading occurred. These gaps often act as support/resistance zones that price tends to revisit.
Detection:
- Bullish FVG: When low > high (upward price inefficiency)
- Bearish FVG: When high < low (downward price inefficiency)
Key Features
Dynamic Box Shrinking
FVG boxes automatically shrink as price enters them:
- Bullish FVGs shrink from top as price moves down into the gap
- Bearish FVGs shrink from bottom as price moves up into the gap
- Provides precise visualization of remaining unfilled gap area
Volume Delta Analysis
Tracks volume characteristics for the 3-candle FVG formation:
- Total Volume: Sum of volume from all three FVG candles
- Up/Down Split: Separates buying vs selling pressure
- Delta %: Shows directional bias of volume flow
- Color Coding: Green/Red when volume confirms direction, Orange when it doesn't
Smart Filtering
- ATR-based minimum gap size - Filters out insignificant noise gaps
- Auto-cleanup - Removes fully filled FVGs automatically
- Maximum display limit - Keeps charts clean by limiting visible FVGs
Live Statistics
Real-time stats table showing:
- Active bullish/bearish FVG count
- Average volume delta for each direction
- Fill progress tracking
Settings
Min Gap Size (ATR): Minimum gap size as multiple of ATR(14). Default: 0.3
- Lower values (0.1-0.3): More sensitive, shows smaller gaps
- Higher values (0.5-1.0): More selective, only significant gaps
Max FVGs: Maximum number of FVG boxes to display (5-100)
Remove Fully Filled: Automatically remove FVGs when price completely fills them
Shrink on Partial Fill: Enable dynamic box shrinking as price enters gaps
Show Volume Info: Display volume delta labels at box edges
How to Use
1. Confluence Trading: Look for FVGs that align with your support/resistance levels
2. Volume Confirmation: Check volume delta - strong directional volume increases probability
3. Partial Fills: Watch for price reactions at shrinking FVG boundaries
4. Multiple Timeframes: Use on higher timeframes (4H+) for swing trading, lower timeframes for scalping
Best Practices
- Combine with trend analysis - FVGs in trend direction have higher fill rates
- Pay attention to volume delta - gaps with confirming volume are more reliable
- Use on liquid markets for accurate volume data
- Higher timeframe FVGs typically carry more significance
Notes
- Works on all timeframes and instruments
- Volume data accuracy depends on your data provider
- FVGs are not guaranteed support/resistance - use proper risk management
- This indicator shows historical inefficiencies, not future predictions
Disclaimer: This indicator is for educational purposes only. Past performance does not guarantee future results. Always use proper risk management.

Smart Money COTThis indicator implements the method of analysing COT data as defined by Michael Huddleston (I.E. The Inner Circle Trader). It removes all superfluous information contained in the standard COT reports and focusses only on Commercial speculators using the overall Long-Short positions.
Features
The unique feature of this indicator is its ability to look back over time and provide the following information:
Calculation of the range high and low of the specified lookback range.
Calculation of equilibrium of that range.
Automatic colour coding of net long and net short positions when the Long-Short COT calculation is above or below equilibrium of the lookback range.
Instructions
Use the Daily Timeframe only. You may get unexpected results on other timeframes.
Ensure the asset has COT data available. Script is mainly focused on commodity futures, such as ES, NQ, YM. It has not been tested against Forex.
You will need to define the "Lookback" setting in the script settings. Use the total number of trading days required for your analysis. E.g. if you want a 6 month COT analysis, use the measurement tool to count the quantity of daily candles between now and 6 months ago - use this as your Lookback setting. Adjust as needed for other lookback periods, e.g. 3 months, 12 months etc.
Other Info
The script provides the ability to customise colours in its settings.
Range High and Range Low plots can be disabled in settings.

[JAMJAM] v3This indicator is developed based on ICT concepts, focusing on identifying liquidity pools and order blocks within the market structure. It helps in visualizing high-probability setups by filtering out market noise. The script is part of a comprehensive trading system aimed at automating the detection of smart money movements. It is strictly for private analysis and forward testing.

jhehli LiquidityWhat are BSL and SSL?
In the context of Smart Money Concepts, liquidity simply refers to pending orders—specifically Stop Losses and Buy/Sell Stop orders—resting above old highs and below old lows.
BSL (Buy-Side Liquidity): This is found above Swing Highs. Retail traders who are short the market will place their "Buy Stop" protective orders here. Additionally, breakout traders place "Buy Limit" orders here. Smart Money views this area as a pool of willing buyers. To fill large sell orders, institutions must drive price up into this liquidity to pair their massive sell interest with these buy stops.
SSL (Sell-Side Liquidity): This is found below Swing Lows. Retail traders who are long the market place their "Sell Stop" protective orders here. Smart Money targets these levels to accumulate long positions. They need the market to sell off into these levels so they can buy from the willing sellers at a discount.
How this Indicator Works
This tool automates the process of market structure analysis by identifying key Swing Highs and Swing Lows.
Detection: It scans price action to find fractal highs and lows (classic swing points) where price has rejected a level.
Visualization: It projects a line from these points, clearly marking where the "stops" are likely residing.
Liquidity Raids: When price pierces these levels, it is considered a "Liquidity Raid" or "Stop Hunt."
How to Use This in Your Trading
Do not treat these lines simply as Support and Resistance. In the ICT methodology, old highs and lows are targets, not barriers.
For Reversals: Wait for a "Turtle Soup" or "Judas Swing." This occurs when price aggressively expands into a BSL or SSL level to trigger stops, only to quickly reverse back into the trading range. This indicates that Smart Money has finished their accumulation or distribution.
For Bias: If the higher timeframe trend is Bullish, expect SSL to be raided to fuel the move, while BSL becomes the target (Draw on Liquidity).
By using this indicator, you remove the guesswork of manually marking every swing point, allowing you to focus on price action and the reaction at these critical liquidity pools.

SMC Trend Reversal by Pooja🌟 SMC Trend Reversal by Pooja — CHoCH + BOS + RSI Confirmation
🔥 Smart Money Concepts • Trend Reversal Detection • Multi-Asset Optimized
The SMC Trend Reversal by Pooja is a powerful market-structure indicator designed for traders who follow Smart Money Concepts (SMC) and want to identify trend reversals, BOS, and CHoCH with high clarity.
It blends pivot-based structure breaks, RSI confirmation, and an optional session filter, giving traders a clean and reliable view of market shifts across Crypto, Forex, Indices, and Equity Derivatives.
✨ 🔰 Why SMC Matters in Crypto & Forex?
Both Crypto and Forex markets:
Trade 24/7 / 5 days with high volatility
React strongly to liquidity zones, market structure shifts, and smart money footprints
Often reverse sharply after liquidity grabs
Follow clean CHoCH → BOS → Trend progression sequences
This is why CHoCH (Change of Character) and BOS (Break of Structure) are crucial tools used by professional SMC traders to catch early trend reversals.
This indicator automates that process for you.
No clutter. No repaints. No noise.
Just pure SMC structure.
🚀 Key Features
🟣 CHoCH Detection (Change of Character)
Detects when the market shifts direction
A CHoCH appears when the trend flips from down → up or up → down
Highlights the earliest sign of a trend reversal
Draws a clean CHoCH line across structure
Works beautifully in volatile markets like Crypto & Forex
🔵 BOS Detection (Break of Structure)
Identifies structural continuation in the same direction
Helps confirm the new trend after CHoCH
Clear BOS lines to visualize progression of market flow
Ideal for trend-following and breakout traders
🧠 RSI-Based Confirmation (Optional)
To avoid fake CHoCH signals, the indicator uses RSI filtering:
RSI > Upper Level → Show “B” Buy Label
RSI < Lower Level → Show “S” Sell Label
This improves accuracy especially in:
Fast crypto markets (BTC, ETH, SOL etc.)
Liquidity-driven assets (Forex, Indices)
⏱️ Session Block (Asia/Kolkata Compatible)
Avoid signals in the first few minutes of market open or in volatile windows.
Block signals in a selected time range
Perfect for Indian market opening volatility (09:00–09:25)
🎯 Clean, Minimal, Easy-to-Read Visuals
✔ Horizontal structural lines
✔ Color-coded CHoCH and BOS
✔ Buy (B) / Sell (S) labels only when meaningful
✔ No unnecessary clutter
✔ Suitable for both beginners and advanced SMC traders
📢 Built-In Alerts
Receive notifications for:
🔔 Bullish CHoCH
🔔 Bearish CHoCH
🔔 Bullish BOS
🔔 Bearish BOS
Perfect for mobile, desktop, and webhook automation.
📈 How It Helps Your Trading
✔ Catch early trend reversals with confidence
✔ Avoid false signals with RSI filtering
✔ Trade like Smart Money (Institutional concepts)
✔ Works on all timeframes — scalping to swing
✔ Specially powerful on Crypto & Forex due to their structure-driven nature
✔ Cleaner charts → Better decisions → Higher probability trades
🧩 Who Should Use This Indicator?
✔ SMC / ICT style traders
✔ Breakout and trend-following traders
✔ Reversal traders
✔ Crypto & Forex scalpers
✔ Option buyers looking for early trend shifts
✔ Intraday NIFTY / BANKNIFTY traders
⚠️ Disclaimer
This indicator is for educational purposes and market analysis only.
It does not guarantee profits. Always practice risk management and test your settings before using it live.

Advanced Price Ranges — Izaak ButlerThis indicator automatically draws equally-spaced price ranges (based on a user-defined size) above and below the current price. Each range displays its High, Low, 50% midpoint, and 25/75% quarter levels. All lines now extend both forward and backward in time, covering the entire chart. Labels are added on the right edge for easy reference, and optional alerts trigger when price crosses key levels. This tool helps visualize structured price zones and ICT-style range behaviour across all market conditions.
30s Model IndicatorThe Model
The 30s model is a NASDAQ (NQ) scalping strategy based on entries within 30-second fair-value gaps (FVGs), formed after liquidity is taken on a higher timeframe.
What the Indicator Does
The indicator identifies liquidity sweeps: swing highs/lows with at least "Left Pivot" bars to the left, capturing at least one prior swing high/low.
It then detects if a 30s FVG formed within "FVG Distance from Swing" bars of the latest liquidity-taking swing high/low.
If found, it verifies the FVG meets the "Minimum FVG Size" and that forming candles didn't hit the take-profit level.
When conditions match, the FVG is highlighted with entry, take-profit, and stop-loss lines, plus optional price labels. The appearance of all the elements can be customized in the indicator settings.
You can also setup alerts on the indicator that will trigger whenever a valid 30s is formed.
Error Conditions
Not running on 30s time-frame
Not using NQ, or MNQ

TradeBeard Larry Williams A/D + Classic DivergenceName: TradeBeard – Larry Williams A/D + Classic Divergence
What it does:
This indicator plots a classic Larry Williams Accumulation/Distribution (A/D) line, using:
(Close−Open)/(High−Low)×Volume
It then looks at price swings vs. A/D swings and marks true Larry-style divergences:
Bull Div – Price makes a lower low, but the A/D line makes a higher low → buying pressure/accumulation.
Bear Div – Price makes a higher high, but the A/D line makes a lower high → selling pressure/distribution.
Lines are drawn between the two pivots on the A/D line, with a label at the most recent pivot.
How to use / read it:
Use on any timeframe; the logic is the same.
Look for Bull Div near potential bottoms as confirmation that smart money is quietly buying.
Look for Bear Div near potential tops as confirmation that smart money is unloading.
Settings:
Pivot left bars (price) / Pivot right bars (price)
Controls how “wide” a swing high/low must be.
1 / 1 ≈ very sensitive (ICT/Larry-style 3-bar swings).
Higher values = fewer but cleaner swings and fewer signals.
Show bullish divergences / Show bearish divergences
Turn each signal type on or off.
Bullish color (line + label) / Bearish color (line + label)
Color of the divergence lines and label background.
Bullish label text color / Bearish label text color
Text color inside the Bull Div / Bear Div labels.
That’s it: pure Larry Williams A/D flow, price-based pivots, and clean visual divergence signals, wrapped in a TradeBeard skin.
I hope this will help you in your trading.
// Disclaimer:
// This script is for educational and informational purposes only.
// Trading and investing involve risk. You are fully responsible for your own decisions,

8FigRenko – Precision FVG Zones8FigRenko – Pure FVG Zones is a clean, reliable Fair Value Gap tool designed for traders who want accurate FVG zones only from the chart timeframe — without repainting, without higher-timeframe complications, and without messy borders.
This script is built for traders who want simple, precise, and visually clean imbalance zones that work the way FVGs should work:
🔥 Features
✔ Chart-timeframe FVGs only
No request.security, no multi-TF artifacts, no lagging or repainting.
The script reads exactly what your chart shows and never mixes timeframes.
✔ Wick-based or Body-based detection
Use classic ICT wick gaps, or switch to body-only gaps with one click.
✔ Minimum FVG size (points)
Filters out noise by requiring a minimum point distance (default: 5 points).
Great for futures and fast intraday charts.
✔ Clean, seamless boxes (no borders)
The FVG zones are rendered with borderless boxes, matching the modern style shown in institutional imbalance tools.
✔ Proper “end-to-end” FVG drawing
Each gap box starts from the origin of the imbalance and extends forward automatically.
✔ Auto-disrespect removal
FVGs are automatically deleted when price invalidates the zone:
Bullish FVG removed if close < FVG low
Bearish FVG removed if close > FVG high
No clutter. No manual cleanup.
✔ Extend zones forever or to the current bar
Choose if your FVGs run across the full future chart or just up to the latest candle.
✔ Optional: show only most recent FVG
Great for scalping or IFV (Immediate Fair Value) strategies.

Magnus Bestest 3This indicator is a sophisticated version of my Magnus Bestest signature move only as this script is highly advanced and has a huge amount of lines of code and structures so I had to create a new separate indicator for it. It signals only when there is a very nice liquidity and broken pivot points, confirming a truly nice trade opportunity.
My indicators so far that you can find and use:
1.) Magnus Bestest - full of various signals like liquidity signals, reversal signals, top/bottom ICT style signals, liquidity power candles showing big institutions joining the moves.
2.) Magnus Bestest 2 - My signature moves to clean liquidity = quality signals but not so often.
3.) Magnus Bestest 3 - Latest and most powerful signals. I finally captured my signature move in it's most powerful form. Biggest advantages are: Extreme precision, many trades on 1,2,3,4,5 minute TimeFrames so you can be sure to get at least 10 signals per day and very sim0le unambiguous entries and SL/TP levels making it a monkey-style indicator avoiding most possibilities to do human errors.
DISCLAIMER: I'm not a financial adviser and this is not a financial advise, just for educational purposed. Remember, most traders lose money.

Change in State of Delivery CISD [AlgoAlpha]🟠 OVERVIEW
This script tracks how price “changes delivery” after failed attempts to push in one direction. It builds swing levels from pivots, watches for those levels to be wicked, and then checks if price delivers cleanly in the opposite direction. When the pattern meets the script’s tolerance rules, it marks a Change in State of Delivery (CISD). These CISD levels are drawn as origin lines and are used to spot shifts in intent, failed pushes, and continuation attempts. A CISD becomes stronger when it forms after opposing liquidity is swept within a defined lookback.
🟠 CONCEPTS
The script first defines structure using swing highs/lows. These levels act as potential liquidity points. When price wicks through a swing, the script registers a mitigation event. After this, it looks for a reversal-style candle sequence: a failed push, followed by a counter-move strong enough to pass a tolerance ratio. This ratio compares how far price expanded away from the failed attempt versus the counter-move that followed. If the ratio is high enough, this becomes a CISD. The idea is simple: liquidity interaction sets context , and the tolerance logic identifies actual intent . CISD levels and sweep markers combine these two ideas into a clean map of where delivery flipped.
🟠 FEATURES
Liquidity tracking: marks swing highs/lows and updates them until expiry
Liquidity sweep confirmation when CISD aligns with recent mitigations
Alert conditions for all key events: mitigations, CISDs, and strong CISDs
🟠 USAGE
Setup : Add the script to your chart. Use it on any timeframe where swing behavior matters. Set the Swing Period for how wide a pivot must be. Set Noise Filter to control how strict the CISD detection is. Liquidity Lookback defines how recent a wick must be to confirm a sweep.
Read the chart : Origin lines mark where the CISD began. A green line signals bullish intent; a red line signals bearish intent. ▲ and ▼ shapes show CISDs that form after liquidity is swept, these mark strong signals for potential entry. Swing dots show recent swing highs/lows. Candle colors follow the latest CISD trend.
Settings that matter : Increasing Swing Period produces fewer but stronger swings. Raising Noise Filter requires cleaner counter-moves and reduces false CISDs. Liquidity Lookback controls how strict the sweep confirmation is. Expiry Bars decides how long swing levels remain active.

Thiru 369 LabelsThiru 369 Labels
**Thiru 369 Labels** is a sophisticated time-based indicator that calculates the numerical sum of time digits and displays visual labels when the sum matches harmonic values (3, 6, or 9). Based on the mathematical principles popularized by Nikola Tesla, this indicator helps traders identify potential market timing opportunities during major trading sessions.
📊 What It Does
This indicator monitors the current time (hour and minute) and calculates the sum of all digits, reducing it to a single digit. When this final sum equals 3, 6, or 9, a label is displayed on the chart. The indicator specifically focuses on three major trading sessions:
- **London Session**: 02:30 - 07:00 (GMT-5)
- **NY AM Session**: 07:00 - 11:30 (GMT-5)
- **NY PM Session**: 11:30 - 16:00 (GMT-5)
🔢 How It Works
### Time Sum Calculation
The indicator uses a standard mathematical reduction method:
1. **Extract Digits**: Takes the hour and minute (e.g., 09:51)
2. **Sum All Digits**: Adds all digits together (0 + 9 + 5 + 1 = 15)
3. **Reduce to Single Digit**: Continues reducing until single digit (15 → 1 + 5 = 6)
4. **Check Match**: If result equals 3, 6, or 9, displays label
Examples:
- **03:30** → 0 + 3 + 3 + 0 = **6** ✅ (Perfect 6)
- **12:06** → 1 + 2 + 0 + 6 = **9** ✅ (Perfect 9)
- **09:51** → 0 + 9 + 5 + 1 = 15 → 1 + 5 = **6** ✅
- **14:22** → 1 + 4 + 2 + 2 = 9 ✅ (Perfect 9)
Session Detection
The indicator automatically detects when the current time falls within active trading sessions and only displays labels during these periods. This ensures you're only seeing relevant timing signals during market hours.
Cycle Detection
The indicator can also detect different time cycles within sessions:
- **90-minute cycles**: Major session periods
- **30-minute cycles**: Sub-cycles within sessions
- **10-minute cycles**: Detailed intervals
🎯 Key Features
✅ Time Sum Detection
- Calculates time sum using standard 369 method
- Displays labels when sum matches 3, 6, or 9
- Customizable target sums (default: 3, 6, 9)
✅ Session Monitoring
- London Session (02:30 - 07:00)
- NY AM Session (07:00 - 11:30)
- NY PM Session (11:30 - 16:00)
- Enable/disable individual sessions
✅ Cycle Detection
- 90-minute cycles
- 30-minute cycles
- 10-minute cycles
- Optional cycle information display
✅ Visual Customization
- Label size options (Auto, Tiny, Small, Normal, Large, Huge)
- Custom colors for each sum (3, 6, 9)
- Session-based colors (Purple=London, Green=NY AM, Blue=NY PM)
- Label transparency control
- Text-only labels (no background box)
✅ Display Options
- Show/hide time text
- Show/hide cycle information
- Drawing limit options (Current Day, Last 2/3/5 Days, All Days)
- Debug table for real-time monitoring
✅ Advanced Settings
- Timezone selection (27 timezone options)
- Swing sensitivity for label positioning
- Label offset control
- Confirmed bars only option
📖 How to Use
Step 1: Add Indicator to Chart
1. Open TradingView
2. Click "Indicators" button
3. Search for "Thiru 369 Labels"
4. Click to add to chart
Step 2: Configure Basic Settings
**Time Sum Settings:**
- Enable Time Sum Detection: ✅ (default: ON)
- Target Sums: "3,6,9" (default)
- Label Size: Choose your preferred size
- Drawing Limit: "All Days" (default) or limit to specific periods
**Session Settings:**
- Monitor London Session: ✅ (default: ON)
- Monitor NY AM Session: ✅ (default: ON)
- Monitor NY PM Session: ✅ (default: ON)
**Cycle Settings:**
- 90 Minute Cycles: ✅ (default: ON)
- 30 Minute Cycles: ✅ (default: ON)
- 10 Minute Cycles: ✅ (default: ON)
Step 3: Customize Appearance
**Label Colors:**
- Use Custom Sum Colors: OFF (default) - Uses session colors
- OR Enable to use: Blue (3), Red (6), Maroon (9)
**Display Settings:**
- Label Transparency: Adjust as needed
- Show Time Text: Optional
- Show Cycle Information: Optional
- Show Debug Table: ✅ (recommended for monitoring)
Step 4: Set Timezone
**General Settings:**
- Session Timezone: Select your timezone (default: GMT-5)
- Choose from 27 timezone options
Step 5: Monitor Labels
- Labels will automatically appear when:
- Time sum equals 3, 6, or 9
- Current time is within an active session
- Drawing limit allows it
💡 Use Cases
1. Market Timing Entries
Use 3, 6, 9 labels as potential entry signals when combined with other technical analysis:
- Wait for label to appear
- Confirm with price action
- Enter trade with proper risk management
2. Session Analysis
Identify optimal trading times within sessions:
- Monitor which sessions show most labels
- Track label frequency per session
- Plan trading around high-frequency periods
3. Cycle Recognition
Understand market rhythm patterns:
- 90-minute cycles for major moves
- 30-minute cycles for intermediate moves
- 10-minute cycles for precise timing
4. Time-Based Confirmation
Use labels to confirm other indicators:
- Combine with price action
- Use with support/resistance levels
- Confirm with volume analysis
⚙️ Settings Overview
Time Sum Settings
- **Enable Time Sum Detection**: Master switch for the indicator
- **Target Sums**: Comma-separated list of target values (default: "3,6,9")
- **Label Size**: Size of displayed labels
- **Show Time Text**: Display time along with sum
- **Show Cycle Information**: Display cycle type (90m, 30m, 10m)
- **Drawing Limit**: Limit labels to specific time periods
- **Show Debug Table**: Real-time monitoring table
- **Only Show on Confirmed Bars**: Wait for bar confirmation
Session Settings
- **Monitor London Session**: Enable/disable London session (02:30-07:00)
- **Monitor NY AM Session**: Enable/disable NY AM session (07:00-11:30)
- **Monitor NY PM Session**: Enable/disable NY PM session (11:30-16:00)
Cycle Settings
- **90 Minute Cycles**: Enable 90-minute cycle detection
- **30 Minute Cycles**: Enable 30-minute cycle detection
- **10 Minute Cycles**: Enable 10-minute cycle detection
Display Settings
- **Label Transparency**: Control label background transparency
Label Colors
- **Color for Sum 3**: Custom color for sum = 3
- **Color for Sum 6**: Custom color for sum = 6
- **Color for Sum 9**: Custom color for sum = 9
- **Use Custom Sum Colors**: Toggle between custom and session colors
General Settings
- **Session Timezone**: Select timezone for calculations (27 options)
- **Swing Sensitivity**: Bars for swing detection
- **Label Offset**: Vertical spacing for labels
🔍 Debug Table
The debug table provides real-time information:
- **Time**: Current time with seconds
- **Sum**: Calculated time sum
- **Session**: Active session (London, NY AM, NY PM, or None)
- **Cycle**: Active cycle (90min, 30min, 10min, or None)
- **Status**: Match status (MATCH! or No Match)
- **Targets**: Configured target sums
- **Next**: Next potential sum value
Enable the debug table to monitor the indicator's calculations in real-time.
📊 Examples
Example 1: Perfect 6
**Time**: 03:30
**Calculation**: 0 + 3 + 3 + 0 = 6
**Result**: Label "6" appears (if in active session)
Example 2: Perfect 9
**Time**: 12:06
**Calculation**: 1 + 2 + 0 + 6 = 9
**Result**: Label "9" appears (if in active session)
Example 3: Reduced to 6
**Time**: 09:51
**Calculation**: 0 + 9 + 5 + 1 = 15 → 1 + 5 = 6
**Result**: Label "6" appears (if in active session)
Example 4: Reduced to 3
**Time**: 11:10
**Calculation**: 1 + 1 + 1 + 0 = 3
**Result**: Label "3" appears (if in active session)
🎨 Visual Features
Label Display
- **Text Only**: Clean text labels without background boxes
- **Color Coded**: Different colors for different sums or sessions
- **Smart Positioning**: Labels positioned above/below candles based on swing detection
- **Adaptive Offset**: Automatic spacing to avoid overlap
Session Colors (Default)
- **London Session**: Purple labels
- **NY AM Session**: Green labels
- **NY PM Session**: Blue labels
Custom Colors (Optional)
- **Sum 3**: Blue
- **Sum 6**: Red
- **Sum 9**: Maroon
📜 License & Attribution
**Copyright**: © 2025 ThiruDinesh
**License**: Mozilla Public License 2.0
**Contact**: TradingView @ThiruDinesh
This indicator is based on mathematical principles of numerical reduction and harmonic numbers, concepts popularized by Nikola Tesla and used in various trading methodologies.
