COT extremes indexCalculates the difference between net of noncommercials and net of commercials.
Difference = (net of noncommercials) - (net of commercials).
The extreme reading in one end or another may indicate the possible change of trend.
Based on Tradingview COT sample script and Babypips formula.
Works on daily timeframe.
Tìm kiếm tập lệnh với "index"

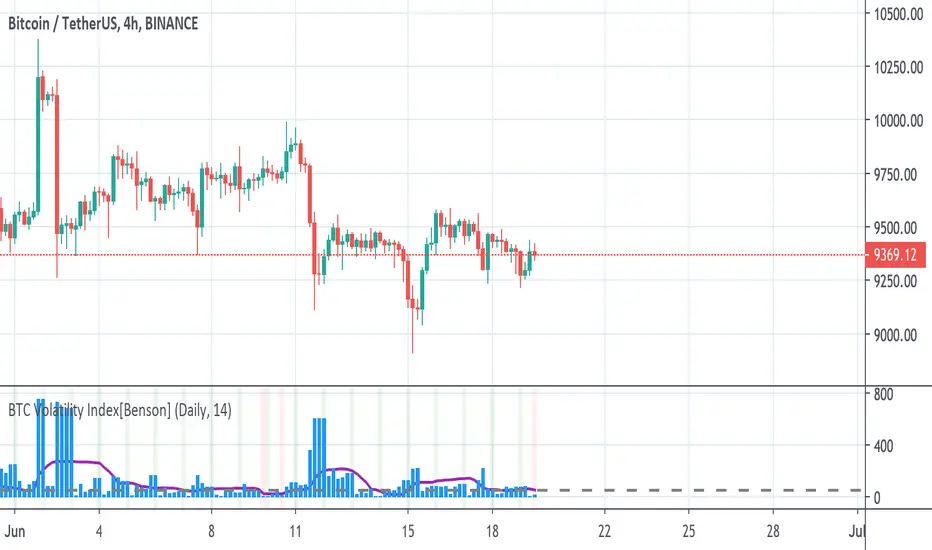
BTC Volatility Index[Benson]This indicator is for choosing the best timing to long BTC move future on FTX.
The basic idea is that when BTC's price volatility Index is relatively low(under 50 in 4hr timeframe or under 200 in D timeframe), it's more likely to have huge volatility afterwards, which it's a good time to long BTC's move future.
Green background --> Move future expected strike price
Red background --> Good timing to long BTC move future
Relative Strength Index @ inflowjetRelative Strength Index 80/20 with extra 30/70 area and 50% dashed line

Easy Directional Movement IndexNothing more than a graphical tweak for the integrated Directional movement index (DMI). The purpose is to make the reading of the DMI easier and more immediate.
The area between DI+ and DI- is filled, and the indicator's range in divided into 4 sections, each of them representing a different price tendency:
- When ADX line is inside the red colored area (0-25), the market is in a ranging phase.
- When inside the aqua colored area (25-50), there is a trend.
- When inside the blue colored area (50-75), there is a strong trend
- When inside the navy colored area (75-100), there is an extremely strong trend.
However keep in mind that these are default levels that may be not always significant. You can change them from the script settings as you prefer, to better tweak your analysis.
Please support my work and follow me if you like my scripts. Many more of them are coming in the future.
@Bezzus

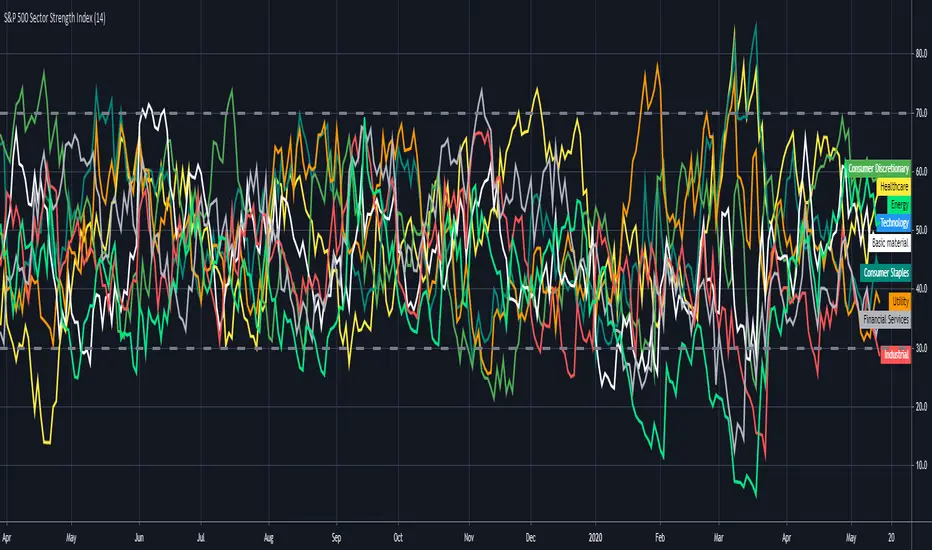
S&P 500 Sector Strength IndexHi traders , this is lonelygrass again 😄, and I am going to show what you don't often see out there and share it with you.
This indicator is called "s&p 500 sector strength index"😎 , which allows you to distinguish strengths and weaknesses between different sectors in s&p500, and to create meaningful trading frameworks around it.
Similar to the RSI indicator , it also has overbought and oversold levels , you can clearly figure out the degree of crowd behaviors in various sectors' stocks .
For me 🤣, I will use it to "BUY LOW⬇️ , SELL HIGH⬆️". When a sector is oversold at the moment, I will try to buy those stocks when I find price actions and chart patterns in comply with the analysis by this indicator , the opposite for shortselling.
Also, for sake of being more user-friendly 👍, I added a function which enables you to only select the sector(s) you want to look at in order to make it less messy.
If you can't help to know what I will share with you coming up, then FOLLOW my account 😙 . Also , your likes and shares are really important 🎊. I will get more motivated to bring you new thing every day!!! ✍
Relative Volume Strength IndexRVSI is an alternative volume-based indicator that measures the rate of change of average OBV.
How to read a chart using it?
First signal to buy is when you see RVSI is close to green oversold levels.
Once RVSI passes above it's orange EMA, that would be the second alert of accumulation.
Be always cautious when it reaches 50 level as a random statistical correction can be expected because of "market noises".
You know it's a serious uptrend when it reaches above 75 and fluctuates there, grading behind EMA.
The best signal to sell would be a situation where you see RVSI passing below it's EMA when the whole thing is close to Red overbought level
It looks simple, but it's powerful!
I'd use RVSI in combination with price-based indicators.

Weighted Moving Average of Relative Strength IndexJust weighted moving average of Relative Strength Index to see a clearer picture.

Two Bars IndexThe Two Bars Index compares the current bar to a bar n periods back.
This indicator is incredibly simple, yet so effective.

Trend Direction Force IndexThis is my own version of the famous Trend Direction Force Index and I modified the original to make my version react quickly to any trend. I have color coded the indicator to make it extremely easy to read so if it is green then buy and red then sell.
This was a custom request so if you would like more then just send me a message!
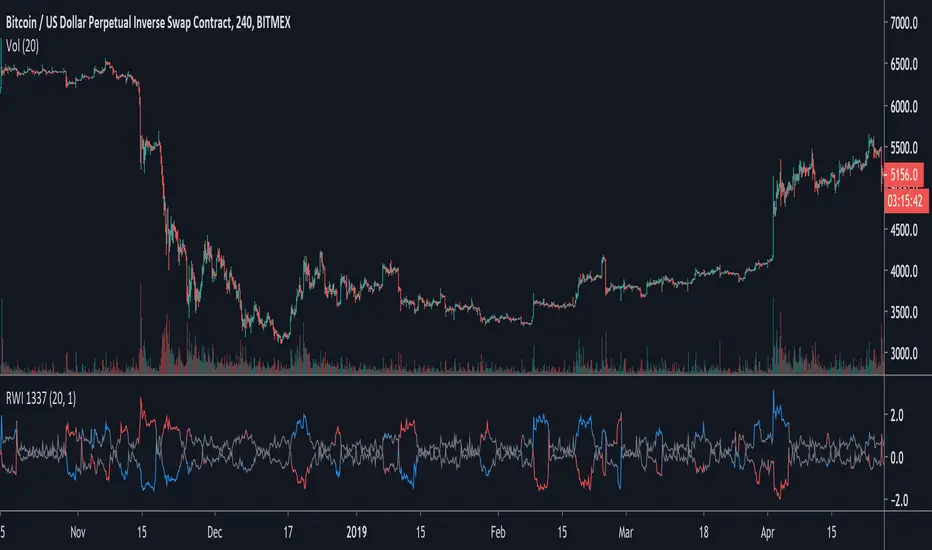
Random Walk Index 1337A modification of the original Random Walk Index (RWI) script by everget, this one updates to version 4 and adds a threshold value and colouring.
If both high and low are below the default threshold of 1.0 the line chart will be coloured in grey.
Adjusting the length and threshold should allow you to see flat and choppy periods.
SMI Stochastic Momentum Index 2x set per Baiynd -Tom1traderStochastic Momemtum Index - a true strength indix tsi with a moving average signal.
This uses the built in with modifications per Anne-Marie Baiynds recommendations - she uses a SIMPLE MOVING AVERAGE
for the signal (signal length at 4x the short length seems to work best to reflect actual price action support or resistance)
Note: Default settings in this code have been updated to her most recent recommendations that I have seen.
video is entitled "The Most Reliable Technical Indicator I Have Ever Used"
Note: I have not discussed this with Ms . Baiynd this is my interpretation of the vids I have seen.
Anne-Marie Baiynd also in talks / videos refers to the use of short / long of 4/20 and 6/40 and have combined both of them here
This overlays both of them with their respective SMAs- a 4/20 lengths and a 6/40 lengths in darker colors and smallest linewidth.
this gives a perspective on slightly higher time frame action.
USAGE: Generally above and below the black dashed zero line is long or short
KEYS: -Plot position relative to zero black, red overbought, green oversold and the gray lines at .25 -.25
Indicator action often more significant out side of the more "neutral" +.25/-.25 area
and near or above/below the red/green dashed lines.
-Steepness of slopes
Slopes of smi plots relate directly to price action where steeper is more momentum.
- -SMI blue relation to its simple moving average orange and the SMI longer dark blue with moving average purple.
MAJOR FEATURE - The average acts as support or resistance to the SMI and the price unless breaking out.
Price is often pausing or reversing iin finding primary/secondary support or resistance as well at those times.
You Can See and anticipate Where Support or Resistance may be Encountered. (much unlike most indicators)
My standard caveat -use at your own risk. Like anyone else I do not know what the next bar/candle is going to do
and I place all of my trades with a management plan in place for the worst case scenario.
That said enjoy your charting and trading.
This was coded starting with the built-in indicator "SMI Ergontic Oscilator / Indicator". You do this by within the Pine Editor select "New" tab and
choose the indicator that you want the code for. This populates the editor with the code for the built in indicator and you can modify it to suit your
purposes and save it / publish it and etc. Thanks for following this and Keep Smiling!

Construction Company IndexCouldn't find an index for construction companies so I made one. Useful to compare to the real estate market. It is just the average of the top 10 construction and engineering companies.

Combo Backtest 123 Reversal & CMOaDisparity Index This is combo strategies for get a cumulative signal.
First strategy
This System was created from the Book "How I Tripled My Money In The
Futures Market" by Ulf Jensen, Page 183. This is reverse type of strategies.
The strategy buys at market, if close price is higher than the previous close
during 2 days and the meaning of 9-days Stochastic Slow Oscillator is lower than 50.
The strategy sells at market, if close price is lower than the previous close price
during 2 days and the meaning of 9-days Stochastic Fast Oscillator is higher than 50.
Second strategy
The related CMOaDisparity Index article is copyrighted material from Stocks & Commodities Dec 2009
My strategy modification.
WARNING:
- For purpose educate only
- This script to change bars colors.

Didi Index [EMA]The DIDI Index is calculated by calculating the short term (3), medium term (8) and long term (20) Moving Averages (MA), green line is calculated by dividing the short term Moving Average (MA) by the medium term Moving Average (MA), likewise, the red line is calculated by dividing the long term Moving Averages (MA) by the medium term Moving Averages (MA)
This edition use EMA instead of SMA for faster signals.
Good luck and have fun

Combo Strategy 123 Reversal & CMOaDisparity Index This is combo strategies for get a cumulative signal.
First strategy
This System was created from the Book "How I Tripled My Money In The
Futures Market" by Ulf Jensen, Page 183. This is reverse type of strategies.
The strategy buys at market, if close price is higher than the previous close
during 2 days and the meaning of 9-days Stochastic Slow Oscillator is lower than 50.
The strategy sells at market, if close price is lower than the previous close price
during 2 days and the meaning of 9-days Stochastic Fast Oscillator is higher than 50.
Second strategy
The related CMO Disparity Index article is copyrighted material from Stocks & Commodities Dec 2009
My strategy modification.
WARNING:
- For purpose educate only
- This script to change bars colors.
Combo Backtest 123 Reversal & Directional Trend Index (DTI) This is combo strategies for get a cumulative signal.
First strategy
This System was created from the Book "How I Tripled My Money In The
Futures Market" by Ulf Jensen, Page 183. This is reverse type of strategies.
The strategy buys at market, if close price is higher than the previous close
during 2 days and the meaning of 9-days Stochastic Slow Oscillator is lower than 50.
The strategy sells at market, if close price is lower than the previous close price
during 2 days and the meaning of 9-days Stochastic Fast Oscillator is higher than 50.
Second strategy
This technique was described by William Blau in his book "Momentum,
Direction and Divergence" (1995). His book focuses on three key aspects
of trading: momentum, direction and divergence. Blau, who was an electrical
engineer before becoming a trader, thoroughly examines the relationship between
price and momentum in step-by-step examples. From this grounding, he then looks
at the deficiencies in other oscillators and introduces some innovative techniques,
including a fresh twist on Stochastics. On directional issues, he analyzes the
intricacies of ADX and offers a unique approach to help define trending and
non-trending periods.
Directional Trend Index is an indicator similar to DM+ developed by Welles Wilder.
The DM+ (a part of Directional Movement System which includes both DM+ and
DM- indicators) indicator helps determine if a security is "trending." William
Blau added to it a zeroline, relative to which the indicator is deemed positive or
negative. A stable uptrend is a period when the DTI value is positive and rising, a
downtrend when it is negative and falling.
WARNING:
- For purpose educate only
- This script to change bars colors.

Combo Strategy 123 Reversal & Directional Trend Index (DTI) This is combo strategies for get a cumulative signal.
First strategy
This System was created from the Book "How I Tripled My Money In The
Futures Market" by Ulf Jensen, Page 183. This is reverse type of strategies.
The strategy buys at market, if close price is higher than the previous close
during 2 days and the meaning of 9-days Stochastic Slow Oscillator is lower than 50.
The strategy sells at market, if close price is lower than the previous close price
during 2 days and the meaning of 9-days Stochastic Fast Oscillator is higher than 50.
Second strategy
This technique was described by William Blau in his book "Momentum,
Direction and Divergence" (1995). His book focuses on three key aspects
of trading: momentum, direction and divergence. Blau, who was an electrical
engineer before becoming a trader, thoroughly examines the relationship between
price and momentum in step-by-step examples. From this grounding, he then looks
at the deficiencies in other oscillators and introduces some innovative techniques,
including a fresh twist on Stochastics. On directional issues, he analyzes the
intricacies of ADX and offers a unique approach to help define trending and
non-trending periods.
Directional Trend Index is an indicator similar to DM+ developed by Welles Wilder.
The DM+ (a part of Directional Movement System which includes both DM+ and
DM- indicators) indicator helps determine if a security is "trending." William
Blau added to it a zeroline, relative to which the indicator is deemed positive or
negative. A stable uptrend is a period when the DTI value is positive and rising, a
downtrend when it is negative and falling.
WARNING:
- For purpose educate only
- This script to change bars colors.

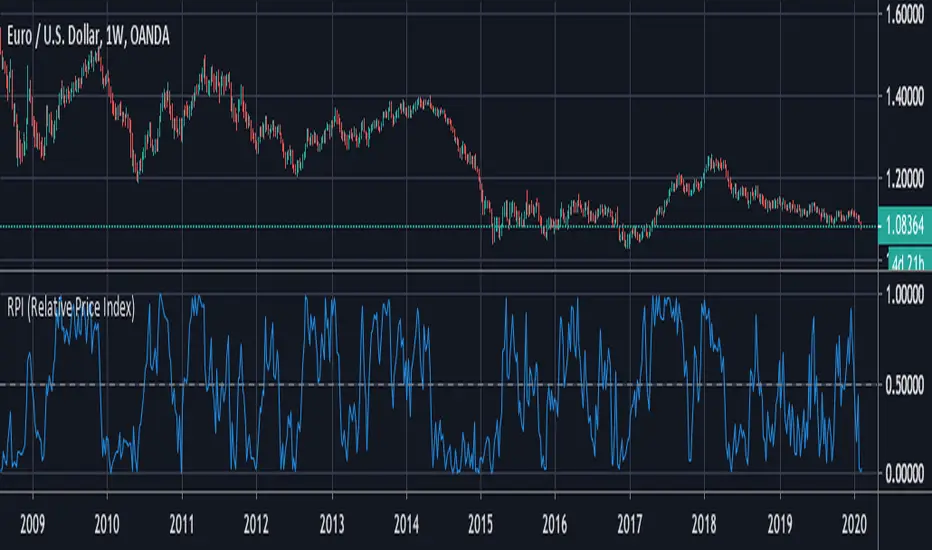
RPI (Relative Price Index)This is a free indicator created by Stormpike Group that displays the relative price of an underlying for the given period.
Volume Direction Force Index v1 - VDFI [wm]Essentially the same as TDFI. However, uses volume rather than price as the source data
Above filter high indicates increase in volume
Above filter low indicates drop off in volume
Orig TDFI:


Normalized Relative Strength Index with Bollinger band This Relative Strength Index with Bollinger band is to determine strength of momentum of certain price.
