DEMA Adjusted Average True Range [BackQuant]The use of the Double Exponential Moving Average (DEMA) within your Adjusted Average True Range (ATR) calculation serves as a cornerstone for enhancing the indicator's responsiveness to market changes. To delve deeper into why DEMA is employed specifically in the context of your ATR calculation, let's explore the inherent qualities of DEMA and its impact on the ATR's performance.
DEMA and Its Advantages
As previously mentioned, DEMA was designed to offer a more responsive alternative to the traditional Exponential Moving Average (EMA). By giving more weight to recent price data, DEMA reduces the lag typically associated with moving averages. This reduction in lag is especially beneficial for short-term traders looking to capitalize on trend reversals and other market movements as swiftly as possible.
The calculation of DEMA involves the following steps:
Calculate EMA1: This is the Exponential Moving Average of the price.
Calculate EMA2: This is the Exponential Moving Average of EMA1, thus it is a smoothing of a smoothing, leading to a greater lag.
Formulate DEMA: The formula
EMA1 = EMA of price
EMA2 = EMA of EMA1
DEMA = (2 x EMA1) - EMA2
effectively doubles the weighting of the most recent data points by subtracting the lagged, double-smoothed EMA2 from twice the single-smoothed EMA1.
This process enhances the moving average's sensitivity to recent price movements, allowing the DEMA to adhere more closely to the price bars than either EMA1 or EMA2 alone.
Integration with ATR
In the context of your ATR calculation, the integration of DEMA plays a crucial role in defining the indicator's core functionality. Here's a detailed explanation of how DEMA affects the ATR calculation:
Initial Determination of DEMA : By applying the DEMA formula to the chosen source data (which can be adjusted to use Heikin Ashi candle close prices for an even smoother analysis), you set a foundation for a more reactive trend-following mechanism within the ATR framework.
Application to ATR Bands : The calculated DEMA serves as the central line from which the ATR bands are derived. The ATR value, multiplied by a user-defined factor, is added to and subtracted from the DEMA to form the upper and lower bands, respectively. This dynamic adjustment not only reflects the volatility based on the ATR but does so in a way that is closely aligned with the most recent price action, thanks to the utilization of DEMA.
Enhanced Signal Quality : The responsiveness of DEMA ensures that the ATR bands adjust more promptly to changes in market conditions. This quality is vital for traders who rely on the ATR bands to identify potential entry and exit points, trend reversals, or to assess market volatility.
By employing DEMA as the core component in calculating the Adjusted Average True Range, your indicator leverages DEMA's reduced lag and increased weight on recent data to provide a more timely and accurate measure of market volatility. This innovative approach enhances the utility of the ATR by making it not only a tool for assessing volatility but also a more reactive indicator for trend analysis and trading signal generation.
The main concept of combining these is to reduce lag, get a more robust signal and still capture clear trends over medium time horizons.
For me, this is best used in confluence with other indicators, it can be made faster in order to get fasters response time, or slower. This is all depending on the needs of you as a trader.
User Inputs:
The script offers several user-configurable inputs, such as the period lengths for DEMA and ATR calculations, the multiplication factor for the ATR, and options to use Heikin Ashi candles or standard price data. Additionally, it allows for the toggling of visual features, like the plotting of the DEMA ATR and its moving average, and the application of color-coded trends on price bars.
Additional Features:
Moving Average Confluence: Traders can opt to display a moving average of the DEMA ATR, choosing from various types (e.g., SMA, EMA, HMA). This feature provides a layer of confluence, aiding in the identification of trend direction and strength.
Trend Identification :
The script employs logical conditions to ascertain the trend direction based on the movement of the DEMA ATR. It assigns colors to represent bullish or bearish trends, which are reflected in the plotted lines and the coloring of price bars.
Alerts :
Customizable alert conditions for trend reversals enhance the utility of the indicator for active trading, notifying users of significant changes in trend direction.
1D Backtests
We include these backtests as a general proxy for how they work.
Please do your own calibrating to suit it to your own needs and backtest.
Past results don't = future results but they can help you understand how it functions.
INDEX:BTCUSD
INDEX:ETHUSD
BINANCE:SOLUSD
Tìm kiếm tập lệnh với "index"

MomentumIndicatorsLibrary "MomentumIndicators"
This is a library of 'Momentum Indicators', also denominated as oscillators.
The purpose of this library is to organize momentum indicators in just one place, making it easy to access.
In addition, it aims to allow customized versions, not being restricted to just the price value.
An example of this use case is the popular Stochastic RSI.
# Indicators:
1. Relative Strength Index (RSI):
Measures the relative strength of recent price gains to recent price losses of an asset.
2. Rate of Change (ROC):
Measures the percentage change in price of an asset over a specified time period.
3. Stochastic Oscillator (Stoch):
Compares the current price of an asset to its price range over a specified time period.
4. True Strength Index (TSI):
Measures the price change, calculating the ratio of the price change (positive or negative) in relation to the
absolute price change.
The values of both are smoothed twice to reduce noise, and the final result is normalized
in a range between 100 and -100.
5. Stochastic Momentum Index (SMI):
Combination of the True Strength Index with a signal line to help identify turning points in the market.
6. Williams Percent Range (Williams %R):
Compares the current price of an asset to its highest high and lowest low over a specified time period.
7. Commodity Channel Index (CCI):
Measures the relationship between an asset's current price and its moving average.
8. Ultimate Oscillator (UO):
Combines three different time periods to help identify possible reversal points.
9. Moving Average Convergence/Divergence (MACD):
Shows the difference between short-term and long-term exponential moving averages.
10. Fisher Transform (FT):
Normalize prices into a Gaussian normal distribution.
11. Inverse Fisher Transform (IFT):
Transform the values of the Fisher Transform into a smaller and more easily interpretable scale is through the
application of an inverse transformation to the hyperbolic tangent function.
This transformation takes the values of the FT, which range from -infinity to +infinity, to a scale limited
between -1 and +1, allowing them to be more easily visualized and compared.
12. Premier Stochastic Oscillator (PSO):
Normalizes the standard stochastic oscillator by applying a five-period double exponential smoothing average of
the %K value, resulting in a symmetric scale of 1 to -1
# Indicators of indicators:
## Stochastic:
1. Stochastic of RSI (Relative Strengh Index)
2. Stochastic of ROC (Rate of Change)
3. Stochastic of UO (Ultimate Oscillator)
4. Stochastic of TSI (True Strengh Index)
5. Stochastic of Williams R%
6. Stochastic of CCI (Commodity Channel Index).
7. Stochastic of MACD (Moving Average Convergence/Divergence)
8. Stochastic of FT (Fisher Transform)
9. Stochastic of Volume
10. Stochastic of MFI (Money Flow Index)
11. Stochastic of On OBV (Balance Volume)
12. Stochastic of PVI (Positive Volume Index)
13. Stochastic of NVI (Negative Volume Index)
14. Stochastic of PVT (Price-Volume Trend)
15. Stochastic of VO (Volume Oscillator)
16. Stochastic of VROC (Volume Rate of Change)
## Inverse Fisher Transform:
1.Inverse Fisher Transform on RSI (Relative Strengh Index)
2.Inverse Fisher Transform on ROC (Rate of Change)
3.Inverse Fisher Transform on UO (Ultimate Oscillator)
4.Inverse Fisher Transform on Stochastic
5.Inverse Fisher Transform on TSI (True Strength Index)
6.Inverse Fisher Transform on CCI (Commodity Channel Index)
7.Inverse Fisher Transform on Fisher Transform (FT)
8.Inverse Fisher Transform on MACD (Moving Average Convergence/Divergence)
9.Inverse Fisher Transfor on Williams R% (Williams Percent Range)
10.Inverse Fisher Transfor on CMF (Chaikin Money Flow)
11.Inverse Fisher Transform on VO (Volume Oscillator)
12.Inverse Fisher Transform on VROC (Volume Rate of Change)
## Stochastic Momentum Index:
1.Stochastic Momentum Index of RSI (Relative Strength Index)
2.Stochastic Momentum Index of ROC (Rate of Change)
3.Stochastic Momentum Index of VROC (Volume Rate of Change)
4.Stochastic Momentum Index of Williams R% (Williams Percent Range)
5.Stochastic Momentum Index of FT (Fisher Transform)
6.Stochastic Momentum Index of CCI (Commodity Channel Index)
7.Stochastic Momentum Index of UO (Ultimate Oscillator)
8.Stochastic Momentum Index of MACD (Moving Average Convergence/Divergence)
9.Stochastic Momentum Index of Volume
10.Stochastic Momentum Index of MFI (Money Flow Index)
11.Stochastic Momentum Index of CMF (Chaikin Money Flow)
12.Stochastic Momentum Index of On Balance Volume (OBV)
13.Stochastic Momentum Index of Price-Volume Trend (PVT)
14.Stochastic Momentum Index of Volume Oscillator (VO)
15.Stochastic Momentum Index of Positive Volume Index (PVI)
16.Stochastic Momentum Index of Negative Volume Index (NVI)
## Relative Strength Index:
1. RSI for Volume
2. RSI for Moving Average
rsi(source, length)
RSI (Relative Strengh Index). Measures the relative strength of recent price gains to recent price losses of an asset.
Parameters:
source : (float) Source of series (close, high, low, etc.)
length : (int) Period of loopback
Returns: (float) Series of RSI
roc(source, length)
ROC (Rate of Change). Measures the percentage change in price of an asset over a specified time period.
Parameters:
source : (float) Source of series (close, high, low, etc.)
length : (int) Period of loopback
Returns: (float) Series of ROC
stoch(kLength, kSmoothing, dSmoothing, maTypeK, maTypeD, almaOffsetKD, almaSigmaKD, lsmaOffSetKD)
Stochastic Oscillator. Compares the current price of an asset to its price range over a specified time period.
Parameters:
kLength
kSmoothing : (int) Period for smoothig stochastic
dSmoothing : (int) Period for signal (moving average of stochastic)
maTypeK : (int) Type of Moving Average for Stochastic Oscillator
maTypeD : (int) Type of Moving Average for Stochastic Oscillator Signal
almaOffsetKD : (float) Offset for Arnaud Legoux Moving Average for Oscillator and Signal
almaSigmaKD : (float) Sigma for Arnaud Legoux Moving Average for Oscillator and Signal
lsmaOffSetKD : (int) Offset for Least Squares Moving Average for Oscillator and Signal
Returns: A tuple of Stochastic Oscillator and Moving Average of Stochastic Oscillator
stoch(source, kLength, kSmoothing, dSmoothing, maTypeK, maTypeD, almaOffsetKD, almaSigmaKD, lsmaOffSetKD)
Stochastic Oscillator. Customized source. Compares the current price of an asset to its price range over a specified time period.
Parameters:
source : (float) Source of series (close, high, low, etc.)
kLength : (int) Period of loopback to calculate the stochastic
kSmoothing : (int) Period for smoothig stochastic
dSmoothing : (int) Period for signal (moving average of stochastic)
maTypeK : (int) Type of Moving Average for Stochastic Oscillator
maTypeD : (int) Type of Moving Average for Stochastic Oscillator Signal
almaOffsetKD : (float) Offset for Arnaud Legoux Moving Average for Stoch and Signal
almaSigmaKD : (float) Sigma for Arnaud Legoux Moving Average for Stoch and Signal
lsmaOffSetKD : (int) Offset for Least Squares Moving Average for Stoch and Signal
Returns: A tuple of Stochastic Oscillator and Moving Average of Stochastic Oscillator
tsi(source, shortLength, longLength, maType, almaOffset, almaSigma, lsmaOffSet)
TSI (True Strengh Index). Measures the price change, calculating the ratio of the price change (positive or negative) in relation to the absolute price change.
The values of both are smoothed twice to reduce noise, and the final result is normalized in a range between 100 and -100.
Parameters:
source : (float) Source of series (close, high, low, etc.)
shortLength : (int) Short length
longLength : (int) Long length
maType : (int) Type of Moving Average for TSI
almaOffset : (float) Offset for Arnaud Legoux Moving Average
almaSigma : (float) Sigma for Arnaud Legoux Moving Average
lsmaOffSet : (int) Offset for Least Squares Moving Average
Returns: (float) TSI
smi(sourceTSI, shortLengthTSI, longLengthTSI, maTypeTSI, almaOffsetTSI, almaSigmaTSI, lsmaOffSetTSI, maTypeSignal, smoothingLengthSignal, almaOffsetSignal, almaSigmaSignal, lsmaOffSetSignal)
SMI (Stochastic Momentum Index). A TSI (True Strengh Index) plus a signal line.
Parameters:
sourceTSI : (float) Source of series for TSI (close, high, low, etc.)
shortLengthTSI : (int) Short length for TSI
longLengthTSI : (int) Long length for TSI
maTypeTSI : (int) Type of Moving Average for Signal of TSI
almaOffsetTSI : (float) Offset for Arnaud Legoux Moving Average
almaSigmaTSI : (float) Sigma for Arnaud Legoux Moving Average
lsmaOffSetTSI : (int) Offset for Least Squares Moving Average
maTypeSignal
smoothingLengthSignal
almaOffsetSignal
almaSigmaSignal
lsmaOffSetSignal
Returns: A tuple with TSI, signal of TSI and histogram of difference
wpr(source, length)
Williams R% (Williams Percent Range). Compares the current price of an asset to its highest high and lowest low over a specified time period.
Parameters:
source : (float) Source of series (close, high, low, etc.)
length : (int) Period of loopback
Returns: (float) Series of Williams R%
cci(source, length, maType, almaOffset, almaSigma, lsmaOffSet)
CCI (Commodity Channel Index). Measures the relationship between an asset's current price and its moving average.
Parameters:
source : (float) Source of series (close, high, low, etc.)
length : (int) Period of loopback
maType : (int) Type of Moving Average
almaOffset : (float) Offset for Arnaud Legoux Moving Average
almaSigma : (float) Sigma for Arnaud Legoux Moving Average
lsmaOffSet : (int) Offset for Least Squares Moving Average
Returns: (float) Series of CCI
ultimateOscillator(fastLength, middleLength, slowLength)
UO (Ultimate Oscilator). Combines three different time periods to help identify possible reversal points.
Parameters:
fastLength : (int) Fast period of loopback
middleLength : (int) Middle period of loopback
slowLength : (int) Slow period of loopback
Returns: (float) Series of Ultimate Oscilator
ultimateOscillator(source, fastLength, middleLength, slowLength)
UO (Ultimate Oscilator). Customized source. Combines three different time periods to help identify possible reversal points.
Parameters:
source : (float) Source of series (close, high, low, etc.)
fastLength : (int) Fast period of loopback
middleLength : (int) Middle period of loopback
slowLength : (int) Slow period of loopback
Returns: (float) Series of Ultimate Oscilator
macd(source, fastLength, slowLength, signalLength, maTypeFast, maTypeSlow, maTypeMACD, almaOffset, almaSigma, lsmaOffSet)
MACD (Moving Average Convergence/Divergence). Shows the difference between short-term and long-term exponential moving averages.
Parameters:
source : (float) Source of series (close, high, low, etc.)
fastLength : (int) Period for fast moving average
slowLength : (int) Period for slow moving average
signalLength : (int) Signal length
maTypeFast : (int) Type of fast moving average
maTypeSlow : (int) Type of slow moving average
maTypeMACD : (int) Type of MACD moving average
almaOffset : (float) Offset for Arnaud Legoux Moving Average
almaSigma : (float) Sigma for Arnaud Legoux Moving Average
lsmaOffSet : (int) Offset for Least Squares Moving Average
Returns: A tuple with MACD, Signal, and Histgram
fisher(length)
Fisher Transform. Normalize prices into a Gaussian normal distribution.
Parameters:
length
Returns: A tuple with Fisher Transform and signal
fisher(source, length)
Fisher Transform. Customized source. Normalize prices into a Gaussian normal distribution.
Parameters:
source : (float) Source of series (close, high, low, etc.)
length
Returns: A tuple with Fisher Transform and signal
inverseFisher(source, length, subtrahend, denominator)
Inverse Fisher Transform.
Transform the values of the Fisher Transform into a smaller and more easily interpretable scale is
through the application of an inverse transformation to the hyperbolic tangent function.
This transformation takes the values of the FT, which range from -infinity to +infinity,
to a scale limited between -1 and +1, allowing them to be more easily visualized and compared.
Parameters:
source : (float) Source of series (close, high, low, etc.)
length : (int) Period for loopback
subtrahend : (int) Denominator. Useful in unbounded indicators. For example, in CCI.
denominator
Returns: (float) Series of Inverse Fisher Transform
premierStoch(length, smoothlen)
Premier Stochastic Oscillator (PSO).
Normalizes the standard stochastic oscillator by applying a five-period double exponential smoothing
average of the %K value, resulting in a symmetric scale of 1 to -1.
Parameters:
length : (int) Period for loopback
smoothlen : (int) Period for smoothing
Returns: (float) Series of PSO
premierStoch(source, smoothlen, subtrahend, denominator)
Premier Stochastic Oscillator (PSO) of custom source.
Normalizes the source by applying a five-period double exponential smoothing average.
Parameters:
source : (float) Source of series (close, high, low, etc.)
smoothlen : (int) Period for smoothing
subtrahend : (int) Denominator. Useful in unbounded indicators. For example, in CCI.
denominator
Returns: (float) Series of PSO
stochRsi(sourceRSI, lengthRSI, kLength, kSmoothing, dSmoothing, maTypeK, maTypeD, almaOffsetKD, almaSigmaKD, lsmaOffSetKD)
Parameters:
sourceRSI
lengthRSI
kLength
kSmoothing
dSmoothing
maTypeK
maTypeD
almaOffsetKD
almaSigmaKD
lsmaOffSetKD
stochRoc(sourceROC, lengthROC, kLength, kSmoothing, dSmoothing, maTypeK, maTypeD, almaOffsetKD, almaSigmaKD, lsmaOffSetKD)
Parameters:
sourceROC
lengthROC
kLength
kSmoothing
dSmoothing
maTypeK
maTypeD
almaOffsetKD
almaSigmaKD
lsmaOffSetKD
stochUO(fastLength, middleLength, slowLength, kLength, kSmoothing, dSmoothing, maTypeK, maTypeD, almaOffsetKD, almaSigmaKD, lsmaOffSetKD)
Parameters:
fastLength
middleLength
slowLength
kLength
kSmoothing
dSmoothing
maTypeK
maTypeD
almaOffsetKD
almaSigmaKD
lsmaOffSetKD
stochTSI(source, shortLength, longLength, maType, almaOffset, almaSigma, lsmaOffSet, kLength, kSmoothing, dSmoothing, maTypeK, maTypeD, almaOffsetKD, almaSigmaKD, lsmaOffSetKD)
Parameters:
source
shortLength
longLength
maType
almaOffset
almaSigma
lsmaOffSet
kLength
kSmoothing
dSmoothing
maTypeK
maTypeD
almaOffsetKD
almaSigmaKD
lsmaOffSetKD
stochWPR(source, length, kLength, kSmoothing, dSmoothing, maTypeK, maTypeD, almaOffsetKD, almaSigmaKD, lsmaOffSetKD)
Parameters:
source
length
kLength
kSmoothing
dSmoothing
maTypeK
maTypeD
almaOffsetKD
almaSigmaKD
lsmaOffSetKD
stochCCI(source, length, maType, almaOffset, almaSigma, lsmaOffSet, kLength, kSmoothing, dSmoothing, maTypeK, maTypeD, almaOffsetKD, almaSigmaKD, lsmaOffSetKD)
Parameters:
source
length
maType
almaOffset
almaSigma
lsmaOffSet
kLength
kSmoothing
dSmoothing
maTypeK
maTypeD
almaOffsetKD
almaSigmaKD
lsmaOffSetKD
stochMACD(source, fastLength, slowLength, signalLength, maTypeFast, maTypeSlow, maTypeMACD, almaOffset, almaSigma, lsmaOffSet, kLength, kSmoothing, dSmoothing, maTypeK, maTypeD, almaOffsetKD, almaSigmaKD, lsmaOffSetKD)
Parameters:
source
fastLength
slowLength
signalLength
maTypeFast
maTypeSlow
maTypeMACD
almaOffset
almaSigma
lsmaOffSet
kLength
kSmoothing
dSmoothing
maTypeK
maTypeD
almaOffsetKD
almaSigmaKD
lsmaOffSetKD
stochFT(length, kLength, kSmoothing, dSmoothing, maTypeK, maTypeD, almaOffsetKD, almaSigmaKD, lsmaOffSetKD)
Parameters:
length
kLength
kSmoothing
dSmoothing
maTypeK
maTypeD
almaOffsetKD
almaSigmaKD
lsmaOffSetKD
stochVolume(kLength, kSmoothing, dSmoothing, maTypeK, maTypeD, almaOffsetKD, almaSigmaKD, lsmaOffSetKD)
Parameters:
kLength
kSmoothing
dSmoothing
maTypeK
maTypeD
almaOffsetKD
almaSigmaKD
lsmaOffSetKD
stochMFI(source, length, kLength, kSmoothing, dSmoothing, maTypeK, maTypeD, almaOffsetKD, almaSigmaKD, lsmaOffSetKD)
Parameters:
source
length
kLength
kSmoothing
dSmoothing
maTypeK
maTypeD
almaOffsetKD
almaSigmaKD
lsmaOffSetKD
stochOBV(source, kLength, kSmoothing, dSmoothing, maTypeK, maTypeD, almaOffsetKD, almaSigmaKD, lsmaOffSetKD)
Parameters:
source
kLength
kSmoothing
dSmoothing
maTypeK
maTypeD
almaOffsetKD
almaSigmaKD
lsmaOffSetKD
stochPVI(source, kLength, kSmoothing, dSmoothing, maTypeK, maTypeD, almaOffsetKD, almaSigmaKD, lsmaOffSetKD)
Parameters:
source
kLength
kSmoothing
dSmoothing
maTypeK
maTypeD
almaOffsetKD
almaSigmaKD
lsmaOffSetKD
stochNVI(source, kLength, kSmoothing, dSmoothing, maTypeK, maTypeD, almaOffsetKD, almaSigmaKD, lsmaOffSetKD)
Parameters:
source
kLength
kSmoothing
dSmoothing
maTypeK
maTypeD
almaOffsetKD
almaSigmaKD
lsmaOffSetKD
stochPVT(source, kLength, kSmoothing, dSmoothing, maTypeK, maTypeD, almaOffsetKD, almaSigmaKD, lsmaOffSetKD)
Parameters:
source
kLength
kSmoothing
dSmoothing
maTypeK
maTypeD
almaOffsetKD
almaSigmaKD
lsmaOffSetKD
stochVO(shortLen, longLen, maType, almaOffset, almaSigma, lsmaOffSet, kLength, kSmoothing, dSmoothing, maTypeK, maTypeD, almaOffsetKD, almaSigmaKD, lsmaOffSetKD)
Parameters:
shortLen
longLen
maType
almaOffset
almaSigma
lsmaOffSet
kLength
kSmoothing
dSmoothing
maTypeK
maTypeD
almaOffsetKD
almaSigmaKD
lsmaOffSetKD
stochVROC(length, kLength, kSmoothing, dSmoothing, maTypeK, maTypeD, almaOffsetKD, almaSigmaKD, lsmaOffSetKD)
Parameters:
length
kLength
kSmoothing
dSmoothing
maTypeK
maTypeD
almaOffsetKD
almaSigmaKD
lsmaOffSetKD
iftRSI(sourceRSI, lengthRSI, lengthIFT)
Parameters:
sourceRSI
lengthRSI
lengthIFT
iftROC(sourceROC, lengthROC, lengthIFT)
Parameters:
sourceROC
lengthROC
lengthIFT
iftUO(fastLength, middleLength, slowLength, lengthIFT)
Parameters:
fastLength
middleLength
slowLength
lengthIFT
iftStoch(kLength, kSmoothing, dSmoothing, maTypeK, maTypeD, almaOffsetKD, almaSigmaKD, lsmaOffSetKD, lengthIFT)
Parameters:
kLength
kSmoothing
dSmoothing
maTypeK
maTypeD
almaOffsetKD
almaSigmaKD
lsmaOffSetKD
lengthIFT
iftTSI(source, shortLength, longLength, maType, almaOffset, almaSigma, lsmaOffSet, lengthIFT)
Parameters:
source
shortLength
longLength
maType
almaOffset
almaSigma
lsmaOffSet
lengthIFT
iftCCI(source, length, maType, almaOffset, almaSigma, lsmaOffSet, lengthIFT)
Parameters:
source
length
maType
almaOffset
almaSigma
lsmaOffSet
lengthIFT
iftFisher(length, lengthIFT)
Parameters:
length
lengthIFT
iftMACD(source, fastLength, slowLength, signalLength, maTypeFast, maTypeSlow, maTypeMACD, almaOffset, almaSigma, lsmaOffSet, lengthIFT)
Parameters:
source
fastLength
slowLength
signalLength
maTypeFast
maTypeSlow
maTypeMACD
almaOffset
almaSigma
lsmaOffSet
lengthIFT
iftWPR(source, length, lengthIFT)
Parameters:
source
length
lengthIFT
iftMFI(source, length, lengthIFT)
Parameters:
source
length
lengthIFT
iftCMF(length, lengthIFT)
Parameters:
length
lengthIFT
iftVO(shortLen, longLen, maType, almaOffset, almaSigma, lsmaOffSet, lengthIFT)
Parameters:
shortLen
longLen
maType
almaOffset
almaSigma
lsmaOffSet
lengthIFT
iftVROC(length, lengthIFT)
Parameters:
length
lengthIFT
smiRSI(source, length, shortLengthTSI, longLengthTSI, maTypeTSI, almaOffsetTSI, almaSigmaTSI, lsmaOffSetTSI, maTypeSignal, smoothingLengthSignal, almaOffsetSignal, almaSigmaSignal, lsmaOffSetSignal)
Parameters:
source
length
shortLengthTSI
longLengthTSI
maTypeTSI
almaOffsetTSI
almaSigmaTSI
lsmaOffSetTSI
maTypeSignal
smoothingLengthSignal
almaOffsetSignal
almaSigmaSignal
lsmaOffSetSignal
smiROC(source, length, shortLengthTSI, longLengthTSI, maTypeTSI, almaOffsetTSI, almaSigmaTSI, lsmaOffSetTSI, maTypeSignal, smoothingLengthSignal, almaOffsetSignal, almaSigmaSignal, lsmaOffSetSignal)
Parameters:
source
length
shortLengthTSI
longLengthTSI
maTypeTSI
almaOffsetTSI
almaSigmaTSI
lsmaOffSetTSI
maTypeSignal
smoothingLengthSignal
almaOffsetSignal
almaSigmaSignal
lsmaOffSetSignal
smiVROC(length, shortLengthTSI, longLengthTSI, maTypeTSI, almaOffsetTSI, almaSigmaTSI, lsmaOffSetTSI, maTypeSignal, smoothingLengthSignal, almaOffsetSignal, almaSigmaSignal, lsmaOffSetSignal)
Parameters:
length
shortLengthTSI
longLengthTSI
maTypeTSI
almaOffsetTSI
almaSigmaTSI
lsmaOffSetTSI
maTypeSignal
smoothingLengthSignal
almaOffsetSignal
almaSigmaSignal
lsmaOffSetSignal
smiWPR(source, length, shortLengthTSI, longLengthTSI, maTypeTSI, almaOffsetTSI, almaSigmaTSI, lsmaOffSetTSI, maTypeSignal, smoothingLengthSignal, almaOffsetSignal, almaSigmaSignal, lsmaOffSetSignal)
Parameters:
source
length
shortLengthTSI
longLengthTSI
maTypeTSI
almaOffsetTSI
almaSigmaTSI
lsmaOffSetTSI
maTypeSignal
smoothingLengthSignal
almaOffsetSignal
almaSigmaSignal
lsmaOffSetSignal
smiFT(length, shortLengthTSI, longLengthTSI, maTypeTSI, almaOffsetTSI, almaSigmaTSI, lsmaOffSetTSI, maTypeSignal, smoothingLengthSignal, almaOffsetSignal, almaSigmaSignal, lsmaOffSetSignal)
Parameters:
length
shortLengthTSI
longLengthTSI
maTypeTSI
almaOffsetTSI
almaSigmaTSI
lsmaOffSetTSI
maTypeSignal
smoothingLengthSignal
almaOffsetSignal
almaSigmaSignal
lsmaOffSetSignal
smiFT(source, length, shortLengthTSI, longLengthTSI, maTypeTSI, almaOffsetTSI, almaSigmaTSI, lsmaOffSetTSI, maTypeSignal, smoothingLengthSignal, almaOffsetSignal, almaSigmaSignal, lsmaOffSetSignal)
Parameters:
source
length
shortLengthTSI
longLengthTSI
maTypeTSI
almaOffsetTSI
almaSigmaTSI
lsmaOffSetTSI
maTypeSignal
smoothingLengthSignal
almaOffsetSignal
almaSigmaSignal
lsmaOffSetSignal
smiCCI(source, length, maTypeCCI, almaOffsetCCI, almaSigmaCCI, lsmaOffSetCCI, shortLengthTSI, longLengthTSI, maTypeTSI, almaOffsetTSI, almaSigmaTSI, lsmaOffSetTSI, maTypeSignal, smoothingLengthSignal, almaOffsetSignal, almaSigmaSignal, lsmaOffSetSignal)
Parameters:
source
length
maTypeCCI
almaOffsetCCI
almaSigmaCCI
lsmaOffSetCCI
shortLengthTSI
longLengthTSI
maTypeTSI
almaOffsetTSI
almaSigmaTSI
lsmaOffSetTSI
maTypeSignal
smoothingLengthSignal
almaOffsetSignal
almaSigmaSignal
lsmaOffSetSignal
smiUO(fastLength, middleLength, slowLength, shortLengthTSI, longLengthTSI, maTypeTSI, almaOffsetTSI, almaSigmaTSI, lsmaOffSetTSI, maTypeSignal, smoothingLengthSignal, almaOffsetSignal, almaSigmaSignal, lsmaOffSetSignal)
Parameters:
fastLength
middleLength
slowLength
shortLengthTSI
longLengthTSI
maTypeTSI
almaOffsetTSI
almaSigmaTSI
lsmaOffSetTSI
maTypeSignal
smoothingLengthSignal
almaOffsetSignal
almaSigmaSignal
lsmaOffSetSignal
smiMACD(source, fastLength, slowLength, signalLength, maTypeFast, maTypeSlow, maTypeMACD, almaOffset, almaSigma, lsmaOffSet, shortLengthTSI, longLengthTSI, maTypeTSI, almaOffsetTSI, almaSigmaTSI, lsmaOffSetTSI, maTypeSignal, smoothingLengthSignal, almaOffsetSignal, almaSigmaSignal, lsmaOffSetSignal)
Parameters:
source
fastLength
slowLength
signalLength
maTypeFast
maTypeSlow
maTypeMACD
almaOffset
almaSigma
lsmaOffSet
shortLengthTSI
longLengthTSI
maTypeTSI
almaOffsetTSI
almaSigmaTSI
lsmaOffSetTSI
maTypeSignal
smoothingLengthSignal
almaOffsetSignal
almaSigmaSignal
lsmaOffSetSignal
smiVol(shortLengthTSI, longLengthTSI, maTypeTSI, almaOffsetTSI, almaSigmaTSI, lsmaOffSetTSI, maTypeSignal, smoothingLengthSignal, almaOffsetSignal, almaSigmaSignal, lsmaOffSetSignal)
Parameters:
shortLengthTSI
longLengthTSI
maTypeTSI
almaOffsetTSI
almaSigmaTSI
lsmaOffSetTSI
maTypeSignal
smoothingLengthSignal
almaOffsetSignal
almaSigmaSignal
lsmaOffSetSignal
smiMFI(source, length, shortLengthTSI, longLengthTSI, maTypeTSI, almaOffsetTSI, almaSigmaTSI, lsmaOffSetTSI, maTypeSignal, smoothingLengthSignal, almaOffsetSignal, almaSigmaSignal, lsmaOffSetSignal)
Parameters:
source
length
shortLengthTSI
longLengthTSI
maTypeTSI
almaOffsetTSI
almaSigmaTSI
lsmaOffSetTSI
maTypeSignal
smoothingLengthSignal
almaOffsetSignal
almaSigmaSignal
lsmaOffSetSignal
smiCMF(length, shortLengthTSI, longLengthTSI, maTypeTSI, almaOffsetTSI, almaSigmaTSI, lsmaOffSetTSI, maTypeSignal, smoothingLengthSignal, almaOffsetSignal, almaSigmaSignal, lsmaOffSetSignal)
Parameters:
length
shortLengthTSI
longLengthTSI
maTypeTSI
almaOffsetTSI
almaSigmaTSI
lsmaOffSetTSI
maTypeSignal
smoothingLengthSignal
almaOffsetSignal
almaSigmaSignal
lsmaOffSetSignal
smiOBV(source, shortLengthTSI, longLengthTSI, maTypeTSI, almaOffsetTSI, almaSigmaTSI, lsmaOffSetTSI, maTypeSignal, smoothingLengthSignal, almaOffsetSignal, almaSigmaSignal, lsmaOffSetSignal)
Parameters:
source
shortLengthTSI
longLengthTSI
maTypeTSI
almaOffsetTSI
almaSigmaTSI
lsmaOffSetTSI
maTypeSignal
smoothingLengthSignal
almaOffsetSignal
almaSigmaSignal
lsmaOffSetSignal
smiPVT(source, shortLengthTSI, longLengthTSI, maTypeTSI, almaOffsetTSI, almaSigmaTSI, lsmaOffSetTSI, maTypeSignal, smoothingLengthSignal, almaOffsetSignal, almaSigmaSignal, lsmaOffSetSignal)
Parameters:
source
shortLengthTSI
longLengthTSI
maTypeTSI
almaOffsetTSI
almaSigmaTSI
lsmaOffSetTSI
maTypeSignal
smoothingLengthSignal
almaOffsetSignal
almaSigmaSignal
lsmaOffSetSignal
smiVO(shortLen, longLen, maType, almaOffset, almaSigma, lsmaOffSet, shortLengthTSI, longLengthTSI, maTypeTSI, almaOffsetTSI, almaSigmaTSI, lsmaOffSetTSI, maTypeSignal, smoothingLengthSignal, almaOffsetSignal, almaSigmaSignal, lsmaOffSetSignal)
Parameters:
shortLen
longLen
maType
almaOffset
almaSigma
lsmaOffSet
shortLengthTSI
longLengthTSI
maTypeTSI
almaOffsetTSI
almaSigmaTSI
lsmaOffSetTSI
maTypeSignal
smoothingLengthSignal
almaOffsetSignal
almaSigmaSignal
lsmaOffSetSignal
smiPVI(source, shortLengthTSI, longLengthTSI, maTypeTSI, almaOffsetTSI, almaSigmaTSI, lsmaOffSetTSI, maTypeSignal, smoothingLengthSignal, almaOffsetSignal, almaSigmaSignal, lsmaOffSetSignal)
Parameters:
source
shortLengthTSI
longLengthTSI
maTypeTSI
almaOffsetTSI
almaSigmaTSI
lsmaOffSetTSI
maTypeSignal
smoothingLengthSignal
almaOffsetSignal
almaSigmaSignal
lsmaOffSetSignal
smiNVI(source, shortLengthTSI, longLengthTSI, maTypeTSI, almaOffsetTSI, almaSigmaTSI, lsmaOffSetTSI, maTypeSignal, smoothingLengthSignal, almaOffsetSignal, almaSigmaSignal, lsmaOffSetSignal)
Parameters:
source
shortLengthTSI
longLengthTSI
maTypeTSI
almaOffsetTSI
almaSigmaTSI
lsmaOffSetTSI
maTypeSignal
smoothingLengthSignal
almaOffsetSignal
almaSigmaSignal
lsmaOffSetSignal
rsiVolume(length)
Parameters:
length
rsiMA(sourceMA, lengthMA, maType, almaOffset, almaSigma, lsmaOffSet, lengthRSI)
Parameters:
sourceMA
lengthMA
maType
almaOffset
almaSigma
lsmaOffSet
lengthRSI

Grenblatt Magic FormulaThe magic formula is an investing strategy created by Joel Greenblatt that focuses on finding the best price to buy certain companies in order to maximize returns. When Greenblatt coined the term magic formula investing, his portfolio had a return of 24% from 1998 to 2009.
This means that $10,000 invested at 24% for the period would have turned into just over $1 million. A fund based on the S&P 500 index for the same period would have turned that $10,000 into just under $75,000.1
Note
Bigger returns matter, especially over long periods, due to the power of compounding.
Others who ran their own experiments were not able to duplicate Greenblatt's high returns but still yielded positive results. As a result, investing experts agree that the strategy of magic formula investing outperforms the indexes. In most cases, though, it doesn't seem to beat indexes by as much as Greenblatt indicated when he introduced the concept in his book, The Little Book That Beats the Market.
There are two ratios in the magic formula. The first is the earnings yield: EBIT /EV. This is earnings before interest and taxes divided by enterprise value.A simpler and more common version of this ratio is earnings /price. Greenblatt prefers EBIT over earnings , because EBIT more accurately compares companies with different tax rates. EV is preferred to share price because EV also factors in the company's debt. Therefore, EBIT /EV provides a better picture of overall earnings than earnings /price.
The second ratio is return on capital, which is EBIT /(Net Fixed Assets + Working Capital)
The first ratio looks at earnings before interest and taxes compared to enterprise value. The second ratio focuses on the earnings relative to tangible assets. Many assets listed on the balance sheet depreciate over time as their usefulness is used up. These types of assets are called "fixed assets."
Net fixed assets are fixed assets minus all the accumulated depreciation and any liabilities associated with the asset. This gives a more accurate sense of the real value of a company's assets, compared to just looking at the total asset number on the balance sheet . Working capital is also part of this ratio and is current assets minus current liabilities. This gives a picture of whether the company is likely able to continue operations in the short term.
While the two ratios in the magic formula look small, they actually are computing a lot of data about the inner workings of a company, including:
Earnings
Interest
Tax rates
Equity price
Debt
Depreciation of assets
Current assets
Current liabilities
Rate Of Change Trend Strategy (ROC)This is very simple trend following or momentum strategy. If the price change over the past number of bars is positive, we buy. If the price change over the past number of bars is negative, we sell. This is surprisingly robust, simple, and effective especially on trendy markets such as cryptos.
Works for many markets such as:
INDEX:BTCUSD
INDEX:ETHUSD
SP:SPX
NASDAQ:NDX
NASDAQ:TSLA

fontilabLibrary "fontilab"
Provides function's indicators for pivot - trend - resistance.
pivots(src, lenght, isHigh) Detecting pivot points (and returning price + bar index.
Parameters:
src : The chart we analyse.
lenght : Used for the calcul.
isHigh : lookging for high if true, low otherwise.
Returns: The bar index and the price of the pivot.
calcDevThreshold(tresholdMultiplier, closePrice) Calculate deviation threshold for identifying major swings.
Parameters:
tresholdMultiplier : Usefull to equilibrate the calculate.
closePrice : Close price of the chart wanted.
Returns: The deviation threshold.
calcDev(basePrice, price) Custom function for calculating price deviation for validating large moves.
Parameters:
basePrice : The reference price.
price : The price tested.
Returns: The deviation.
pivotFoundWithLines(dev, isHigh, index, price, dev_threshold, isHighLast, pLast, iLast, lineLast) Detecting pivots that meet our deviation criteria.
Parameters:
dev : The deviation wanted.
isHigh : The type of pivot tested (high or low).
index : The Index of the pivot tested.
price : The chart price wanted.
dev_threshold : The deviation treshold.
isHighLast : The type of last pivot.
pLast : The pivot price last.
iLast : Index of the last pivot.
lineLast : The lst line.
Returns: The Line and bool is pivot High.
getDeviationPivots(thresholdMultiplier, depth, lineLast, isHighLast, iLast, pLast, deleteLines, closePrice, highPrice, lowPrice) Get pivot that meet our deviation criteria.
Parameters:
thresholdMultiplier : The treshold multiplier.
depth : The depth to calculate pivot.
lineLast : The last line.
isHighLast : The type of last pivot
iLast : Index of the last pivot.
pLast : The pivot price last.
deleteLines : If the line are draw or not.
closePrice : The chart close price.
highPrice : The chart high price.
lowPrice : The chart low price.
Returns: All pivot the informations.
getElIntArrayFromEnd() Get the last element of an int array.
getElFloatArrayFromEnd() Get the last element of an float array.
getElBoolArrayFromEnd() Get the last element of a bool array.
isTrendContinuation(isTrendUp, arrayBounds, lastPrice, precision) Check if last price is between bounds array.
Parameters:
isTrendUp : Is actual trend up.
arrayBounds : The trend array.
lastPrice : The pivot Price that just be found.
precision : The percent we add to actual bounds to validate a move.
Returns: na if price is between bounds, true if continuation, false if not.
getTrendPivots(trendBarIndexes, trendPrices, trendPricesIsHigh, interBarIndexes, interPrices, interPricesIsHigh, isTrendHesitate, isTrendUp, trendPrecision, pLast, iLast, isHighLast) Function to update array and trend related to pivot trend interpretation.
Parameters:
trendBarIndexes : The array trend bar index.
trendPrices : The array trend price.
trendPricesIsHigh : The array trend is high.
interBarIndexes : The array inter bar index.
interPrices : The array inter price.
interPricesIsHigh : The array inter ishigh.
isTrendHesitate : The actual status of is trend hesitate.
isTrendUp : The actual status of is trend up.
trendPrecision : The var precision to add in "iscontinuation" function.
pLast : The last pivot price.
iLast : The last pivot bar index.
isHighLast : The last pivot "isHigh".
Returns: trend & inter arrays, is trend hesitate, is trend up.
drawBoundLines(startIndex, startPrice, endIndex, endPrice, breakingPivotIndex, breakingPivotPrice, isTrendUp) Draw bounds and breaking line of the trend.
Parameters:
startIndex : Index of the first bound line.
startPrice : Price of first bound line.
endIndex : Index of second bound line.
endPrice : price of second bound line.
breakingPivotIndex : The breaking line index.
breakingPivotPrice : The breaking line price.
isTrendUp : The actual status of the trend.
Returns: The lines bounds and breaking line.

BTC Golden Bottom with Adaptive Moving AverageIntroduction:
This study uses Adaptive Moving Average with 1 year of length to plot on all time history Index Calculated by Tradingview . All previous $BTC bear runs bottomed on this curve which makes it important enough. Use this only on " "
Default Values:
AMA length is 1 year
Minor length is 50
Major length is 100

Pinescript - Common Label & Line Array Functions Library by RRBPinescript - Common Label & Line Array Functions Library by RagingRocketBull 2021
Version 1.0
This script provides a library of common array functions for arrays of label and line objects with live testing of all functions.
Using this library you can easily create, update, delete, join label/line object arrays, and get/set properties of individual label/line object array items.
You can find the full list of supported label/line array functions below.
There are several libraries:
- Common String Functions Library
- Standard Array Functions Library
- Common Fixed Type Array Functions Library
- Common Label & Line Array Functions Library
- Common Variable Type Array Functions Library
Features:
- 30 array functions in categories create/update/delete/join/get/set with support for both label/line objects (45+ including all implementations)
- Create, Update label/line object arrays from list/array params
- GET/SET properties of individual label/line array items by index
- Join label/line objects/arrays into a single string for output
- Supports User Input of x,y coords of 5 different types: abs/rel/rel%/inc/inc% list/array, auto transforms x,y input into list/array based on type, base and xloc, translates rel into abs bar indexes
- Supports User Input of lists with shortened names of string properties, auto expands all standard string properties to their full names for use in functions
- Live Output for all/selected functions based on User Input. Test any function for possible errors you may encounter before using in script.
- Output filters: hide all excluded and show only allowed functions using a list of function names
- Output Panel customization options: set custom style, color, text size, and line spacing
Usage:
- select create function - create label/line arrays from lists or arrays (optional). Doesn't affect the update functions. The only change in output should be function name regardless of the selected implementation.
- specify num_objects for both label/line arrays (default is 7)
- specify common anchor point settings x,y base/type for both label/line arrays and GET/SET items in Common Settings
- fill lists with items to use as inputs for create label/line array functions in Create Label/Line Arrays section
- specify label/line array item index and properties to SET in corresponding sections
- select label/line SET function to see the changes applied live
Code Structure:
- translate x,y depending on x,y type, base and xloc as specified in UI (required for all functions)
- expand all shortened standard property names to full names (required for create/update* from arrays and set* functions, not needed for create/update* from lists) to prevent errors in label.new and line.new
- create param arrays from string lists (required for create/update* from arrays and set* functions, not needed for create/update* from lists)
- create label/line array from string lists (property names are auto expanded) or param arrays (requires already expanded properties)
- update entire label/line array or
- get/set label/line array item properties by index
Transforming/Expanding Input values:
- for this script to work on any chart regardless of price/scale, all x*,y* are specified as % increase relative to x0,y0 base levels by default, but user can enter abs x,price values specific for that chart if necessary.
- all lists can be empty, contain 1 or several items, have the same/different lengths. Array Length = min(min(len(list*)), mum_objects) is used to create label/line objects. Missing list items are replaced with default property values.
- when a list contains only 1 item it is duplicated (label name/tooltip is also auto incremented) to match the calculated Array Length
- since this script processes user input, all x,y values must be translated to abs bar indexes before passing them to functions. Your script may provide all data internally and doesn't require this step.
- at first int x, float y arrays are created from user string lists, transformed as described below and returned as x,y arrays.
- translated x,y arrays can then be passed to create from arrays function or can be converted back to x,y string lists for the create from lists function if necessary.
- all translation logic is separated from create/update/set functions for the following reasons:
- to avoid redundant code/dependency on ext functions/reduce local scopes and to be able to translate everything only once in one place - should be faster
- to simplify internal logic of all functions
- because your script may provide all data internally without user input and won't need the translation step
- there are 5 types available for both x,y: abs, rel, rel%, inc, inc%. In addition to that, x can be: bar index or time, y is always price.
- abs - absolute bar index/time from start bar0 (x) or price (y) from 0, is >= 0
- rel - relative bar index/time from cur bar n (x) or price from y0 base level, is >= 0
- rel% - relative % increase of bar index/time (x) or price (y) from corresponding base level (x0 or y0), can be <=> 0
- inc - relative increment (step) for each new level of bar index/time (x) or price (y) from corresponding base level (x0 or y0), can be <=> 0
- inc% - relative % increment (% step) for each new level of bar index/time (x) or price (y) from corresponding base level (x0 or y0), can be <=> 0
- x base level >= 0
- y base level can be 0 (empty) or open, close, high, low of cur bar
- single item x1_list = "50" translates into:
- for x type abs: "50, 50, 50 ..." num_objects times regardless of xloc => x = 50
- for x type rel: "50, 50, 50 ... " num_objects times => x = x_base + 50
- for x type rel%: "50%, 50%, 50% ... " num_objects times => x_base * (1 + 0.5)
- for x type inc: "0, 50, 100 ... " num_objects times => x_base + 50 * i
- for x type inc%: "0%, 50%, 100% ... " num_objects times => x_base * (1 + 0.5 * i)
- when xloc = xloc.bar_index each rel*/inc* value in the above list is then subtracted from n: n - x to convert rel to abs bar index, values of abs type are not affected
- x1_list = "0, 50, 100, ..." of type rel is the same as "50" of type inc
- x1_list = "50, 50, 50, ..." of type abs/rel/rel% produces a sequence of the same values and can be shortened to just "50"
- single item y1_list = "2" translates into (ragardless of yloc):
- for y type abs: "2, 2, 2 ..." num_objects times => y = 2
- for y type rel: "2, 2, 2 ... " num_objects times => y = y_base + 2
- for y type rel%: "2%, 2%, 2% ... " num_objects times => y = y_base * (1 + 0.02)
- for y type inc: "0, 2, 4 ... " num_objects times => y = y_base + 2 * i
- for y type inc%: "0%, 2%, 4% ... " num_objects times => y = y_base * (1 + 0.02 * i)
- when yloc != yloc.price all calculated values above are simply ignored
- y1_list = "0, 2, 4" of type rel% is the same as "2" with type inc%
- y1_list = "2, 2, 2" of type abs/rel/rel% produces a sequence of the same values and can be shortened to just "2"
- you can enter shortened property names in lists. To lookup supported shortened names use corresponding dropdowns in Set Label/Line Array Item Properties sections
- all shortened standard property names must be expanded to full names (required for create/update* from arrays and set* functions, not needed for create/update* from lists) to prevent errors in label.new and line.new
- examples of shortened property names that can be used in lists: bar_index, large, solid, label_right, white, left, left, price
- expanded to their corresponding full names: xloc.bar_index, size.large, line.style_solid, label.style_label_right, color.white, text.align_left, extend.left, yloc.price
- all expanding logic is separated from create/update* from arrays and set* functions for the same reasons as above, and because param arrays already have different types, implying the use of final values.
- all expanding logic is included in the create/update* from lists functions because it seemed more natural to process string lists from user input directly inside the function, since they are already strings.
Creating Label/Line Objects:
- use study max_lines_count and max_labels_count params to increase the max number of label/line objects to 500 (+3) if necessary. Default number of label/line objects is 50 (+3)
- all functions use standard param sequence from methods in reference, except style always comes before colors.
- standard label/line.get* functions only return a few properties, you can't read style, color, width etc.
- label.new(na, na, "") will still create a label with x = n-301, y = NaN, text = "" because max default scope for a var is 300 bars back.
- there are 2 types of color na, label color requires color(na) instead of color_na to prevent error. text_color and line_color can be color_na
- for line to be visible both x1, x2 ends must be visible on screen, also when y1 == y2 => abs(x1 - x2) >= 2 bars => line is visible
- xloc.bar_index line uses abs x1, x2 indexes and can only be within 0 and n ends, where n <= 5000 bars (free accounts) or 10000 bars (paid accounts) limit, can't be plotted into the future
- xloc.bar_time line uses abs x1, x2 times, can't go past bar0 time but can continue past cur bar time into the future, doesn't have a length limit in bars.
- xloc.bar_time line with length = exact number of bars can be plotted only within bar0 and cur bar, can't be plotted into the future reliably because of future gaps due to sessions on some charts
- xloc.bar_index line can't be created on bar 0 with fixed length value because there's only 1 bar of horiz length
- it can be created on cur bar using fixed length x < n <= 5000 or
- created on bar0 using na and then assigned final x* values on cur bar using set_x*
- created on bar0 using n - fixed_length x and then updated on cur bar using set_x*, where n <= 5000
- default orientation of lines (for style_arrow* and extend) is from left to right (from bar 50 to bar 0), it reverses when x1 and x2 are swapped
- price is a function, not a line object property
Variable Type Arrays:
- you can't create an if/function that returns var type value/array - compiler uses strict types and doesn't allow that
- however you can assign array of any type to another array of any type creating an arr pointer of invalid type that must be reassigned to a matching array type before used in any expression to prevent error
- create_any_array2 uses this loophole to return an int_arr pointer of a var type array
- this works for all array types defined with/without var keyword and doesn't work for string arrays defined with var keyword for some reason
- you can't do this with var type vars, only var type arrays because arrays are pointers passed by reference, while vars are actual values passed by value.
- you can only pass a var type value/array param to a function if all functions inside support every type - otherwise error
- alternatively values of every type must be passed simultaneously and processed separately by corresponding if branches/functions supporting these particular types returning a common single type result
- get_var_types solves this problem by generating a list of dummy values of every possible type including the source type, tricking the compiler into allowing a single valid branch to execute without error, while ignoring all dummy results
Notes:
- uses Pinescript v3 Compatibility Framework
- uses Common String Functions Library, Common Fixed Type Array Functions Library, Common Variable Type Array Functions Library
- has to be a separate script to reduce the number of local scopes/compiled file size, can't be merged with another library.
- lets you live test all label/line array functions for errors. If you see an error - change params in UI
- if you see "Loop too long" error - hide/unhide or reattach the script
- if you see "Chart references too many candles" error - change x type or value between abs/rel*. This can happen on charts with 5000+ bars when a rel bar index x is passed to label.new or line.new instead of abs bar index n - x
- create/update_label/line_array* use string lists, while create/update_label/line_array_from_arrays* use array params to create label/line arrays. "from_lists" is dropped to shorten the names of the most commonly used functions.
- create_label/line_array2,4 are preferable, 5,6 are listed for pure demonstration purposes only - don't use them, they don't improve anything but dramatically increase local scopes/compiled file size
- for this reason you would mainly be using create/update_label/line_array2,4 for list params or create/update_label/line_array_from_arrays2 for array params
- all update functions are executed after each create as proof of work and can be disabled. Only create functions are required. Use update functions when necessary - when list/array params are changed by your script.
- both lists and array item properties use the same x,y_type, x,y_base from common settings
- doesn't use pagination, a single str contains all output
- why is this so complicated? What are all these functions for?
- this script merges standard label/line object methods with standard array functions to create a powerful set of label/line object array functions to simplify manipulation of these arrays.
- this library also extends the functionality of Common Variable Type Array Functions Library providing support for label/line types in var type array functions (any_to_str6, join_any_array5)
- creating arrays from either lists or arrays adds a level of flexibility that comes with complexity. It's very likely that in your script you'd have to deal with both string lists as input, and arrays internally, once everything is converted.
- processing user input, allowing customization and targeting for any chart adds a whole new layer of complexity, all inputs must be translated and expanded before used in functions.
- different function implementations can increase/reduce local scopes and compiled file size. Select a version that best suits your needs. Creating complex scripts often requires rewriting your code multiple times to fit the limits, every line matters.
P.S. Don't rely too much on labels, for too often they are fables.
List of functions*:
* - functions from other libraries are not listed
1. Join Functions
Labels
- join_label_object(label_, d1, d2)
- join_label_array(arr, d1, d2)
- join_label_array2(arr, d1, d2, d3)
Lines
- join_line_object(line_, d1, d2)
- join_line_array(arr, d1, d2)
- join_line_array2(arr, d1, d2, d3)
Any Type
- any_to_str6(arr, index, type)
- join_any_array4(arr, d1, d2, type)
- join_any_array5(arr, d, type)
2. GET/SET Functions
Labels
- label_array_get_text(arr, index)
- label_array_get_xy(arr, index)
- label_array_get_fields(arr, index)
- label_array_set_text(arr, index, str)
- label_array_set_xy(arr, index, x, y)
- label_array_set_fields(arr, index, x, y, str)
- label_array_set_all_fields(arr, index, x, y, str, xloc, yloc, label_style, label_color, text_color, text_size, text_align, tooltip)
- label_array_set_all_fields2(arr, index, x, y, str, xloc, yloc, label_style, label_color, text_color, text_size, text_align, tooltip)
Lines
- line_array_get_price(arr, index, bar)
- line_array_get_xy(arr, index)
- line_array_get_fields(arr, index)
- line_array_set_text(arr, index, width)
- line_array_set_xy(arr, index, x1, y1, x2, y2)
- line_array_set_fields(arr, index, x1, y1, x2, y2, width)
- line_array_set_all_fields(arr, index, x1, y1, x2, y2, xloc, extend, line_style, line_color, width)
- line_array_set_all_fields2(arr, index, x1, y1, x2, y2, xloc, extend, line_style, line_color, width)
3. Create/Update/Delete Functions
Labels
- delete_label_array(label_arr)
- create_label_array(list1, list2, list3, list4, list5, d)
- create_label_array2(x_list, y_list, str_list, xloc_list, yloc_list, style_list, color1_list, color2_list, size_list, align_list, tooltip_list, d)
- create_label_array3(x_list, y_list, str_list, xloc_list, yloc_list, style_list, color1_list, color2_list, size_list, align_list, tooltip_list, d)
- create_label_array4(x_list, y_list, str_list, xloc_list, yloc_list, style_list, color1_list, color2_list, size_list, align_list, tooltip_list, d)
- create_label_array5(x_list, y_list, str_list, xloc_list, yloc_list, style_list, color1_list, color2_list, size_list, align_list, tooltip_list, d)
- create_label_array6(x_list, y_list, str_list, xloc_list, yloc_list, style_list, color1_list, color2_list, size_list, align_list, tooltip_list, d)
- update_label_array2(label_arr, x_list, y_list, str_list, xloc_list, yloc_list, style_list, color1_list, color2_list, size_list, align_list, tooltip_list, d)
- update_label_array4(label_arr, x_list, y_list, str_list, xloc_list, yloc_list, style_list, color1_list, color2_list, size_list, align_list, tooltip_list, d)
- create_label_array_from_arrays2(x_arr, y_arr, str_arr, xloc_arr, yloc_arr, style_arr, color1_arr, color2_arr, size_arr, align_arr, tooltip_arr, d)
- create_label_array_from_arrays4(x_arr, y_arr, str_arr, xloc_arr, yloc_arr, style_arr, color1_arr, color2_arr, size_arr, align_arr, tooltip_arr, d)
- update_label_array_from_arrays2(label_arr, x_arr, y_arr, str_arr, xloc_arr, yloc_arr, style_arr, color1_arr, color2_arr, size_arr, align_arr, tooltip_arr, d)
Lines
- delete_line_array(line_arr)
- create_line_array(list1, list2, list3, list4, list5, list6, d)
- create_line_array2(x1_list, y1_list, x2_list, y2_list, xloc_list, extend_list, style_list, color_list, width_list, d)
- create_line_array3(x1_list, y1_list, x2_list, y2_list, xloc_list, extend_list, style_list, color_list, width_list, d)
- create_line_array4(x1_list, y1_list, x2_list, y2_list, xloc_list, extend_list, style_list, color_list, width_list, d)
- create_line_array5(x1_list, y1_list, x2_list, y2_list, xloc_list, extend_list, style_list, color_list, width_list, d)
- create_line_array6(x1_list, y1_list, x2_list, y2_list, xloc_list, extend_list, style_list, color_list, width_list, d)
- update_line_array2(line_arr, x1_list, y1_list, x2_list, y2_list, xloc_list, extend_list, style_list, color_list, width_list, d)
- update_line_array4(line_arr, x1_list, y1_list, x2_list, y2_list, xloc_list, extend_list, style_list, color_list, width_list, d)
- create_line_array_from_arrays2(x1_arr, y1_arr, x2_arr, y2_arr, xloc_arr, extend_arr, style_arr, color_arr, width_arr, d)
- update_line_array_from_arrays2(line_arr, x1_arr, y1_arr, x2_arr, y2_arr, xloc_arr, extend_arr, style_arr, color_arr, width_arr, d)

Aroon Oscillator strategy by SauciusThis strategy suits better for stock, indexes and commodities sufficiently volatile but with not so strong trend, where perspective of future quotations are not so certain.
For these financial instruments this system works better than others based on classical trend oscillator (like Supertrend)
This strategy starts from the idea of the creator of Aroon lines, Tushar Chande, whose suggested to an unique Aroon Oscillator (defined as Aroon Up - Aroon Down), instead of 2 lines (for reference, original article avaible in:" Stocks & Commodities , V. 13:9 : A Time Price Oscillator by Tushar Chande, Ph .D."" - paragraph: "more patterns").
Use middle line for taking position, and the extreme ones (high and low) for exiting from long/short position. Extreme lines are not use for opening position against the trend.
Best values are for EU stocks and indexes: 19 periods, middle line = - 25 (ecxpecially for shares, give the general tendency of growing). Therefore also levels for exiting long/short position are not specular (levelhigh stops at + 75, low at -85 since stocks when go down, fall often heavily)
Please give feedback for improving this strategy! All the best,
MS .

waves█ OVERVIEW
This library intended for use in Bar Replay provides functions to generate various wave forms (sine, cosine, triangle, square) based on time and customizable parameters. Useful for testing and in creating oscillators, indicators, or visual effects.
█ FUNCTIONS
• getSineWave()
• getCosineWave()
• getTriangleWave()
• getSquareWave()
█ USAGE EXAMPLE
//@version=6
indicator("Wave Example")
import kaigouthro/waves/1
plot(waves.getSineWave(cyclesPerMinute=15))
█ NOTES
* barsPerSecond defaults to 10. Adjust this if not using 10x in Bar Replay.
* Phase shift is in degrees.
---
Library "waves"
getSineWave(cyclesPerMinute, bar, barsPerSecond, amplitude, verticalShift, phaseShift)
`getSineWave`
> Calculates a sine wave based on bar index, cycles per minute (BPM), and wave parameters.
Parameters:
cyclesPerMinute (float) : (float) The desired number of cycles per minute (BPM). Default is 30.0.
bar (int) : (int) The current bar index. Default is bar_index.
barsPerSecond (float) : (float) The number of bars per second. Default is 10.0 for Bar Replay
amplitude (float) : (float) The amplitude of the sine wave. Default is 1.0.
verticalShift (float) : (float) The vertical shift of the sine wave. Default is 0.0.
phaseShift (float) : (float) The phase shift of the sine wave in radians. Default is 0.0.
Returns: (float) The calculated sine wave value.
getCosineWave(cyclesPerMinute, bar, barsPerSecond, amplitude, verticalShift, phaseShift)
`getCosineWave`
> Calculates a cosine wave based on bar index, cycles per minute (BPM), and wave parameters.
Parameters:
cyclesPerMinute (float) : (float) The desired number of cycles per minute (BPM). Default is 30.0.
bar (int) : (int) The current bar index. Default is bar_index.
barsPerSecond (float) : (float) The number of bars per second. Default is 10.0 for Bar Replay
amplitude (float) : (float) The amplitude of the cosine wave. Default is 1.0.
verticalShift (float) : (float) The vertical shift of the cosine wave. Default is 0.0.
phaseShift (float) : (float) The phase shift of the cosine wave in radians. Default is 0.0.
Returns: (float) The calculated cosine wave value.
getTriangleWave(cyclesPerMinute, bar, barsPerSecond, amplitude, verticalShift, phaseShift)
`getTriangleWave`
> Calculates a triangle wave based on bar index, cycles per minute (BPM), and wave parameters.
Parameters:
cyclesPerMinute (float) : (float) The desired number of cycles per minute (BPM). Default is 30.0.
bar (int) : (int) The current bar index. Default is bar_index.
barsPerSecond (float) : (float) The number of bars per second. Default is 10.0 for Bar Replay
amplitude (float) : (float) The amplitude of the triangle wave. Default is 1.0.
verticalShift (float) : (float) The vertical shift of the triangle wave. Default is 0.0.
phaseShift (float) : (float) The phase shift of the triangle wave in radians. Default is 0.0.
Returns: (float) The calculated triangle wave value.
getSquareWave(cyclesPerMinute, bar, barsPerSecond, amplitude, verticalShift, dutyCycle, phaseShift)
`getSquareWave`
> Calculates a square wave based on bar index, cycles per minute (BPM), and wave parameters.
Parameters:
cyclesPerMinute (float) : (float) The desired number of cycles per minute (BPM). Default is 30.0.
bar (int) : (int) The current bar index. Default is bar_index.
barsPerSecond (float) : (float) The number of bars per second. Default is 10.0 for Bar Replay
amplitude (float) : (float) The amplitude of the square wave. Default is 1.0.
verticalShift (float) : (float) The vertical shift of the square wave. Default is 0.0.
dutyCycle (float) : (float) The duty cycle of the square wave (0.0 to 1.0). Default is 0.5 (50% duty cycle).
phaseShift (float) : (float) The phase shift of the square wave in radians. Default is 0.0.
Returns: (float) The calculated square wave value.

Leverage Aware Trade OptimizerWelcome to the Leverage-Aware Trade Optimizer (LATO)! I’m thrilled to have you exploring this dynamic algorithm! LATO combines advanced market oscillation tracking, leverage-aware trade optimization, and real-time market analysis to help you make smarter, more informed trading decisions. Whether you're just starting or you’re an experienced trader, LATO provides powerful tools and insights to enhance your strategies. LATO is here to support you in optimizing your trades with precision, so feel free to dive in and explore all the features. Let’s make your trading experience as effective and rewarding as possible. Safe trading!
Leverage-Aware Trade Optimizer (LATO)
Short Title: LATO
Category: Trading Tools / Technical Analysis
Overview
The Leverage-Aware Trade Optimizer (LATO) is a powerful algorithm designed to track and analyze market oscillations, identify reversal zones, and provide dynamic trading levels for optimal decision-making. With built-in risk management features, LATO enhances traders’ ability to make well-informed decisions based on a comprehensive range of market indicators, including price oscillations, probabilities, and leverage-related risks.
Key Features
Comprehensive Market Oscillation Tracking: LATO utilizes advanced indicators such as the Indexed Position Oscillator (IPO), Candle Relative Percentage (CRP), and Oscillating Range Indicator (ORI) to track price fluctuations and detect key market oscillations, providing a detailed view of price movements.
Dynamic Price Levels for Trading Decisions: The script calculates critical price levels such as WAP, WBP, XAP, and XBP. These weighted and expanded prices help identify potential support and resistance zones for accurate trade entries and exits.
Reversal Detection and Trend Identification: LATO is designed to recognize top and bottom reversal zones using user-defined thresholds (e.g., upper_reversal, lower_reversal). The algorithm signals potential trend changes with event markers such as UP, DOWN, UIP, and DIP, enabling traders to anticipate market reversals.
Risk and Leverage Mapping: By estimating liquidation levels for various leverage values (5x, 10x, 20x, etc.), LATO assists in risk management, helping traders visualize leverage exposure and optimize their trades according to risk tolerance.
Integrated Visualization and Event Labels: LATO enhances visual analysis by plotting key levels, trend lines, and event markers on the chart. Custom labels summarize critical values, including SOD (Sell Odds), BOD (Buy Odds), ORI (Oscillating Range Indicator), and PVI (Price Volatility Index), offering a quick, actionable summary for traders.
User Inputs
Orders Deviation (order_deviation): Controls the deviation for calculating trade levels.
Top Reversal (upper_reversal): Sets the threshold for the upper reversal zone.
Bottom Reversal (lower_reversal): Sets the threshold for the lower reversal zone.
How It Works
LATO tracks market oscillations through the Indexed Position Oscillator (IPO) and Candle Relative Percentage (CRP), dynamically adjusting as the market fluctuates. The algorithm then identifies key levels using weighted prices (e.g., WAP, WBP) and generates reversal signals based on defined thresholds.
Once the Leverage-Aware Trade Optimizer (LATO) is applied to a chart, it automatically calculates dynamic support and resistance levels and identifies potential buying or selling opportunities. The script also plots liquidation zones based on different leverage levels and visualizes these areas through color-coded lines.
Use Case Scenarios
Trend Reversal Detection: Identify when the market is likely to reverse based on the ORI and price action.
Dynamic Price Levels: Use the weighted price levels and trend lines to pinpoint entry/exit points.
Leverage Risk Management: Monitor liquidation levels and use them for managing risk while trading with leverage.
Oscillation Tracking: Track key oscillations for detecting overbought or oversold conditions.
Alert Setup for LATO
You can set up alerts based on the key conditions like UP, DOWN, UIP, and DIP, as well as specific market movements.
Down Trend Alert (DOWN): Alerts when there’s a downtrend, triggered by a crossover of WBP and BL5, with specific conditions for ORI and SOD.
Up Trend Alert (UP): Alerts when there’s an uptrend, triggered by a crossunder of WAP and SL5, with ORI below -0.5.
Upper Reversal Alert (UIP): Alerts when ORI crosses below the lower_reversal threshold.
Downward Reversal Alert (DIP): Alerts when ORI crosses above the upper_reversal threshold.
Conclusion
The Leverage-Aware Trade Optimizer (LATO) is a comprehensive trading tool designed for traders seeking to optimize their trade entries and exits. By combining multiple indicators, dynamic price levels, and reversal zone detection, LATO offers an advanced approach to market analysis and decision-making. Whether you’re trading with leverage or simply looking for trend confirmation, LATO provides the insights you need to maximize your trading potential.
Notes
This script is designed to be used on any time frame.
Adjust the order_deviation parameter based on the asset volatility you are trading.
The reversal thresholds (upper and lower) should be fine-tuned depending on market conditions.

Relative Performance Indicator by ComLucro - 2025_V01The "Relative Performance Indicator by ComLucro - 2025_V01" is a powerful tool designed to analyze an asset's performance relative to a benchmark index over multiple timeframes. This indicator provides traders with a clear view of how their chosen asset compares to a market index in short, medium, and long-term periods.
Key Features:
Customizable Lookback Periods: Analyze performance across three adjustable periods (default: 20, 50, and 200 bars).
Relative Performance Analysis: Calculate and visualize the difference in percentage performance between the asset and the benchmark index.
Dynamic Summary Label: Displays a detailed breakdown of the asset's and index's performance for the latest bar.
User-Friendly Interface: Includes customizable colors and display options for clear visualization.
How It Works:
The script fetches closing prices of both the asset and a benchmark index.
It calculates percentage changes over the selected lookback periods.
The indicator then computes the relative performance difference between the asset and the index, plotting it on the chart for easy trend analysis.
Who Is This For?:
Traders and investors who want to compare an asset’s performance against a benchmark index.
Those looking to identify trends and deviations between an asset and the broader market.
Disclaimer:
This tool is for educational purposes only and does not constitute financial or trading advice. Always use it alongside proper risk management strategies and backtest thoroughly before applying it to live trading.
Chart Recommendation:
Use this script on clean charts for better clarity. Combine it with other technical indicators like moving averages or trendlines to enhance your analysis. Ensure you adjust the lookback periods to match your trading style and the timeframe of your analysis.
Additional Notes:
For optimal performance, ensure the benchmark index's data is available on your TradingView subscription. The script uses fallback mechanisms to avoid interruptions when index data is unavailable. Always validate the settings and test them to suit your trading strategy.

Weekly COTAdjusted COT Index
Improves upon: "COT Index Commercials vs large and small Speculators" by SystematicFutures
How: CoT Indexes are adjusted by Open Interest to normalise data over time, and threshold background colours are in-line with Larry Williams recommendations from his book.
Note: This indicator is **only** accurate on the Daily time-frame due to the mid-week release date for CoT data.
This script calculates and plots the Adjusted Commitment of Traders (COT) Index for Commercial, Large Speculator, and Retail (Small Speculator) categories.
The CoT Index is adjusted by Open Interest to normalise data through time, following the methodology of Larry Williams, providing insights into how these groups are positioned in the market with an arguably more historically accurate context.
COT Categories
-------------------
- Commercials (Producers/Hedgers): Large entities hedging against price changes in the underlying asset.
- Large Speculators (Non-commercials): Professional traders and funds speculating on price movements.
- Retail Traders (Nonreportable/Small Speculators): Small individual traders, typically less informed.
Features
----------
- Open Interest Adjustment
- The net positions for each category are normalized by Open Interest to account
for varying contract sizes.
- Customisable Look-back Period
- You can adjust the number of weeks for the index calculation to control the
historical range used for comparison.
- Thresholds for Extremes
- Upper and lower thresholds (configurable) are provided to mark overbought and
oversold conditions.
- Defaults
- Overbought: <=20
- Oversold: >= 80
- Hide Current Week Option
- Optionally hide the current week's data until market close for more accurate comparison.
- Visual Aids
- Plot the Commercials, Large Speculators, and Retail indexes, and optionally highlight extreme positioning.
Inputs
--------
- weeks
- Number of weeks for historical range comparison.
- upperExtreme and lowerExtreme
- Thresholds to identify overbought/oversold conditions (default 80/20).
- hideCurrentWeek
- Option to hide current week's data until market close.
- markExtremes
- Highlight extremes where any index crosses the upper or lower thresholds.
- Options to display or hide indexes for Commercials, Large Speculators, and Small Speculators.
Outputs
----------
- The script plots the COT Index for each of the three categories and highlights periods of extreme positioning with customisable thresholds.
Usage
-------
- This tool is useful for traders who want to track the positioning of different market participants over time.
- By identifying the extreme positions of Commercials, Large Speculators, and Retail traders, it can give insights into market sentiment and potential reversals.
- Reversals of trend can be confirmed with RSI Divergence (daily), for example
- Continuation can be confirmed with RSI overbought/oversold conditions (daily), and/or hidden RSI Hidden Divergence, for example

ToStringAr█ OVERVIEW
Contains to string conversion methods arrays of int/float/bool/string/line/label/box types
- toS() - method works like array.join() with more flexibility and
- toStringAr() - converts array to string on a per item basis and returns the resulting string array
Conversion of each item to string is made using toS() function from moebius1977/ToS/1 library.
█ GENERAL DESCRIPTION OF LIBRARY FUNCTIONS
All toS(array) methods have same parameters. The only difference will be in format parameter as explained below.
method toS(this, index_from, index_to, separator, showIDs, format, truncate_left, size_limit, nz)
Like array.join() but with string length limit. Joins elements into readable string (length capped at 4000, truncating the end or beg)
Parameters:
this (array) : array to be converted to string
index_from (int) : index_from (int) (Optional) Start from this id (starting from 0, in insertion order). If omitted - start from the first item.
index_to (int) : index_to (int) (Optional) End with this pair (inclusive, in insertion order). If omitted - to last item.
separator (string) : separator (string) (Optional) String to be inserted between pairs. Default: `", "`
showIDs (bool) : showIDs (bool) (Optional) If true item's id is added in the form `id: value`.
format (string) : format (string) (Optional) Format string fo toS(). If omitted default format is used depending in the type.
truncate_left (bool) : truncate_left (bool) (Optional) Truncate from left or right. Default: false.
size_limit (int) : size_limit (int) (Optional) Max output string length. Default: 4000.
nz (string) : nz (string) (Optional) A string used to represent na (na values are substituted with this string).
format parameter depends on the type:
For toS(bool/int/float ...) format parameter works in the same way as `str.format()` (i.e. you can use same format strings as with `str.format()` with `{0}` as a placeholder for the value) with some shorthand "format" options available:
--- number ---
- "" => "{0}"
- "number" => "{0}"
- "0" => "{0, number, 0 }"
- "0.0" => "{0, number, 0.0 }"
- "0.00" => "{0, number, 0.00 }"
- "0.000" => "{0, number, 0.000 }"
- "0.0000" => "{0, number, 0.0000 }"
- "0.00000" => "{0, number, 0.00000 }"
- "0.000000" => "{0, number, 0.000000 }"
- "0.0000000" => "{0, number, 0.0000000}"
--- date ---
- "... ... " in any place is substituted with "{0, date, dd.MM.YY}" (e.g. " " results in "{0, date, dd.MM.YY\} {0, time, HH.mm.ss}")
- "date" => "{0, date, dd.MM.YY}"
- "date : time" => "{0, date, dd.MM.YY} : {0, time, HH.mm.ss}"
- "dd.MM" => "{0, date, dd:MM}"
- "dd" => "{0, date, dd}"
--- time ---
- "... ... " in any place is substituted with "{0, time, HH.mm.ss}" (e.g. " " results in "{0, date, dd.MM.YY\} {0, time, HH.mm.ss}")
- "time" => "{0, time, HH:mm:ss}"
- "HH:mm" => "{0, time, HH:mm}"
- "mm:ss" => "{0, time, mm:ss}"
- "date time" => "{0, date, dd.MM.YY\} {0, time, HH.mm.ss}"
- "date, time" => "{0, date, dd.MM.YY\}, {0, time, HH.mm.ss}"
- "date,time" => "{0, date, dd.MM.YY\},{0, time, HH.mm.ss}"
- "date\ntime" => "{0, date, dd.MM.YY\}\n{0, time, HH.mm.ss}"
For toS(line ...):
format (string) : (string) (Optional) Use `x1` as placeholder for `x1` and so on. E.g. default format is `"(x1, y1) - (x2, y2)"`.
For toS(label ...) :
format (string) : (string) (Optional) Use `x1` as placeholder for `x`, `y1 - for `y` and `txt` for label's text. E.g. default format is `(x1, y1): "txt"` if ptint_text is true and `(x1, y1)` if false.
For toS(box ... ) :
format (string) : (string) (Optional) Use `x1` as placeholder for `x`, `y1 - for `y` etc. E.g. default format is "(x1, y1) - (x2, y2)".
For toS(color] ... ) :
format (string) : (string) (Optional) Options are "HEX" (e.g. "#FFFFFF33") or "RGB" (e.g. "rgb(122,122,122,23)"). Default is "HEX".
All toStringAr() methods just convert each item to string using toS with same format options as described above.
Parameters:
arr (array) : Array to be converted to a string array.
format (string) : Format string.
nz (string) : Placeholder for na items.
█ FULL OF FUNCTIONS AND PARAMETERS
Library "ToStringAr"
Contains toString/toS conversion methods for int/float/bool/string/line/label/box and arrays and matrices thereof. Also contains a string wraping function.
method toS(this, index_from, index_to, separator, showIDs, format, truncate_left, size_limit, nz)
Namespace types: array
Parameters:
this (array)
index_from (int)
index_to (int)
separator (string)
showIDs (bool)
format (string)
truncate_left (bool)
size_limit (int)
nz (string)
method toS(this, index_from, index_to, separator, showIDs, format, truncate_left, size_limit, nz)
Namespace types: array
Parameters:
this (array)
index_from (int)
index_to (int)
separator (string)
showIDs (bool)
format (string)
truncate_left (bool)
size_limit (int)
nz (string)
method toS(this, index_from, index_to, separator, showIDs, format, truncate_left, size_limit, nz)
Namespace types: array
Parameters:
this (array)
index_from (int)
index_to (int)
separator (string)
showIDs (bool)
format (string)
truncate_left (bool)
size_limit (int)
nz (string)
method toS(this, index_from, index_to, separator, showIDs, format, truncate_left, size_limit, nz)
Namespace types: array
Parameters:
this (array)
index_from (int)
index_to (int)
separator (string)
showIDs (bool)
format (string)
truncate_left (bool)
size_limit (int)
nz (string)
method toS(this, index_from, index_to, separator, showIDs, format, truncate_left, size_limit, nz)
Namespace types: array
Parameters:
this (array)
index_from (int)
index_to (int)
separator (string)
showIDs (bool)
format (string)
truncate_left (bool)
size_limit (int)
nz (string)
method toS(this, index_from, index_to, separator, showIDs, format, truncate_left, size_limit, nz)
Namespace types: array
Parameters:
this (array)
index_from (int)
index_to (int)
separator (string)
showIDs (bool)
format (string)
truncate_left (bool)
size_limit (int)
nz (string)
method toS(this, index_from, index_to, separator, showIDs, format, truncate_left, size_limit, nz)
Namespace types: array
Parameters:
this (array)
index_from (int)
index_to (int)
separator (string)
showIDs (bool)
format (string)
truncate_left (bool)
size_limit (int)
nz (string)
method toS(this, index_from, index_to, separator, showIDs, format, truncate_left, size_limit, nz)
Namespace types: array
Parameters:
this (array)
index_from (int)
index_to (int)
separator (string)
showIDs (bool)
format (string)
truncate_left (bool)
size_limit (int)
nz (string)
method toStringAr(arr, format, nz)
Namespace types: array
Parameters:
arr (array)
format (string)
nz (string)
method toStringAr(arr, format, nz)
Namespace types: array
Parameters:
arr (array)
format (string)
nz (string)
method toStringAr(arr, format, nz)
Namespace types: array
Parameters:
arr (array)
format (string)
nz (string)
method toStringAr(arr, format, nz)
Namespace types: array
Parameters:
arr (array)
format (string)
nz (string)
method toStringAr(arr, format, nz)
Namespace types: array
Parameters:
arr (array)
format (string)
nz (string)
method toStringAr(arr, format, nz)
Namespace types: array
Parameters:
arr (array)
format (string)
nz (string)
method toStringAr(arr, format, nz)
Namespace types: array
Parameters:
arr (array)
format (string)
nz (string)
method toStringAr(arr, format, nz)
Namespace types: array
Parameters:
arr (array)
format (string)
nz (string)
Machine Learning Cross-Validation Split & Batch HighlighterThis indicator is designed for traders and analysts who employ Machine Learning (ML) techniques for cross-validation in financial markets.
The script visually segments a selected range of historical price data into splits and batches, helping in the assessment of model performance over different market conditions.
User
Theory
In ML, cross-validation is a technique to assess the generalizability of a model, typically by partitioning the data into a set of "folds" or "splits." Each split acts as a validation set, while the others form the training set. This script takes a unique approach by considering the sequential nature of financial time series data, where random shuffling of data (as in traditional cross-validation) can disrupt the temporal order, leading to misleading results.
Chronological Integrity of Splits
Even if the order of the splits is shuffled for cross-validation purposes, the data within each split remains in its original chronological sequence. This feature is crucial for time series analysis, as it respects the inherent order-dependency of financial markets. Thus, each split can be considered a microcosm of market behavior, maintaining the integrity of trends, cycles, and patterns that could be disrupted by random sampling.
The script allows users to define the number of splits and the size of each batch within a split. By doing so, it maintains the chronological sequence of the data, ensuring that the validation set is representative of a future time period that the model would predict.
www.tradingview.com
Parameters
Number of Splits: Defines how many segments the selected data range will be divided into. Each split serves as a standalone testing ground for the ML model. (Up to 24)
Batch Size: Determines the number of bars (candles) in each batch within a split. Smaller batches can help pinpoint overfitting at a finer granularity.
Start Index: The bar index from where the historical data range begins. It sets the starting point for data analysis.
End Index: The bar index where the historical data range ends. It marks the cutoff for data to be included in the model assessment.
Usage
To use this script effectively:
1 - Input the Start Index and End Index to define the historical data range you wish to analyze.
2 - Adjust the Number of Splits to create multiple validation sets for cross-validation.
3 - Set the Batch Size to control the granularity of each validation set within the splits.
4 - The script will highlight the background of each batch within the splits using alternating shades, allowing for a clear visual distinction of the data segmentation.
By maintaining the temporal sequence and allowing for adjustable granularity, the "ML Split and Batch Highlighter" aids in creating a robust validation framework for time series forecasting models in finance.

MVRV Z-Score [AlgoAlpha]Introducing the ∑ MVRV Z-Score by AlgoAlpha, a dynamic and sophisticated tool designed for traders seeking to gain an edge in INDEX:BTCUSD analysis. This script employs advanced statistical techniques on Bitcoin On-Chain data to offer a deeper understanding of market conditions, focusing on valuation extremes and momentum trends. Let's explore the features and functionalities that make this tool a valuable addition to your trading arsenal.
Key Features:
🔶 Adjustable Parameters: Customize the Z score lookback length, moving average lookback length, and choose from six moving average types, tailoring the analysis to your trading style.
🔶 Heiken Ashi Compatibility: Incorporate Heiken Ashi plots to visualize market trends, adding a layer of clarity to your technical analysis.
🔶 Divergence Alerts: Detect significant bullish and bearish divergences, allowing for timely identification of potential market reversals.
🔶 Configurable Alerts: Set alerts for overbought, oversold, and divergence conditions, ensuring you never miss an opportunity.
How to Use:
1. ➡️ Parameter Selection: Start by configuring the Z-Score and moving average settings according to your analysis needs. This includes selecting the lookback period and the type of moving average.
2. ➡️ Visualization Options: Choose to enable Heiken Ashi plots for an alternative view of the Z-Score, which can help in identifying trend directions more clearly.
3. ➡️ Monitor for Signals: Keep an eye out for divergence signals and overbought/oversold conditions as potential indicators for entering or exiting trades.
4. ➡️ Alert Setup: Configure alerts based on your selected parameters to receive notifications for important market movements and conditions.
How It Works:
The core of this tool is the Z-Score calculation, which assesses the standard deviation of the current market value from its mean, highlighting overvalued or undervalued market conditions. Here's a brief overview of the script's operational mechanics:
1. 📊 Calculating the Z-Score: The script first calculates the mean over a user-defined lookback period of the MVRV ratio, then it computes the Z-Score to identify deviations from the average.
meanValue = ta.sma(marketValue, zScoreLookback)
zScoreValue = (marketValue - meanValue) / ta.stdev(marketValue, zScoreLookback)
2. 📈 Applying a Moving Average: To smooth the Z-Score data and make trends more discernible, a moving average is applied. Users can choose from several types, such as SMA, EMA, or HMA, based on their preference.
3. 🔄 Heiken Ashi Visualization: For those opting for a more intuitive trend analysis, Heiken Ashi plots can be enabled, transforming the Z-Score data into candlestick charts that simplify trend identification.
4. 🔍 Identifying Divergences: The script is equipped to spot divergences between the market price action and the Z-Score, signaling potential bullish or bearish market reversals.
oscHigherLow = haClose > ta.valuewhen(findPivotLow, haClose , 1) and isInRange(findPivotLow )
priceLowerLow = low < ta.valuewhen(findPivotLow, low , 1)
bullishCondition = enablePlotBullish and priceLowerLow and oscHigherLow and findPivotLow
5. 🚨 Configurable Alerts: Lastly, the script allows for the setting of customizable alerts based on the Z-Score, moving averages, and identified divergences, enabling traders to react promptly to market changes.
The ∑ MVRV Z-Score by AlgoAlpha is an essential tool for traders looking to analyze and interpret market dynamics through a quantitatively rigorous lens. Whether you're focused on identifying market extremes or tracking trend momentum, this script offers the insights needed to support informed trading decisions. 🌟📊💡
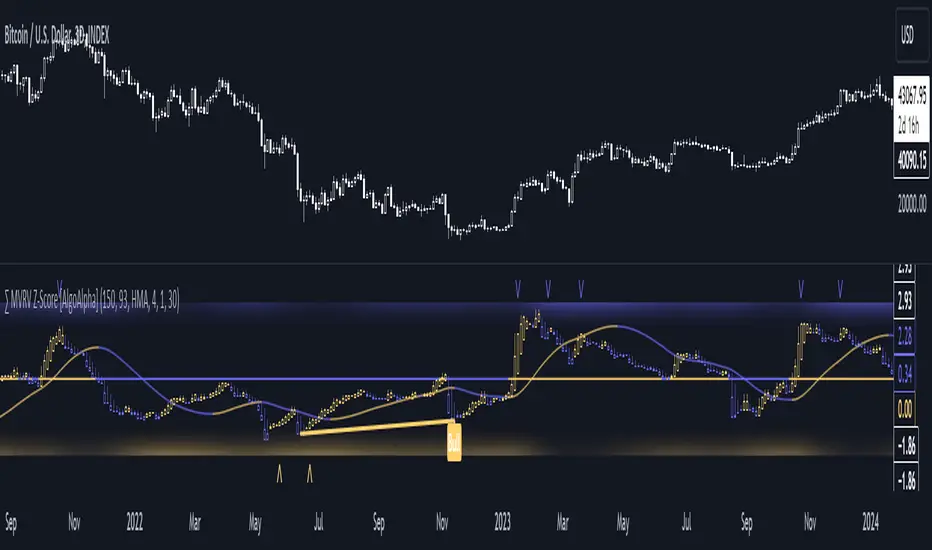
TTP Big Whale ExplorerThe Big Whale Explorer is an indicator that looks into the ratio of large wallets deposits vs withdrawals.
Whales tend to sale their holding when they transfer their holdings into exchanges and they tend to hold when they withdraw.
In this overlay indicator you'll be able to see in an oscillator format the moves of large wallets.
The moves above 1.5 turn into red symbolising that they are starting to distribute. This can eventually have an impact in the price by causing anything from a mild pullback to a considerable crash depending on how much is being actually sold into the market.
Moves below 0.5 mean that the large whales are heavily accumulating and withdrawing. During these periods price could still pullback or even crash but eventually the accumulation can take prices to new highs.
Instructions:
1) Load INDEX:BTCUSD or BNC:BLX to get the most historic data as possible
2) use the daily timeframe
3) load the indicator into the chart