COT INDEX
// Users & Producers: Commercial Positions
// Large Specs (Hedge Fonds): Non-commercial Positions
// Retail: Non-reportable Positions
//@version=5
int weeks = input.int(26, "Number of weeks", minval=1)
int upperExtreme = input.int(80, "Upper Threshold in %", minval=50)
int lowerExtreme = input.int(20, "Lower Threshold in %", minval=1)
bool hideCurrentWeek = input(true, "Hide the current week until market close")
bool markExtremes = input(false, "Mark long and short extremes")
bool showSmallSpecs = input(true, "Show small speculators index")
bool showProducers = input(true, "Show producers index")
bool showLargeSpecs = input(true, "Show large speculators index")
indicator("COT INDEX", shorttitle="COT INDEX", format=format.percent, precision=0)
import TradingView/LibraryCOT/2 as cot
// Function to fix some symbols.
var string Root_Symbol = syminfo.root
var string CFTC_Code_fixed = cot.convertRootToCOTCode("Auto")
if Root_Symbol == "HG"
CFTC_Code_fixed := "085692"
else if Root_Symbol == "LBR"
CFTC_Code_fixed := "058644"
// Function to request COT data for Futures only.
dataRequest(metricName, isLong) =>
tickerId = cot.COTTickerid('Legacy', CFTC_Code_fixed, false, metricName, isLong ? "Long" : "Short", "All")
value = request.security(tickerId, "1D", close, ignore_invalid_symbol = true)
if barstate.islastconfirmedhistory and na(value)
runtime.error("Could not find relevant COT data based on the current symbol.")
value
// Function to calculate net long positions.
netLongCommercialPositions() =>
commercialLong = dataRequest("Commercial Positions", true)
commercialShort = dataRequest("Commercial Positions", false)
commercialLong - commercialShort
netLongLargePositions() =>
largeSpecsLong = dataRequest("Noncommercial Positions", true)
largeSpecsShort = dataRequest("Noncommercial Positions", false)
largeSpecsLong - largeSpecsShort
netLongSmallPositions() =>
smallSpecsLong = dataRequest("Nonreportable Positions", true)
smallSpecsShort = dataRequest("Nonreportable Positions", false)
smallSpecsLong - smallSpecsShort
calcIndex(netPos) =>
minNetPos = ta.lowest(netPos, weeks)
maxNetPos = ta.highest(netPos, weeks)
if maxNetPos != minNetPos
100 * (netPos - minNetPos) / (maxNetPos - minNetPos)
else
na
// Calculate the Commercials Position Index.
commercialsIndex = calcIndex(netLongCommercialPositions())
largeSpecsIndex = calcIndex(netLongLargePositions())
smallSpecsIndex = calcIndex(netLongSmallPositions())
// Conditional logic based on user input
plotValueCommercials = hideCurrentWeek ? (timenow >= time_close ? commercialsIndex : na) : (showProducers ? commercialsIndex : na)
plotValueLarge = hideCurrentWeek ? (timenow >= time_close ? largeSpecsIndex : na) : (showLargeSpecs ? largeSpecsIndex : na)
plotValueSmall = hideCurrentWeek ? (timenow >= time_close ? smallSpecsIndex : na) : (showSmallSpecs ? smallSpecsIndex : na)
// Plot the index and horizontal lines
plot(plotValueCommercials, "Commercials", color=color.blue, style=plot.style_line, linewidth=2)
plot(plotValueLarge, "Large Speculators", color=color.red, style=plot.style_line, linewidth=1)
plot(plotValueSmall, "Small Speculators", color=color.green, style=plot.style_line, linewidth=1)
hline(upperExtreme, "Upper Threshold", color=color.green, linestyle=hline.style_solid, linewidth=1)
hline(lowerExtreme, "Lower Threshold", color=color.red, linestyle=hline.style_solid, linewidth=1)
/// Marking extremes with background color
bgcolor(markExtremes and (commercialsIndex >= upperExtreme or largeSpecsIndex >= upperExtreme or smallSpecsIndex >= upperExtreme) ? color.new(color.gray, 90) : na, title="Upper Threshold")
bgcolor(markExtremes and (commercialsIndex <= lowerExtreme or largeSpecsIndex <= lowerExtreme or smallSpecsIndex <= lowerExtreme) ? color.new(color.gray, 90) : na, title="Lower Threshold")
Tìm kiếm tập lệnh với "index"

JPMorgan G7 Volatility IndexThe JPMorgan G7 Volatility Index: Scientific Analysis and Professional Applications
Introduction
The JPMorgan G7 Volatility Index (G7VOL) represents a sophisticated metric for monitoring currency market volatility across major developed economies. This indicator functions as an approximation of JPMorgan's proprietary volatility indices, providing traders and investors with a normalized measurement of cross-currency volatility conditions (Clark, 2019).
Theoretical Foundation
Currency volatility is fundamentally defined as "the statistical measure of the dispersion of returns for a given security or market index" (Hull, 2018, p.127). In the context of G7 currencies, this volatility measurement becomes particularly significant due to the economic importance of these nations, which collectively represent more than 50% of global nominal GDP (IMF, 2022).
According to Menkhoff et al. (2012, p.685), "currency volatility serves as a global risk factor that affects expected returns across different asset classes." This finding underscores the importance of monitoring G7 currency volatility as a proxy for global financial conditions.
Methodology
The G7VOL indicator employs a multi-step calculation process:
Individual volatility calculation for seven major currency pairs using standard deviation normalized by price (Lo, 2002)
- Weighted-average combination of these volatilities to form a composite index
- Normalization against historical bands to create a standardized scale
- Visual representation through dynamic coloring that reflects current market conditions
The mathematical foundation follows the volatility calculation methodology proposed by Bollerslev et al. (2018):
Volatility = σ(returns) / price × 100
Where σ represents standard deviation calculated over a specified timeframe, typically 20 periods as recommended by the Bank for International Settlements (BIS, 2020).
Professional Applications
Professional traders and institutional investors employ the G7VOL indicator in several key ways:
1. Risk Management Signaling
According to research by Adrian and Brunnermeier (2016), elevated currency volatility often precedes broader market stress. When the G7VOL breaches its high volatility threshold (typically 1.5 times the 100-period average), portfolio managers frequently reduce risk exposure across asset classes. As noted by Borio (2019, p.17), "currency volatility spikes have historically preceded equity market corrections by 2-7 trading days."
2. Counter-Cyclical Investment Strategy
Low G7 volatility periods (readings below the lower band) tend to coincide with what Shin (2017) describes as "risk-on" environments. Professional investors often use these signals to increase allocations to higher-beta assets and emerging markets. Campbell et al. (2021) found that G7 volatility in the lowest quintile historically preceded emerging market outperformance by an average of 3.7% over subsequent quarters.
3. Regime Identification
The normalized volatility framework enables identification of distinct market regimes:
- Readings above 1.0: Crisis/high volatility regime
- Readings between -0.5 and 0.5: Normal volatility regime
- Readings below -1.0: Unusually calm markets
According to Rey (2015), these regimes have significant implications for global monetary policy transmission mechanisms and cross-border capital flows.
Interpretation and Trading Applications
G7 currency volatility serves as a barometer for global financial conditions due to these currencies' centrality in international trade and reserve status. As noted by Gagnon and Ihrig (2021, p.423), "G7 currency volatility captures both trade-related uncertainty and broader financial market risk appetites."
Professional traders apply this indicator in multiple contexts:
- Leading indicator: Research from the Federal Reserve Board (Powell, 2020) suggests G7 volatility often leads VIX movements by 1-3 days, providing advance warning of broader market volatility.
- Correlation shifts: During periods of elevated G7 volatility, cross-asset correlations typically increase what Brunnermeier and Pedersen (2009) term "correlation breakdown during stress periods." This phenomenon informs portfolio diversification strategies.
- Carry trade timing: Currency carry strategies perform best during low volatility regimes as documented by Lustig et al. (2011). The G7VOL indicator provides objective thresholds for initiating or exiting such positions.
References
Adrian, T. and Brunnermeier, M.K. (2016) 'CoVaR', American Economic Review, 106(7), pp.1705-1741.
Bank for International Settlements (2020) Monitoring Volatility in Foreign Exchange Markets. BIS Quarterly Review, December 2020.
Bollerslev, T., Patton, A.J. and Quaedvlieg, R. (2018) 'Modeling and forecasting (un)reliable realized volatilities', Journal of Econometrics, 204(1), pp.112-130.
Borio, C. (2019) 'Monetary policy in the grip of a pincer movement', BIS Working Papers, No. 706.
Brunnermeier, M.K. and Pedersen, L.H. (2009) 'Market liquidity and funding liquidity', Review of Financial Studies, 22(6), pp.2201-2238.
Campbell, J.Y., Sunderam, A. and Viceira, L.M. (2021) 'Inflation Bets or Deflation Hedges? The Changing Risks of Nominal Bonds', Critical Finance Review, 10(2), pp.303-336.
Clark, J. (2019) 'Currency Volatility and Macro Fundamentals', JPMorgan Global FX Research Quarterly, Fall 2019.
Gagnon, J.E. and Ihrig, J. (2021) 'What drives foreign exchange markets?', International Finance, 24(3), pp.414-428.
Hull, J.C. (2018) Options, Futures, and Other Derivatives. 10th edn. London: Pearson.
International Monetary Fund (2022) World Economic Outlook Database. Washington, DC: IMF.
Lo, A.W. (2002) 'The statistics of Sharpe ratios', Financial Analysts Journal, 58(4), pp.36-52.
Lustig, H., Roussanov, N. and Verdelhan, A. (2011) 'Common risk factors in currency markets', Review of Financial Studies, 24(11), pp.3731-3777.
Menkhoff, L., Sarno, L., Schmeling, M. and Schrimpf, A. (2012) 'Carry trades and global foreign exchange volatility', Journal of Finance, 67(2), pp.681-718.
Powell, J. (2020) Monetary Policy and Price Stability. Speech at Jackson Hole Economic Symposium, August 27, 2020.
Rey, H. (2015) 'Dilemma not trilemma: The global financial cycle and monetary policy independence', NBER Working Paper No. 21162.
Shin, H.S. (2017) 'The bank/capital markets nexus goes global', Bank for International Settlements Speech, January 15, 2017.

Retail Pain Index (RPIx) (RPIx) Retail Pain Index (DAFE)
See the Market’s Pain. Trade the Edge.
The Retail Pain Index (RPIx) is a next-generation volatility and sentiment tool designed to reveal the hidden moments when retail traders are most likely being squeezed, stopped out, or forced to capitulate. This is not just another oscillator—it’s a behavioral market scanner that quantifies “pain” as price rips away from the average entry zone, often marking the fuel for the next big move.
Why is RPIx so Unique?
Behavioral Volatility Engine:
RPIx doesn’t just track price or volume. It measures how far price is moving away from where the crowd has recently entered (using a rolling VWAP average), then normalizes this “distance” into a Z-score. The result? You see when the market is inflicting maximum pain on the most participants.
Dynamic, Intuitive Coloring:
The main RPIx line is purple in normal conditions, but instantly turns red when pain is extreme to the upside (+2.00 or higher) and green when pain is extreme to the downside (-2.00 or lower). This makes it visually obvious when the market is entering a “max pain” regime.
Threshold Lines for Clarity:
Dashed red and green lines at +2.00 and -2.00 Z-score levels make it easy to spot rare, high-pain events at a glance.
Signature Dashboard & Info Line:
Dashboard: A compact, toggleable panel in the top right of the indicator pane shows the current Z-score, threshold, and status—perfect for desktop users who want a quick read on market stress.
Info Line: For mobile or minimalist traders, a single-line info label gives you the essentials without cluttering your screen.
Inputs & Customization
Entry Cluster Lookback: Adjusts how many bars are used to calculate the “entry zone” (VWAP average). A higher value smooths the signal, a lower value makes it more responsive.
Pain Z-Score Threshold:
Sets the sensitivity for what counts as “extreme pain.” Default is ±2.00, but you can fine-tune this to match your asset’s volatility or your own risk appetite.
Show Dashboard / Show Compact Info Label:
Toggle these features on or off to fit your workflow and screen size.
How to utilize RPIx's awesomeness:
Extreme Readings = Opportunity:
When RPIx spikes above +2.00 (red) or below -2.00 (green), the market is likely running stops, liquidating weak hands, or forcing retail traders to capitulate. These moments often precede sharp reversals, trend accelerations, or volatility expansions.
Combine with Price Action:
Use RPIx as a confirmation tool for your existing strategy, or as a standalone alert for “pain points” where the crowd is most vulnerable.
Visual Edge:
The color-coded line and threshold levels make it easy to spot regime shifts and rare events—no more squinting at numbers or guessing when the market is about to snap.
Why RPIx?
Works on Any Asset, Any Timeframe:
Stocks, futures, crypto, forex—if there’s a crowd, there’s pain, and RPIx will find it.
Behavioral Alpha:
Most indicators lag. RPIx quantifies the psychological stress in the market, giving you a real-time edge over the herd.
Customizable, Clean, and Powerful:
Designed for both power users and mobile traders, with toggles for every workflow.
See the pain. Trade the edge.
Retail Pain Index: Because the market’s next move is written in the crowd’s discomfort.
For educational purposes only. Not financial advice. Always use proper risk management
Use with discipline. Trade your edge.
— Dskyz , for DAFE Trading Systems, for DAFE Trading Systems

Market Sentiment Index US Top 40 [Pt]▮Overview
Market Sentiment Index US Top 40 [Pt} shows how the largest US stocks behave together. You pick one simple measure—High Low breakouts, Above Below moving average, or RSI overbought/oversold—and see how many of your chosen top 10/20/30/40 NYSE or NASDAQ names are bullish, neutral, or bearish.
This tool gives you a quick view of broad-market strength or weakness so you can time trades, confirm trends, and spot hidden shifts in market sentiment.
▮Key Features
► Three Simple Modes
High Low Index: counts stocks making new highs or lows over your lookback period
Above Below MA: flags stocks trading above or below their moving average
RSI Sentiment: marks overbought or oversold stocks and plots a small histogram
► Universe Selection
Top 10, 20, 30, or 40 symbols from NYSE or NASDAQ
Option to weight by market cap or treat all symbols equally
► Timeframe Choice
Use your chart’s timeframe or any intraday, daily, weekly, or monthly resolution
► Histogram Smoothing
Two optional moving averages on the sentiment bars
Markers show when the faster average crosses above or below the slower one
► Ticker Table
Optional on-chart table showing each ticker’s state in color
Grid or single-row layout with adjustable text size and color settings
▮Inputs
► Mode and Lookback
Pick High Low, Above Below MA, or RSI Sentiment
Set lookback length (for example 10 bars)
If using Above Below MA, choose the moving average type (EMA, SMA, etc.)
► Universe Setup
Market: NYSE or NASDAQ
Number of symbols: 10, 20, 30, or 40
Weights: on or off
Timeframe: blank to match chart or pick any other
► Moving Averages on Histogram
Enable fast and slow averages
Set their lengths and types
Choose colors for averages and markers
► Table Options
Show or hide the symbol table
Select text size: tiny, small, or normal
Choose layout: grid or one-row
Pick colors for bullish, neutral, and bearish cells
Show or hide exchange prefixes
▮How to Read It
► Sentiment Bars
Green means bullish
Red means bearish
Near zero means neutral
► Zero Line
Separates bullish from bearish readings
► High Low Line (High Low mode only)
Smooth ratio of highs versus lows over your lookback
► MA Crosses
Fast MA above slow MA hints rising breadth
Fast MA below slow MA hints falling breadth
► Ticker Table
Each cell colored green, gray, or red for bull, neutral, or bear
▮Use Cases
► Confirm Market Trends
Early warning when price makes highs but breadth is weak
Catch rallies when breadth turns strong while price is flat
► Spot Sector Rotation
Switch between NYSE and NASDAQ to see which group leads
Watch tech versus industrial breadth to track money flow
► Filter Trade Signals
Enter longs only when breadth is bullish
Consider shorts when breadth turns negative
► Combine with Other Indicators
Use RSI Sentiment with trend tools to spot overextended moves
Add volume indicators in High Low mode for breakout confirmation
► Timeframe Analysis
Daily for big-picture bias
Intraday (15-min) for precise entries and exits

Choppiness Index (levels)This Pine Script is a Choppiness Index Indicator with gradient visual enhancements. The Choppiness Index is a technical analysis tool that measures the "choppiness" or sideways movement of the market. It ranges from 0 to 100, where higher values indicate a more consolidated or sideways market, and lower values suggest a trending market.
Key Features:
Choppiness Index Calculation:
The script calculates the Choppiness Index based on the Average True Range (ATR) and the highest and lowest prices over a user-defined period (length).
Visual Bands:
Horizontal dashed lines are drawn at levels 55 (Upper Band), 50 (Middle Band), and 45 (Lower Band) to define key levels for interpreting the indicator.
Gradient Fills:
A blue fill is applied between the upper and lower bands (45–55) for visual clarity.
Dynamic gradients are applied to the areas:
Above the Upper Band (55–100): A green gradient fill where the color intensity increases with higher values.
Below the Lower Band (0–45): A red gradient fill where the color intensity increases with lower values.
Offset Option:
The offset input allows users to shift the Choppiness Index plot horizontally for visualization or alignment purposes.
Usage:
This indicator helps traders quickly assess market conditions:
Values above 55 indicate a choppy, non-trending market.
Values below 45 indicate a trending market.
The gradient fills make it easier to spot extreme conditions visually.
Customization:
Users can adjust:
length: The calculation period for the Choppiness Index.
offset: Horizontal shift of the Choppiness Index plot.
The gradient colors (green and red) and transparency levels are customizable in the script.
This enhanced visualization is ideal for traders who want a clear and intuitive representation of market choppiness, combined with visually striking gradient fills for quick analysis of market conditions.

Directional Volume IndexDirectional Volume Index (DVI) (buying/selling pressure)
This index is adapted from the Directional Movement Index (DMI), but based on volume instead of price movements. The idea is to detect building directional volume indicating a growing amount of orders that will eventually cause the price to follow. (DVI is not displayed by default)
The rough algorithm for the Positive Directional Volume Index (green bar):
calculate the delta to the previous green bar's volume
if the delta is positive (growing buying pressure) add it to an SMA, else add 0 (also for red bars)
divide these average deltas by the average volume
the result is the Positive Directional Volume Index (DVI+) (vice versa for DVI-)
Differential Directional Volume Index (DDVI) (relative pressure)
Creating the difference of both Directional Volume Indexes (DVI+ - DVI-) creates the Differential Directional Volume Index (DDVI) with rising values indicating a growing buying pressure, falling values a growing selling pressure. (DDVI is displayed by default, smoothed by a custom moving average)
Average Directional Volume Index (ADVX) (pressure strength)
Putting the relative pressure (DDVI) in relation to the total pressure (DVI+ + DVI-) we can determine the strength and duration of the currently building volume change / trend. For the DMI/ADX usually 20 is an indicator for a strong trend, values above 50 suggesting exhaustion and approaching reversals. (ADVX is not displayed by default, smoothed by a custom moving average)
Divergences of the Differential Directional Volume Index (DDVI) (imbalances)
By detecting divergences we can detect situations where e.g. bullish volume starts to build while price is in a downtrend, suggesting that there is growing buying pressure indicating an imminent bullish pullback/order block or reversal. (strong and hidden divergences are displayed by default)
Divergences Overview:
strong bull: higher lows on volume, lower lows on price
medium bull: higher lows on volume, equal lows on price
weak bull: equal lows on volume, lower lows on price
hidden bull: lower lows on volume, higher lows on price
strong bear: lower highs on volume, higher highs on price
medium bear: lower highs on volume, equal highs on price
weak bear: equal highs on volume, higher highs on price
hidden bear: higher highs on volume, lower highs on price
DDVI Bands (dynamic overbought/oversold levels)
Using Bollinger Bands with DDVI as source we receive an averaged relative pressure with stdev band offsets. This can be used as dynamic overbought/oversold levels indicating reversals on sharp crossovers.
Alerts
As of now there are no alerts built in, but all internal data is exposed via plot and plotshape functions, so it can be used for custom crossover conditions in the alert dialog. This is still a personal research project, so if you find good setups, please let me know.

Trend Stability Index (TSI)Overview
The Trend Stability Index (TSI) is a technical analysis tool designed to evaluate the stability of a market trend by analyzing both price movements and trading volume. By combining these two crucial elements, the TSI provides traders with insights into the strength and reliability of ongoing trends, assisting in making informed trading decisions.
Key Features
• Dual Analysis: Integrates price changes and volume fluctuations to assess trend stability.
• Customizable Periods: Allows users to set evaluation periods for both trend and volume based on their trading preferences.
• Visual Indicators: Displays the Trend Stability Index as a line chart, highlights neutral zones, and uses background colors to indicate trend stability or instability.
Configuration Settings
1. Trend Length (trendLength)
• Description: Determines the number of periods over which the price stability is evaluated.
• Default Value: 15
• Usage: A longer trend length smooths out short-term volatility, providing a clearer picture of the overarching trend.
2. Volume Length (volumeLength)
• Description: Sets the number of periods over which trading volume changes are assessed.
• Default Value: 15
• Usage: Adjusting the volume length helps in capturing significant volume movements that may influence trend strength.
Calculation Methodology
The Trend Stability Index is calculated through a series of steps that analyze both price and volume changes:
1. Price Change Rate (priceChange)
• Calculation: Utilizes the Rate of Change (ROC) function on the closing prices over the specified trendLength.
• Purpose: Measures the percentage change in price over the trend evaluation period, indicating the direction and momentum of the price movement.
2. Volume Change Rate (volumeChange)
• Calculation: Applies the Rate of Change (ROC) function to the trading volume over the specified volumeLength.
• Purpose: Assesses the percentage change in trading volume, providing insight into the conviction behind price movements.
3. Trend Stability (trendStability)
• Calculation: Multiplies priceChange by volumeChange.
• Purpose: Combines price and volume changes to gauge the overall stability of the trend. A higher positive value suggests a strong and stable trend, while negative values may indicate trend weakness or reversal.
4. Trend Stability Index (TSI)
• Calculation: Applies a Simple Moving Average (SMA) to the trendStability over the trendLength period.
• Purpose: Smooths the trend stability data to create a more consistent and interpretable index.
Trend/Ranging Determination
• Stable Trend (isStable)
• Condition: When the TSI value is greater than 0.
• Interpretation: Indicates that the current trend is stable and likely to continue in its direction.
• Unstable Trend / Range-bound Market
• Condition: When the TSI value is less than or equal to 0.
• Interpretation: Suggests that the trend may be weakening, reversing, or that the market is moving sideways without a clear direction.
Visualization
The TSI indicator employs several visual elements to convey information effectively:
1. TSI Line
• Representation: Plotted as a blue line.
• Purpose: Displays the Trend Stability Index values over time, allowing traders to observe trend stability dynamics.
2. Neutral Horizontal Line
• Representation: A gray horizontal line at the 0 level.
• Purpose: Serves as a reference point to distinguish between stable and unstable trends.
3. Background Color
• Stable Trend: Green background with 80% transparency when isStable is true.
• Unstable Trend: Red background with 80% transparency when isStable is false.
• Purpose: Provides an immediate visual cue about the current trend’s stability, enhancing the interpretability of the indicator.
Usage Guidelines
• Identifying Trend Strength: Utilize the TSI to confirm the strength of existing trends. A consistently positive TSI suggests strong trend momentum, while a negative TSI may signal caution or a potential reversal.
• Volume Confirmation: The integration of volume changes helps in validating price movements. Significant price changes accompanied by corresponding volume shifts can reinforce the reliability of the trend.
• Entry and Exit Signals: Traders can use crossovers of the TSI with the neutral line (0 level) as potential entry or exit points. For instance, a crossover from below to above 0 may indicate a bullish trend initiation, while a crossover from above to below 0 could suggest bearish momentum.
• Combining with Other Indicators: To enhance trading strategies, consider using the TSI in conjunction with other technical indicators such as Moving Averages, RSI, or MACD for comprehensive market analysis.
Example Scenario
Imagine analyzing a stock with the following observations using the TSI:
• The TSI has been consistently above 0 for the past 30 periods, accompanied by increasing trading volume. This scenario indicates a strong and stable uptrend, suggesting that buying opportunities may be favorable.
• Conversely, if the TSI drops below 0 while the price remains relatively flat and volume decreases, it may imply that the current trend is losing momentum, and the market could be entering a consolidation phase or preparing for a trend reversal.
Conclusion
The Trend Stability Index is a valuable tool for traders seeking to assess the reliability and strength of market trends by integrating price and volume dynamics. Its customizable settings and clear visual indicators make it adaptable to various trading styles and market conditions. By incorporating the TSI into your trading analysis, you can enhance your ability to identify and act upon stable and profitable trends.
Global vs National Index Spread RSIThe Global vs National Index Spread RSI indicator visualizes the relative strength of national stock indices compared to a global benchmark (e.g., AMEX). It calculates the percentage spread between the closing prices of each national index and the global index, applying the Relative Strength Index (RSI) to each spread.
How It Works
Spread Calculation: The spread represents the percentage difference between a national index and the global index.
RSI Application: RSI is applied to these spreads to identify overbought or oversold conditions in the relative performance of the national indices.
Reference Lines: Overbought (70), oversold (30), and neutral (50) levels help guide interpretation.
Insights from Research
The correlation between global and national indices provides insights into market integration and interdependence. Studies such as Forbes & Rigobon (2002) emphasize the importance of understanding these linkages during periods of financial contagion. Observing spread trends with RSI can aid in identifying shifts in investor sentiment and regional performance anomalies.
Use Cases
- Detect divergences between national and global markets.
- Identify overbought or oversold conditions for specific indices.
- Complement portfolio management strategies by monitoring geographic performance.
References
Forbes, K. J., & Rigobon, R. (2002). "No contagion, only interdependence: Measuring stock market co-movements." Journal of Finance.
Eun, C. S., & Shim, S. (1989). "International transmission of stock market movements." Journal of Financial and Quantitative Analysis.
M2 Global Liquidity Index (Candles)M2 Global Liquidity Index (Candles)
In this enhanced version of the original M2 Global Liquidity Index script by Mik3Christ3ns3n , I've taken the foundational concept and expanded its capabilities for more in-depth analysis and user flexibility. This updated script aggregates M2 money supply data from major global economies—China, the U.S., the Eurozone, Japan, and the U.K.—adjusted by their respective exchange rates, into a customizable global liquidity index.
Key Enhancements:
Candlestick Visualization:
• Instead of a simple line chart, I've implemented a candlestick chart, providing a more detailed representation of liquidity trends with open, high, low, and close values for each period. This allows traders to analyze the index with the same technical tools used for price charts.
Customizable Components:
• Users can now select which components (M2 data and exchange rates) to include in the index calculation, giving you the flexibility to tailor the index to specific economic factors or regions of interest.
Dynamic Color Coding:
• Candles are color-coded based on their performance (bullish or bearish), with customized wick and border colors to enhance visual clarity, making it easier to spot liquidity trends at a glance.
Overlay Option:
• This script is designed to be an overlay, allowing you to plot the Global Liquidity Index directly on your price charts, facilitating comparison between liquidity trends and asset prices.
This enhanced script is ideal for traders and analysts who want a deeper understanding of global liquidity trends and their impact on financial markets.
Moonhub IndexMoonhub Index combines several popular technical indicators to create an aggregated index that aims to give a clearer overall picture of the market. The index takes into account the current market condition (trending, ranging, or volatile) to adjust its calculations accordingly.
The indicators used in this composite index are:
Hull Moving Average (HMA)
Fisher Transform (FT)
Williams Alligator
Moving Average Convergence Divergence (MACD)
Average True Range (ATR)
On-Balance Volume (OBV)
Money Flow Index (MFI)
Accumulation/Distribution (AD)
Pivot Points
True Strength Index (TSI)
Volume-Weighted Average Price (VWAP)
The script calculates the values of each indicator and then normalizes and weighs them according to predefined weights. The composite index is formed by summing the weighted values of each indicator. The final Moon Index is plotted on the chart, along with several other related lines like the exponential moving averages (EMA) and simple moving averages (SMA) of the index.
This custom index can be used by traders to get a more comprehensive view of the market and make better-informed trading decisions based on the combined insights of multiple indicators.

3 Bank IndexSpeaking on the reason for Bank Nifty hitting record high, Saurabh Jain, AVP — Research at SMC Global Securities said, "Reason for a rally in Bank Nifty can be attributed to three major reasons — hawkish interest rate regime making overseas lending dearer for big corporates in comparison to Indian lenders, rising interest rate expected to improve margins of Indian banks and lowering of provisioning strengthening the balance sheet of banking institutions. Today, the incremental credit ratio of Indian banks is more than 100 which is also attracting buying interest among Dalal Street bulls."
On Bank Nifty's current chart pattern, Sumeet Bagadia, Executive Director at Choice Broking said, "Bank Nifty has made a higher high higher low pattern on the chart that signals continuous uptrend in the index. The immediate target for the Bank Nifty index is 44,000 but once it gives closing above 44,000, we can expect more upside in the index."

Demand IndexLibrary "DemandIndex"
di()
The Demand Index is a complex technical indicator that uses price and volume to assess buying and selling pressure affecting a security.
James Sibbet established six rules for using Demand Index when the technical indicator was originally published. While traders may use variations of these rules, they serve as a great baseline for using the indicator in practice.
The six rules are as follows:
A divergence between the Demand Index and price is a bearish indication.
Prices often rally to new highs following an extreme peak in the Demand Index.
Higher prices with a low Demand Index often indicate a top in the market.
The Demand Index moving through the zero line suggests a change in trend.
The Demand Index remaining near the zero line indicates weak price movement that won’t last long.
A long-term divergence between the Demand Index and price predicts a major top or bottom.
Traders should use the Demand Index in conjunction with other technical indicators and chart patterns to maximize their odds of success.

STD Aadaptive, floating RSX Dynamic Momentum Index [Loxx]STD Aadaptive, floating RSX Dynamic Momentum Index is an attempt to improve Chande's original work on Dynamic Momentum Index. The full name of this indicator is "Standard-Deviation-Adaptive, floating-level, Dynamic Momentum Index on Jurik's RSX".
What Is Dynamic Momentum Index?
The dynamic momentum index is used in technical analysis to determine if a security is overbought or oversold. This indicator, developed by Tushar Chande and Stanley Kroll, is very similar to the relative strength index (RSI). The main difference between the two is that the RSI uses a fixed number of time periods (usually 14), while the dynamic momentum index uses different time periods as volatility changes, typically between five and 30.
What is RSX?
RSI is a very popular technical indicator, because it takes into consideration market speed, direction and trend uniformity. However, the its widely criticized drawback is its noisy (jittery) appearance. The Jurk RSX retains all the useful features of RSI, but with one important exception: the noise is gone with no added lag.
Differences
RSX is used instead of RSI for the calculation, producing a much smoother result
Standard deviation is used to adapt the RSX calculation
Floating levels are used instead of fixed levels for OB/OS
Included
-Change bar colors

Jurik CFB Adaptive, Elder Force Index w/ ATR Channels [Loxx]Jurik CFB Adaptive, Elder Force Index w/ ATR Channels is a variation of Elder Force Index that better adapts to trends by calculating dynamic lengths for the traditional Elder Force Index calculation. ATR channels are added to show levels of price extremes or exhaustion of price either up or down. Elder Force Index is typically used for spotting reversals on the weekly timeframe.
What is the Elder Force Index?
Dr. Alexander Elder is one of the contributors to a newer generation of technical indicators. His force index is an oscillator that measures the force, or power, of bulls behind particular market rallies and of bears behind every decline.1
The three key components of the force index are the direction of price change, the extent of the price change, and the trading volume. When the force index is used in conjunction with a moving average, the resulting figure can accurately measure significant changes in the power of bulls and bears.1 In this way, Elder has taken an extremely useful solitary indicator, the moving average, and combined it with his force index for even greater predictive success.
What is Composite Fractal Behavior ( CFB )?
All around you mechanisms adjust themselves to their environment. From simple thermostats that react to air temperature to computer chips in modern cars that respond to changes in engine temperature, r.p.m.'s, torque, and throttle position. It was only a matter of time before fast desktop computers applied the mathematics of self-adjustment to systems that trade the financial markets.
Unlike basic systems with fixed formulas, an adaptive system adjusts its own equations. For example, start with a basic channel breakout system that uses the highest closing price of the last N bars as a threshold for detecting breakouts on the up side. An adaptive and improved version of this system would adjust N according to market conditions, such as momentum, price volatility or acceleration.
Since many systems are based directly or indirectly on cycles, another useful measure of market condition is the periodic length of a price chart's dominant cycle, (DC), that cycle with the greatest influence on price action.
The utility of this new DC measure was noted by author Murray Ruggiero in the January '96 issue of Futures Magazine. In it. Mr. Ruggiero used it to adaptive adjust the value of N in a channel breakout system. He then simulated trading 15 years of D-Mark futures in order to compare its performance to a similar system that had a fixed optimal value of N. The adaptive version produced 20% more profit!
This DC index utilized the popular MESA algorithm (a formulation by John Ehlers adapted from Burg's maximum entropy algorithm, MEM). Unfortunately, the DC approach is problematic when the market has no real dominant cycle momentum, because the mathematics will produce a value whether or not one actually exists! Therefore, we developed a proprietary indicator that does not presuppose the presence of market cycles. It's called CFB (Composite Fractal Behavior) and it works well whether or not the market is cyclic.
CFB examines price action for a particular fractal pattern, categorizes them by size, and then outputs a composite fractal size index. This index is smooth, timely and accurate
Essentially, CFB reveals the length of the market's trending action time frame. Long trending activity produces a large CFB index and short choppy action produces a small index value. Investors have found many applications for CFB which involve scaling other existing technical indicators adaptively, on a bar-to-bar basis.
What is Jurik Volty used in the Juirk Filter?
One of the lesser known qualities of Juirk smoothing is that the Jurik smoothing process is adaptive. "Jurik Volty" (a sort of market volatility ) is what makes Jurik smoothing adaptive. The Jurik Volty calculation can be used as both a standalone indicator and to smooth other indicators that you wish to make adaptive.
What is the Jurik Moving Average?
Have you noticed how moving averages add some lag (delay) to your signals? ... especially when price gaps up or down in a big move, and you are waiting for your moving average to catch up? Wait no more! JMA eliminates this problem forever and gives you the best of both worlds: low lag and smooth lines.
Ideally, you would like a filtered signal to be both smooth and lag-free. Lag causes delays in your trades, and increasing lag in your indicators typically result in lower profits. In other words, late comers get what's left on the table after the feast has already begun.

NSE Bank Nifty - Arms Index (TRIN)
NSE Bank Nifty – Arms Index TRIN).
How it works?
By default, it considers all the constituents of Bank Nifty for calculation on TRIN
Input configuration parameters:
1. Advance/Decline Formula:
a. Based on same day open and close price
b. Based on todays close compared to previous day close
2. Plots:
a. TRIN
b. Simple moving average of TRIN
c. Advance/Decline Price line
d. Advance/Decline Volume line
About Arms Index (TRIN)
The Arms Index , also called the Short-Term Trading Index (TRIN) is a technical analysis indicator that compares the number of advancing and declining stocks (AD Ratio) to advancing and declining volume (AD volume ). It is used to gauge market sentiment. Richard W. Arms, Jr. invented it in 1967, and it measures the relationship between market supply and demand . It serves as a predictor of future price movements in the market, primarily on an intraday basis. It does this by generating overbought and oversold levels, which indicate when the index (and the majority of stocks in it) will change direction.
• If AD Volume creates a higher ratio than the AD Ratio, TRIN will be below one.
• If AD Volume has a lower ratio than AD Ratio, TRIN will be above one.
• A TRIN reading below one typically accompanies a strong price advance, since the strong volume in the rising stocks helps fuel the rally.
• A TRIN reading above one typically accompanies a strong price decline, since the strong volume in the decliners helps fuel the selloff.
• The Arms Index moves opposite the price trajectory of the Index. As discussed above, a strong price rally will see TRIN move to lower levels. A falling index will see TRIN push higher.
The Formula for Arms Index (TRIN) is:
Stock Ratio = Advancing stocks / Declining Stocks
Volume Ratio = Volume of Advancing stocks / Volume Declining Stocks
TRIN = Stock Ratio / Volume Ratio
What Does the Arms Index (TRIN) Tell You?
The Arms index seeks to provide a more dynamic explanation of overall movements in the composite value of stock exchanges, by analyzing the strength and breadth of these movements.
Neutral State: An index value of 1.0 indicates that the ratio of AD Volume is equal to the AD Ratio. The market is said to be in a neutral state when the index equals 1.0, since the up volume is evenly distributed over the advancing issues and the down volume is evenly distributed over the declining issues.
Bullish State: Many analysts believe that the Arms Index provides a bullish signal when it's less than 1.0, since there's greater volume in the average up stock than the average down stock.
Bearish State: On the other hand, a reading of greater than 1.0 is typically seen as a bearish signal, since there's greater volume in the average down stock than the average up stock.
The farther away from 1.00 the Arms Index value is, the greater the contrast between buying and selling on that day. A value that exceeds 3.00 indicates an oversold market and that bearish sentiment is too dramatic. This could mean an upward reversal in prices/index is coming.
Conversely, a TRIN value that dips below 0.50 may indicate an overbought market and that bullish sentiment is overheating.
Traders look not only at the value of the indicator but also at how it changes throughout the day. They look for extremes in the index value for signs that the market may soon change directions.
Limitations of Using the Arms Index (TRIN)
Here are two examples of instances where problems may occur:
• Suppose that a very bullish day occurs where there are twice as many advancing issues as declining issues and twice as much advancing volume as declining volume . Despite the very bullish trading, the Arms Index would yield only a neutral value of (2/1)/(2/1) = 1.0, suggesting that the index's reading may not be entirely accurate.
• Suppose that another bullish scenario occurs where there are three times as many advancing issues as declining issues and twice as much advancing volume than declining volume . In this case, the Arms Index would actually yield a bearish (3/1)/(2/1) = 1.5 reading, again suggesting an inaccuracy.
Source: www.investopedia.com

Relative Strength Index (OSC)Hello everyone, I'm sorry that the previous open-source version was hidden due to the house rules, I've re-edited the description and re-posted it
(1) Indicator introduction
This is RSI indicator with original divergence algorithm
This indicator is plotted on the RSI and can display the divergence locations and corresponding divergence intensity
The tolerance of N Klines at the top or bottom positions for price and indicator is supported, which is set by the "Tolerant Kline Number"
Support the display of divergence intensity, that is, the REG/HID value displayed on the label, which is less than 0. The smaller the intensity value, the more obvious divergence
Support the filtering of divergence intensity, which is set by "Cov Threshold". The divergence that REG/HID divergence intensity greater than this value will be ignored
In the label, REG indicates regular top/bottom divergence while HID indicates hidden top/bottom divergence
In the label, SRC(x-y) indicates a divergence occurred from the x-th kline to the y-th kline
In the label, OSC(x-y) indicates a divergence occurred from the indicator corresponding to the x-th kline to the y-th kline
(2) Parameter introduction
- RSI Settings
Source: The source to calculate RSI, close by default
RSI Length: The length of RSI, 14 by default
- RSI Divergence
Pivot Lookback Right: Number of K-line bars recalling the pivot top/bottom point to the right
Pivot Lookback Left: Number of K-line bars recalling the pivot top/bottom point to the left
Max of Lookback Range: Maximum number of retracing K-line bars to find the pivot top/bottom point
Min of Lookback Range: Minimum number of retracing K-line bars to find the pivot top/bottom point
Tolerant Kline Number: Maximum tolerance in indexing top/bottom points of Klines and indicators
Cov Threshold: Divergence intensity, which is less than 0. The smaller the intensity value, the more obvious divergence
Plot Bullish: Whether to draw regular bullish divergence label
Plot Hidden Bullish: Whether to draw hidden bullish divergence label
Plot Bearish: Whether to draw regular bearish divergence label
Plot Hidden Bearish: Whether to draw hidden bearish divergence label
Happy trading and enjoy your life!
————————————————————————————————————————
各位朋友大家好,很抱歉之前的开源版本因为规则原因被隐藏,我已经重新编辑了说明并重新发布
(1) 指标说明
该指标绘制于 RSI 上,并在对应位置显示背离点以及背离程度
支持顶底位置 N 根K线的容差,由 Tolerant Kline Number 参数设置
支持背离强度的显示,即标签上显示的 REG/HID 值,该值小于 0,且越小说明背离程度越大
支持背离强度的过滤,由 Cov Threshold 参数设置, REG/HID 值大于这个值的背离会被忽略
标签中,REG 表示常规顶/低背离,而 HID 表示隐藏顶/底背离
标签中,SRC(x-y) 表示从当前第 x 根 bar 开始到第 y 跟 bar 出现背离
标签中,OSC(x-y) 表示从当前第 x 根 bar 所对应的指标开始到第 y 跟 bar 所对应的指标出现背离
(2) 参数说明
- RSI Settings
Source: 计算 RSI 指标的 source,默认为 close
RSI Length: 计算 RSI 指标的长度,默认为 14
- RSI Divergence
Pivot Lookback Right: 枢纽顶/底点往右回顾的 K线 bar 数量
Pivot Lookback Left: 枢纽顶/底点往左回顾的 K线 bar 数量
Max of Lookback Range: 回寻找枢纽顶/底点的最大回溯 K线 bar 数量
Min of Lookback Range: 回寻找枢纽顶/底点的最小回溯 K线 bar 数量
Tolerant Kline Number: K线和指标的顶/底点索引的最大误差
Cov Threshold: 背离程度,该值小于 0,且越小说明背离程度越大
Plot Bullish: 是否绘制常规底背离提示
Plot Hidden Bullish: 是否绘制隐藏底背离提示
Plot Bearish: 是否绘制常规顶背离提示
Plot Hidden Bearish: 是否绘制隐藏顶背离提示
祝大家交易愉快

Relative Strength Index (SRC)Hello everyone, I'm sorry that the previous open-source version was hidden due to the house rules, I've re-edited the description and re-posted it
(1) Indicator introduction
This is RSI indicator with original divergence algorithm
This indicator is plotted on the klines and can display the divergence locations and corresponding divergence intensity
The tolerance of N Klines at the top or bottom positions for price and indicator is supported, which is set by the "Tolerant Kline Number"
Support the display of divergence intensity, that is, the REG/HID value displayed on the label, which is less than 0. The smaller the intensity value, the more obvious divergence
Support the filtering of divergence intensity, which is set by "Cov Threshold". The divergence that REG/HID divergence intensity greater than this value will be ignored
In the label, REG indicates regular top/bottom divergence while HID indicates hidden top/bottom divergence
In the label, SRC(x-y) indicates a divergence occurred from the x-th kline to the y-th kline
In the label, OSC(x-y) indicates a divergence occurred from the indicator corresponding to the x-th kline to the y-th kline
(2) Parameter introduction
- RSI Settings
Source: The source to calculate RSI, close by default
RSI Length: The length of RSI, 14 by default
- RSI Divergence
Pivot Lookback Right: Number of K-line bars recalling the pivot top/bottom point to the right
Pivot Lookback Left: Number of K-line bars recalling the pivot top/bottom point to the left
Max of Lookback Range: Maximum number of retracing K-line bars to find the pivot top/bottom point
Min of Lookback Range: Minimum number of retracing K-line bars to find the pivot top/bottom point
Tolerant Kline Number: Maximum tolerance in indexing top/bottom points of Klines and indicators
Cov Threshold: Divergence intensity, which is less than 0. The smaller the intensity value, the more obvious divergence
Plot Bullish: Whether to draw regular bullish divergence label
Plot Hidden Bullish: Whether to draw hidden bullish divergence label
Plot Bearish: Whether to draw regular bearish divergence label
Plot Hidden Bearish: Whether to draw hidden bearish divergence label
Happy trading and enjoy your life!
————————————————————————————————————————
各位朋友大家好,很抱歉之前的开源版本因为规则原因被隐藏,我已经重新编辑了说明并重新发布
(1) 指标说明
该指标绘制于 K线 上,并在对应位置显示背离点以及背离程度
支持顶底位置 N 根K线的容差,由 Tolerant Kline Number 参数设置
支持背离强度的显示,即标签上显示的 REG/HID 值,该值小于 0,且越小说明背离程度越大
支持背离强度的过滤,由 Cov Threshold 参数设置, REG/HID 值大于这个值的背离会被忽略
标签中,REG 表示常规顶/低背离,而 HID 表示隐藏顶/底背离
标签中,SRC(x-y) 表示从当前第 x 根 bar 开始到第 y 跟 bar 出现背离
标签中,OSC(x-y) 表示从当前第 x 根 bar 所对应的指标开始到第 y 跟 bar 所对应的指标出现背离
(2) 参数说明
- RSI Settings
Source: 计算 RSI 指标的 source,默认为 close
RSI Length: 计算 RSI 指标的长度,默认为 14
- RSI Divergence
Pivot Lookback Right: 枢纽顶/底点往右回顾的 K线 bar 数量
Pivot Lookback Left: 枢纽顶/底点往左回顾的 K线 bar 数量
Max of Lookback Range: 回寻找枢纽顶/底点的最大回溯 K线 bar 数量
Min of Lookback Range: 回寻找枢纽顶/底点的最小回溯 K线 bar 数量
Tolerant Kline Number: K线和指标的顶/底点索引的最大误差
Cov Threshold: 背离程度,该值小于 0,且越小说明背离程度越大
Plot Bullish: 是否绘制常规底背离提示
Plot Hidden Bullish: 是否绘制隐藏底背离提示
Plot Bearish: 是否绘制常规顶背离提示
Plot Hidden Bearish: 是否绘制隐藏顶背离提示
祝大家交易愉快

Directional Movement Index + Fisher Price Action With LabelsDIRECTIONAL MOVEMENT INDEX + FISHER PRICE ACTION WITH LABELS
Directional Movement Index shows buy and sell pressure.
Fisher transform shows price action trending bullish or bearish.
Caution dots notify you of conflicting trends.
***HOW TO USE***
The top lines are the fisher transform showing you the price action trend.
The bottom lines filled with color shows the DMI directional movement index.
The yellow dots at the bottom tell you if these two indicators are currently giving conflicting signals.
DMI
If the green line is above the red line and the background is colored green, there is more market buying than selling.
If the red line is above the green line and the background is colored red, there is more market selling than buying.
FISHER TRANSFORM
If the lines are painted green, the price action is trending up.
If the lines are painted red, the price action is trending down.
CAUTION DOTS
If a yellow dot shows up at the bottom of the chart, it is notifying you that the DMI and Fisher Transform are currently giving opposite signals…. so use caution.
***BULLISH/BEARISH LABEL***
There is also a label on the right side that tells you whether there is more buying or selling. This table updates in real time and changes colors so you can get an easy, quick interpretation of the current buy/sell pressure without having to look at the indicator data so you can make faster decisions on whether to enter or exit a trade.
Green means more market buying than selling.
Red means more market selling than buying.
Blue means an equal amount of market buying and selling.
If buying pressure is bullish but below the 20 level, a second label will show up in purple letting you know there is weak buying pressure so use caution.
If selling pressure is bearish but below the 20 level, a second label will show up in purple letting you know there is weak selling pressure so use caution.
There is a third label showing the current trend of the fisher transform. Green means bullish price action. Red means bearish price action.
The fourth label is orange and only shows up when the DMI and Fisher Transform are currently giving opposite signals, so make sure you use caution during those times.
***MARKETS***
This indicator can be used as a signal on all markets, including stocks, crypto, futures and forex.
***TIMEFRAMES***
This directional movement index + fisher transform indicator can be used on all timeframes.
***TIPS***
Try using numerous indicators of ours on your chart so you can instantly see the bullish or bearish trend of multiple indicators in real time without having to analyze the data. Some of our favorites are our Auto Fibonacci, Volume Profile, Momentum, Auto Support And Resistance and Money Flow Index in combination with this Directional Movement Index + Fisher Transform. They all have real time Bullish and Bearish labels as well so you can immediately understand each indicator's trend.

High-Low IndexHello All,
High-Low Index is a breadth indicator based on Record High Percent (RHP). RHP is based on new 52-week highs and new 52-week lows. RHP => 100 * (new highs) / (new highs + new lows). High-Low Index is a 10-day Simple Moving Average of the RHP, which makes it a smoothed version of RHP. You can find many articles about High-Low Index on the net.
High-Low Index above 50 indicates that there are more new highs than new lows, and considered as Bullish.
High-Low Index below 50 indicates that there are more new lows than new highs, and considered as Bearish.
High-Low Index = 0 indicates there is no new highs (0% new highs).
High-Low Index = 100 indicates that there is at least 1 new high and no new lows.
and High-Low Index = 50 indicates that new highs and new lows is equal.
by default 40 cryptos are used in the script and shows High-Low Index for these cryptos. but you can change them as you wish. for example you can set all of them as stocks and see High-Low Index for these stocks.
You can set " Time frame " and the " Length " using the options. For example; if you set " Time frame " = 1 Week and the " Length " = 52 then it finds High-Low Index for 52weeks .
or another example; if you set " Time frame " = 1 Day and the " Length " = 22 the High-Low Indexn it finds High-Low Index for 22days.
You can enable/disable Record High Percent or Simple Moving Average of High-Low Index. Some traders use High-Low Index with its SMA, for example; High-Low Index generates a buy signal when it crosses above its moving average, and a sell signal when it crosses below its moving average.
Optionally you can see the securities in a table on the left bottom, you can change table size by usşng the options.
In the Table, for each security/cell;
=> if background is green then it has New High
=> if background is red then it has New Low
=> if background is gray then no New High, no New Low
=> if background is back then Data is not available for the security
As you can see in the screenshot below, the securities were changed and stocks are used instead of cryptos, so it calculates & shows High-Low Index for these stocks.
you can also find explanation in this screenshot:
Enjoy!

OWRS VolatilililityBit of a fun indicator taking into the asset names and natural processes and also the fact that the crypto markets are (definitely) not run by weird occultists and naturalists. Looks for disturbances in price of these four key assets. Read into it what you will. Sometimes the clues are just in the names.
Things you will learn from this script:
1. Using security function to compare multiple assets in one indicator.
2. Using indexing to reference historic data.
3. Setting chart outputs such as color based on interrogation of a boolean.
4. To only go back 3-4 iterations of any repeatable sequence as chaos kicks in after 3.55 (Feigenbaum)
1. By extension only the last 3 or 4 candles are of any use in indicator creation.
2. I am almost definitely a pagan.
3. You were expecting this numbered list to go 1,2,3,4,5,6,7. na mate. Chaos.
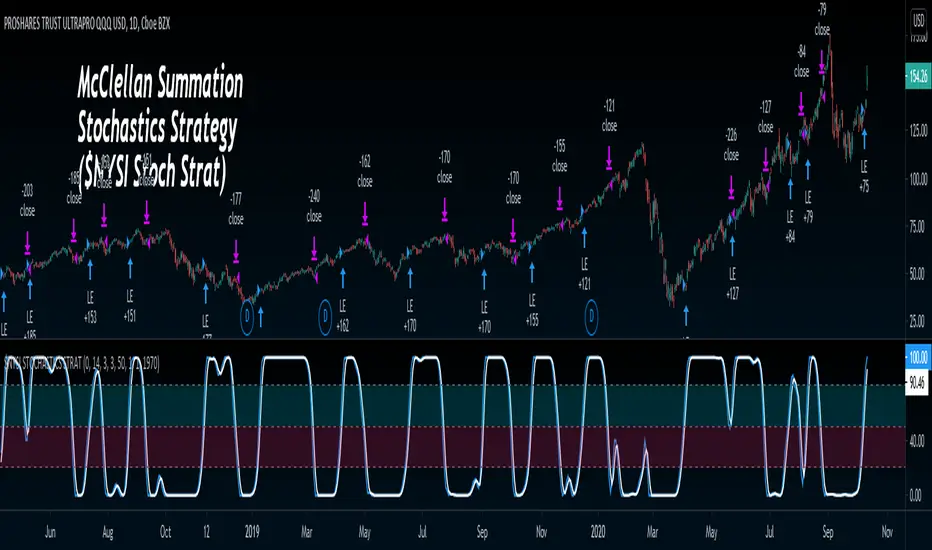
TKP McClellan Summation Index Stochastics StrategyThis strategy uses NYSE McClellan summation Index as an input for Stochastics to produce Buy/Sell signals. Buy signal is produced when Stochastics K Line Closes over 50, and Sell signal when closes under 50.
Info on McClellan Summation Index: www.investopedia.com
Info on Stochastics: www.investopedia.com
Simple yet effective strategy, let me know if you have any questions!
Trading Psychology - Fear & Greed Index by DGTPsychology of a Market Cycle - Where are we in the cycle?
Before proceeding with the question "where", let's first have a quick look at "What is market psychology?"
Market psychology is the idea that the movements of a market reflect the emotional state of its participants. It is one of the main topics of behavioral economics - an interdisciplinary field that investigates the various factors that precede economic decisions. Many believe that emotions are the main driving force behind the shifts of financial markets and that the overall fluctuating investor sentiment is what creates the so-called psychological market cycles - which is also dynamic.
Stages of Investor Emotions:
* Optimism – A positive outlook encourages us about the future, leading us to buy stocks.
* Excitement – Having seen some of our initial ideas work, we begin considering what our market success could allow us to accomplish.
* Thrill – At this point we investors cannot believe our success and begin to comment on how smart we are.
* Euphoria – This marks the point of maximum financial risk. Having seen every decision result in quick, easy profits, we begin to ignore risk and expect every trade to become profitable.
* Anxiety – For the first time the market moves against us. Having never stared at unrealized losses, we tell ourselves we are long-term investors and that all our ideas will eventually work.
* Denial – When markets have not rebounded, yet we do not know how to respond, we begin denying either that we made poor choices or that things will not improve shortly.
* Fear – The market realities become confusing. We believe the stocks we own will never move in our favor.
* Desperation – Not knowing how to act, we grasp at any idea that will allow us to get back to breakeven.
* Panic – Having exhausted all ideas, we are at a loss for what to do next.
* Capitulation – Deciding our portfolio will never increase again, we sell all our stocks to avoid any future losses.
* Despondency – After exiting the markets we do not want to buy stocks ever again. This often marks the moment of greatest financial opportunity.
* Depression – Not knowing how we could be so foolish, we are left trying to understand our actions.
* Hope – Eventually we return to the realization that markets move in cycles, and we begin looking for our next opportunity.
* Relief – Having bought a stock that turned profitable, we renew our faith that there is a future in investing.
It's hard to predict with certainty where we exactly are in the market cycle, we can only make an educated guess as to the rough stage based on data available. And here comes the study "Trading Psychology - Fear & Greed Index"
Factors taken into account in this study include:
1-Price Momentum : Price Divergence/Convergence versus its Slow Moving Average
2-Strenght : Rate of Return (RoR) also called Return on Investment (ROI) is a performance measure used to evaluate the efficiency of an investment, net gain or loss of an investment over a specified time period, the rate of change in price movement over a period of time to help investors determine the strength
3-Money Flow : Chaikin Money Flow (CMF) is a technical analysis indicator used to measure Money Flow Volume over a set period of time. CMF can be used as a way to further quantify changes in buying and selling pressure and can help to anticipate future changes and therefore trading opportunities. CMF calculations is based on Accumulation/Distribution
4-Market Volatility : CBOE Volatility Index (VIX), the Volatility Index, or VIX, is a real-time market index that represents the market's expectation of 30-day forward-looking volatility. Derived from the price inputs of the S&P 500 index options, it provides a measure of market risk and investors' sentiments. It is also known by other names like "Fear Gauge" or "Fear Index." Investors, research analysts and portfolio managers look to VIX values as a way to measure market risk, fear and stress before they take investment decisions
5-Safe Haven Demand : in this study GOLD demand is assumed
What to look for :
*Fear and Greed Index as explained above,
*Divergencies
Tool tip of the label displayed provides details of references
Conclusion:
As investors, we always get caught up in the day to day price movements, and lose sight of the bigger picture. The biggest crashes happen not when investors are cautious and fearful, it's when they're euphoric and expecting financial instruments to continue going higher. So as we continue investing, don’t forget to stop and ask yourself, where in the chart do you think we are right now? The Market Psychology Cycle shines light on how emotions evolve, fear and greed index can come in handy, provided that it is not the only tool used to make investment decisions. It is easy to look back at market cycles and recognize how the overall psychology changed. Analyzing previous data makes it obvious what actions and decisions would have been the most profitable. However, it is much harder to understand how the market is changing as it goes - and even harder to predict what comes next. Many investors use technical analysis (TA) to attempt to anticipate where the market is likely to go. Investors are advised to keep tabs on fear for potential buying the dips opportunities and view periods of greed as a potential indicator that financial instruments might be overvalued.
Warren Buffett's quote, buy when others are fearful, and sell when others are greedy
Trading success is all about following your trading strategy and the indicators should fit within your trading strategy, and not to be traded upon solely
Disclaimer : The script is for informational and educational purposes only. Use of the script does not constitute professional and/or financial advice. You alone have the sole responsibility of evaluating the script output and risks associated with the use of the script. In exchange for using the script, you agree not to hold dgtrd TradingView user liable for any possible claim for damages arising from any decision you make based on use of the script

RSI + Composite Index [SHK]One of the most powerful indicator based and divergence strategies i have ever seen was made by Constance Brown.
The Composite Index:
The best way to think of the Composite Index as it applies to the RSI is to think of the RSI as Windows 3.0 and the Composite Index as Windows 10. Constance Brown discovered that the RSI, while it does create and detect divergences, does is not as accurate as it could be. It’s a bit of an oxymoron to say this but the RSI is a momentum indicator without any momentum calculation attached to it. The RSI actually misses a significant amount of important moves and even generates some bad moves. What Constance Brown did with the RSI is to input a momentum calculation within the RSI itself.
Usage:
1. Check hidden and regular divergences on RSI+COMPOSITE_INDEX and PRICE+COMPOSITE_INDEX.
2. After finding divergence wait for COMPOSITE_INDEX to cross under/over it's moving averages to trigger.
Useful Note:
"RSI overbought/oversold as filter", "RSI and COMPOSITE_INDEX trendline as trigger", "RSI 50 Over/Under as trend direction detection", ... can be add to this strategy.
Enjoy!
