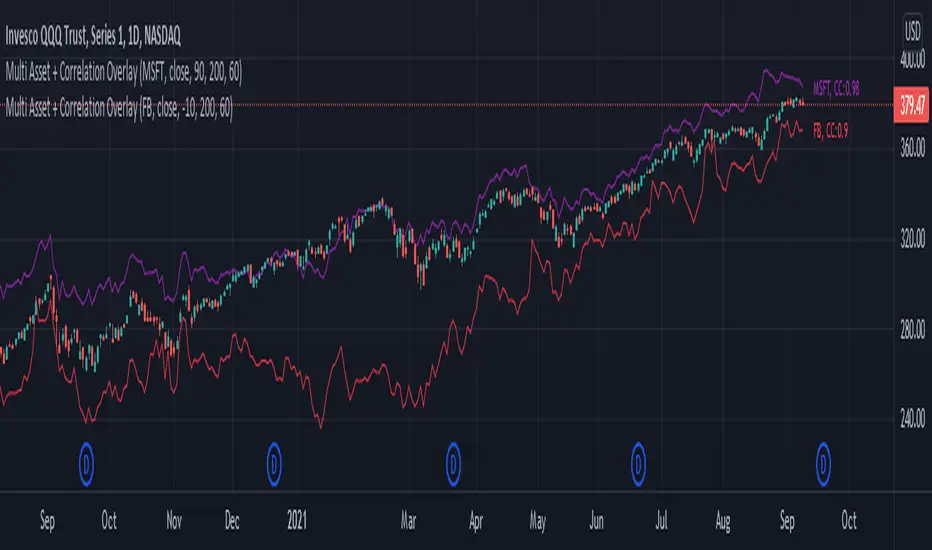
Multi Asset + Correlation OverlayFrom time to time, you may want to overlay multiple assets on the same chart instead of using multi-chart views. This can be a much cleaner way of viewing and comparing multiple assets. There is some functionality built into TradingView that lets you do this to a certain extent, but I wanted additional options, correlation labeling and ways to adjust the overlay location. So, today I am releasing to the community my Multi-Asset + Correlation Overlay script / indicator.
What is does: This script allows you to overlay the price of any ticker onto your chart. It also labels the line with the ticker name, and calculates / labels the correlation coefficient of your newly overlayed asset.
How to use it: Add the indicator to your chart. Then, go into the indicator settings to set the ticker of the asset you want to pull in along with how you want to "offset" it. Your 2 tickers may not be priced near each-other, so the offset setting allows you to pull the ticker you added up/down to better visually align with your chart's price range/layout. For instance, if the asset you added is priced $400 higher than the underlying chart price, you may want to set the offset to -400.
If you would like to add multiple tickers and multiple overlays, you can do that by just adding the indicator to your chart more than once. The color is adjustable, and the ticker of the asset will print to the right of the line representing the asset price. The script also calculates the correlation coefficient between the ticker overlay and the underlying chart asset. The correlation coefficient prints to the right of the ticker.
Tìm kiếm tập lệnh với "indicator"
SMI Ergodic Indicator Bar ColorsThis script simply displays bar colors corresponding to the SMI Ergodic Indicator. It does not display the oscillator or indicator itself. I prefer not to crowd my display with too many oscillators - others may find this script useful as well. Used in conjunction with other indicators, the SMII can give early reversal signals.
Thanks to the TV community.

Ergodic Mean Deviation Indicator [CC]The Ergodic Mean Deviation Indicator was created by William Blau and this is a hidden gem that takes the difference between the current price and it's exponential moving average and then double smooths the result to create this indicator. This double smoothing of course creates a lag that allows it to give off a sustained buy signal during a bullish trend and vice versa. This is a very fun indicator to experiment with and surprised that no one on here gives William Blau much attention so I will go ahead and publish the rest of his scripts eventually. I have included strong buy and sell signals in addition to normal ones so strong signals are darker in color and normal signals are lighter in color. Buy when the line turns green and sell when it turns red.
Let me know if there are any other indicators or scripts you would like to see me publish!

Divergence for Many Indicators v4 STHello Traders.
This is the Strategy version of Divergence for Many Indicators v4, an easy and comfortable indicator.
- - - -
*It's been modified a little bit from the original.
*I got permission from the original author.
*I'm not good at English, I'm sorry.
- - - -
< 4 things to check >
1. Since repainting is not performed, the first imprinted signal can be accurately seen.
2. It does not respond to continuous diversions.
3. If the opposite diversity is not imprinted, caution is required as it is designed not to indicate liquidation. Be careful when reading the figures shown in the strategy tester.
4. Added stop loss and take propirane.
< What changed? >
1. pivot period 5 - > 9
2. Money Flow index and Chaikin Money Flow are released.
- - - -
KOR SUB
< 4가지 확인 사항 >
1. 리페인팅이 없으므로 첫 번째로 각인된 신호를 정확히 볼 수 있습니다.
2. 연속된 다이버젼스에 대해서는 반응하지 않습니다.
3. 반대의 다이버젼스가 각인되지 않으면 청산 표시를 하지 않도록 설계되어 있으므로 주의를 요합니다.
4. 스탑 로스와 테이크 프로핏 항목을 추가하였습니다.
< 무엇이 변경되었나? >
1. 피봇 페리어드 값이 조금 수정되었습니다.
2. MFI & CMF 가 체크 해제된 상태입니다.
THANK YOU ^^

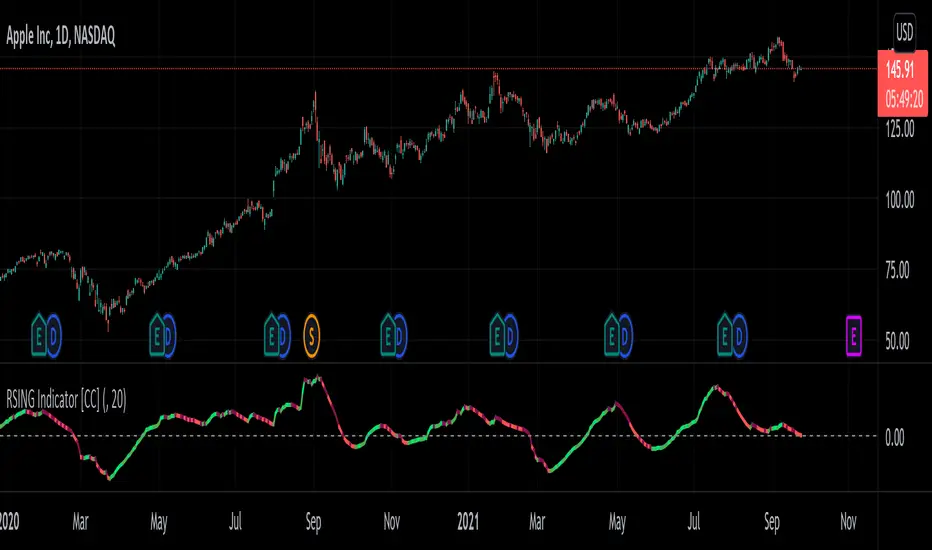
RSING Indicator [CC]The RSING indicator was created by Alon Horesh (Stocks & Commodities March 2021 pg 11) and this aims to be a better version of rsi that adapts to volume as well as a focus on overall strength. This is trying to fix the issues with the traditional RSI with a lack of volume and the issue where you could have the indicator stay in overbought or oversold territory but the upward or downward momentum continues. This indicator takes ratios of the current volume to it's moving average, the overall momentum of the stock, and the current range in comparison to the std deviation of it's past range and multiplies them all together to create this new indicator. I smooth it with a moving average for easier to read buy and sell signals. I have included strong buy and sell signals as darker colors and normal buy and sell signals as lighter colors. Buy when the line turns green and sell when it turns red.
Let me know if there are any other indicators you would like to see me publish!
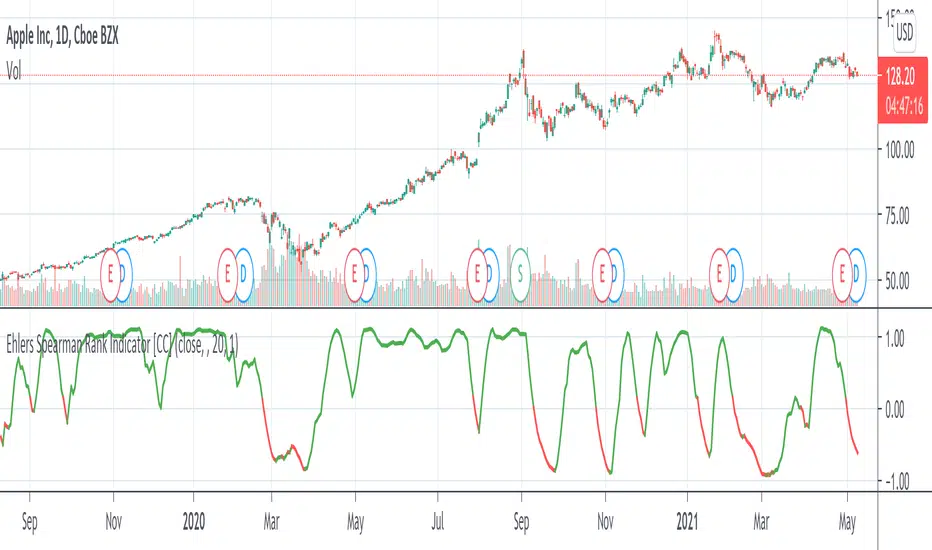
Ehlers Spearman Rank Indicator [CC]The Spearman Rank Indicator was created by John Ehlers (Stocks and Commodities July 2020 pg 6) and this works well as a trend confirmation indicator. This is obviously his take on the Spearman Ranking Correlation and make sure to let me know what you think! Buy when the line turns green and sell when it turns red.
Let me know if there are any other indicators you want me to publish!
FIBS S/R IndicatorHello,
I've decided to publish a new script. The previous version of this script was removed by admins for breaking community rules.
So I present to you the Fibonacci Support / Resistance.
1. How does it work
Ratio plots
I first take the input of pivot look back and search for pivots high and low.
And then it takes a second look back to search highest high and lowest low to establish the top bottom range.
Then using the top and bottom I plot ratios provided as input. Defaults to most relevant 5 ratios I've found (Fibonacci):
Ratio 0 = 0 - can't be changed
Ratio 1 = 0.5
Ratio 2 = 0.618
Ratio 3 = 1
Ratio 4 = 1.618
Ratio 5 = 2.618
Any changes done to these ratios should be in order, otherwise conditions could get messed up. So R1 needs to the lowest and R5 the highest.
Also the same ratios are used in reverse as negative ratios.
There is a option to plot all ratios but gets really confusing for me but maybe for you it works. By default there are certain conditions set so that as we go up new resistance ratio get displayed and as we go down we see new resistance plots.
Trendlines
I've also added some automatic trendline plots with breakout warning labels based on the pivots high and low. Start and end for trendlines can be changed via inputs.
Labels can be deactivated via input. On a older version the trendlines and labels where not removed from the chart but I felt like there was to much information.
Overcooked/Undercooked
I've also added some fills and background colors that indicate if the price action is over R5 or under Negative R5 ratios. This usually indicates some "overcooking" or "undecooking".
I've notices that after "crossunder"/"crossover" top bottom ratios it goes in consolidation or it dumps. So then I plot a bgcolor to signal that.
2. How to use it
Using plot lines we can determine where we have support and resistance. I found that the best way to use the default ratios values is on the 1H chart. Very good for trading on crypto because of current situation in the market where there is a lot of new people entering the space and volatility and sentiment make swings respect the Fibonacci ratios.
3. Examples
For instance lets look at BINANCE:BTCUSDT .
On the left we see that the price action between 20 and 21 February was "overcooked". So after we got the signal that we "crossunder" the R5 the signal was triggered and we got a small red candle followed by a small dip and after that we got a small bounce and a dump.
If we also look at MF-RSI we can also see we got multiple bear divs.
Lets entertain the idea that we went short at ~57.1k as soon as we get signaled and it starts dumping.
Where does it stop ?
We can see it went all the way down to Negative R5 ratio. Normally that should signal "undercooking" but this was not triggered as it did not close under it (signaled in green).
We can also see that previous support now becomes resistance (signaled in red).
If we take a look at BINANCE:ETHUSDT , we do see that the "undercooking" was triggered here.
I will be publishing a more detailed Idea with examples of using this on the BINANCE:BTCUSDT chart in combination with Volume and other technical analysis.
Use with caution, this is not 100% signal indicator as the markets do what they want. But by using this in combination with other indicators like MF-RSI, EMAs and regular patterns we can get some targets for Support/Resistance.
I'm trying to create a strategy based on this indicator but I'm not getting very good results. Best results were on the 15 min chart with gross profits around ~50%.
Please try to play around with the inputs and let me know if you find something interesting, maybe I can incorporate new features in the indicator.
You can find the MF-RSI indicator here

Trend Indicators CollectionAnalyses MACD crosses with Ichimoku cloud direction and state
General idea:
- MACD crosses usually point to a change in trend direction and Kumo state and direction often act as a confirmation as well as a trend strength indicator. Using this, the script points out where there were was or can be a point where the trend change may have the strength to carry on.
Buy warnings:
- This warning will be triggered in two ways, both of them only if MACD is above EMA and the current close price is over Kumo:
- Senku span A crosses over Senku B (Kumo turns positive) when MACD is already positive
- MACD turns positive when Kumo is already positive
Sell warnings
- Triggered in two ways:
- Kumo turns negative when the current close price is bellow EMA
- The inverse of the above, the current close price falls bellow EMA when the Kumo is already negative
Trend Indicators Collection (TIC) contains:
- MACD, EMA, ADX, Mass index, Ichimoku Cloud, and Pivot points
- Best suited for monthly charts with 30m bars

On Chart Anticipated Moving Average Crossover IndicatorIntroducing the on chart moving average crossover indicator.
This is my On Chart Pinescript implementation of the Anticipated Simple Moving Average Crossover idea.
This indicator plots 6 user defined moving averages.
It also plots the 5 price levels required on the next close to cross a user selected moving average with the 5 other user defined moving averages
It also gives signals of anticipated moving average crosses as arrows on chart and also as tradingview alerts with a very high degree of accuracy
Much respect to the creator of the original idea Mr. Dimitris Tsokakis
Moving Averages
A moving average simplifies price data by smoothing it out by averaging closing prices and creating one flowing line which makes seeing the trend easier.
Moving averages can work well in strong trending conditions, but poorly in choppy or ranging conditions.
Adjusting the time frame can remedy this problem temporarily, although at some point, these issues are likely to occur regardless of the time frame chosen for the moving average(s).
While Exponential moving averages react quicker to price changes than simple moving averages. In some cases, this may be good, and in others, it may cause false signals.
Moving averages with a shorter look back period (20 days, for example) will also respond quicker to price changes than an average with a longer look back period (200 days).
Trading Strategies — Moving Average Crossovers
Moving average crossovers are a popular strategy for both entries and exits. MAs can also highlight areas of potential support or resistance.
The first type is a price crossover, which is when the price crosses above or below a moving average to signal a potential change in trend.
Another strategy is to apply two moving averages to a chart: one longer and one shorter.
When the shorter-term MA crosses above the longer-term MA, it's a buy signal, as it indicates that the trend is shifting up. This is known as a "golden cross."
Meanwhile, when the shorter-term MA crosses below the longer-term MA, it's a sell signal, as it indicates that the trend is shifting down. This is known as a "dead/death cross."
MA and MA Cross Strategy Disadvantages
Moving averages are calculated based on historical data, and while this may appear predictive nothing about the calculation is predictive in nature.
Moving averages are always based on historical data and simply show the average price over a certain time period.
Therefore, results using moving averages can be quite random.
At times, the market seems to respect MA support/resistance and trade signals, and at other times, it shows these indicators no respect.
One major problem is that, if the price action becomes choppy, the price may swing back and forth, generating multiple trend reversal or trade signals.
When this occurs, it's best to step aside or utilize another indicator to help clarify the trend.
The same thing can occur with MA crossovers when the MAs get "tangled up" for a period of time during periods of consolidation, triggering multiple losing trades.
Ensure you use a robust risk management system to avoid getting "Chopped Up" or "Whip Sawed" during these periods.

InfoPanel Indicators microtrendThis panel shows current value and trend of some well knonw indicators. It may be usefull because you have all indicators in one panel only.
thanks to: RicardoSantos for his script of panel coding
Tradingview scripts
Please use comment section for any feedback.

Average Indicators Positionsby this script you can see the average level of macd, macd-asprey, rsi, stochastic, cci, momentum, obv, DI, volume weighted macd, cmf indicators within a period. It also calculates and creates the same graph for higher time frame, so you can see average levels for current and higher time frame. you can also check it for divergence/convergence. You can use it as you wish and add/remove indicators.

Inverted Yield Curve IndicatorThe last seven recessions were preceded by an inverted yield curve. This is preset to the 2 year and 10 year US bond, weekly, but you can set it to whatever you like.
Published with source code for anyone to modify. This is the first in a series of indicators I intend to publish as a package of economic recoverty/recession symptom indicators.

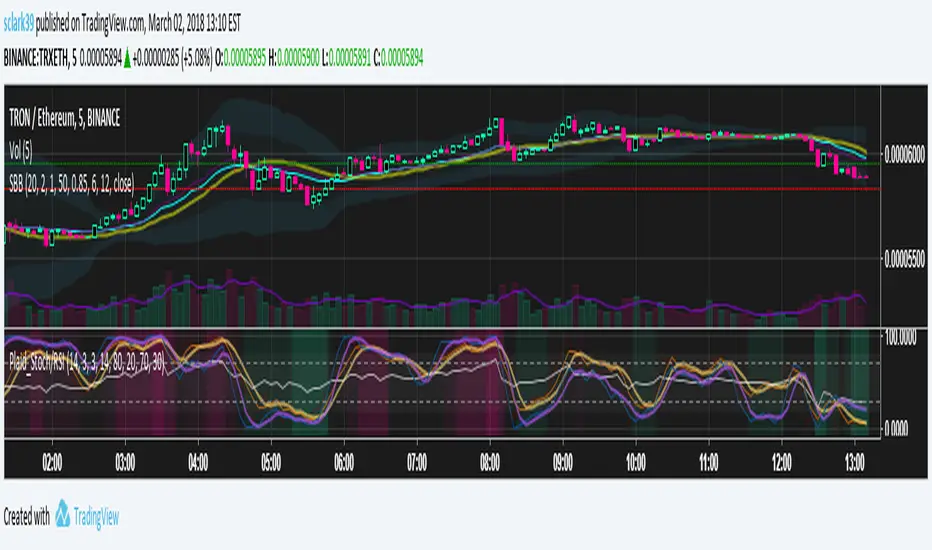
Plaid Stochastic / RSI Triple Combo Indicator [sclark39]Welcome to my "Plaid" Stochastic / RSI / StochRSI Combo indicator.
This shows the Fast and Slow Stochastic (orange and yellow), Relative Strength Index (white), and the Stochastic RSI (purple). As the lines cross the 80/20 and 70/30 lines, the background color changes to make it easy to see at a glance how many of the indicators have crossed their threshold. In the options you can change the period lengths and hide/show each of type of indicator to best fit your trading style.
Use this indicator for trades at your own risk, I made this for fun and it is not a trade recommendation.
That being said, if you like my work please tip me!
ETH: 0xf8E0Ea503B5c833fD4546E7fa2c70EcE42A27C8A
Please comment with feedback and requests!
Combo IndicatorFor easier setup, this script combines 5 indicators. 3 simple moving averages, 1 EMA and Bollinger Bands. These are common indicators that are that often used and discussed on OptionsPlayers.com
Power Law Correlation Indicator 2.0 The Power Law Correlation Indicator is an attempt to chart when a stock/currency/futures contract goes parabolic forming a upward or downward curve that accelerates according to power laws.
I've read about power laws from Sornette Diedler ( www.marketcalls.in ). And I think the theory is a good one.
The idea behind this indicator is that it will rise to 1.0 as the curve resembles a parabolic up or down swing. When it is below zero, the stock will flatten out.
There are many ways to use this indicator. One way I am testing it out is in trading Strangles or Straddle option trades. When this indicator goes below zero and starts to turn around, it means that it has flattened out. This is like a squeeze indicator. (see the TTM squeeze indicator).
Since this indicator goes below zero and the squeeze plays tend to be mean-reverting; then its a great time to put on a straddle/strangle.
Another way to use it is to think of it in terms of trend strength. Think of it as a kind of ADX, that measures the trend strength. When it is rising, the trend is strong; when it is dropping, the trend is weak.
Lastly I think this indicator needs some work. I tried to put the power (x^n) function into it but my coding skill is limited. I am hoping that Lazy Bear or Ricardo Santos can do it some justice.
Also I think that if we can figure out how to do other power law graphs, perhaps we can plot them together on one indicator.
So far I really like this one for finding Strangle spots. So check it out.
Peace
SpreadEagle71

CM RSI-2 Strategy - Upper Indicators.RSI-2 Strategy
***At the bottom of the page is a link where you can download the PDF of the Backtesting Results.
This year I am focusing on learning from two of the best mentors in the Industry with outstanding track records for Creating Systems, and learning the what methods actually work as far as back testing.
I came across the RSI-2 system that Larry Connors developed. Larry has become famous for his technical indicators, but his RSI-2 system is what actually put him “On The Map” per se. At first glance I didn’t think it would work well, but I decided to code it and ran backtests on the S&P 100 In Down Trending Markets, Up Trending Markets, and both combined. I was shocked by the results. So I thought I would provide them for you. I also ran a test on the Major forex Pairs (12) for the last 5 years, and All Forex Pairs (80) from 11/28/2007 - 6/09/2014, impressive results also.
The RSI-2 Strategy is designed to use on Daily Bars, however it is a short term trading strategy. The average length of time in a trade is just over 2 days. But the results CRUSH the general market averages.
Detailed Description of Indicators, Rules Below:
Link For PDF of Detailed Trade Results
d.pr
Original Post

Trend Follow Line Point📌 Trend Follow Line Point
The Trend Follow Line Point indicator removes the confusing, repainting-based swing connections commonly found in traditional swing tools.
It maintains consistent swing-point calculation, keeps structural swing lines intact even when trend lines are broken, and integrates market structure + trend + volatility + volume into one intuitive, visual indicator.
This tool is designed for:
Trend Following
Swing Structure Analysis
Volatility-Based Entry & Exit
Market Strength Evaluation
📊 Component Explanation
🔹 1. Swing High / Swing Low Detection
Based on the user-defined sensitivity (swgLen):
A Swing High forms when the current high exceeds the previous swgLen highs.
A Swing Low forms when the current low falls below the previous swgLen lows.
🔹 2. Swing-Based Structure Lines
Connect Swing Highs → Structural visualization
Connect Swing Lows → Structural visualization
These lines reveal the underlying market structure without repainting or disappearing unexpectedly.
🔹 3. Dynamic ATR + Volume Weighting
ATR values combined with the volume ratio (vol / volMA) create a dynamic volatility channel that reflects real-time market pressure.
🔹 4. Enhanced SuperTrend Calculation
Uses ATR-based stability to produce more realistic and smoother trend lines, reducing noise and improving signal clarity.
🔹 5. Trend Color Mapping
Up Trend → User-selected color
Down Trend → User-selected color
Visual trend direction and strength can be identified immediately.
🧭 How to Use
When Swing Highs/Lows are detected, structure lines are automatically drawn between previous swings.
Use these lines to evaluate support/resistance breaks and overall structural direction.
Manage risk with volatility guidance:
Higher ATR (volume-weighted) → wider trend spacing → increased risk
Lower ATR → tighter spacing → reduced risk
This helps with position sizing, entry timing, and exit decisions.
+

Luxy Momentum, Trend, Bias and Breakout Indicators V7
TABLE OF CONTENTS
This is Version 7 (V7) - the latest and most optimized release. If you are using any older versions (V6, V5, V4, V3, etc.), it is highly recommended to replace them with V7.
Why This Indicator is Different
Who Should Use This
Core Components Overview
The UT Bot Trading System
Understanding the Market Bias Table
Candlestick Pattern Recognition
Visual Tools and Features
How to Use the Indicator
Performance and Optimization
FAQ
---
### CREDITS & ATTRIBUTION
This indicator implements proven trading concepts using entirely original code developed specifically for this project.
### CONCEPTUAL FOUNDATIONS
• UT Bot ATR Trailing System
- Original concept by @QuantNomad: (search "UT-Bot-Strategy"
- Our version is a complete reimplementation with significant enhancements:
- Volume-weighted momentum adjustment
- Composite stop loss from multiple S/R layers
- Multi-filter confirmation system (swing, %, 2-bar, ZLSMA)
- Full integration with multi-timeframe bias table
- Visual audit trail with freeze-on-touch
- NOTE: No code was copied - this is a complete reimplementation with enhancements.
• Standard Technical Indicators (Public Domain Formulas):
- Supertrend: ATR-based trend calculation with custom gradient fills
- MACD: Gerald Appel's formula with separation filters
- RSI: J. Welles Wilder's formula with pullback zone logic
- ADX/DMI: Custom trend strength formula inspired by Wilder's directional movement concept, reimplemented with volume weighting and efficiency metrics
- ZLSMA: Zero-lag formula enhanced with Hull MA and momentum prediction
### Custom Implementations
- Trend Strength: Inspired by Wilder's ADX concept but using volume-weighted pressure calculation and efficiency metrics (not traditional +DI/-DI smoothing)
- All code implementations are original
### ORIGINAL FEATURES (70%+ of codebase)
- Multi-Timeframe Bias Table with live updates
- Risk Management System (R-multiple TPs, freeze-on-touch)
- Opening Range Breakout tracker with session management
- Composite Stop Loss calculator using 6+ S/R layers
- Performance optimization system (caching, conditional calcs)
- VIX Fear Index integration
- Previous Day High/Low auto-detection
- Candlestick pattern recognition with interactive tooltips
- Smart label and visual management
- All UI/UX design and table architecture
### DEVELOPMENT PROCESS
**AI Assistance:** This indicator was developed over 2+ months with AI assistance (ChatGPT/Claude) used for:
- Writing Pine Script code based on design specifications
- Optimizing performance and fixing bugs
- Ensuring Pine Script v6 compliance
- Generating documentation
**Author's Role:** All trading concepts, system design, feature selection, integration logic, and strategic decisions are original work by the author. The AI was a coding tool, not the system designer.
**Transparency:** We believe in full disclosure - this project demonstrates how AI can be used as a powerful development tool while maintaining creative and strategic ownership.
---
1. WHY THIS INDICATOR IS DIFFERENT
Most traders use multiple separate indicators on their charts, leading to cluttered screens, conflicting signals, and analysis paralysis. The Suite solves this by integrating proven technical tools into a single, cohesive system.
Key Advantages:
All-in-One Design: Instead of loading 5-10 separate indicators, you get everything in one optimized script. This reduces chart clutter and improves TradingView performance.
Multi-Timeframe Bias Table: Unlike standard indicators that only show the current timeframe, the Bias Table aggregates trend signals across multiple timeframes simultaneously. See at a glance whether 1m, 5m, 15m, 1h are aligned bullish or bearish - no more switching between charts.
Smart Confirmations: The indicator doesn't just give signals - it shows you WHY. Every entry has multiple layers of confirmation (MA cross, MACD momentum, ADX strength, RSI pullback, volume, etc.) that you can toggle on/off.
Dynamic Stop Loss System: Instead of static ATR stops, the SL is calculated from multiple support/resistance layers: UT trailing line, Supertrend, VWAP, swing structure, and MA levels. This creates more intelligent, price-action-aware stops.
R-Multiple Take Profits: Built-in TP system calculates targets based on your initial risk (1R, 1.5R, 2R, 3R). Lines freeze when touched with visual checkmarks, giving you a clean audit trail of partial exits.
Educational Tooltips Everywhere: Every single input has detailed tooltips explaining what it does, typical values, and how it impacts trading. You're not guessing - you're learning as you configure.
Performance Optimized: Smart caching, conditional calculations, and modular design mean the indicator runs fast despite having 15+ features. Turn off what you don't use for even better performance.
No Repainting: All signals respect bar close. Alerts fire correctly. What you see in history is what you would have gotten in real-time.
What Makes It Unique:
Integrated UT Bot + Bias Table: No other indicator combines UT Bot's ATR trailing system with a live multi-timeframe dashboard. You get precision entries with macro trend context.
Candlestick Pattern Recognition with Interactive Tooltips: Patterns aren't just marked - hover over any emoji for a full explanation of what the pattern means and how to trade it.
Opening Range Breakout Tracker: Built-in ORB system for intraday traders with customizable session times and real-time status updates in the Bias Table.
Previous Day High/Low Auto-Detection: Automatically plots PDH/PDL on intraday charts with theme-aware colors. Updates daily without manual input.
Dynamic Row Labels in Bias Table: The table shows your actual settings (e.g., "EMA 10 > SMA 20") not generic labels. You know exactly what's being evaluated.
Modular Filter System: Instead of forcing a fixed methodology, the indicator lets you build your own strategy. Start with just UT Bot, add filters one at a time, test what works for your style.
---
2. WHO WHOULD USE THIS
Designed For:
Intermediate to Advanced Traders: You understand basic technical analysis (MAs, RSI, MACD) and want to combine multiple confirmations efficiently. This isn't a "one-click profit" system - it's a professional toolkit.
Multi-Timeframe Traders: If you trade one asset but check multiple timeframes for confirmation (e.g., enter on 5m after checking 15m and 1h alignment), the Bias Table will save you hours every week.
Trend Followers: The indicator excels at identifying and following trends using UT Bot, Supertrend, and MA systems. If you trade breakouts and pullbacks in trending markets, this is built for you.
Intraday and Swing Traders: Works equally well on 5m-1h charts (day trading) and 4h-D charts (swing trading). Scalpers can use it too with appropriate settings adjustments.
Discretionary Traders: This isn't a black-box system. You see all the components, understand the logic, and make final decisions. Perfect for traders who want tools, not automation.
Works Across All Markets:
Stocks (US, international)
Cryptocurrency (24/7 markets supported)
Forex pairs
Indices (SPY, QQQ, etc.)
Commodities
NOT Ideal For :
Complete Beginners: If you don't know what a moving average or RSI is, start with basics first. This indicator assumes foundational knowledge.
Algo Traders Seeking Black Box: This is discretionary. Signals require context and confirmation. Not suitable for blind automated execution.
Mean-Reversion Only Traders: The indicator is trend-following at its core. While VWAP bands support mean-reversion, the primary methodology is trend continuation.
---
3. CORE COMPONENTS OVERVIEW
The indicator combines these proven systems:
Trend Analysis:
Moving Averages: Four customizable MAs (Fast, Medium, Medium-Long, Long) with six types to choose from (EMA, SMA, WMA, VWMA, RMA, HMA). Mix and match for your style.
Supertrend: ATR-based trend indicator with unique gradient fill showing trend strength. One-sided ribbon visualization makes it easier to see momentum building or fading.
ZLSMA : Zero-lag linear-regression smoothed moving average. Reduces lag compared to traditional MAs while maintaining smooth curves.
Momentum & Filters:
MACD: Standard MACD with separation filter to avoid weak crossovers.
RSI: Pullback zone detection - only enter longs when RSI is in your defined "buy zone" and shorts in "sell zone".
ADX/DMI: Trend strength measurement with directional filter. Ensures you only trade when there's actual momentum.
Volume Filter: Relative volume confirmation - require above-average volume for entries.
Donchian Breakout: Optional channel breakout requirement.
Signal Systems:
UT Bot: The primary signal generator. ATR trailing stop that adapts to volatility and gives clear entry/exit points.
Base Signals: MA cross system with all the above filters applied. More conservative than UT Bot alone.
Market Bias Table: Multi-timeframe dashboard showing trend alignment across 7 timeframes plus macro bias (3-day, weekly, monthly, quarterly, VIX).
Candlestick Patterns: Six major reversal patterns auto-detected with interactive tooltips.
ORB Tracker: Opening range high/low with breakout status (intraday only).
PDH/PDL: Previous day levels plotted automatically on intraday charts.
VWAP + Bands : Session-anchored VWAP with up to three standard deviation band pairs.
---
4. THE UT BOT TRADING SYSTEM
The UT Bot is the heart of the indicator's signal generation. It's an advanced ATR trailing stop that adapts to market volatility.
Why UT Bot is Superior to Fixed Stops:
Traditional ATR stops use a fixed multiplier (e.g., "stop = entry - 2×ATR"). UT Bot is smarter:
It TRAILS the stop as price moves in your favor
It WIDENS during high volatility to avoid premature stops
It TIGHTENS during consolidation to lock in profits
It FLIPS when price breaks the trailing line, signaling reversals
Visual Elements You'll See:
Orange Trailing Line: The actual UT stop level that adapts bar-by-bar
Buy/Sell Labels: Aqua triangle (long) or orange triangle (short) when the line flips
ENTRY Line: Horizontal line at your entry price (optional, can be turned off)
Suggested Stop Loss: A composite SL calculated from multiple support/resistance layers:
- UT trailing line
- Supertrend level
- VWAP
- Swing structure (recent lows/highs)
- Long-term MA (200)
- ATR-based floor
Take Profit Lines: TP1, TP1.5, TP2, TP3 based on R-multiples. When price touches a TP, it's marked with a checkmark and the line freezes for audit trail purposes.
Status Messages: "SL Touched ❌" or "SL Frozen" when the trade leg completes.
How UT Bot Differs from Other ATR Systems:
Multiple Filters Available: You can require 2-bar confirmation, minimum % price change, swing structure alignment, or ZLSMA directional filter. Most UT implementations have none of these.
Smart SL Calculation: Instead of just using the UT line as your stop, the indicator suggests a better SL based on actual support/resistance. This prevents getting stopped out by wicks while keeping risk controlled.
Visual Audit Trail: All SL/TP lines freeze when touched with clear markers. You can review your trades weeks later and see exactly where entries, stops, and targets were.
Performance Options: "Draw UT visuals only on bar close" lets you reduce rendering load without affecting logic or alerts - critical for slower machines or 1m charts.
Trading Logic:
UT Bot flips direction (Buy or Sell signal appears)
Check Bias Table for multi-timeframe confirmation
Optional: Wait for Base signal or candlestick pattern
Enter at signal bar close or next bar open
Place stop at "Suggested Stop Loss" line
Scale out at TP levels (TP1, TP2, TP3)
Exit remaining position on opposite UT signal or stop hit
---
5. UNDERSTANDING THE MARKET BIAS TABLE
This is the indicator's unique multi-timeframe intelligence layer. Instead of looking at one chart at a time, the table aggregates signals across seven timeframes plus macro trend bias.
Why Multi-Timeframe Analysis Matters:
Professional traders check higher and lower timeframes for context:
Is the 1h uptrend aligning with my 5m entry?
Are all short-term timeframes bullish or just one?
Is the daily trend supportive or fighting me?
Doing this manually means opening multiple charts, checking each indicator, and making mental notes. The Bias Table does it automatically in one glance.
Table Structure:
Header Row:
On intraday charts: 1m, 5m, 15m, 30m, 1h, 2h, 4h (toggle which ones you want)
On daily+ charts: D, W, M (automatic)
Green dot next to title = live updating
Headline Rows - Macro Bias:
These show broad market direction over longer periods:
3 Day Bias: Trend over last 3 trading sessions (uses 1h data)
Weekly Bias: Trend over last 5 trading sessions (uses 4h data)
Monthly Bias: Trend over last 30 daily bars
Quarterly Bias: Trend over last 13 weekly bars
VIX Fear Index: Market regime based on VIX level - bullish when low, bearish when high
Opening Range Breakout: Status of price vs. session open range (intraday only)
These rows show text: "BULLISH", "BEARISH", or "NEUTRAL"
Indicator Rows - Technical Signals:
These evaluate your configured indicators across all active timeframes:
Fast MA > Medium MA (shows your actual MA settings, e.g., "EMA 10 > SMA 20")
Price > Long MA (e.g., "Price > SMA 200")
Price > VWAP
MACD > Signal
Supertrend (up/down/neutral)
ZLSMA Rising
RSI In Zone
ADX ≥ Minimum
These rows show emojis: GREEB (bullish), RED (bearish), GRAY/YELLOW (neutral/NA)
AVG Column:
Shows percentage of active timeframes that are bullish for that row. This is the KEY metric:
AVG > 70% = strong multi-timeframe bullish alignment
AVG 40-60% = mixed/choppy, no clear trend
AVG < 30% = strong multi-timeframe bearish alignment
How to Use the Table:
For a long trade:
Check AVG column - want to see > 60% ideally
Check headline bias rows - want to see BULLISH, not BEARISH
Check VIX row - bullish market regime preferred
Check ORB row (intraday) - want ABOVE for longs
Scan indicator rows - more green = better confirmation
For a short trade:
Check AVG column - want to see < 40% ideally
Check headline bias rows - want to see BEARISH, not BULLISH
Check VIX row - bearish market regime preferred
Check ORB row (intraday) - want BELOW for shorts
Scan indicator rows - more red = better confirmation
When AVG is 40-60%:
Market is choppy, mixed signals. Either stay out or reduce position size significantly. These are low-probability environments.
Unique Features:
Dynamic Labels: Row names show your actual settings (e.g., "EMA 10 > SMA 20" not generic "Fast > Slow"). You know exactly what's being evaluated.
Customizable Rows: Turn off rows you don't care about. Only show what matters to your strategy.
Customizable Timeframes: On intraday charts, disable 1m or 4h if you don't trade them. Reduces calculation load by 20-40%.
Automatic HTF Handling: On Daily/Weekly/Monthly charts, the table automatically switches to D/W/M columns. No configuration needed.
Performance Smart: "Hide BIAS table on 1D or above" option completely skips all table calculations on higher timeframes if you only trade intraday.
---
6. CANDLESTICK PATTERN RECOGNITION
The indicator automatically detects six major reversal patterns and marks them with emojis at the relevant bars.
Why These Six Patterns:
These are the most statistically significant reversal patterns according to trading literature:
High win rate when appearing at support/resistance
Clear visual structure (not subjective)
Work across all timeframes and assets
Studied extensively by institutions
The Patterns:
Bullish Patterns (appear at bottoms):
Bullish Engulfing: Green candle completely engulfs prior red candle's body. Strong reversal signal.
Hammer: Small body with long lower wick (at least 2× body size). Shows rejection of lower prices by buyers.
Morning Star: Three-candle pattern (large red → small indecision → large green). Very strong bottom reversal.
Bearish Patterns (appear at tops):
Bearish Engulfing: Red candle completely engulfs prior green candle's body. Strong reversal signal.
Shooting Star: Small body with long upper wick (at least 2× body size). Shows rejection of higher prices by sellers.
Evening Star: Three-candle pattern (large green → small indecision → large red). Very strong top reversal.
Interactive Tooltips:
Unlike most pattern indicators that just draw shapes, this one is educational:
Hover your mouse over any pattern emoji
A tooltip appears explaining: what the pattern is, what it means, when it's most reliable, and how to trade it
No need to memorize - learn as you trade
Noise Filter:
"Min candle body % to filter noise" setting prevents false signals:
Patterns require minimum body size relative to price
Filters out tiny candles that don't represent real buying/selling pressure
Adjust based on asset volatility (higher % for crypto, lower for low-volatility stocks)
How to Trade Patterns:
Patterns are NOT standalone entry signals. Use them as:
Confirmation: UT Bot gives signal + pattern appears = stronger entry
Reversal Warning: In a trade, opposite pattern appears = consider tightening stop or taking profit
Support/Resistance Validation: Pattern at key level (PDH, VWAP, MA 200) = level is being respected
Best combined with:
UT Bot or Base signal in same direction
Bias Table alignment (AVG > 60% or < 40%)
Appearance at obvious support/resistance
---
7. VISUAL TOOLS AND FEATURES
VWAP (Volume Weighted Average Price):
Session-anchored VWAP with standard deviation bands. Shows institutional "fair value" for the trading session.
Anchor Options: Session, Day, Week, Month, Quarter, Year. Choose based on your trading timeframe.
Bands: Up to three pairs (X1, X2, X3) showing statistical deviation. Price at outer bands often reverses.
Auto-Hide on HTF: VWAP hides on Daily/Weekly/Monthly charts automatically unless you enable anchored mode.
Use VWAP as:
Directional bias (above = bullish, below = bearish)
Mean reversion levels (outer bands)
Support/resistance (the VWAP line itself)
Previous Day High/Low:
Automatically plots yesterday's high and low on intraday charts:
Updates at start of each new trading day
Theme-aware colors (dark text for light charts, light text for dark charts)
Hidden automatically on Daily/Weekly/Monthly charts
These levels are critical for intraday traders - institutions watch them closely as support/resistance.
Opening Range Breakout (ORB):
Tracks the high/low of the first 5, 15, 30, or 60 minutes of the trading session:
Customizable session times (preset for NYSE, LSE, TSE, or custom)
Shows current breakout status in Bias Table row (ABOVE, BELOW, INSIDE, BUILDING)
Intraday only - auto-disabled on Daily+ charts
ORB is a classic day trading strategy - breakout above opening range often leads to continuation.
Extra Labels:
Change from Open %: Shows how far price has moved from session open (intraday) or daily open (HTF). Green if positive, red if negative.
ADX Badge: Small label at bottom of last bar showing current ADX value. Green when above your minimum threshold, red when below.
RSI Badge: Small label at top of last bar showing current RSI value with zone status (buy zone, sell zone, or neutral).
These labels provide quick at-a-glance confirmation without needing separate indicator windows.
---
8. HOW TO USE THE INDICATOR
Step 1: Add to Chart
Load the indicator on your chosen asset and timeframe
First time: Everything is enabled by default - the chart will look busy
Don't panic - you'll turn off what you don't need
Step 2: Start Simple
Turn OFF everything except:
UT Bot labels (keep these ON)
Bias Table (keep this ON)
Moving Averages (Fast and Medium only)
Suggested Stop Loss and Take Profits
Hide everything else initially. Get comfortable with the basic UT Bot + Bias Table workflow first.
Step 3: Learn the Core Workflow
UT Bot gives a Buy or Sell signal
Check Bias Table AVG column - do you have multi-timeframe alignment?
If yes, enter the trade
Place stop at Suggested Stop Loss line
Scale out at TP levels
Exit on opposite UT signal
Trade this simple system for a week. Get a feel for signal frequency and win rate with your settings.
Step 4: Add Filters Gradually
If you're getting too many losing signals (whipsaws in choppy markets), add filters one at a time:
Try: "Require 2-Bar Trend Confirmation" - wait for 2 bars to confirm direction
Try: ADX filter with minimum threshold - only trade when trend strength is sufficient
Try: RSI pullback filter - only enter on pullbacks, not chasing
Try: Volume filter - require above-average volume
Add one filter, test for a week, evaluate. Repeat.
Step 5: Enable Advanced Features (Optional)
Once you're profitable with the core system, add:
Supertrend for additional trend confirmation
Candlestick patterns for reversal warnings
VWAP for institutional anchor reference
ORB for intraday breakout context
ZLSMA for low-lag trend following
Step 6: Optimize Settings
Every setting has a detailed tooltip explaining what it does and typical values. Hover over any input to read:
What the parameter controls
How it impacts trading
Suggested ranges for scalping, day trading, and swing trading
Start with defaults, then adjust based on your results and style.
Step 7: Set Up Alerts
Right-click chart → Add Alert → Condition: "Luxy Momentum v6" → Choose:
"UT Bot — Buy" for long entries
"UT Bot — Sell" for short entries
"Base Long/Short" for filtered MA cross signals
Optionally enable "Send real-time alert() on UT flip" in settings for immediate notifications.
Common Workflow Variations:
Conservative Trader:
UT signal + Base signal + Candlestick pattern + Bias AVG > 70%
Enter only at major support/resistance
Wider UT sensitivity, multiple filters
Aggressive Trader:
UT signal + Bias AVG > 60%
Enter immediately, no waiting
Tighter UT sensitivity, minimal filters
Swing Trader:
Focus on Daily/Weekly Bias alignment
Ignore intraday noise
Use ORB and PDH/PDL less (or not at all)
Wider stops, patient approach
---
9. PERFORMANCE AND OPTIMIZATION
The indicator is optimized for speed, but with 15+ features running simultaneously, chart load time can add up. Here's how to keep it fast:
Biggest Performance Gains:
Disable Unused Timeframes: In "Time Frames" settings, turn OFF any timeframe you don't actively trade. Each disabled TF saves 10-15% calculation time. If you only day trade 5m, 15m, 1h, disable 1m, 2h, 4h.
Hide Bias Table on Daily+: If you only trade intraday, enable "Hide BIAS table on 1D or above". This skips ALL table calculations on higher timeframes.
Draw UT Visuals Only on Bar Close: Reduces intrabar rendering of SL/TP/Entry lines. Has ZERO impact on logic or alerts - purely visual optimization.
Additional Optimizations:
Turn off VWAP bands if you don't use them
Disable candlestick patterns if you don't trade them
Turn off Supertrend fill if you find it distracting (keep the line)
Reduce "Limit to 10 bars" for SL/TP lines to minimize line objects
Performance Features Built-In:
Smart Caching: Higher timeframe data (3-day bias, weekly bias, etc.) updates once per day, not every bar
Conditional Calculations: Volume filter only calculates when enabled. Swing filter only runs when enabled. Nothing computes if turned off.
Modular Design: Every component is independent. Turn off what you don't need without breaking other features.
Typical Load Times:
5m chart, all features ON, 7 timeframes: ~2-3 seconds
5m chart, core features only, 3 timeframes: ~1 second
1m chart, all features: ~4-5 seconds (many bars to calculate)
If loading takes longer, you likely have too many indicators on the chart total (not just this one).
---
10. FAQ
Q: How is this different from standard UT Bot indicators?
A: Standard UT Bot (originally by @QuantNomad) is just the ATR trailing line and flip signals. This implementation adds:
- Volume weighting and momentum adjustment to the trailing calculation
- Multiple confirmation filters (swing, %, 2-bar, ZLSMA)
- Smart composite stop loss system from multiple S/R layers
- R-multiple take profit system with freeze-on-touch
- Integration with multi-timeframe Bias Table
- Visual audit trail with checkmarks
Q: Can I use this for automated trading?
A: The indicator is designed for discretionary trading. While it has clear signals and alerts, it's not a mechanical system. Context and judgment are required.
Q: Does it repaint?
A: No. All signals respect bar close. UT Bot logic runs intrabar but signals only trigger on confirmed bars. Alerts fire correctly with no lookahead.
Q: Do I need to use all the features?
A: Absolutely not. The indicator is modular. Many profitable traders use just UT Bot + Bias Table + Moving Averages. Start simple, add complexity only if needed.
Q: How do I know which settings to use?
A: Every single input has a detailed tooltip. Hover over any setting to see:
What it does
How it affects trading
Typical values for scalping, day trading, swing trading
Start with defaults, adjust gradually based on results.
Q: Can I use this on crypto 24/7 markets?
A: Yes. ORB will not work (no defined session), but everything else functions normally. Use "Day" anchor for VWAP instead of "Session".
Q: The Bias Table is blank or not showing.
A: Check:
"Show Table" is ON
Table position isn't overlapping another indicator's table (change position)
At least one row is enabled
"Hide BIAS table on 1D or above" is OFF (if on Daily+ chart)
Q: Why are candlestick patterns not appearing?
A: Patterns are relatively rare by design - they only appear at genuine reversal points. Check:
Pattern toggles are ON
"Min candle body %" isn't too high (try 0.05-0.10)
You're looking at a chart with actual reversals (not strong trending market)
Q: UT Bot is too sensitive/not sensitive enough.
A: Adjust "Sensitivity (Key×ATR)". Lower number = tighter stop, more signals. Higher number = wider stop, fewer signals. Read the tooltip for guidance.
Q: Can I get alerts for the Bias Table?
A: The Bias Table is a dashboard for visual analysis, not a signal generator. Set alerts on UT Bot or Base signals, then manually check Bias Table for confirmation.
Q: Does this work on stocks with low volume?
A: Yes, but turn OFF the volume filter. Low volume stocks will never meet relative volume requirements.
Q: How often should I check the Bias Table?
A: Before every entry. It takes 2 seconds to glance at the AVG column and headline rows. This one check can save you from fighting the trend.
Q: What if UT signal and Base signal disagree?
A: UT Bot is more aggressive (ATR trailing). Base signals are more conservative (MA cross + filters). If they disagree, either:
Wait for both to align (safest)
Take the UT signal but with smaller size (aggressive)
Skip the trade (conservative)
There's no "right" answer - depends on your risk tolerance.
---
FINAL NOTES
The indicator gives you an edge. How you use that edge determines results.
For questions, feedback, or support, comment on the indicator page or message the author.
Happy Trading!

Divergence Mucho Indicators v6 AlertsShows divergence for well known indicators. Allows option to create alert for 4 or more divergences signaling.
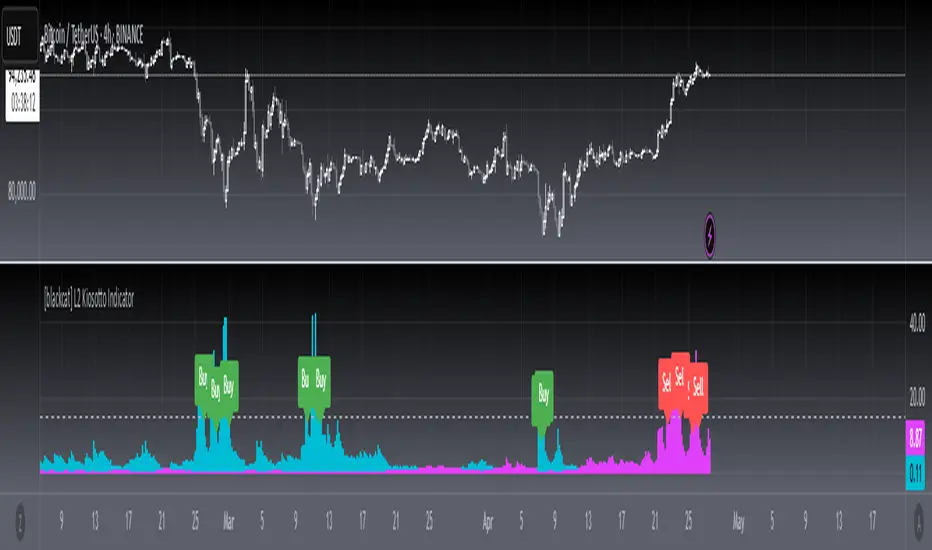
[blackcat] L2 Kiosotto IndicatorOVERVIEW
The Kiosotto Indicator is a versatile technical analysis tool designed for forex trading but applicable to other financial markets. It excels in detecting market reversals and trends without repainting, ensuring consistent and reliable signals. The indicator has evolved over time, with different versions focusing on specific aspects of market analysis.
KEY FEATURES
Reversal Detection: Identifies potential market reversals, crucial for traders looking to capitalize on turning points.
Trend Detection: Earlier versions focused on detecting trends, useful for traders who prefer to follow the market direction.
Non-Repainting: Signals remain consistent on the chart, providing reliable and consistent signals.
Normalization: Later versions, such as Normalized Kiosotto and Kiosotto_2025, incorporate normalization to assess oversold and overbought conditions, enhancing interpretability.
VERSIONS AND EVOLUTION
Early Versions: Focused on trend detection, useful for following market direction.
2 in 1 Kiosotto: Emphasizes reversal detection and is considered an improvement by users.
Normalized Versions (e.g., Kiosotto_2025, Kiosotto_3_2025): Introduce normalization to assess oversold and overbought conditions, enhancing interpretability.
HOW TO USE THE KIOSOTTO INDICATOR
Understanding Signals:
Reversals: Look for the indicator's signals that suggest a potential reversal, indicated by color changes, line crossings, or other visual cues.
Trends: Earlier versions might show stronger trending signals, indicated by the direction or slope of the indicator's lines.
Normalization Interpretation (for normalized versions):
Oversold: When the indicator hits the lower boundary, it might indicate an oversold condition, suggesting a potential buy signal.
Overbought: Hitting the upper boundary could signal an overbought condition, suggesting a potential sell signal.
PINE SCRIPT IMPLEMENTATION
The provided Pine Script code is a version of the Kiosotto indicator. Here's a detailed explanation of the code:
//@version=5
indicator(" L2 Kiosotto Indicator", overlay=false)
//Pine version of Kiosotto 2015 v4 Alert ms-nrp
// Input parameters
dev_period = input.int(150, "Dev Period")
alerts_level = input.float(15, "Alerts Level")
tsbul = 0.0
tsber = 0.0
hpres = 0.0
lpres = 9999999.0
for i = 0 to dev_period - 1
rsi = ta.rsi(close , dev_period)
if high > hpres
hpres := high
tsbul := tsbul + rsi * close
if low < lpres
lpres := low
tsber := tsber + rsi * close
buffer1 = tsber != 0 ? tsbul / tsber : 0
buffer2 = tsbul != 0 ? tsber / tsbul : 0
// Plotting
plot(buffer1, color=color.aqua, linewidth=3, style=plot.style_histogram)
plot(buffer2, color=color.fuchsia, linewidth=3, style=plot.style_histogram)
hline(alerts_level, color=color.silver)
EXPLANATION OF THE CODE
Indicator Definition:
indicator(" L2 Kiosotto Indicator", overlay=false): Defines the indicator with the name " L2 Kiosotto Indicator" and specifies that it should not be overlaid on the price chart.
Input Parameters:
dev_period = input.int(150, "Dev Period"): Allows users to set the period for the deviation calculation.
alerts_level = input.float(15, "Alerts Level"): Allows users to set the level for alerts.
Initialization:
tsbul = 0.0: Initializes the tsbul variable to 0.0.
tsber = 0.0: Initializes the tsber variable to 0.0.
hpres = 0.0: Initializes the hpres variable to 0.0.
lpres = 9999999.0: Initializes the lpres variable to a very high value.
Loop for Calculation:
The for loop iterates over the last dev_period bars.
rsi = ta.rsi(close , dev_period): Calculates the RSI for the current bar.
if high > hpres: If the high price of the current bar is greater than hpres, update hpres and add the product of RSI and close price to tsbul.
if low < lpres: If the low price of the current bar is less than lpres, update lpres and add the product of RSI and close price to tsber.
Buffer Calculation:
buffer1 = tsber != 0 ? tsbul / tsber : 0: Calculates the first buffer as the ratio of tsbul to tsber if tsber is not zero.
buffer2 = tsbul != 0 ? tsber / tsbul : 0: Calculates the second buffer as the ratio of tsber to tsbul if tsbul is not zero.
Plotting:
plot(buffer1, color=color.aqua, linewidth=3, style=plot.style_histogram): Plots the first buffer as a histogram with an aqua color.
plot(buffer2, color=color.fuchsia, linewidth=3, style=plot.style_histogram): Plots the second buffer as a histogram with a fuchsia color.
hline(alerts_level, color=color.silver): Draws a horizontal line at the alerts_level with a silver color.
FUNCTIONALITY
The Kiosotto indicator calculates two buffers based on the RSI and price levels over a specified period. The buffers are plotted as histograms, and a horizontal line is drawn at the alerts level. The indicator helps traders identify potential reversals and trends by analyzing the relationship between the RSI and price levels.
ALGORITHMS
RSI Calculation:
The Relative Strength Index (RSI) measures the speed and change of price movements. It is calculated using the formula:
RSI=100− (1+RS) / 100
where RS is the ratio of the average gain to the average loss over the specified period.
Buffer Calculation:
The buffers are calculated as the ratio of the sum of RSI multiplied by the close price for high and low price conditions. This helps in identifying the balance between buying and selling pressure.
Signal Generation:
The indicator generates signals based on the values of the buffers and the alerts level. Traders can use these signals to make informed trading decisions, such as entering or exiting trades based on potential reversals or trends.
APPLICATION SCENARIOS
Reversal Trading: Traders can use the Kiosotto indicator to identify potential reversals by looking for significant changes in the buffer values or crossings of the alerts level.
Trend Following: The indicator can also be used to follow trends by analyzing the direction and slope of the buffer lines.
Oversold/Overbought Conditions: For normalized versions, traders can use the indicator to identify oversold and overbought conditions, which can provide buy or sell signals.
THANKS
Special thanks to the TradingView community and the original developers for their contributions and support in creating and refining the Kiosotto Indicator.
Direction Coefficient Indicator# Direction Coefficient Indicator with Advanced Volume & Volatility Adjustments
The Direction Coefficient Indicator represents an advanced technical analysis tool that combines price momentum analysis with sophisticated volume and volatility adjustments. This versatile indicator measures market direction while adapting to various trading conditions, making it valuable for both trend following and momentum trading strategies.
At its core, the indicator employs a unique approach to price analysis by establishing a dynamic reference period for calculations. It processes price data through an EMA smoothing mechanism to reduce market noise and presents results as percentage-based measurements, ensuring universal applicability across different markets and timeframes.
One of the indicator's standout features is its volume integration system. When enabled, this system implements volume-weighted calculations that provide enhanced accuracy during significant market moves while effectively reducing false signals during low-volume periods. This volume weighting mechanism proves particularly valuable in highly liquid markets where volume plays a crucial role in price movement validation.
The volatility adjustment feature sets this indicator apart from traditional momentum tools. By incorporating smart volatility normalization, the indicator adapts seamlessly to changing market conditions. This adjustment helps maintain consistent signals across different volatility regimes, preventing excessive noise during highly volatile periods while remaining sensitive enough during calmer market phases.
Direction change detection forms another crucial component of the indicator. The system continuously monitors momentum shifts and provides early warning signals for potential trend reversals. This feature helps traders avoid late exits from positions and offers valuable insights for potential market turning points. When the indicator detects significant changes in momentum, it displays a warning symbol (⚠) alongside its regular signals.
The visual presentation of the indicator utilizes an intuitive color-coded system. Green labels indicate positive momentum, while red labels signify negative momentum. The display system includes customizable label sizes and positions, allowing traders to adapt the visual elements to their specific chart setup and preferences. Label distance from candles, color schemes, and reference lines can all be adjusted to create an optimal visual experience.
For practical application, the indicator offers several parameter settings that traders can adjust. The time period parameters include adjustable lookback periods and EMA length, while advanced calculation options allow for enabling or disabling volume weighting and volatility adjustment features. These parameters can be fine-tuned based on specific trading timeframes and market conditions.
In trend following scenarios, traders can use the coefficient direction for trend confirmation while monitoring warning signals for potential exits. The volume weighting feature adds another layer of confirmation for trend strength. For momentum trading, strong coefficient readings can signal entry points, while warning signals help identify potential exit timing.
Risk management becomes more systematic with this indicator. Warning signals can guide stop loss placement, while the volatility adjustment feature assists in position sizing decisions. The volume weighting component helps traders evaluate the significance of price moves, contributing to more informed entry timing decisions.
The indicator performs optimally when traders start with default settings and gradually adjust parameters based on their specific needs. For longer-term trades, increasing the lookback period often provides more stable signals. In highly liquid markets, enabling volume weighting can enhance signal quality. The volatility adjustment feature proves particularly valuable during unstable market conditions.
The Direction Coefficient Indicator stands as a comprehensive solution for traders seeking a sophisticated yet practical approach to market analysis. By combining multiple analytical components into a single, customizable tool, it provides valuable insights while remaining accessible to traders of various experience levels.
For optimal results, traders should consider using this indicator in conjunction with other technical analysis tools while paying attention to its warning signals and volume-weighted insights. Regular parameter adjustment based on changing market conditions and specific trading styles will help maximize the indicator's effectiveness in various trading scenarios.
Indicateur de Coefficient Directeur
L'Indicateur de Coefficient Directeur représente un outil d'analyse technique avancé qui combine l'analyse de momentum des prix avec des ajustements sophistiqués de volume et de volatilité. Cet indicateur polyvalent mesure la direction du marché tout en s'adaptant à diverses conditions de trading, le rendant précieux tant pour le suivi de tendance que pour les stratégies de trading momentum.
À sa base, l'indicateur emploie une approche unique de l'analyse des prix en établissant une période de référence dynamique pour les calculs. Il traite les données de prix à travers un mécanisme de lissage EMA pour réduire le bruit du marché et présente les résultats sous forme de mesures en pourcentage, assurant une applicabilité universelle à travers différents marchés et temporalités.
L'une des caractéristiques distinctives de l'indicateur est son système d'intégration du volume. Lorsqu'il est activé, ce système met en œuvre des calculs pondérés par le volume qui fournissent une précision accrue pendant les mouvements significatifs du marché tout en réduisant efficacement les faux signaux pendant les périodes de faible volume. Ce mécanisme de pondération du volume s'avère particulièrement valuable dans les marchés très liquides où le volume joue un rôle crucial dans la validation des mouvements de prix.
La fonction d'ajustement de la volatilité distingue cet indicateur des outils de momentum traditionnels. En incorporant une normalisation intelligente de la volatilité, l'indicateur s'adapte parfaitement aux conditions changeantes du marché. Cet ajustement aide à maintenir des signaux cohérents à travers différents régimes de volatilité, empêchant le bruit excessif pendant les périodes très volatiles tout en restant suffisamment sensible pendant les phases de marché plus calmes.
La détection des changements de direction forme une autre composante cruciale de l'indicateur. Le système surveille continuellement les changements de momentum et fournit des signaux d'avertissement précoces pour les potentiels renversements de tendance. Cette fonctionnalité aide les traders à éviter les sorties tardives des positions et offre des aperçus précieux des potentiels points de retournement du marché. Lorsque l'indicateur détecte des changements significatifs de momentum, il affiche un symbole d'avertissement (⚠) à côté de ses signaux réguliers.
La présentation visuelle de l'indicateur utilise un système intuitif codé par couleurs. Les étiquettes vertes indiquent un momentum positif, tandis que les étiquettes rouges signifient un momentum négatif. Le système d'affichage inclut des tailles et positions d'étiquettes personnalisables, permettant aux traders d'adapter les éléments visuels à leur configuration spécifique de graphique et leurs préférences. La distance des étiquettes par rapport aux bougies, les schémas de couleurs et les lignes de référence peuvent tous être ajustés pour créer une expérience visuelle optimale.
Pour l'application pratique, l'indicateur offre plusieurs paramètres de réglage que les traders peuvent ajuster. Les paramètres de période temporelle incluent des périodes de référence ajustables et la longueur de l'EMA, tandis que les options de calcul avancées permettent d'activer ou de désactiver les fonctionnalités de pondération du volume et d'ajustement de la volatilité. Ces paramètres peuvent être affinés en fonction des temporalités de trading spécifiques et des conditions de marché.
Dans les scénarios de suivi de tendance, les traders peuvent utiliser la direction du coefficient pour la confirmation de tendance tout en surveillant les signaux d'avertissement pour les sorties potentielles. La fonction de pondération du volume ajoute une couche supplémentaire de confirmation pour la force de la tendance. Pour le trading momentum, des lectures fortes du coefficient peuvent signaler des points d'entrée, tandis que les signaux d'avertissement aident à identifier le timing potentiel de sortie.
La gestion du risque devient plus systématique avec cet indicateur. Les signaux d'avertissement peuvent guider le placement des stops loss, tandis que la fonction d'ajustement de la volatilité aide aux décisions de dimensionnement des positions. La composante de pondération du volume aide les traders à évaluer l'importance des mouvements de prix, contribuant à des décisions de timing d'entrée plus éclairées.
L'indicateur fonctionne de manière optimale lorsque les traders commencent avec les paramètres par défaut et ajustent progressivement les paramètres en fonction de leurs besoins spécifiques. Pour les trades à plus long terme, l'augmentation de la période de référence fournit souvent des signaux plus stables. Dans les marchés très liquides, l'activation de la pondération du volume peut améliorer la qualité des signaux. La fonction d'ajustement de la volatilité s'avère particulièrement précieuse pendant les conditions de marché instables.
L'Indicateur de Coefficient Directeur s'impose comme une solution complète pour les traders recherchant une approche sophistiquée mais pratique de l'analyse de marché. En combinant plusieurs composantes analytiques en un seul outil personnalisable, il fournit des aperçus précieux tout en restant accessible aux traders de différents niveaux d'expérience.
Pour des résultats optimaux, les traders devraient envisager d'utiliser cet indicateur en conjonction avec d'autres outils d'analyse technique tout en prêtant attention à ses signaux d'avertissement et ses aperçus pondérés par le volume. L'ajustement régulier des paramètres basé sur les conditions changeantes du marché et les styles de trading spécifiques aidera à maximiser l'efficacité de l'indicateur dans divers scénarios de trading.

Divergence for Many Indicators v4 Screener▋ INTRODUCTION:
The “Divergence for Many Indicators v4 Screener” is developed to provide an advanced monitoring solution for up to 24 symbols simultaneously. It efficiently collects signals from multiple symbols based on the “ Divergence for Many Indicators v4 ” and presents the output in an organized table. The table includes essential details starting with the symbol name, signal price, corresponding divergence indicator, and signal time.
_______________________
▋ CREDIT:
The divergence formula adapted from the “ Divergence for Many Indicators v4 ” script, originally created by @LonesomeTheBlue . Full credit to his work.
_______________________
▋ OVERVIEW:
The chart image can be considered an example of a recorded divergence signal that occurred in $BTCUSDT.
_______________________
▋ APPEARANCE:
The table can be displayed in three formats:
1. Full indicator name.
2. First letter of the indicator name.
3. Total number of divergences.
_______________________
▋ SIGNAL CONFIRMATION:
The table distinguishes signal confirmation by using three different colors:
1. Not-Confirmed (Orange): The signal is not confirmed yet, as the bar is still open.
2. Freshly Confirmed (Green): The signal was confirmed 1 or 2 bars ago.
3. Confirmed (Gray): The signal was confirmed 3 or more bars ago.
_______________________
▋ INDICATOR SETTINGS:
Section(1): Table Settings
(1) Table location on the chart.
(2) Table’s cells size.
(3) Chart’s timezone.
(4) Sorting table.
- Signal: Sorts the table by the latest signals.
- None: Sorts the table based on the input order.
(5) Table’s colors.
(6) Signal Confirmation type color. Explained above in the SIGNAL CONFIRMATION section
Section(2): Divergence for Many Indicators v4 Settings
As seen on the Divergence for Many Indicators v4
* Explained above in the APPEARANCE section
Section(3): Symbols
(1) Enable/disable symbol in the screener.
(2) Entering a symbol.
_______________________
▋ FINAL COMMENTS:
For best performance, add the Screener indicator to an active symbol chart, such as QQQ, SPY, AAPL, BTCUSDT, ES, EURUSD, etc., and avoid mixing symbols from different market allocations.
The Divergence for Many Indicators v4 Screener indicator is not a primary tool for making trading decisions.

Nightrangers IndicatorDescription
This indicator combines three EMA's, Ichimoku Cloud, RSI and MACD. By combining and modifying their use case this turns into an extremely powerful and accessible indicator for finding long and short position entries, below is a description of how to use this indicator, and what makes it different.
Primary Use case
The three EMA's would be the initial indicators you would be looking at, they are based on the 7d, 25d and 200d MA - Used on their own, they would be worthless, and this is where the Ichimoku Cloud comes into it, I have removed all other aspects of the Ichimoku Cloud and only kept the baseline, combine this with the three MA's and we have a very powerful indicator for finding Long entries, that is used uniquely in a way to which the Ichimoku Cloud is not originally meant to be used for.
An early indication of a LONG entry would be when the 7d MA crosses above the Ichimoku Baseline, through this early indicator, you are able to watch and monitor the chart, you would be waiting to see if the 25d MA then also crosses above the Ichimoku Baseline, This would be the second important indication of a long entry. The 200d MA helps here when making decisions on where to set your own personal take profits - If the Ichimoku baseline, and the MA's are below the 200d MA, you would be expecting a bounce point here, or heavy resistance so the long entry could be over a shorter period, than that if it was above the 200d MA, which is why it is included here, to help make a better informed choice.
The latter is reversed for finding short positions, and entries. This indicator is completely reliant on each other to find the best possible entry/exit by complementing each other, and by using the Ichimoku Baseline on it's own, and not as the Ichimoku Cloud is intended.
Just using these though, is not enough, which is why the RSI and MACD are also combined, once the conditions are met above, You may find that there can be false positives for entries, and this is where the RSI has multiple use cases within this script.
Firstly the backdrop colour will change based on whether the chart is in an uptrend or downtrend, This is a visual indicator provided to work simultaneaously on the chart itself to help identification of entries/exits easier to identify in conjunction with the above.
Secondly, It is used to display in the top right, The current Trend in a text format, as well as if the current chart is in one of three phases, these are Overbrought, Oversold and accumulation.
And finally it will display the current RSI Value on the last candle in a clear to see blue Label, This helps with the visual accessible side, to help you make a more informed choice depending on your own personal tolerance.
This ties into the above Indicators, by combining the information, you would not be looking to take a long, if for example, the RSI showed it was over-brought, and in a downtrend, even if the MA's had crossed above the Baseline, as this would most likely be a fakeout.
However if the Indicators above, showed a potential long, and the backdrop had flipped green, indicating an uptrend, and it was in an accumulation phase, you would consider this position. and this is where the MACD comes into play.
You would use the MACD to see whether or not the Signal line has crossed over the MACD line, and vice versa - However this script uses it to simplify and portray current market sentiment, and visually display by reducing clutter on screen, and making it more accessible.
It is designed to portray an easy to read and understand visual indicator by displaying in the top right simply as Bullish or Bearish, with markers above the candles ( "M" and "MX" ).
The M indicator is to show where the MACD Crosses above the Signal, and if aligned with all the other indicators within the script, shows a very strong confirmation for a buying opportunity, and vice versa for the "MX" indicator if aligned with the other indicators in reverse, provides a very strong confirmation for opening a short position or for selling.
Secondary Use case
By combining the indicators above, the secondary conditions you would be looking for, If you opened a LONG position, would be knowing when to sell, On top of what has been described above already regarding this, you would be looking to start taking profits, when the 7d MA crosses above or across the candles, and looking to close the position, when the 25d MA also crosses above the candles, and respectively, in reverse for closing short positions. This is shown across the charts to be extremely useful, however, combine this with the other indicators, portrayed in an easy to use and understand visual representation, you are now able to make more informed decisions, on whether to close a position or not.
How is it different and not just a mash up
I have combined these indicators to make the world of trading more accessible for everyone regardless of circumstances, by creating an easy to understand visual representation, keeping colours vibrant and easy to stand out, with clear and simple to read text indications. So whether you are a seasoned trader, or just starting out, you can make more informed choices, without the need of learning how to use multiple different indicators, and learning how to combine them all, or if you have difficulties learning, this indicator also simplifies a lot of the more technical intricacies, by still allowing you to make a more informed choice.
