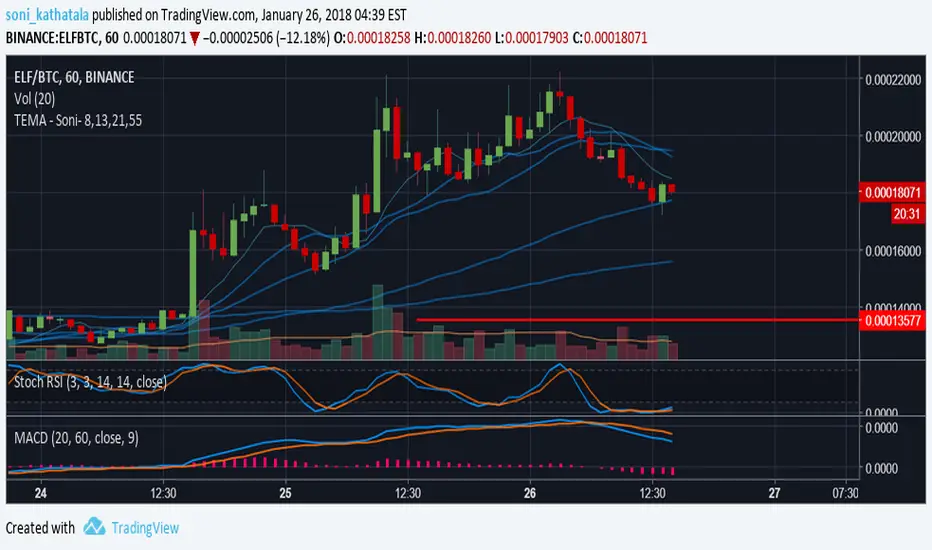
Quadruple Moving Averages For Day TradingQuadruple Moving Averages For Day Trading Crypto
Inputs of 8,13,21,55
Based on chart used by Philakone.
Tìm kiếm tập lệnh với "moving averages"

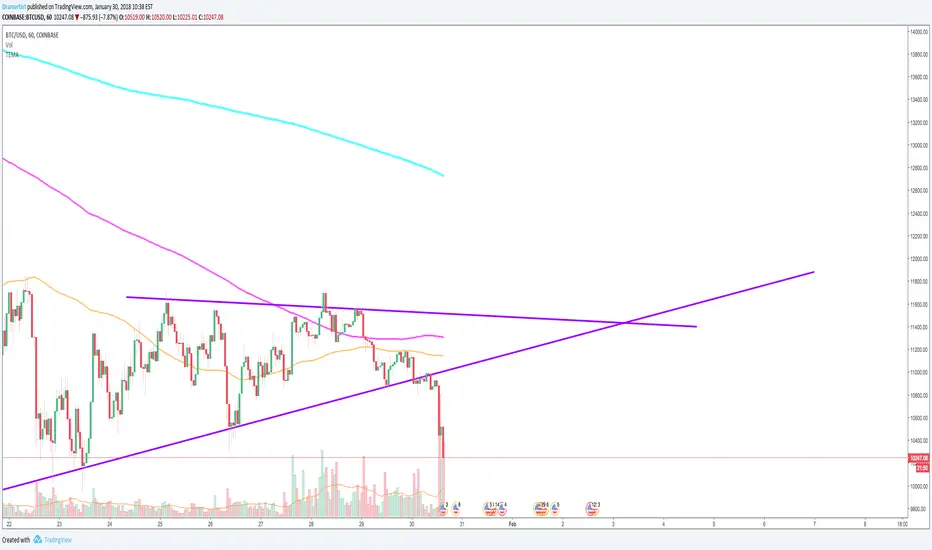
4 Exponential Moving Averages + One Extra for 1D Charts4 Exponential Moving Averages + One Extra for 1D Charts
I use 4 EMAs for my 1 hour and 4 hours Chart.
Additionally for 1D Charts, sometime i need to use 9 EMA. Now is in place. Enjoy it!
I used them only for support my analisys based on Elliot Waves and Fibonacci projections and Retracements, which are my main strategy.


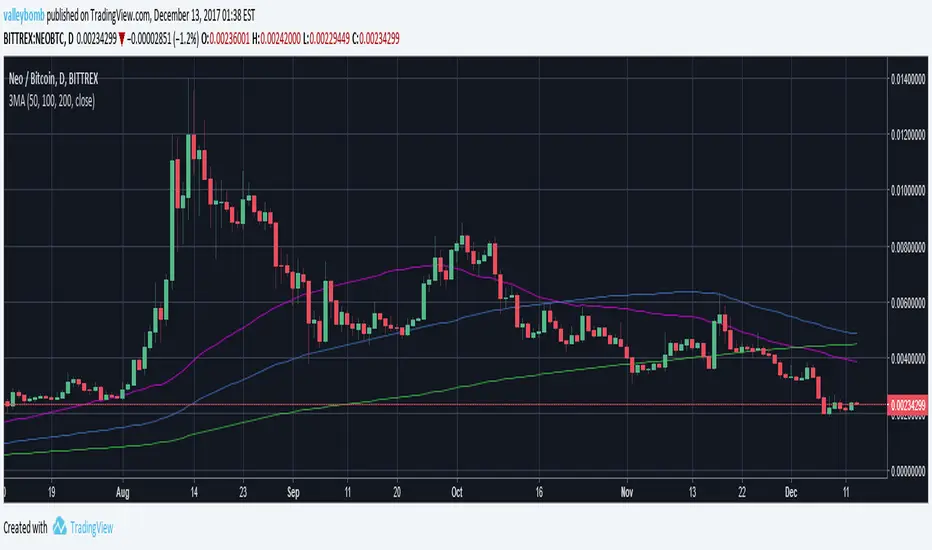
TEMA - Triple Moving Averages (50,100,200)Three Moving Averages in a single indicator, very useful if you are a free user and want to save some indicator slots.
Enjoy it :)

Triple Exponential Moving AveragesAdapted from Andy Foxx to use exponential instead of simple moving averages

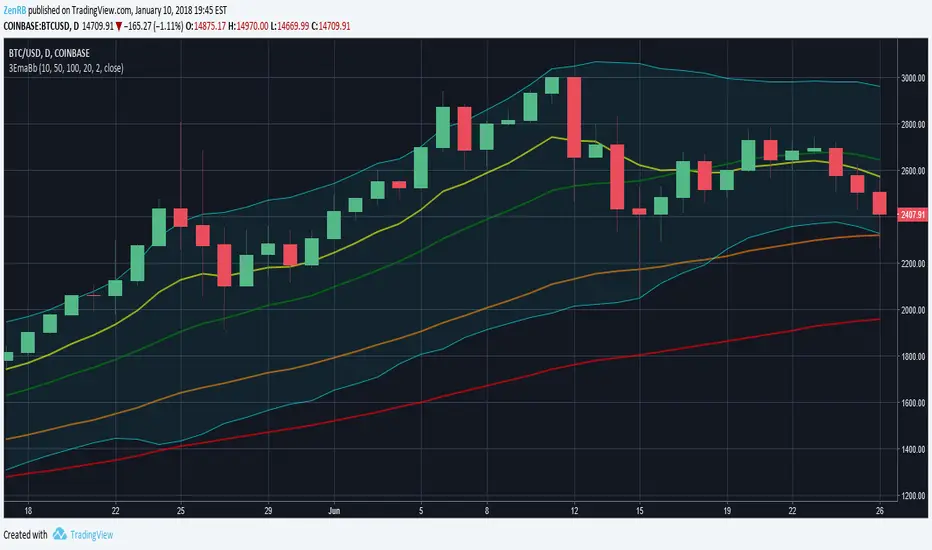
Triple Exponential Moving Averages with Bollinger BandsParameterized triple exponential moving averages with Bollinger Bands in one indicator.


Four Simple Moving AveragesProvides four simple moving averages in one indicator instead of having to add 4 separate indicators to the charts

Triple Moving AveragesVery basic, just allows for 3 different moving averages in one indicator. Set the defaults to 50, 100 and 200 day, but numbers and colors can be adjusted to taste. Mashed this together from what I found online for a few people who were interested in having this in a community I belong to. Shout out to the Data Dash community!

Simple Moving AveragesYou can plot 10 simple moving averages with this script. special thanks to worldsapart89 for the original script.

Pivot Point Moving AveragesThis indicator contains two simple moving averages that is calculated from the pivot point rather than the closing price. This indicator is described in detail in chapter 6 of the book Candlestick and Pivot Point Trading Triggers: Setups for Stock, Forex, and Futures Markets by John L. Person.


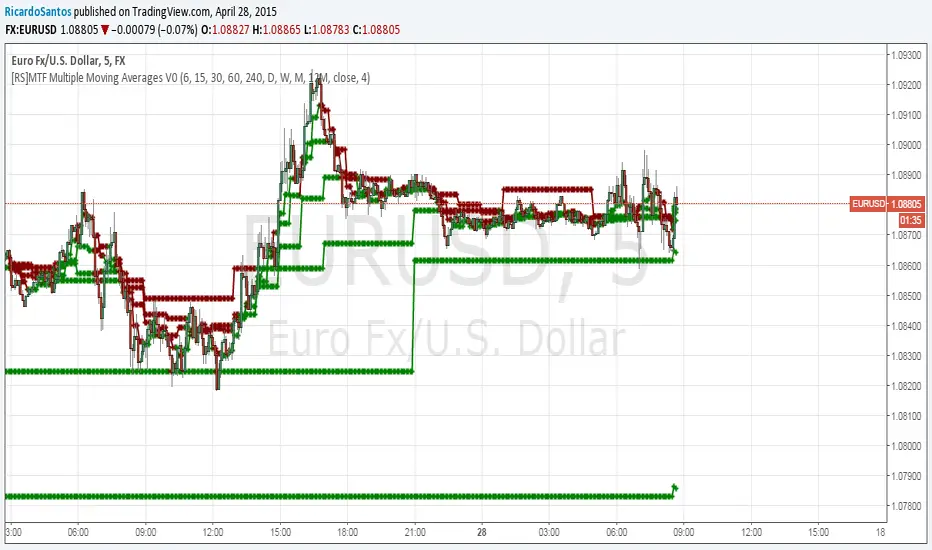
[RS]MTF Multiple Moving Averages V0Multiple moving averages with same interval in candle bar smoothness over multiple time frames.
option to show/hide the level of resolution for the mtf's default shows 1 ma can go up to 8th resolution.
option for manual input timeframes and configure ma.
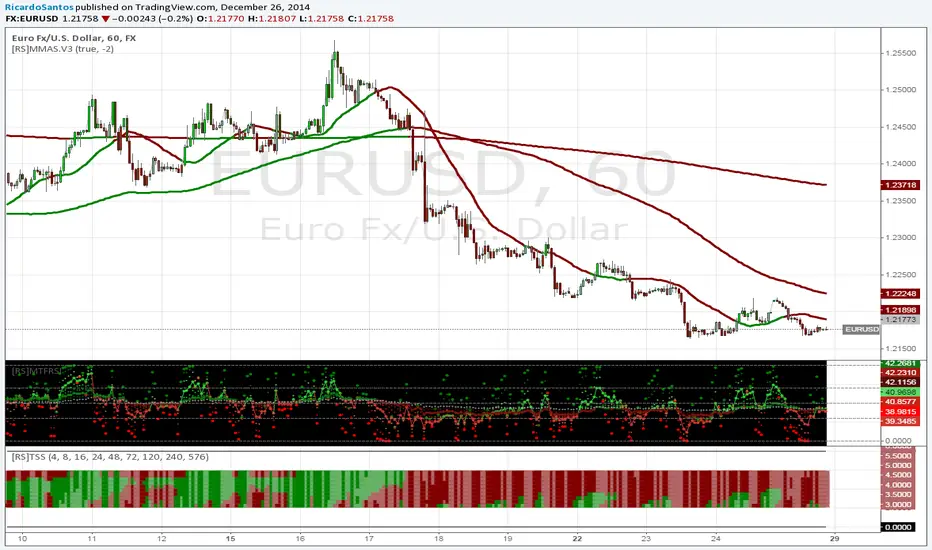
[RS]Multiple Moving Averages System V3Multiple moving averages system with color coding and hardcoded lengths based on time frame, if you have any suggestions feel free to post or pm.
[REPOST] Indicators: 3 Different Adaptive Moving Averages*** NOTE: This is a repost with updated scripts to workaround the recent script engine changes ****
As the volatility rises, all Adaptive Moving Averages (AMA) become more sensitive and adapt faster to the price changes. As the volatility decreases, they slow down significantly compared to normal EMA. This makes it an excellent choice for detecting ranging markets (look for horizontal lines).
I have included 3 AMAs here:
- Kaufman's AMA. This makes use of Kaufman's Efficiency Ratio as the smoothing constant.
- Adaptive RSI. This adapts standard RSI to a smoothing constant.
- Tushar Chande's Variable Index Dynamic Average (VIDYA). This uses a pivotal smoothing constant, which is fixed, and varies the speed by using a factor based on the relative volatility to increase or decrease the value of SC.
For reference, I have plotted an EMA(10). This uses a fixed smoothing constant.
This is my 25th indicators post (Yayy!), so decided to include a bunch of AMAs. Enjoy :)
Feel free to "Make mine" and use these in your charts. Appreciate any comments / feedback.

RedK K-MACD : a MACD with some more musclesMoving Averages are probably the most commonly used analysis tools, and MACD is possibly the first charting indicator a trader gets to learn about.
MACD Basic concept
----------------------------
Without repeating all the tons of documentation about what MACD does, let's quickly re-visit the MACD concept from a 10-mile altitude (note we're keen on simplifying here rather than being technically accurate - so please forgive the use of any "common lingos")
- MACD goal is to represent the distance between 2 Moving Averages (MAs) - one fast and one slow, relatively - as an unrestricted zero-based oscillator.
- The value of the main MACD line is the distance, or the displacement between the 2 MA's
- usually a signal line is used (which is another MA of that distance value) to enable better visualization of the change (and rate of change, since this is all depicted on a time axis) of that displacement - this represents price momentum (price movement in the recent period versus movements for a relatively longer period).
- the difference between the main MACD line and its signal is then represented as a histogram above and below the zero line. in this case, that histogram is really redundant, since it shows a value that is already represented visually by the main line and its signal line.
How K-MACD is different
---------------------------------
K-MACD takes that simple concept of the classic MACD and expands around it - the idea is to use the same simple approach to representing price momentum while bringing in more insight to price moves in the short, medium and long terms, ability to represent more than 2 MA's and to enable better identification of tradeable patterns (like Volatility Contraction and others) - while still keeping things simple and visually clean.
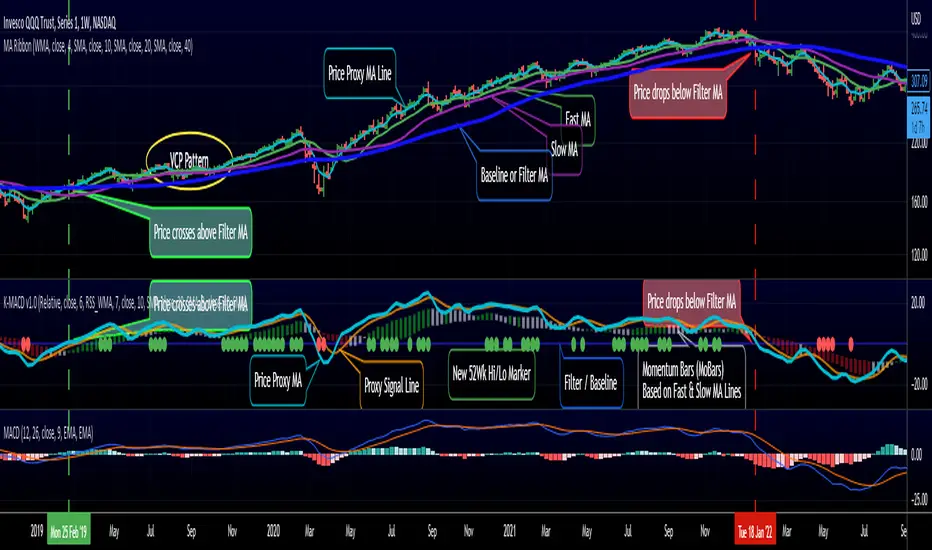
K-MACD is an indicator that allows us to view how price moves against 3 moving averages: a fast / slow pair, and a "market" Filter or Baseline (very long) that will be used as a flag for Bear/Bull market mode. Many traders and trading literature use the 200 day (40 week) SMA as that key filter
so in total, there are 4 MA lines in K-MACD (excluding the "orange" signal line):
* Price Proxy: Which is a very fast moving average that will represent the price itself - let's use a WMA(3) or something close to that here - there will be a signal line to enable better visualization of this similar to a classic MACD - that's the orange line
* Fast & Slow MA's : Use whatever represents the "medium term" momentum for your trading - Some traders use 20 and 50, others use 10 and 20 .. if on your price chart, you keep using a pair of MA's for this, use the same settings in K-MACD - these will be represented by the 3-color Momentum Bars that fluctuate above and below the baseline
* Filter/Baseline MA: Should be your long (Bullish/Bearish Mode) MA. so 100 or 200 or any other value you consider your market to be bearish below and bullish above. on K-MACD this is actually the blue zero line - everything else is "relative" to it
Review the sample chart which explains various elements and the "price chart" setup that K-MACD represents. With K-MACD you can clean up your chart from those various Moving Averages - or use a different set than the ones you already have K-MACD represent - or other indicators (like ATR channels..etc)
Other "muscles" in the K-MACD
---------------------------------------------
- Relative vs Classic Calculation Mode
A key issue with the classic MACD is that the displacement between the 2 moving averages is represented as "absolute or direct" values - as the price of the underlying increases with time, you can't really use these values to make useful comparison between the past and now (see below example) - also you can't use them to compare 2 different instruments.
- The "Relative" calculation option in K-MACD addresses that issue by relating all "distances" to the Baseline MA as percentage (above or below) - you can see this clear when you look at the above chart the far left versus the far right and compare K-MACD with the classic MACD - the Classic option is still available
- More MA "type" options for all MA lines: choose between SMA, EMA, WMA, and RSS_WMA (which i use a lot in my trading and is my default for the Price Proxy)
- More Alerts: a total or 9 alerts (in 3 groups) are available with K-MACD (Momentum above or below baseline, Price Proxy crossing signal line, and Price Proxy crossing baseline)
- New 52 week High / Low markers: These will show as Green/red circles on the zero line in K-MACD. this will only work for 1D timeframe and above, i'm just using a simple approach and would like to keep it that way.
- i know i added some more features not covered above :) -- if you have questions about any of the settings, feel free to ask below
Closing thoughts
-------------------------
K-MACD is a combination of couple of indicators i published in the past (xMACD and Mo_Bars) - so you can go back and read about them if needed - I then added improvements to accommodate ideas from swing trading literature and common practices that i plan to focus on in future. So K-MACD is really part of my own trading setup.
I assume here that most traders are familiar with what a MACD is - so kept this post short - if you thing we should expand more about the concepts covered here let me know in the comments - i can make some separate posts with examples and more details.
I hope many fellow traders find this work useful - and feel free let me know in comments below if you do.
Multi Moving Average Crossing (by Coinrule)Moving Averages are among the most common trading indicators. They are straightforward to interpret and effective to use.
One of the limitations of using moving averages is they can provide buy and sell signals with a relatively high lag , making it very difficult to spot the lows and tops of the trend.
Moving averages calculated with a low number of periods like the MA9 (the average of the previous nine price periods) react very fast to price moves providing prompt signals. On the other side, more signals may end up with more false-signals and more trades in a loss.
On the contrary, moving averages calculated with a higher number of periods like the MA100 (which considers the previous one hundred price periods) give more reliable signals, but with a delay.
A system catching the crossing of the MA50 over the MA100 is a good compromise for successful long-term strategies. It provides, on average, reliable buy signals.
The Multi Moving Average Crossing Strategy tries to optimize the exit without waiting for the same opposite crossing (MA50 below MA100). It uses the MA9 crossing below the MA50, instead, to spot a better time for selling.
The setup is as follows.
BUY when the Moving Average 50 crosses above the Moving Average 100
SELL when the Moving Average 9 crosses below the Moving Average 50
The higher is the time frame to calculate the Moving Averages, the better is the overall performance of the strategy. The 4-hour (or 6-hour) time frame seems to be the best, even if it results in fewer trades. If you want to trade more still with good results, the 1-hour time is a good compromise.
Advantages of the strategy
This strategy seeks to catch those that are more likely relevant uptrends and close the trade relatively quickly. More trades mean more opportunities. This is especially effective if you run the strategy on all the available coins on the market, as you could do with Coinrule.
Generally, a Multi Moving Averages approach beats the classic crossing strategy involving only two Moving Averages. We backtested a sample of twenty trading pairs to assess the benefits empirically.
The results show that the Multi Moving Average Strategy
outperforms 13 out of 20 times
has 95% higher average return
has 67% higher median return
The strategy assumes each order to trade 30% of the available capital and opens a trade at a time. A trading fee of 0.1% is taken into account.
